Pine Mountain Lake, CA Map & Demographics
Pine Mountain Lake Map
Pine Mountain Lake Overview
$45,237
PER CAPITA INCOME
$84,605
AVG FAMILY INCOME
$73,125
AVG HOUSEHOLD INCOME
25.8%
WAGE / INCOME GAP [ % ]
74.2¢/ $1
WAGE / INCOME GAP [ $ ]
0.42
INEQUALITY / GINI INDEX
3,038
TOTAL POPULATION
1,575
MALE POPULATION
1,463
FEMALE POPULATION
107.66
MALES / 100 FEMALES
92.89
FEMALES / 100 MALES
62.5
MEDIAN AGE
2.6
AVG FAMILY SIZE
2.1
AVG HOUSEHOLD SIZE
1,027
LABOR FORCE [ PEOPLE ]
38.5%
PERCENT IN LABOR FORCE
7.1%
UNEMPLOYMENT RATE
Income in Pine Mountain Lake
Income Overview in Pine Mountain Lake
Per Capita Income in Pine Mountain Lake is $45,237, while median incomes of families and households are $84,605 and $73,125 respectively.
| Characteristic | Number | Measure |
| Per Capita Income | 3,038 | $45,237 |
| Median Family Income | 898 | $84,605 |
| Mean Family Income | 898 | $112,175 |
| Median Household Income | 1,401 | $73,125 |
| Mean Household Income | 1,401 | $96,808 |
| Income Deficit | 898 | $0 |
| Wage / Income Gap (%) | 3,038 | 25.75% |
| Wage / Income Gap ($) | 3,038 | 74.25¢ per $1 |
| Gini / Inequality Index | 3,038 | 0.42 |
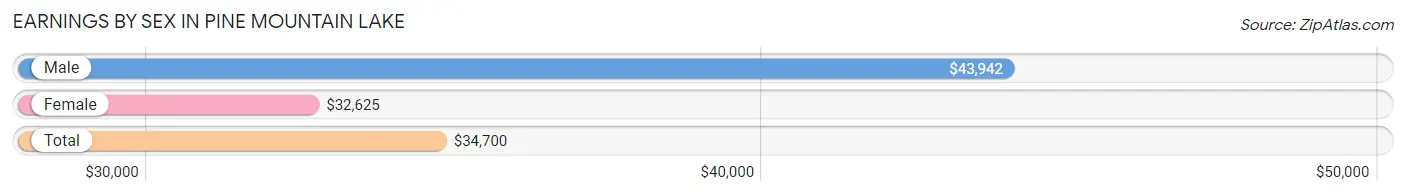
Earnings by Sex in Pine Mountain Lake
Average Earnings in Pine Mountain Lake are $34,700, $43,942 for men and $32,625 for women, a difference of 25.8%.
| Sex | Number | Average Earnings |
| Male | 689 (56.8%) | $43,942 |
| Female | 525 (43.2%) | $32,625 |
| Total | 1,214 (100.0%) | $34,700 |
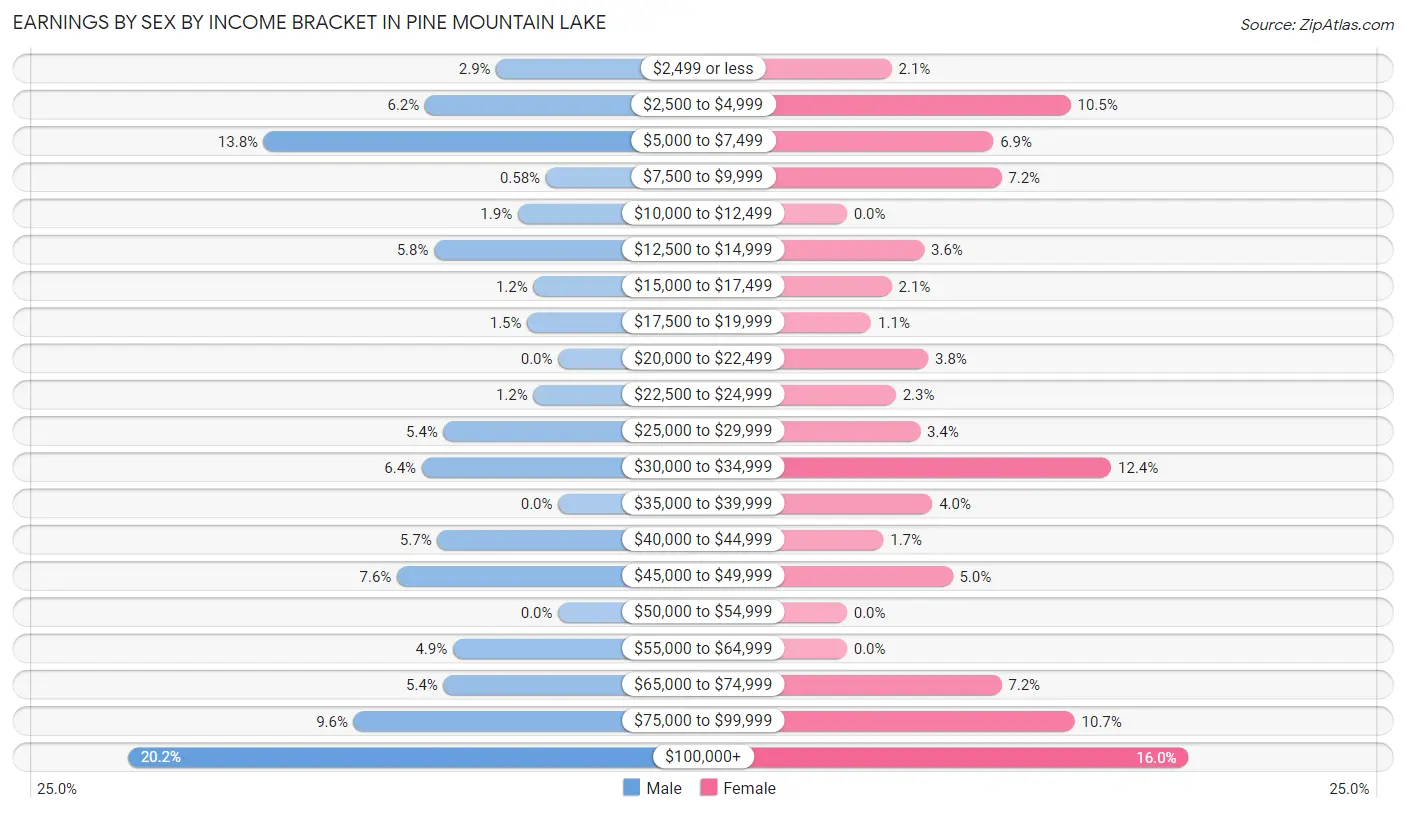
Earnings by Sex by Income Bracket in Pine Mountain Lake
The most common earnings brackets in Pine Mountain Lake are $100,000+ for men (139 | 20.2%) and $100,000+ for women (84 | 16.0%).
| Income | Male | Female |
| $2,499 or less | 20 (2.9%) | 11 (2.1%) |
| $2,500 to $4,999 | 43 (6.2%) | 55 (10.5%) |
| $5,000 to $7,499 | 95 (13.8%) | 36 (6.9%) |
| $7,500 to $9,999 | 4 (0.6%) | 38 (7.2%) |
| $10,000 to $12,499 | 13 (1.9%) | 0 (0.0%) |
| $12,500 to $14,999 | 40 (5.8%) | 19 (3.6%) |
| $15,000 to $17,499 | 8 (1.2%) | 11 (2.1%) |
| $17,500 to $19,999 | 10 (1.5%) | 6 (1.1%) |
| $20,000 to $22,499 | 0 (0.0%) | 20 (3.8%) |
| $22,500 to $24,999 | 8 (1.2%) | 12 (2.3%) |
| $25,000 to $29,999 | 37 (5.4%) | 18 (3.4%) |
| $30,000 to $34,999 | 44 (6.4%) | 65 (12.4%) |
| $35,000 to $39,999 | 0 (0.0%) | 21 (4.0%) |
| $40,000 to $44,999 | 39 (5.7%) | 9 (1.7%) |
| $45,000 to $49,999 | 52 (7.5%) | 26 (5.0%) |
| $50,000 to $54,999 | 0 (0.0%) | 0 (0.0%) |
| $55,000 to $64,999 | 34 (4.9%) | 0 (0.0%) |
| $65,000 to $74,999 | 37 (5.4%) | 38 (7.2%) |
| $75,000 to $99,999 | 66 (9.6%) | 56 (10.7%) |
| $100,000+ | 139 (20.2%) | 84 (16.0%) |
| Total | 689 (100.0%) | 525 (100.0%) |
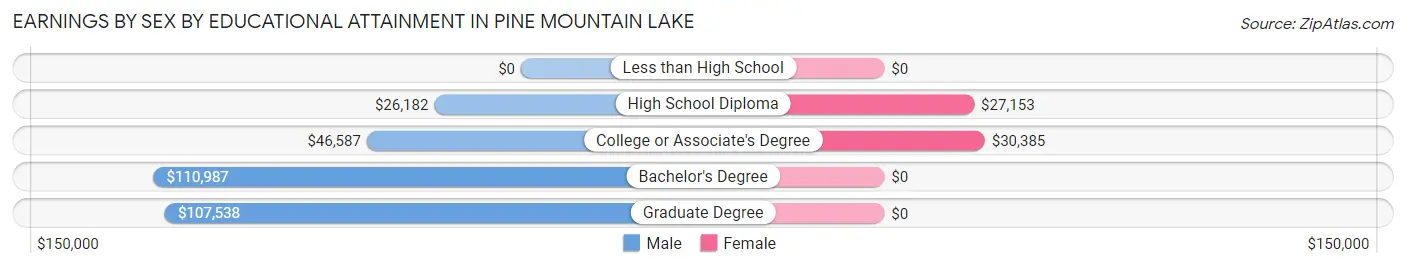
Earnings by Sex by Educational Attainment in Pine Mountain Lake
Average earnings in Pine Mountain Lake are $46,279 for men and $33,000 for women, a difference of 28.7%. Men with an educational attainment of bachelor's degree enjoy the highest average annual earnings of $110,987, while those with high school diploma education earn the least with $26,182. Women with an educational attainment of college or associate's degree earn the most with the average annual earnings of $30,385, while those with high school diploma education have the smallest earnings of $27,153.
| Educational Attainment | Male Income | Female Income |
| Less than High School | - | - |
| High School Diploma | $26,182 | $27,153 |
| College or Associate's Degree | $46,587 | $30,385 |
| Bachelor's Degree | $110,987 | $0 |
| Graduate Degree | $107,538 | $0 |
| Total | $46,279 | $33,000 |
Family Income in Pine Mountain Lake
Family Income Brackets in Pine Mountain Lake
According to the Pine Mountain Lake family income data, there are 185 families falling into the $100,000 to $149,999 income range, which is the most common income bracket and makes up 20.6% of all families. Conversely, the $10,000 to $14,999 income bracket is the least frequent group with only 4 families (0.4%) belonging to this category.
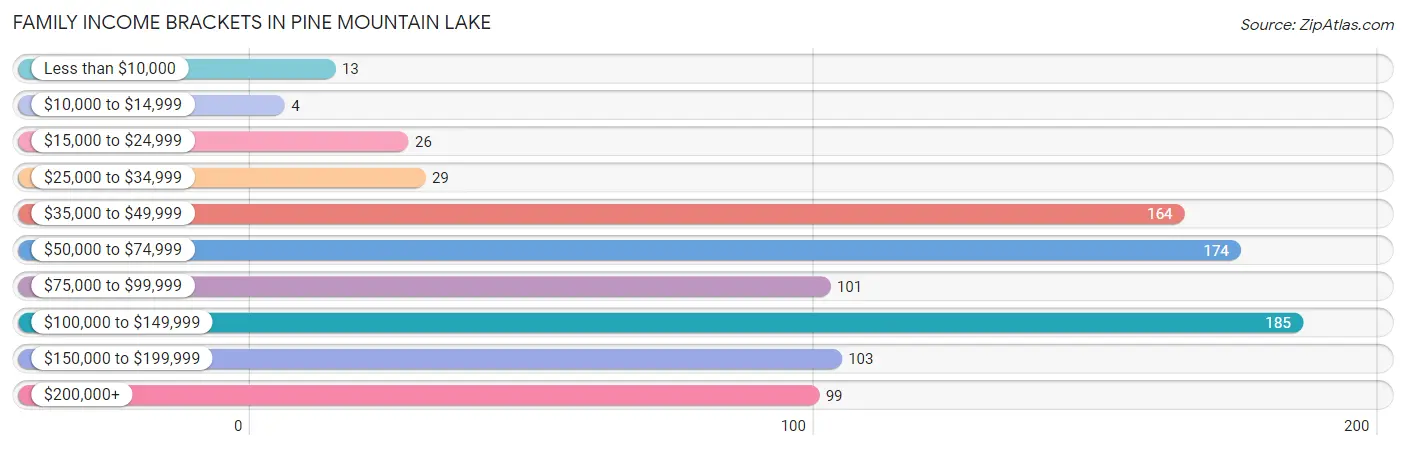
| Income Bracket | # Families | % Families |
| Less than $10,000 | 13 | 1.4% |
| $10,000 to $14,999 | 4 | 0.4% |
| $15,000 to $24,999 | 26 | 2.9% |
| $25,000 to $34,999 | 29 | 3.2% |
| $35,000 to $49,999 | 164 | 18.3% |
| $50,000 to $74,999 | 174 | 19.4% |
| $75,000 to $99,999 | 101 | 11.2% |
| $100,000 to $149,999 | 185 | 20.6% |
| $150,000 to $199,999 | 103 | 11.5% |
| $200,000+ | 99 | 11.0% |
Family Income by Famaliy Size in Pine Mountain Lake
2-person families (582 | 64.8%) account for the highest median family income in Pine Mountain Lake with $94,348 per family, while 2-person families (582 | 64.8%) have the highest median income of $47,174 per family member.
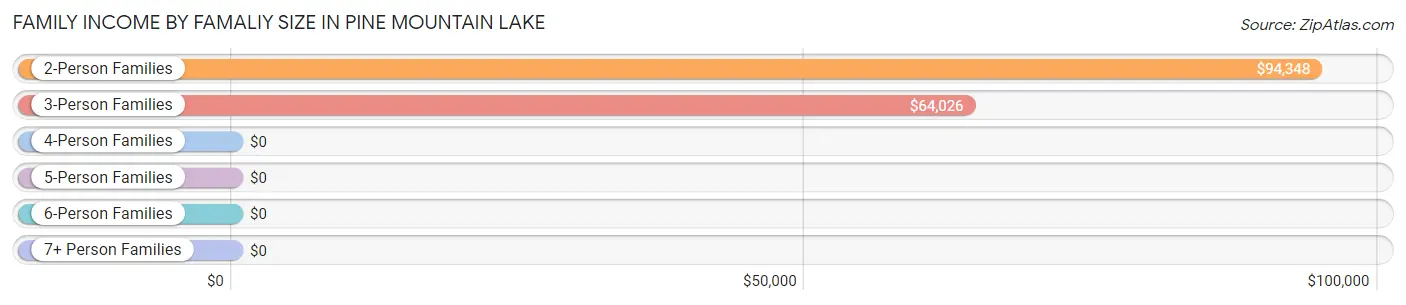
| Income Bracket | # Families | Median Income |
| 2-Person Families | 582 (64.8%) | $94,348 |
| 3-Person Families | 149 (16.6%) | $64,026 |
| 4-Person Families | 125 (13.9%) | $0 |
| 5-Person Families | 42 (4.7%) | $0 |
| 6-Person Families | 0 (0.0%) | $0 |
| 7+ Person Families | 0 (0.0%) | $0 |
| Total | 898 (100.0%) | $84,605 |
Family Income by Number of Earners in Pine Mountain Lake
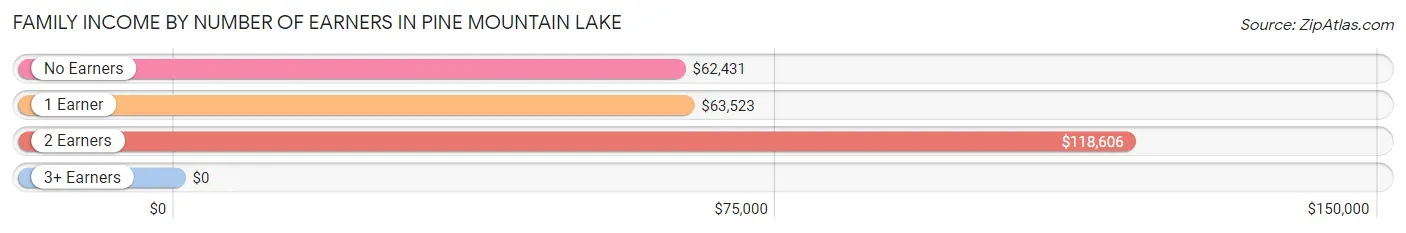
| Number of Earners | # Families | Median Income |
| No Earners | 329 (36.6%) | $62,431 |
| 1 Earner | 272 (30.3%) | $63,523 |
| 2 Earners | 289 (32.2%) | $118,606 |
| 3+ Earners | 8 (0.9%) | $0 |
| Total | 898 (100.0%) | $84,605 |
Household Income in Pine Mountain Lake
Household Income Brackets in Pine Mountain Lake
With 319 households falling in the category, the $100,000 to $149,999 income range is the most frequent in Pine Mountain Lake, accounting for 22.8% of all households. In contrast, only 4 households (0.3%) fall into the $10,000 to $14,999 income bracket, making it the least populous group.
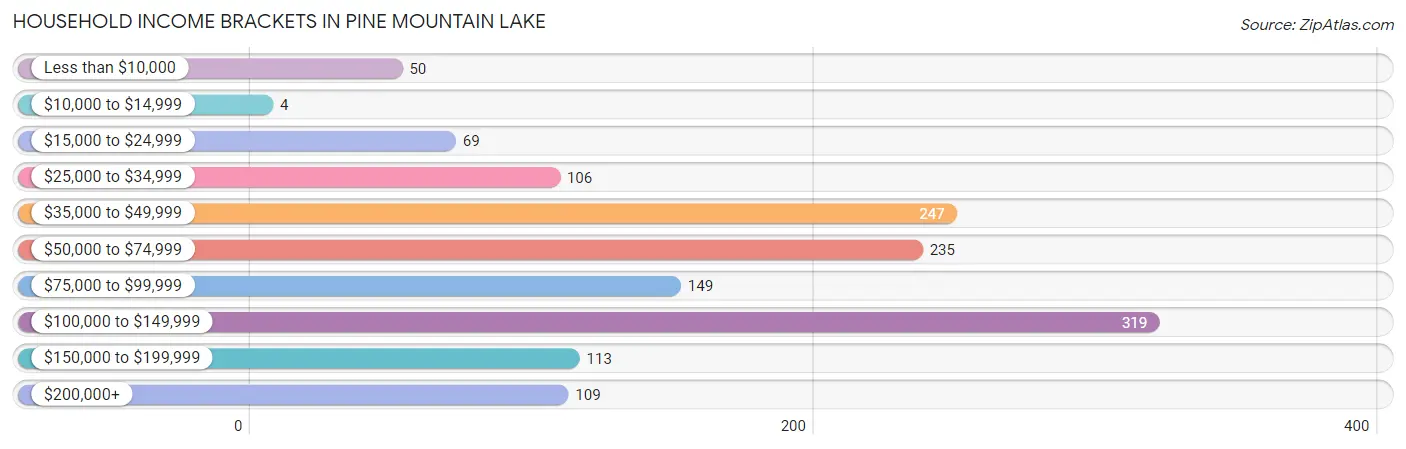
| Income Bracket | # Households | % Households |
| Less than $10,000 | 50 | 3.6% |
| $10,000 to $14,999 | 4 | 0.3% |
| $15,000 to $24,999 | 69 | 4.9% |
| $25,000 to $34,999 | 106 | 7.6% |
| $35,000 to $49,999 | 247 | 17.6% |
| $50,000 to $74,999 | 235 | 16.8% |
| $75,000 to $99,999 | 149 | 10.6% |
| $100,000 to $149,999 | 319 | 22.8% |
| $150,000 to $199,999 | 113 | 8.1% |
| $200,000+ | 109 | 7.8% |
Household Income by Householder Age in Pine Mountain Lake
The median household income in Pine Mountain Lake is $73,125, with the highest median household income of $133,289 found in the 25 to 44 years age bracket for the primary householder. A total of 182 households (13.0%) fall into this category.
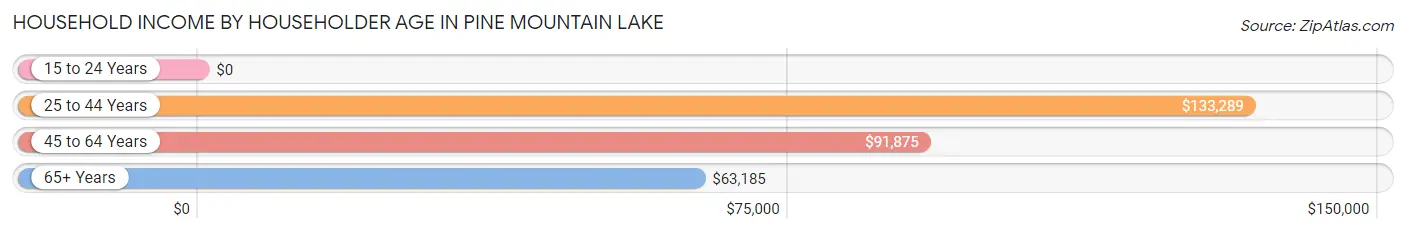
| Income Bracket | # Households | Median Income |
| 15 to 24 Years | 0 (0.0%) | $0 |
| 25 to 44 Years | 182 (13.0%) | $133,289 |
| 45 to 64 Years | 435 (31.0%) | $91,875 |
| 65+ Years | 784 (56.0%) | $63,185 |
| Total | 1,401 (100.0%) | $73,125 |
Poverty in Pine Mountain Lake
Income Below Poverty by Sex and Age in Pine Mountain Lake
With 7.9% poverty level for males and 4.0% for females among the residents of Pine Mountain Lake, 45 to 54 year old males and 18 to 24 year old females are the most vulnerable to poverty, with 60 males (30.3%) and 9 females (100.0%) in their respective age groups living below the poverty level.
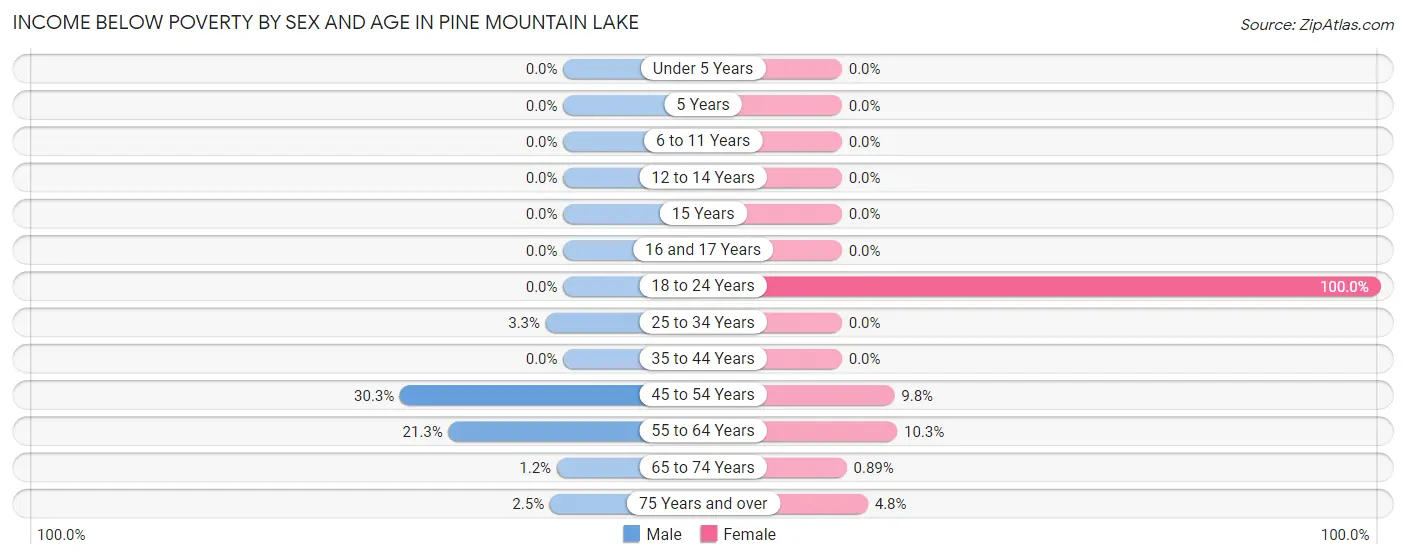
| Age Bracket | Male | Female |
| Under 5 Years | 0 (0.0%) | 0 (0.0%) |
| 5 Years | 0 (0.0%) | 0 (0.0%) |
| 6 to 11 Years | 0 (0.0%) | 0 (0.0%) |
| 12 to 14 Years | 0 (0.0%) | 0 (0.0%) |
| 15 Years | 0 (0.0%) | 0 (0.0%) |
| 16 and 17 Years | 0 (0.0%) | 0 (0.0%) |
| 18 to 24 Years | 0 (0.0%) | 9 (100.0%) |
| 25 to 34 Years | 4 (3.3%) | 0 (0.0%) |
| 35 to 44 Years | 0 (0.0%) | 0 (0.0%) |
| 45 to 54 Years | 60 (30.3%) | 8 (9.8%) |
| 55 to 64 Years | 49 (21.3%) | 25 (10.2%) |
| 65 to 74 Years | 4 (1.2%) | 4 (0.9%) |
| 75 Years and over | 7 (2.5%) | 12 (4.8%) |
| Total | 124 (7.9%) | 58 (4.0%) |
Income Above Poverty by Sex and Age in Pine Mountain Lake
According to the poverty statistics in Pine Mountain Lake, males aged under 5 years and females aged under 5 years are the age groups that are most secure financially, with 100.0% of males and 100.0% of females in these age groups living above the poverty line.
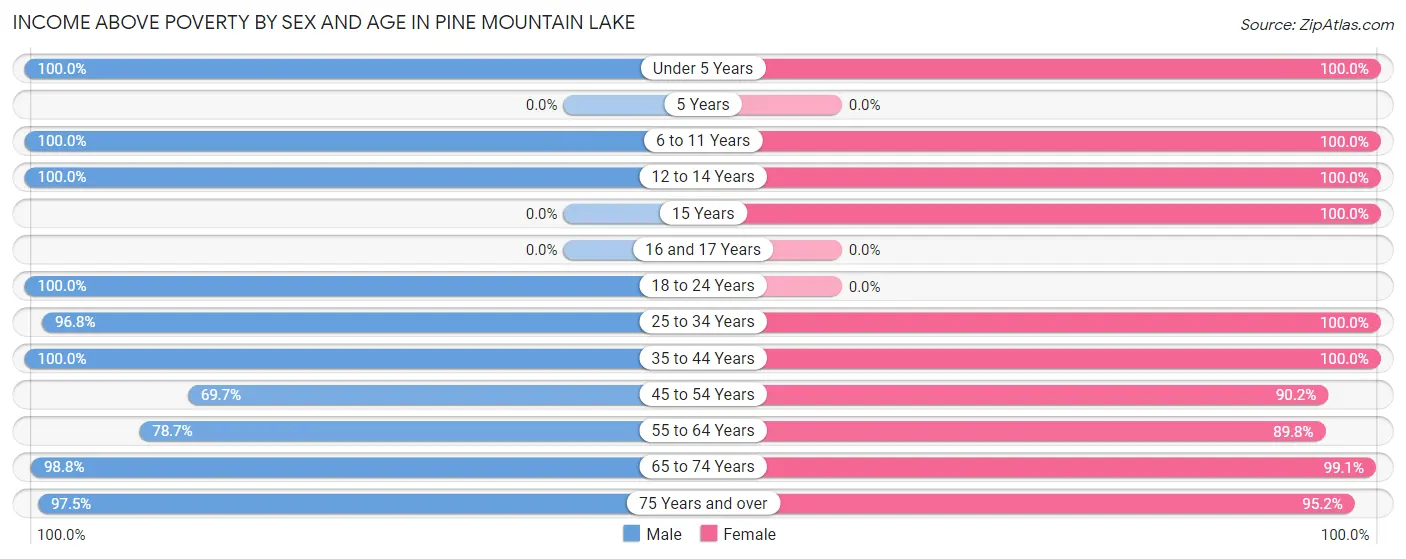
| Age Bracket | Male | Female |
| Under 5 Years | 73 (100.0%) | 48 (100.0%) |
| 5 Years | 0 (0.0%) | 0 (0.0%) |
| 6 to 11 Years | 82 (100.0%) | 127 (100.0%) |
| 12 to 14 Years | 6 (100.0%) | 15 (100.0%) |
| 15 Years | 0 (0.0%) | 19 (100.0%) |
| 16 and 17 Years | 0 (0.0%) | 0 (0.0%) |
| 18 to 24 Years | 95 (100.0%) | 0 (0.0%) |
| 25 to 34 Years | 119 (96.8%) | 77 (100.0%) |
| 35 to 44 Years | 150 (100.0%) | 144 (100.0%) |
| 45 to 54 Years | 138 (69.7%) | 74 (90.2%) |
| 55 to 64 Years | 181 (78.7%) | 219 (89.7%) |
| 65 to 74 Years | 332 (98.8%) | 445 (99.1%) |
| 75 Years and over | 275 (97.5%) | 237 (95.2%) |
| Total | 1,451 (92.1%) | 1,405 (96.0%) |
Income Below Poverty Among Married-Couple Families in Pine Mountain Lake
The poverty statistics for married-couple families in Pine Mountain Lake show that 3.9% or 26 of the total 669 families live below the poverty line. Families with no children have the highest poverty rate of 5.0%, comprising of 26 families. On the other hand, families with 1 or 2 children have the lowest poverty rate of 0.0%, which includes 0 families.
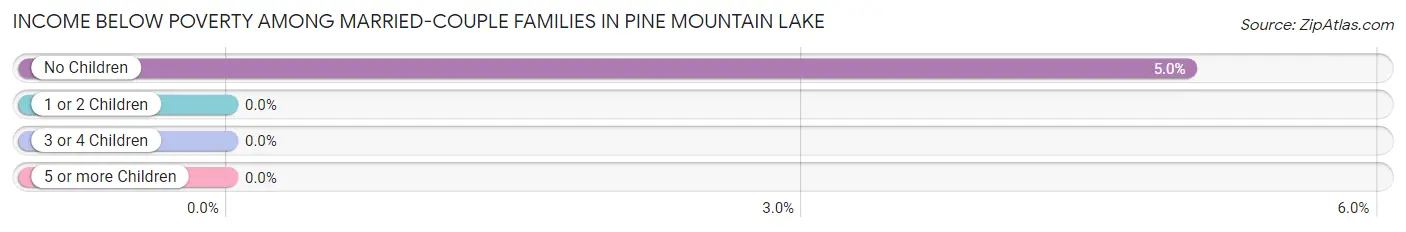
| Children | Above Poverty | Below Poverty |
| No Children | 493 (95.0%) | 26 (5.0%) |
| 1 or 2 Children | 108 (100.0%) | 0 (0.0%) |
| 3 or 4 Children | 42 (100.0%) | 0 (0.0%) |
| 5 or more Children | 0 (0.0%) | 0 (0.0%) |
| Total | 643 (96.1%) | 26 (3.9%) |
Income Below Poverty Among Single-Parent Households in Pine Mountain Lake
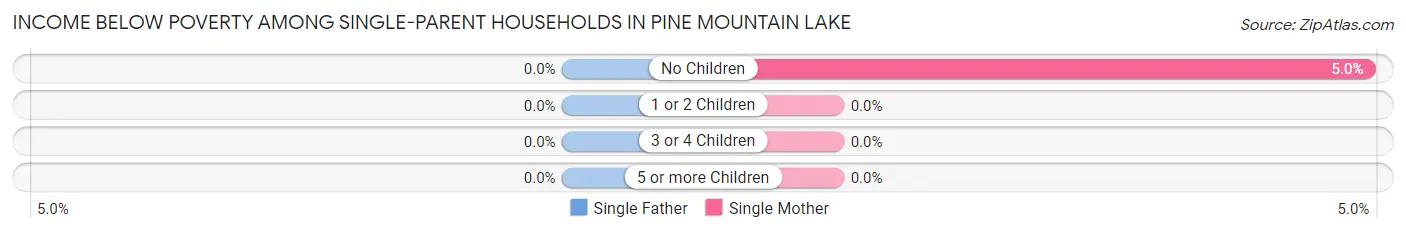
| Children | Single Father | Single Mother |
| No Children | 0 (0.0%) | 5 (5.0%) |
| 1 or 2 Children | 0 (0.0%) | 0 (0.0%) |
| 3 or 4 Children | 0 (0.0%) | 0 (0.0%) |
| 5 or more Children | 0 (0.0%) | 0 (0.0%) |
| Total | 0 (0.0%) | 5 (4.2%) |
Income Below Poverty Among Married-Couple vs Single-Parent Households in Pine Mountain Lake
The poverty data for Pine Mountain Lake shows that 26 of the married-couple family households (3.9%) and 5 of the single-parent households (2.2%) are living below the poverty level. Within the married-couple family households, those with no children have the highest poverty rate, with 26 households (5.0%) falling below the poverty line. Among the single-parent households, those with no children have the highest poverty rate, with 5 household (2.4%) living below poverty.
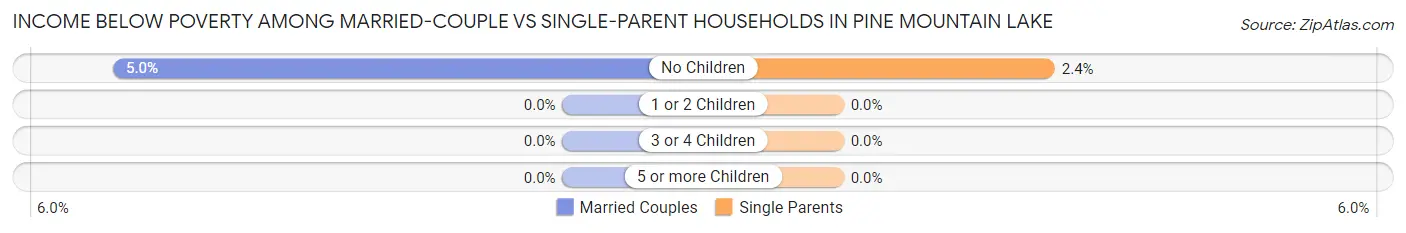
| Children | Married-Couple Families | Single-Parent Households |
| No Children | 26 (5.0%) | 5 (2.4%) |
| 1 or 2 Children | 0 (0.0%) | 0 (0.0%) |
| 3 or 4 Children | 0 (0.0%) | 0 (0.0%) |
| 5 or more Children | 0 (0.0%) | 0 (0.0%) |
| Total | 26 (3.9%) | 5 (2.2%) |
Race in Pine Mountain Lake
The most populous races in Pine Mountain Lake are White / Caucasian (2,595 | 85.4%), Some other Race (209 | 6.9%), and Hispanic or Latino (206 | 6.8%).
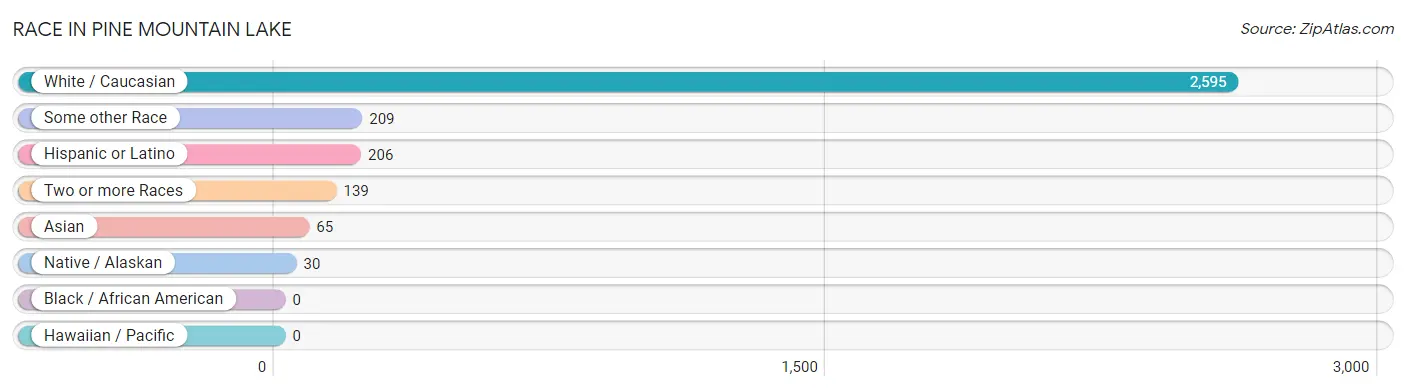
| Race | # Population | % Population |
| Asian | 65 | 2.1% |
| Black / African American | 0 | 0.0% |
| Hawaiian / Pacific | 0 | 0.0% |
| Hispanic or Latino | 206 | 6.8% |
| Native / Alaskan | 30 | 1.0% |
| White / Caucasian | 2,595 | 85.4% |
| Two or more Races | 139 | 4.6% |
| Some other Race | 209 | 6.9% |
| Total | 3,038 | 100.0% |
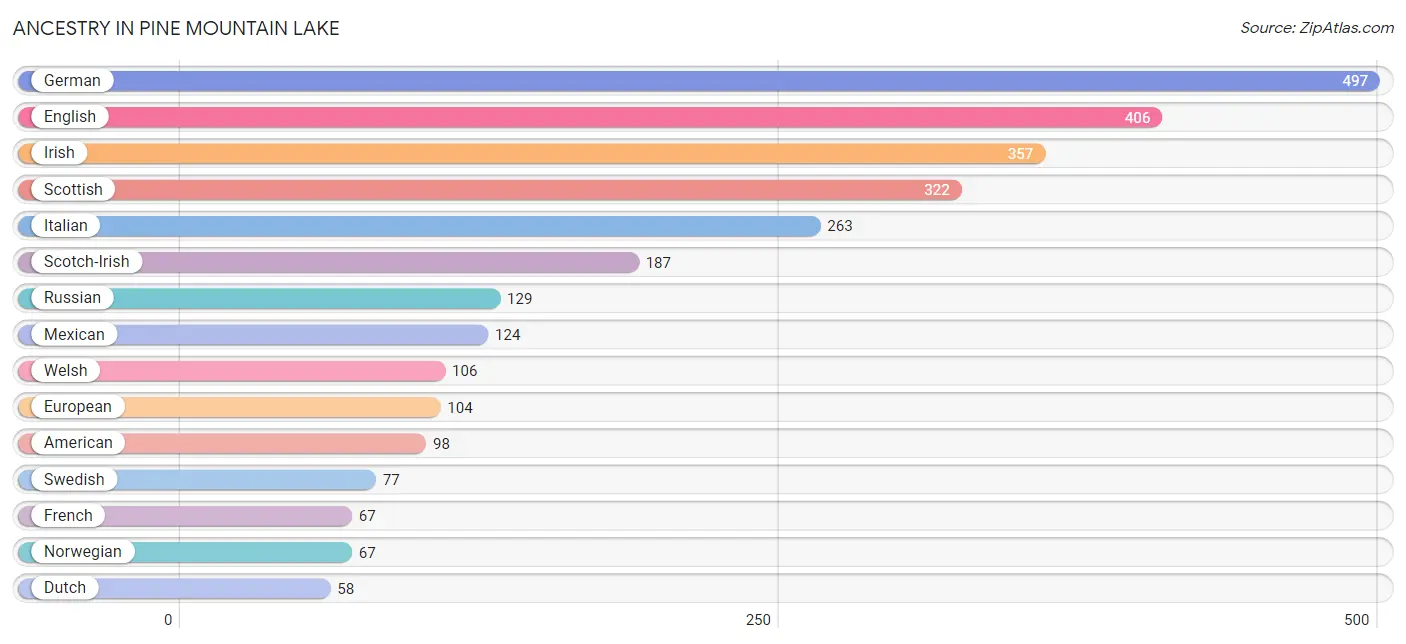
Ancestry in Pine Mountain Lake
The most populous ancestries reported in Pine Mountain Lake are German (497 | 16.4%), English (406 | 13.4%), Irish (357 | 11.7%), Scottish (322 | 10.6%), and Italian (263 | 8.7%), together accounting for 60.7% of all Pine Mountain Lake residents.
| Ancestry | # Population | % Population |
| American | 98 | 3.2% |
| Australian | 33 | 1.1% |
| Austrian | 31 | 1.0% |
| Bhutanese | 15 | 0.5% |
| British | 8 | 0.3% |
| Burmese | 25 | 0.8% |
| Central American | 39 | 1.3% |
| Croatian | 14 | 0.5% |
| Czech | 8 | 0.3% |
| Danish | 39 | 1.3% |
| Dutch | 58 | 1.9% |
| Eastern European | 10 | 0.3% |
| English | 406 | 13.4% |
| European | 104 | 3.4% |
| Finnish | 43 | 1.4% |
| French | 67 | 2.2% |
| French Canadian | 10 | 0.3% |
| German | 497 | 16.4% |
| Greek | 17 | 0.6% |
| Hungarian | 11 | 0.4% |
| Indian (Asian) | 55 | 1.8% |
| Irish | 357 | 11.7% |
| Italian | 263 | 8.7% |
| Korean | 15 | 0.5% |
| Mexican | 124 | 4.1% |
| Northern European | 16 | 0.5% |
| Norwegian | 67 | 2.2% |
| Pakistani | 4 | 0.1% |
| Polish | 42 | 1.4% |
| Portuguese | 42 | 1.4% |
| Puerto Rican | 23 | 0.8% |
| Russian | 129 | 4.3% |
| Salvadoran | 39 | 1.3% |
| Scandinavian | 47 | 1.5% |
| Scotch-Irish | 187 | 6.2% |
| Scottish | 322 | 10.6% |
| Serbian | 4 | 0.1% |
| Slovak | 7 | 0.2% |
| Spaniard | 20 | 0.7% |
| Swedish | 77 | 2.5% |
| Swiss | 15 | 0.5% |
| Ukrainian | 9 | 0.3% |
| Welsh | 106 | 3.5% | View All 43 Rows |
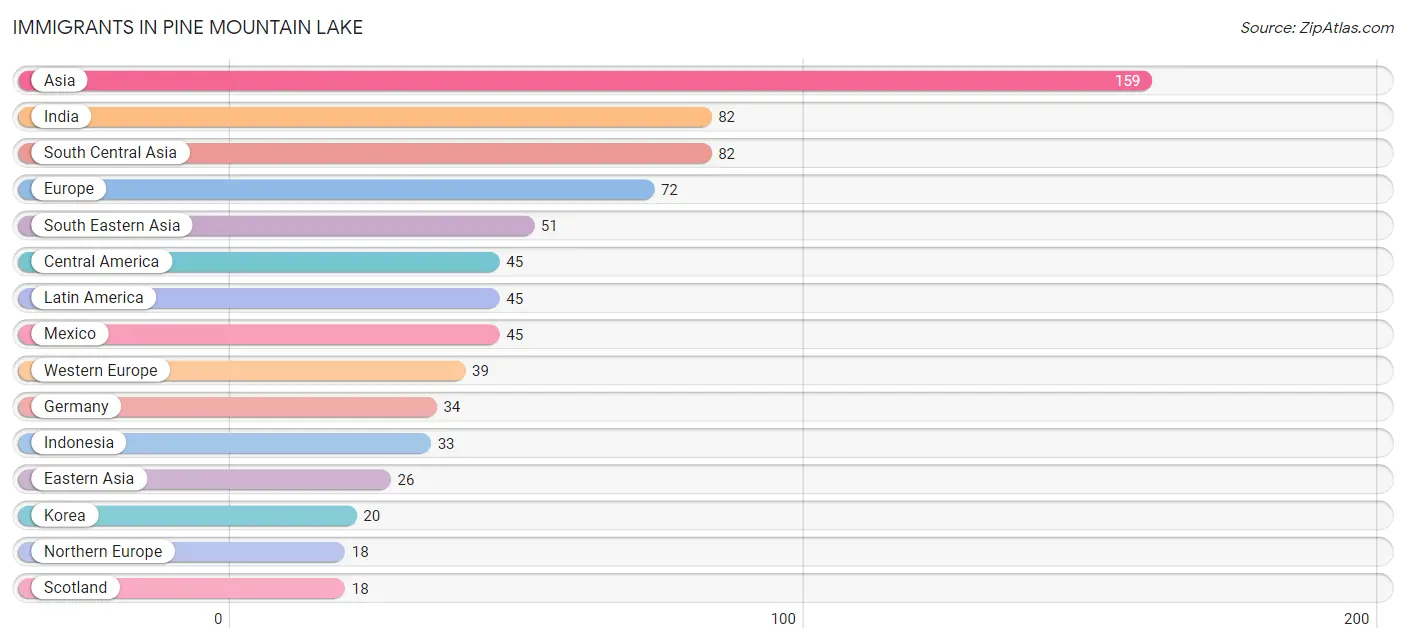
Immigrants in Pine Mountain Lake
The most numerous immigrant groups reported in Pine Mountain Lake came from Asia (159 | 5.2%), India (82 | 2.7%), South Central Asia (82 | 2.7%), Europe (72 | 2.4%), and South Eastern Asia (51 | 1.7%), together accounting for 14.7% of all Pine Mountain Lake residents.
| Immigration Origin | # Population | % Population |
| Asia | 159 | 5.2% |
| Canada | 11 | 0.4% |
| Central America | 45 | 1.5% |
| Eastern Asia | 26 | 0.9% |
| Eastern Europe | 15 | 0.5% |
| Europe | 72 | 2.4% |
| France | 5 | 0.2% |
| Germany | 34 | 1.1% |
| India | 82 | 2.7% |
| Indonesia | 33 | 1.1% |
| Japan | 6 | 0.2% |
| Korea | 20 | 0.7% |
| Latin America | 45 | 1.5% |
| Mexico | 45 | 1.5% |
| Northern Europe | 18 | 0.6% |
| Philippines | 14 | 0.5% |
| Romania | 5 | 0.2% |
| Russia | 10 | 0.3% |
| Scotland | 18 | 0.6% |
| South Central Asia | 82 | 2.7% |
| South Eastern Asia | 51 | 1.7% |
| Thailand | 4 | 0.1% |
| Western Europe | 39 | 1.3% | View All 23 Rows |
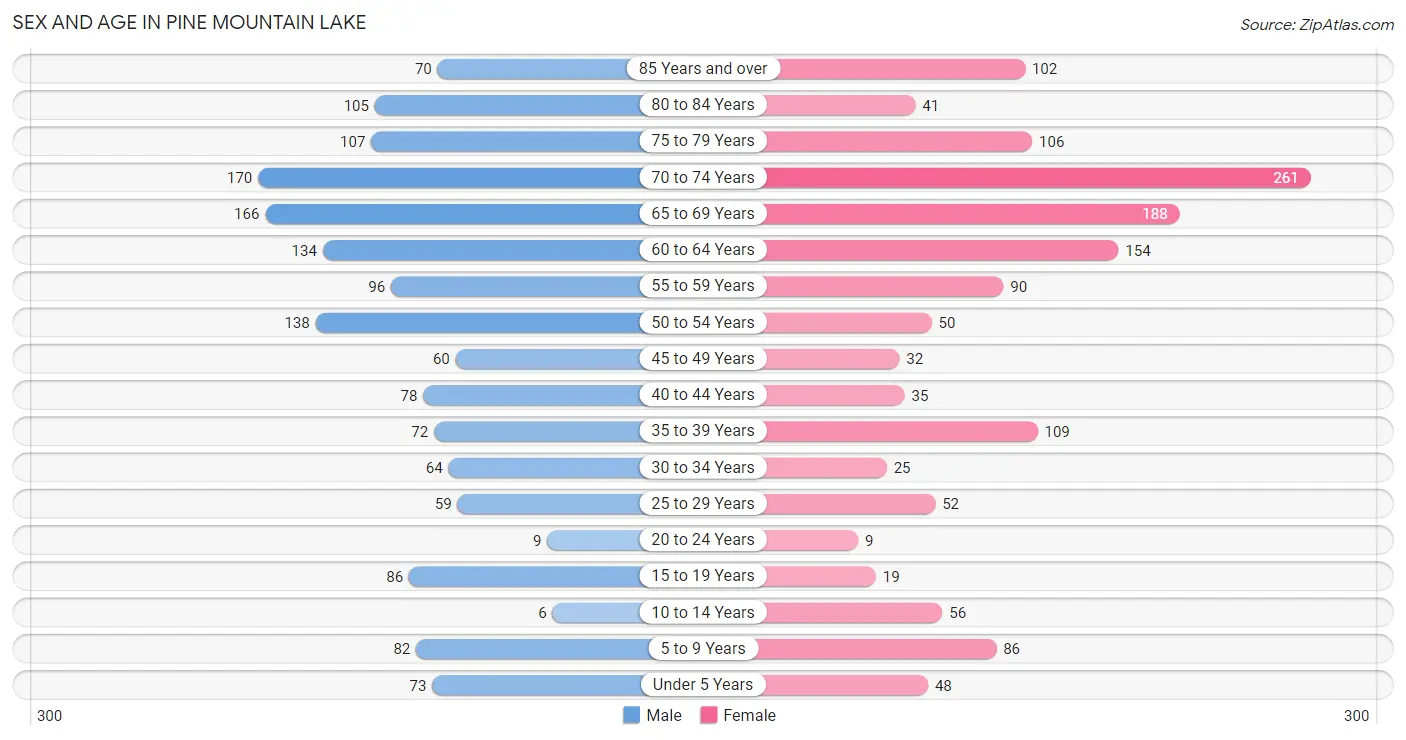
Sex and Age in Pine Mountain Lake
Sex and Age in Pine Mountain Lake
The most populous age groups in Pine Mountain Lake are 70 to 74 Years (170 | 10.8%) for men and 70 to 74 Years (261 | 17.8%) for women.
| Age Bracket | Male | Female |
| Under 5 Years | 73 (4.6%) | 48 (3.3%) |
| 5 to 9 Years | 82 (5.2%) | 86 (5.9%) |
| 10 to 14 Years | 6 (0.4%) | 56 (3.8%) |
| 15 to 19 Years | 86 (5.5%) | 19 (1.3%) |
| 20 to 24 Years | 9 (0.6%) | 9 (0.6%) |
| 25 to 29 Years | 59 (3.7%) | 52 (3.5%) |
| 30 to 34 Years | 64 (4.1%) | 25 (1.7%) |
| 35 to 39 Years | 72 (4.6%) | 109 (7.4%) |
| 40 to 44 Years | 78 (5.0%) | 35 (2.4%) |
| 45 to 49 Years | 60 (3.8%) | 32 (2.2%) |
| 50 to 54 Years | 138 (8.8%) | 50 (3.4%) |
| 55 to 59 Years | 96 (6.1%) | 90 (6.1%) |
| 60 to 64 Years | 134 (8.5%) | 154 (10.5%) |
| 65 to 69 Years | 166 (10.5%) | 188 (12.9%) |
| 70 to 74 Years | 170 (10.8%) | 261 (17.8%) |
| 75 to 79 Years | 107 (6.8%) | 106 (7.2%) |
| 80 to 84 Years | 105 (6.7%) | 41 (2.8%) |
| 85 Years and over | 70 (4.4%) | 102 (7.0%) |
| Total | 1,575 (100.0%) | 1,463 (100.0%) |
Families and Households in Pine Mountain Lake
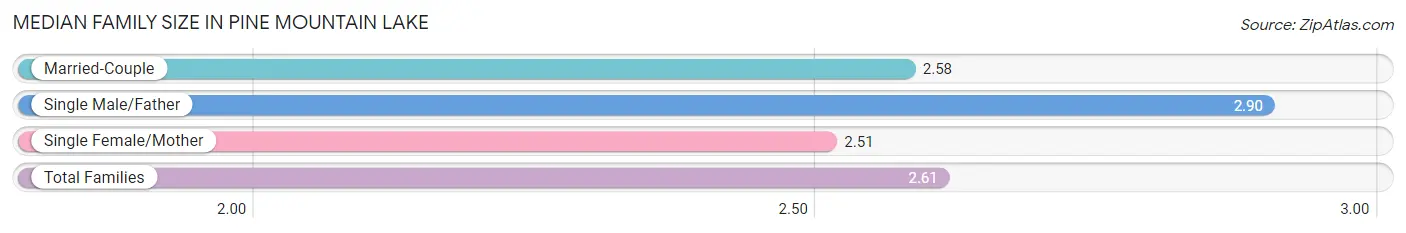
Median Family Size in Pine Mountain Lake
The median family size in Pine Mountain Lake is 2.61 persons per family, with single male/father families (111 | 12.4%) accounting for the largest median family size of 2.9 persons per family. On the other hand, single female/mother families (118 | 13.1%) represent the smallest median family size with 2.51 persons per family.
| Family Type | # Families | Family Size |
| Married-Couple | 669 (74.5%) | 2.58 |
| Single Male/Father | 111 (12.4%) | 2.90 |
| Single Female/Mother | 118 (13.1%) | 2.51 |
| Total Families | 898 (100.0%) | 2.61 |
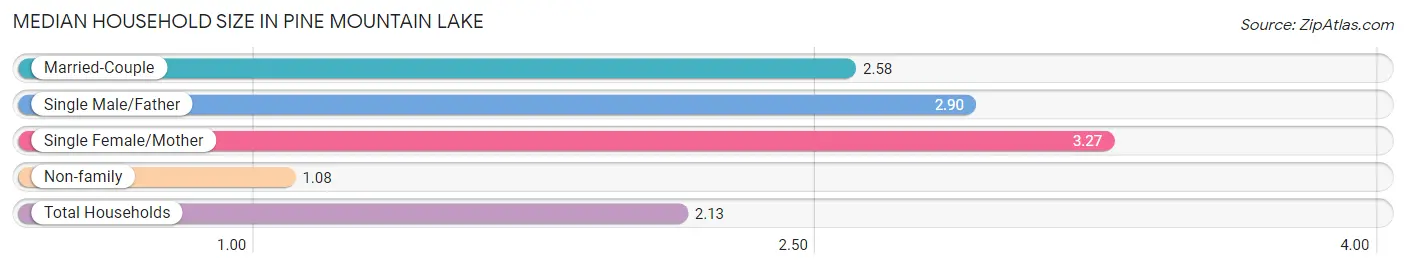
Median Household Size in Pine Mountain Lake
The median household size in Pine Mountain Lake is 2.13 persons per household, with single female/mother households (118 | 8.4%) accounting for the largest median household size of 3.27 persons per household. non-family households (503 | 35.9%) represent the smallest median household size with 1.08 persons per household.
| Household Type | # Households | Household Size |
| Married-Couple | 669 (47.7%) | 2.58 |
| Single Male/Father | 111 (7.9%) | 2.90 |
| Single Female/Mother | 118 (8.4%) | 3.27 |
| Non-family | 503 (35.9%) | 1.08 |
| Total Households | 1,401 (100.0%) | 2.13 |
Household Size by Marriage Status in Pine Mountain Lake
Out of a total of 1,401 households in Pine Mountain Lake, 898 (64.1%) are family households, while 503 (35.9%) are nonfamily households. The most numerous type of family households are 2-person households, comprising 582, and the most common type of nonfamily households are 1-person households, comprising 458.
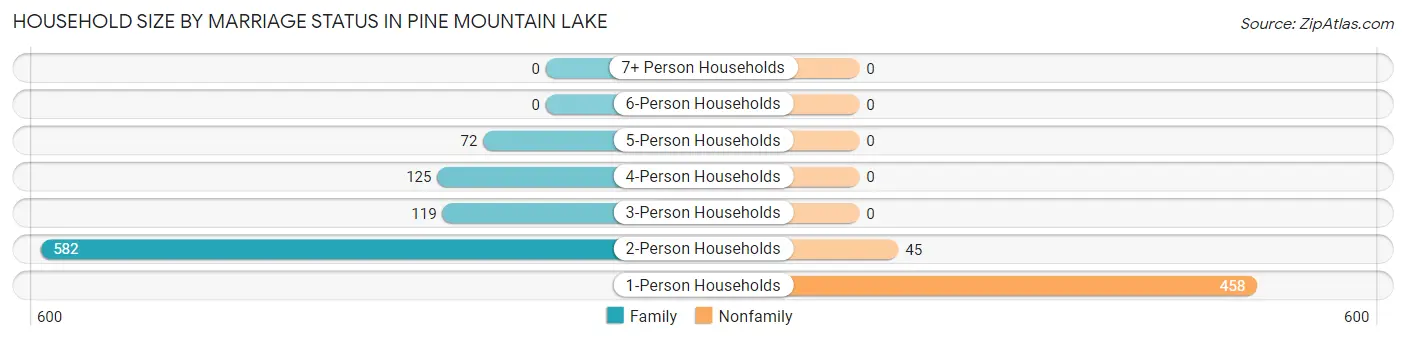
| Household Size | Family Households | Nonfamily Households |
| 1-Person Households | - | 458 (32.7%) |
| 2-Person Households | 582 (41.5%) | 45 (3.2%) |
| 3-Person Households | 119 (8.5%) | 0 (0.0%) |
| 4-Person Households | 125 (8.9%) | 0 (0.0%) |
| 5-Person Households | 72 (5.1%) | 0 (0.0%) |
| 6-Person Households | 0 (0.0%) | 0 (0.0%) |
| 7+ Person Households | 0 (0.0%) | 0 (0.0%) |
| Total | 898 (64.1%) | 503 (35.9%) |
Female Fertility in Pine Mountain Lake
Fertility by Age in Pine Mountain Lake
Average fertility rate in Pine Mountain Lake is 17.0 births per 1,000 women. Women in the age bracket of 20 to 34 years have the highest fertility rate with 58.0 births per 1,000 women. Women in the age bracket of 20 to 34 years acount for 100.0% of all women with births.
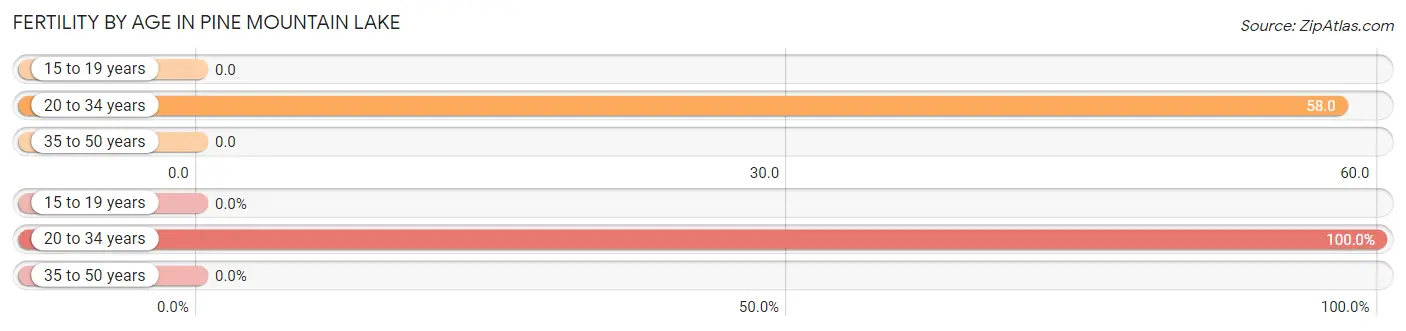
| Age Bracket | Women with Births | Births / 1,000 Women |
| 15 to 19 years | 0 (0.0%) | 0.0 |
| 20 to 34 years | 5 (100.0%) | 58.0 |
| 35 to 50 years | 0 (0.0%) | 0.0 |
| Total | 5 (100.0%) | 17.0 |
Fertility by Age by Marriage Status in Pine Mountain Lake
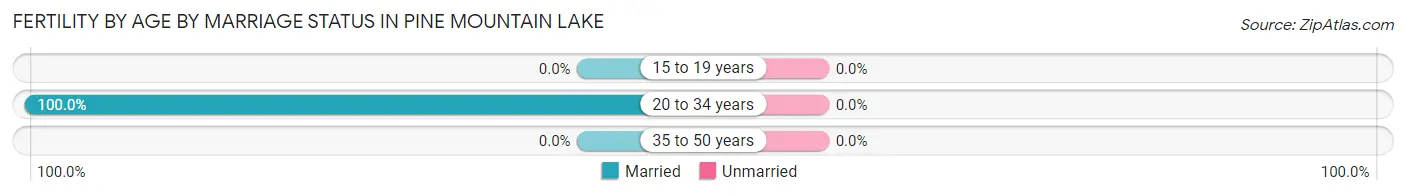
| Age Bracket | Married | Unmarried |
| 15 to 19 years | 0 (0.0%) | 0 (0.0%) |
| 20 to 34 years | 5 (100.0%) | 0 (0.0%) |
| 35 to 50 years | 0 (0.0%) | 0 (0.0%) |
| Total | 5 (100.0%) | 0 (0.0%) |
Fertility by Education in Pine Mountain Lake
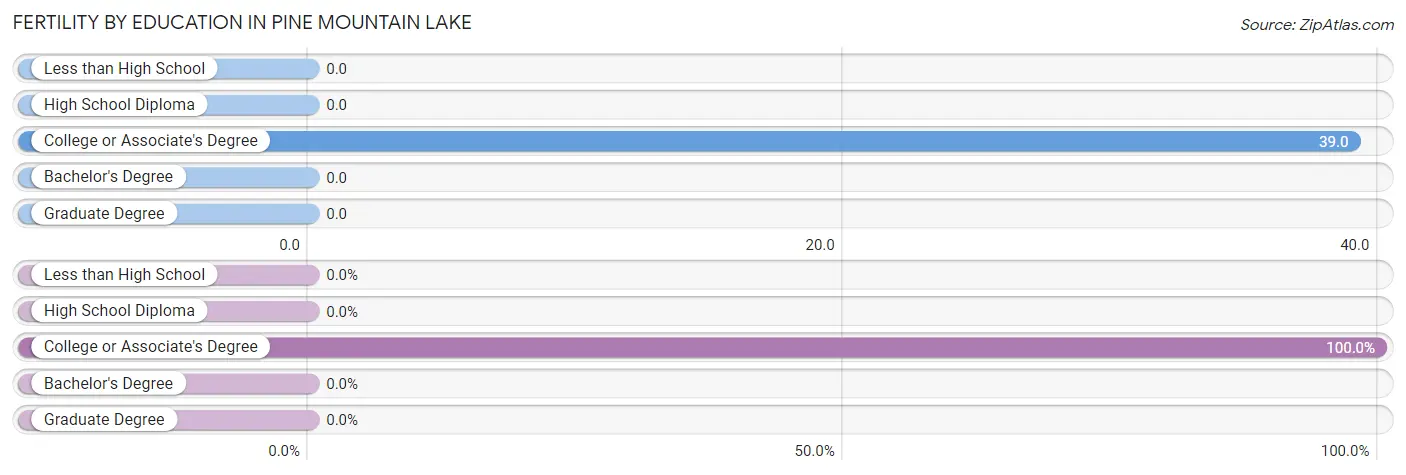
| Educational Attainment | Women with Births | Births / 1,000 Women |
| Less than High School | 0 (0.0%) | 0.0 |
| High School Diploma | 0 (0.0%) | 0.0 |
| College or Associate's Degree | 5 (100.0%) | 39.0 |
| Bachelor's Degree | 0 (0.0%) | 0.0 |
| Graduate Degree | 0 (0.0%) | 0.0 |
| Total | 5 (100.0%) | 17.0 |
Fertility by Education by Marriage Status in Pine Mountain Lake
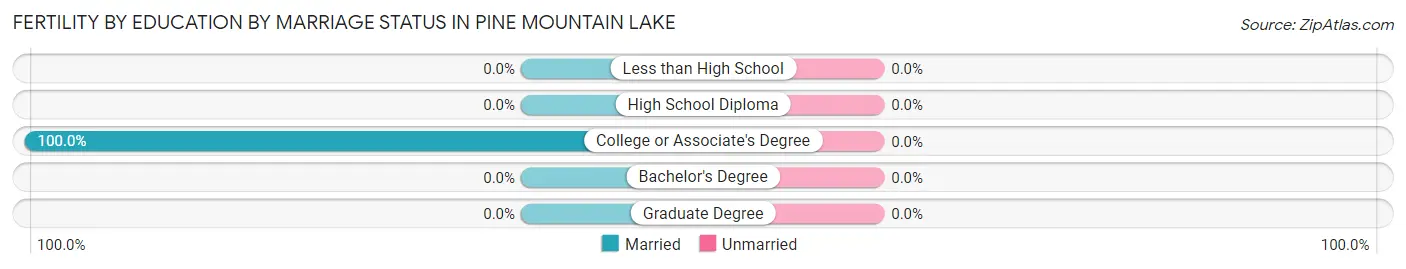
| Educational Attainment | Married | Unmarried |
| Less than High School | 0 (0.0%) | 0 (0.0%) |
| High School Diploma | 0 (0.0%) | 0 (0.0%) |
| College or Associate's Degree | 5 (100.0%) | 0 (0.0%) |
| Bachelor's Degree | 0 (0.0%) | 0 (0.0%) |
| Graduate Degree | 0 (0.0%) | 0 (0.0%) |
| Total | 5 (100.0%) | 0 (0.0%) |
Employment Characteristics in Pine Mountain Lake
Employment by Class of Employer in Pine Mountain Lake
Among the 892 employed individuals in Pine Mountain Lake, private company employees (475 | 53.2%), self-employed (not incorporated) (142 | 15.9%), and self-employed (incorporated) (84 | 9.4%) make up the most common classes of employment.
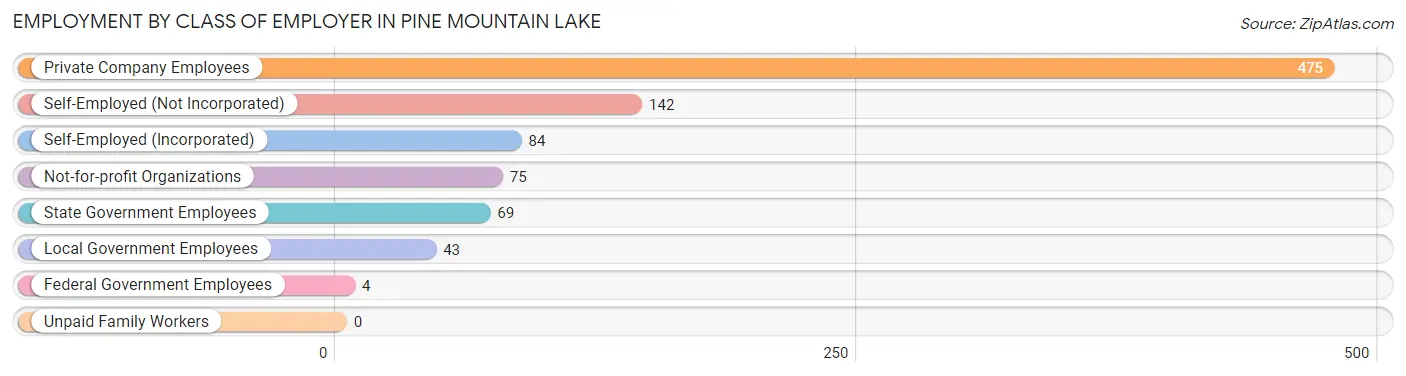
| Employer Class | # Employees | % Employees |
| Private Company Employees | 475 | 53.2% |
| Self-Employed (Incorporated) | 84 | 9.4% |
| Self-Employed (Not Incorporated) | 142 | 15.9% |
| Not-for-profit Organizations | 75 | 8.4% |
| Local Government Employees | 43 | 4.8% |
| State Government Employees | 69 | 7.7% |
| Federal Government Employees | 4 | 0.4% |
| Unpaid Family Workers | 0 | 0.0% |
| Total | 892 | 100.0% |
Employment Status by Age in Pine Mountain Lake
According to the labor force statistics for Pine Mountain Lake, out of the total population over 16 years of age (2,668), 38.5% or 1,027 individuals are in the labor force, with 7.1% or 73 of them unemployed. The age group with the highest labor force participation rate is 20 to 24 years, with 100.0% or 18 individuals in the labor force. Within the labor force, the 55 to 59 years age range has the highest percentage of unemployed individuals, with 29.6% or 50 of them being unemployed.
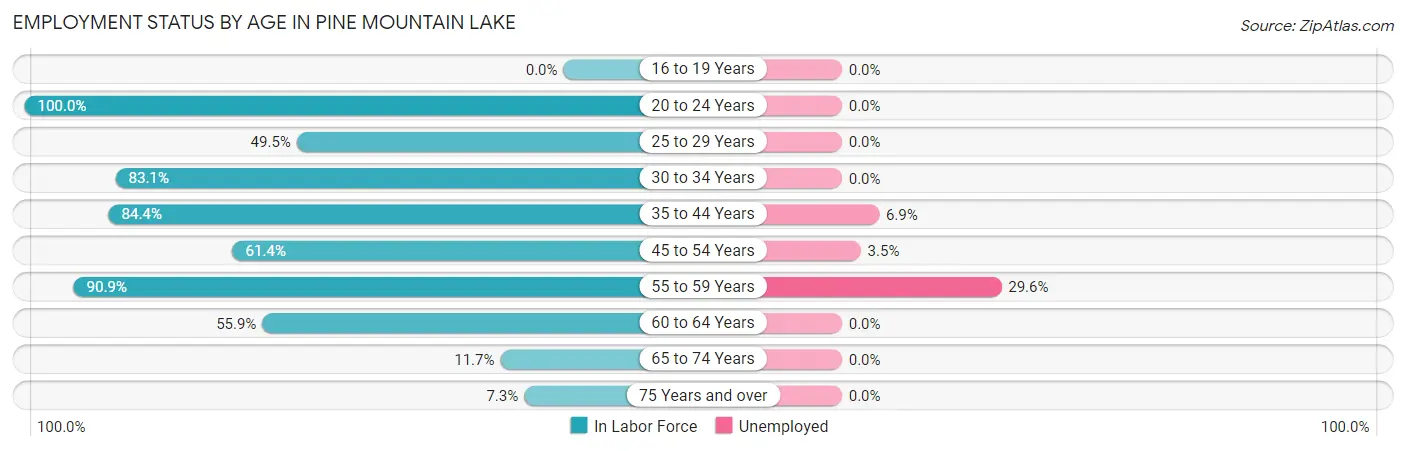
| Age Bracket | In Labor Force | Unemployed |
| 16 to 19 Years | 0 (0.0%) | 0 (0.0%) |
| 20 to 24 Years | 18 (100.0%) | 0 (0.0%) |
| 25 to 29 Years | 55 (49.5%) | 0 (0.0%) |
| 30 to 34 Years | 74 (83.1%) | 0 (0.0%) |
| 35 to 44 Years | 248 (84.4%) | 17 (6.9%) |
| 45 to 54 Years | 172 (61.4%) | 6 (3.5%) |
| 55 to 59 Years | 169 (90.9%) | 50 (29.6%) |
| 60 to 64 Years | 161 (55.9%) | 0 (0.0%) |
| 65 to 74 Years | 92 (11.7%) | 0 (0.0%) |
| 75 Years and over | 39 (7.3%) | 0 (0.0%) |
| Total | 1,027 (38.5%) | 73 (7.1%) |
Employment Status by Educational Attainment in Pine Mountain Lake
According to labor force statistics for Pine Mountain Lake, 70.4% of individuals (879) out of the total population between 25 and 64 years of age (1,248) are in the labor force, with 8.3% or 73 of them being unemployed. The group with the highest labor force participation rate are those with the educational attainment of bachelor's degree or higher, with 90.0% or 367 individuals in the labor force. Within the labor force, individuals with college / associate degree education have the highest percentage of unemployment, with 16.4% or 56 of them being unemployed.
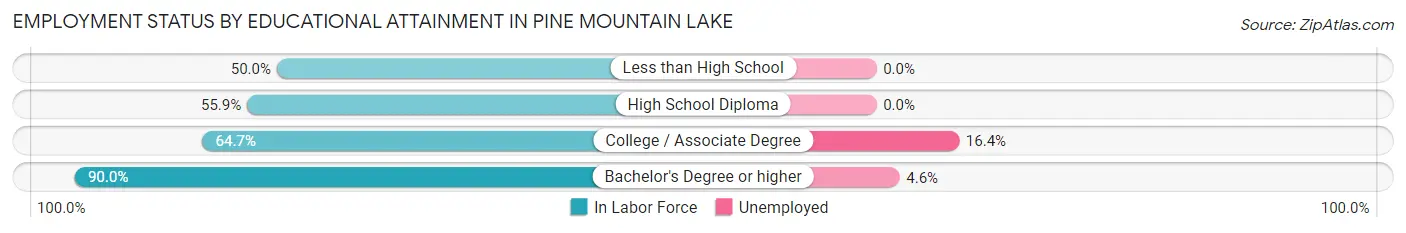
| Educational Attainment | In Labor Force | Unemployed |
| Less than High School | 33 (50.0%) | 0 (0.0%) |
| High School Diploma | 138 (55.9%) | 0 (0.0%) |
| College / Associate Degree | 341 (64.7%) | 86 (16.4%) |
| Bachelor's Degree or higher | 367 (90.0%) | 19 (4.6%) |
| Total | 879 (70.4%) | 104 (8.3%) |
Employment Occupations by Sex in Pine Mountain Lake
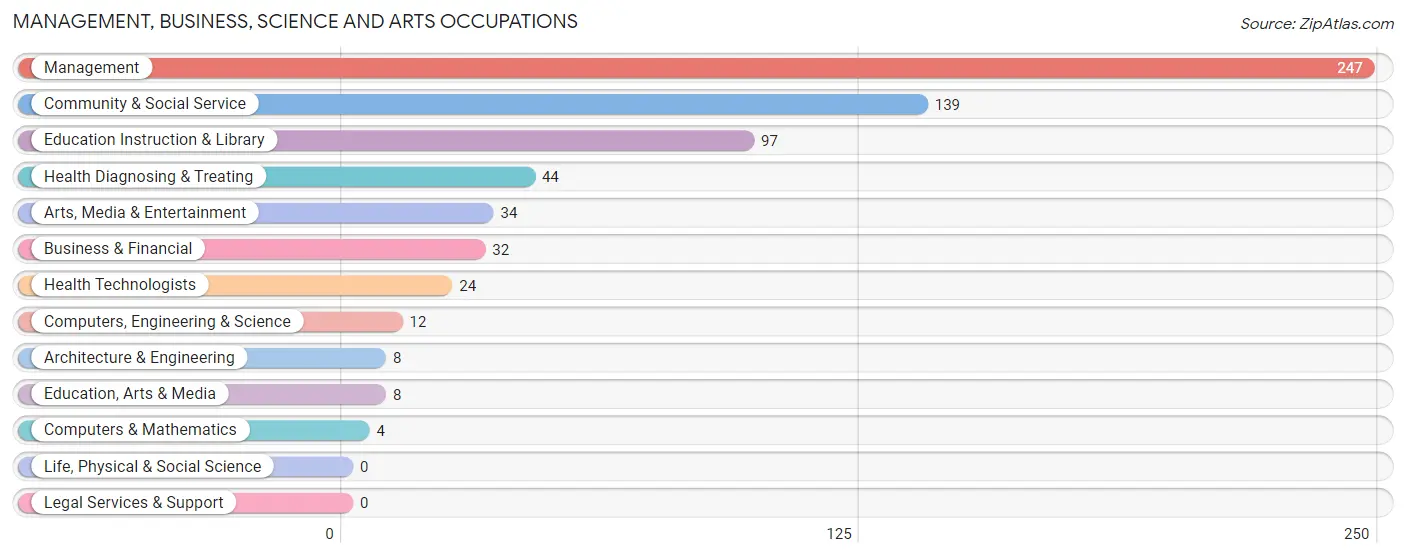
Management, Business, Science and Arts Occupations
The most common Management, Business, Science and Arts occupations in Pine Mountain Lake are Management (247 | 25.9%), Community & Social Service (139 | 14.5%), Education Instruction & Library (97 | 10.2%), Health Diagnosing & Treating (44 | 4.6%), and Arts, Media & Entertainment (34 | 3.6%).
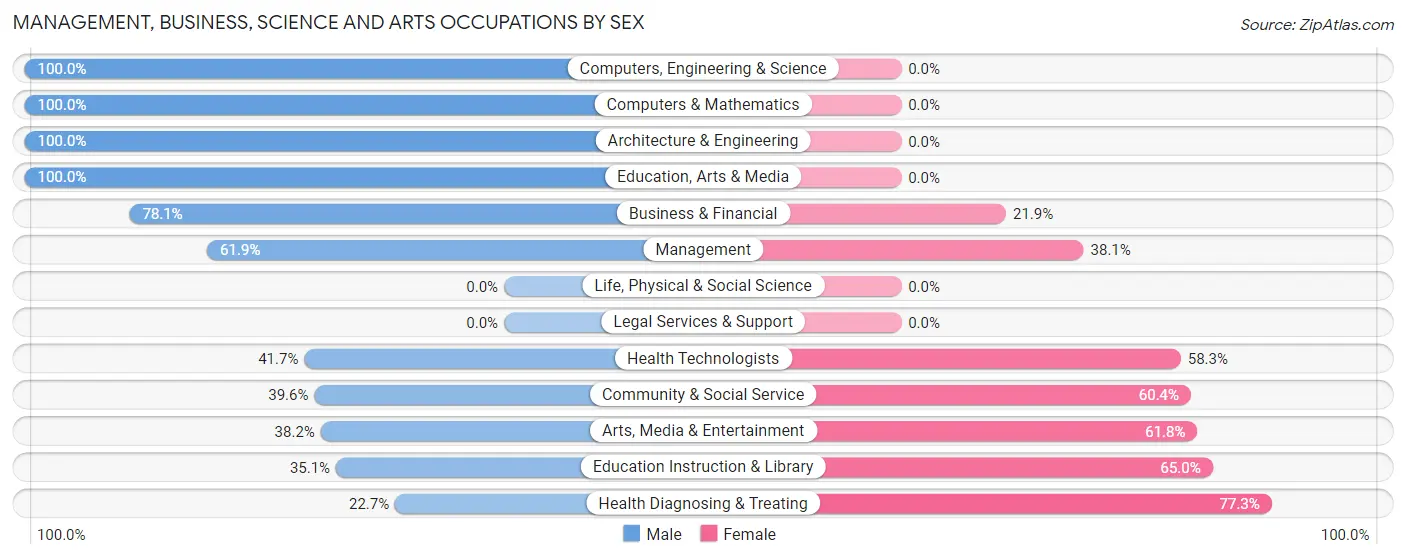
Management, Business, Science and Arts Occupations by Sex
Within the Management, Business, Science and Arts occupations in Pine Mountain Lake, the most male-oriented occupations are Computers, Engineering & Science (100.0%), Computers & Mathematics (100.0%), and Architecture & Engineering (100.0%), while the most female-oriented occupations are Health Diagnosing & Treating (77.3%), Education Instruction & Library (64.9%), and Arts, Media & Entertainment (61.8%).
| Occupation | Male | Female |
| Management | 153 (61.9%) | 94 (38.1%) |
| Business & Financial | 25 (78.1%) | 7 (21.9%) |
| Computers, Engineering & Science | 12 (100.0%) | 0 (0.0%) |
| Computers & Mathematics | 4 (100.0%) | 0 (0.0%) |
| Architecture & Engineering | 8 (100.0%) | 0 (0.0%) |
| Life, Physical & Social Science | 0 (0.0%) | 0 (0.0%) |
| Community & Social Service | 55 (39.6%) | 84 (60.4%) |
| Education, Arts & Media | 8 (100.0%) | 0 (0.0%) |
| Legal Services & Support | 0 (0.0%) | 0 (0.0%) |
| Education Instruction & Library | 34 (35.0%) | 63 (64.9%) |
| Arts, Media & Entertainment | 13 (38.2%) | 21 (61.8%) |
| Health Diagnosing & Treating | 10 (22.7%) | 34 (77.3%) |
| Health Technologists | 10 (41.7%) | 14 (58.3%) |
| Total (Category) | 255 (53.8%) | 219 (46.2%) |
| Total (Overall) | 541 (56.7%) | 414 (43.3%) |
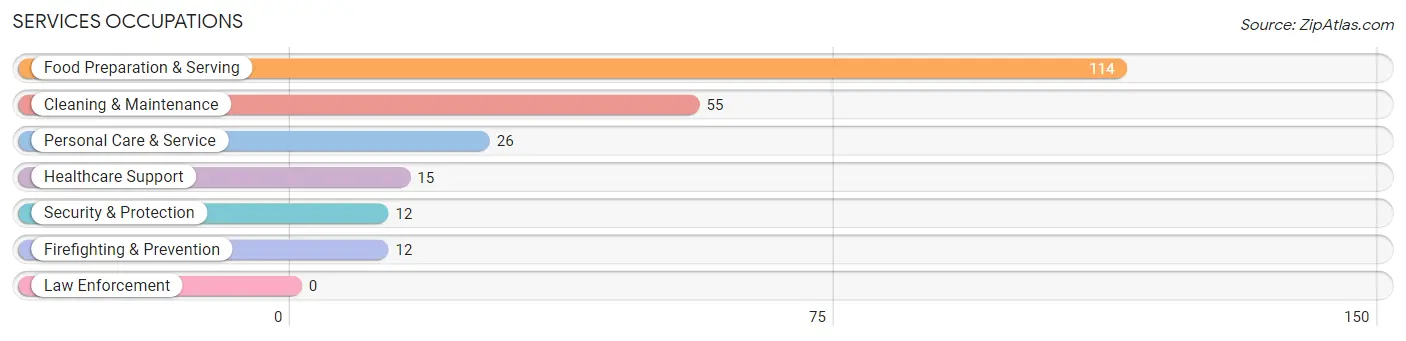
Services Occupations
The most common Services occupations in Pine Mountain Lake are Food Preparation & Serving (114 | 11.9%), Cleaning & Maintenance (55 | 5.8%), Personal Care & Service (26 | 2.7%), Healthcare Support (15 | 1.6%), and Security & Protection (12 | 1.3%).
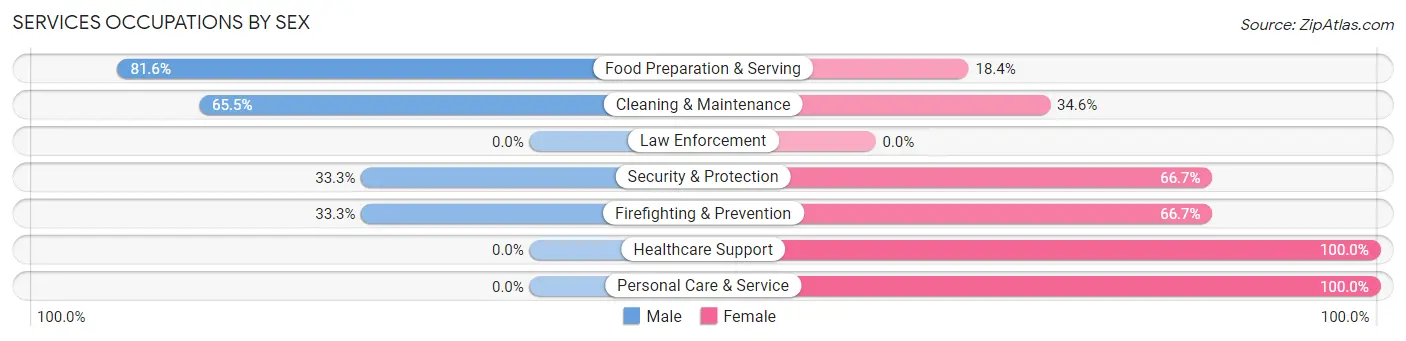
Services Occupations by Sex
Within the Services occupations in Pine Mountain Lake, the most male-oriented occupations are Food Preparation & Serving (81.6%), Cleaning & Maintenance (65.4%), and Security & Protection (33.3%), while the most female-oriented occupations are Healthcare Support (100.0%), Personal Care & Service (100.0%), and Security & Protection (66.7%).
| Occupation | Male | Female |
| Healthcare Support | 0 (0.0%) | 15 (100.0%) |
| Security & Protection | 4 (33.3%) | 8 (66.7%) |
| Firefighting & Prevention | 4 (33.3%) | 8 (66.7%) |
| Law Enforcement | 0 (0.0%) | 0 (0.0%) |
| Food Preparation & Serving | 93 (81.6%) | 21 (18.4%) |
| Cleaning & Maintenance | 36 (65.4%) | 19 (34.5%) |
| Personal Care & Service | 0 (0.0%) | 26 (100.0%) |
| Total (Category) | 133 (59.9%) | 89 (40.1%) |
| Total (Overall) | 541 (56.7%) | 414 (43.3%) |
Sales and Office Occupations
The most common Sales and Office occupations in Pine Mountain Lake are Sales & Related (115 | 12.0%), and Office & Administration (48 | 5.0%).
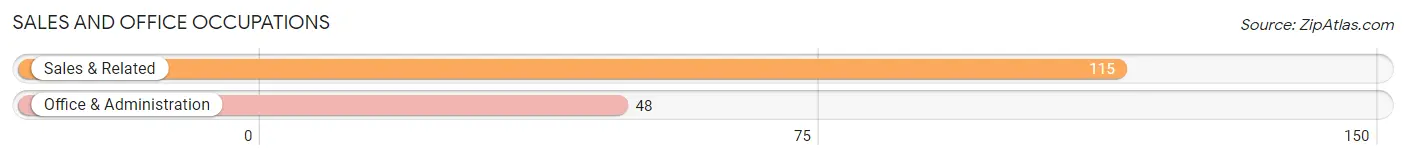
Sales and Office Occupations by Sex
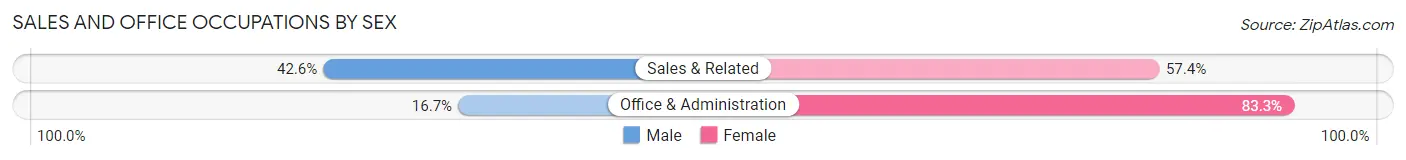
| Occupation | Male | Female |
| Sales & Related | 49 (42.6%) | 66 (57.4%) |
| Office & Administration | 8 (16.7%) | 40 (83.3%) |
| Total (Category) | 57 (35.0%) | 106 (65.0%) |
| Total (Overall) | 541 (56.7%) | 414 (43.3%) |
Natural Resources, Construction and Maintenance Occupations
The most common Natural Resources, Construction and Maintenance occupations in Pine Mountain Lake are Installation, Maintenance & Repair (27 | 2.8%), and Construction & Extraction (20 | 2.1%).
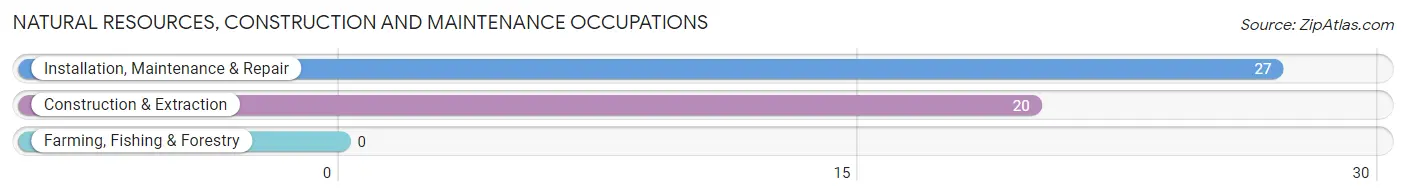
Natural Resources, Construction and Maintenance Occupations by Sex
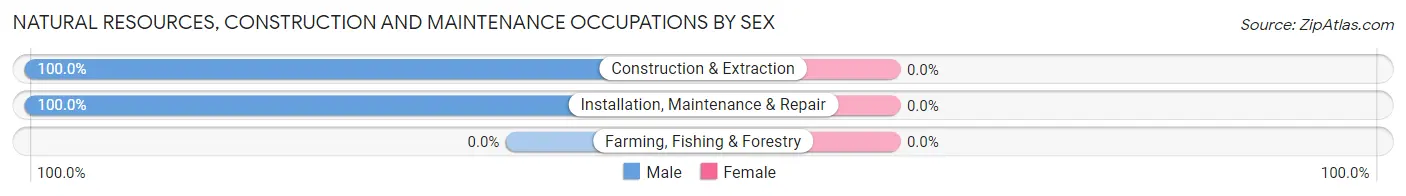
| Occupation | Male | Female |
| Farming, Fishing & Forestry | 0 (0.0%) | 0 (0.0%) |
| Construction & Extraction | 20 (100.0%) | 0 (0.0%) |
| Installation, Maintenance & Repair | 27 (100.0%) | 0 (0.0%) |
| Total (Category) | 47 (100.0%) | 0 (0.0%) |
| Total (Overall) | 541 (56.7%) | 414 (43.3%) |
Production, Transportation and Moving Occupations
The most common Production, Transportation and Moving occupations in Pine Mountain Lake are Transportation (39 | 4.1%), and Production (10 | 1.1%).
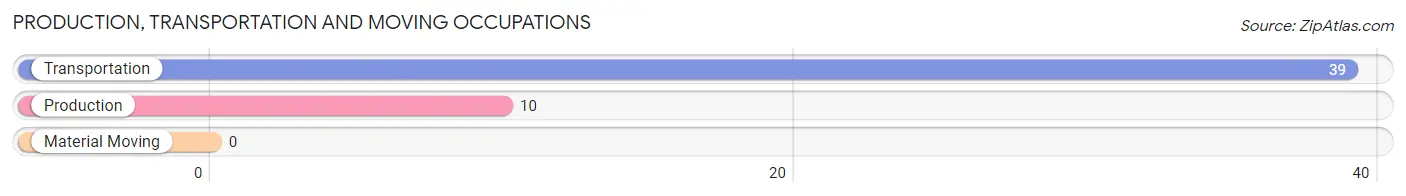
Production, Transportation and Moving Occupations by Sex
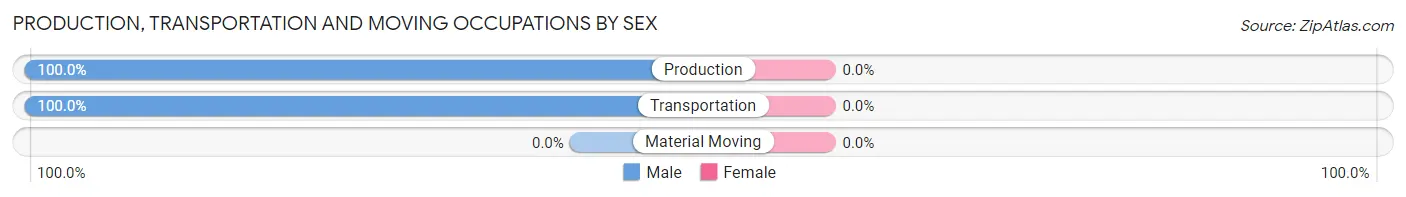
| Occupation | Male | Female |
| Production | 10 (100.0%) | 0 (0.0%) |
| Transportation | 39 (100.0%) | 0 (0.0%) |
| Material Moving | 0 (0.0%) | 0 (0.0%) |
| Total (Category) | 49 (100.0%) | 0 (0.0%) |
| Total (Overall) | 541 (56.7%) | 414 (43.3%) |
Employment Industries by Sex in Pine Mountain Lake
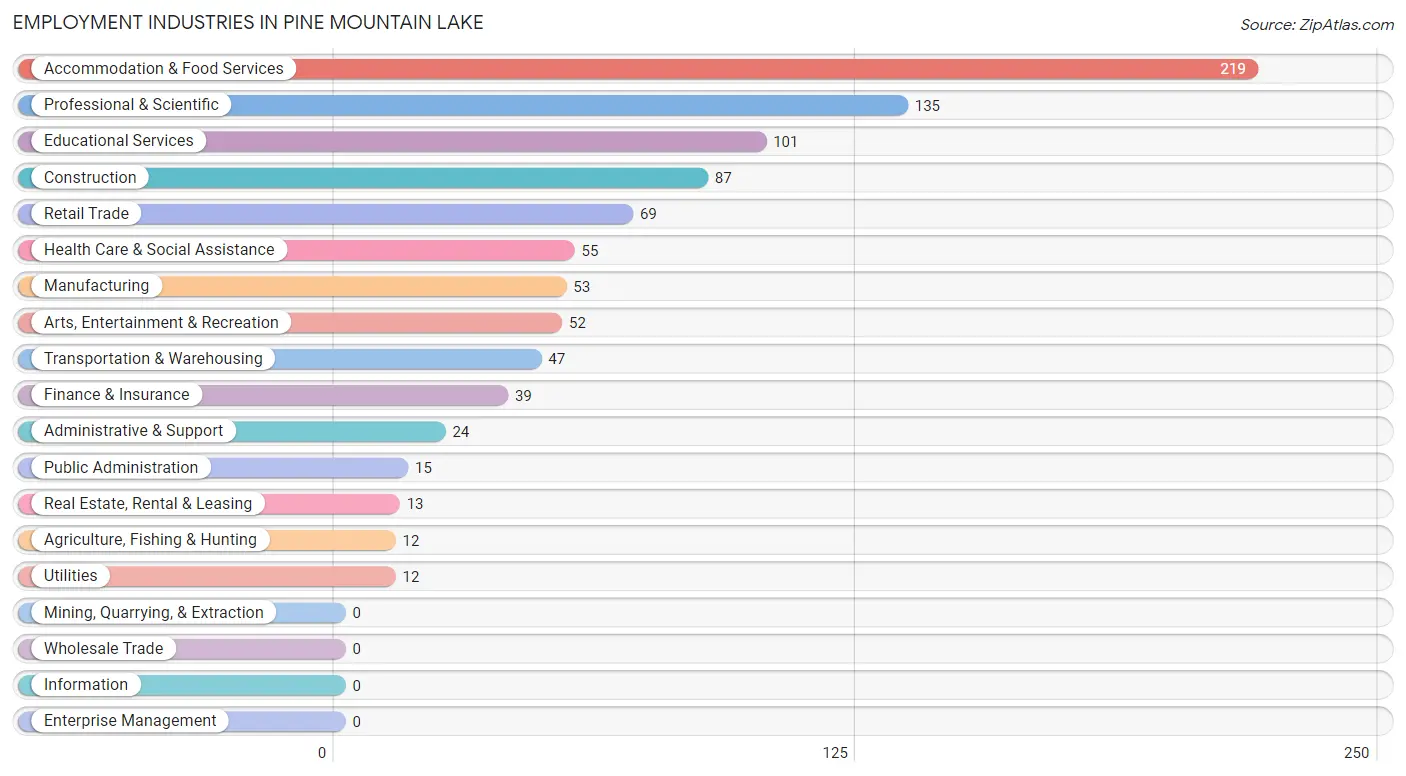
Employment Industries in Pine Mountain Lake
The major employment industries in Pine Mountain Lake include Accommodation & Food Services (219 | 22.9%), Professional & Scientific (135 | 14.1%), Educational Services (101 | 10.6%), Construction (87 | 9.1%), and Retail Trade (69 | 7.2%).
Employment Industries by Sex in Pine Mountain Lake
The Pine Mountain Lake industries that see more men than women are Manufacturing (100.0%), Transportation & Warehousing (100.0%), and Utilities (100.0%), whereas the industries that tend to have a higher number of women are Finance & Insurance (100.0%), Public Administration (100.0%), and Health Care & Social Assistance (89.1%).
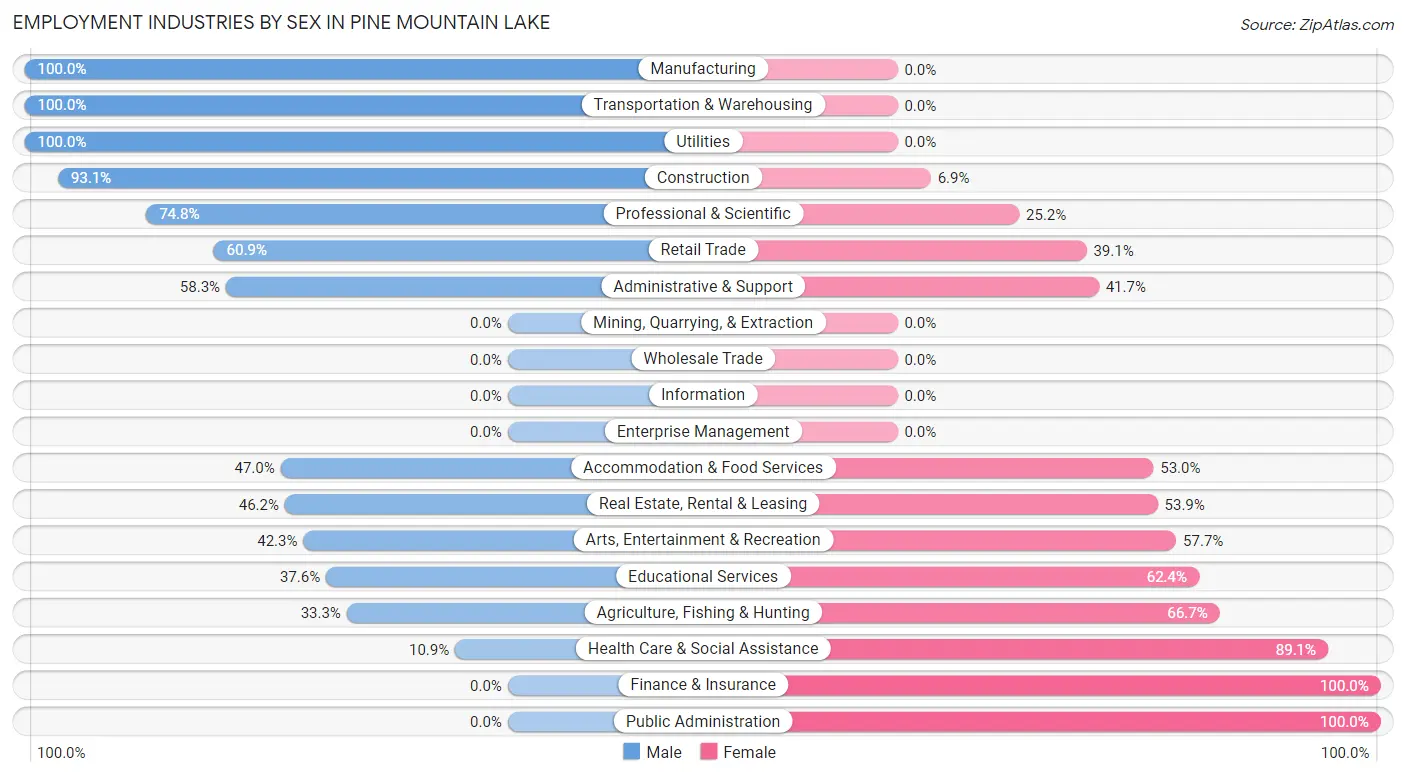
| Industry | Male | Female |
| Agriculture, Fishing & Hunting | 4 (33.3%) | 8 (66.7%) |
| Mining, Quarrying, & Extraction | 0 (0.0%) | 0 (0.0%) |
| Construction | 81 (93.1%) | 6 (6.9%) |
| Manufacturing | 53 (100.0%) | 0 (0.0%) |
| Wholesale Trade | 0 (0.0%) | 0 (0.0%) |
| Retail Trade | 42 (60.9%) | 27 (39.1%) |
| Transportation & Warehousing | 47 (100.0%) | 0 (0.0%) |
| Utilities | 12 (100.0%) | 0 (0.0%) |
| Information | 0 (0.0%) | 0 (0.0%) |
| Finance & Insurance | 0 (0.0%) | 39 (100.0%) |
| Real Estate, Rental & Leasing | 6 (46.2%) | 7 (53.8%) |
| Professional & Scientific | 101 (74.8%) | 34 (25.2%) |
| Enterprise Management | 0 (0.0%) | 0 (0.0%) |
| Administrative & Support | 14 (58.3%) | 10 (41.7%) |
| Educational Services | 38 (37.6%) | 63 (62.4%) |
| Health Care & Social Assistance | 6 (10.9%) | 49 (89.1%) |
| Arts, Entertainment & Recreation | 22 (42.3%) | 30 (57.7%) |
| Accommodation & Food Services | 103 (47.0%) | 116 (53.0%) |
| Public Administration | 0 (0.0%) | 15 (100.0%) |
| Total | 541 (56.7%) | 414 (43.3%) |
Education in Pine Mountain Lake
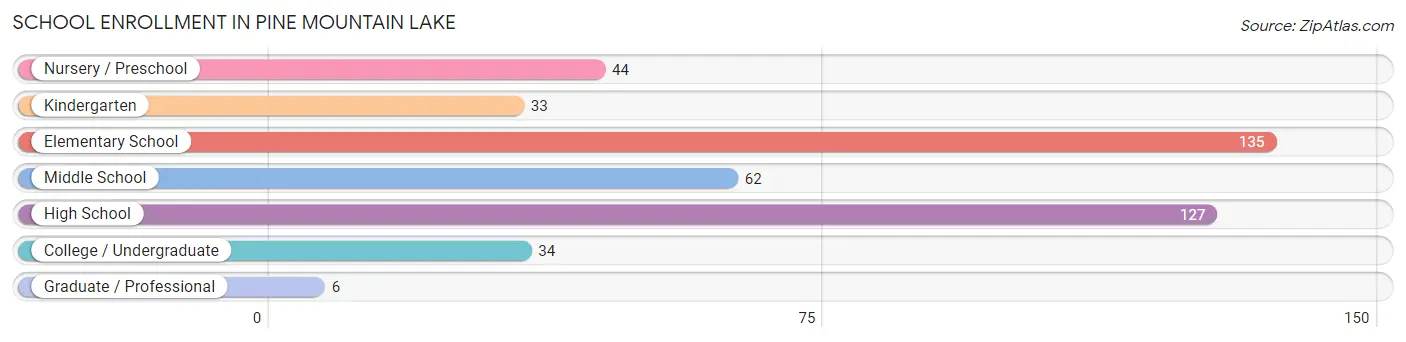
School Enrollment in Pine Mountain Lake
The most common levels of schooling among the 441 students in Pine Mountain Lake are elementary school (135 | 30.6%), high school (127 | 28.8%), and middle school (62 | 14.1%).
| School Level | # Students | % Students |
| Nursery / Preschool | 44 | 10.0% |
| Kindergarten | 33 | 7.5% |
| Elementary School | 135 | 30.6% |
| Middle School | 62 | 14.1% |
| High School | 127 | 28.8% |
| College / Undergraduate | 34 | 7.7% |
| Graduate / Professional | 6 | 1.4% |
| Total | 441 | 100.0% |
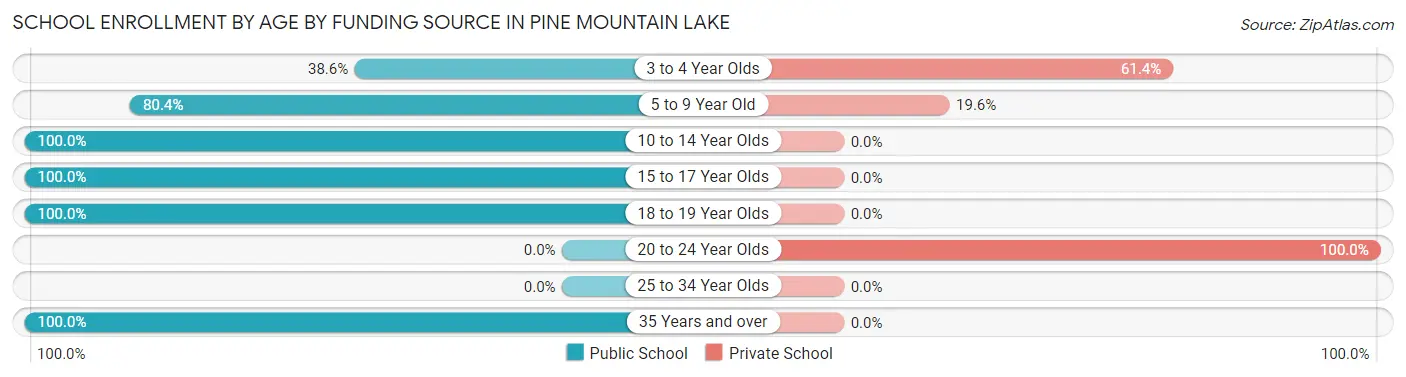
School Enrollment by Age by Funding Source in Pine Mountain Lake
Out of a total of 441 students who are enrolled in schools in Pine Mountain Lake, 69 (15.6%) attend a private institution, while the remaining 372 (84.4%) are enrolled in public schools. The age group of 20 to 24 year olds has the highest likelihood of being enrolled in private schools, with 9 (100.0% in the age bracket) enrolled. Conversely, the age group of 10 to 14 year olds has the lowest likelihood of being enrolled in a private school, with 62 (100.0% in the age bracket) attending a public institution.
| Age Bracket | Public School | Private School |
| 3 to 4 Year Olds | 17 (38.6%) | 27 (61.4%) |
| 5 to 9 Year Old | 135 (80.4%) | 33 (19.6%) |
| 10 to 14 Year Olds | 62 (100.0%) | 0 (0.0%) |
| 15 to 17 Year Olds | 19 (100.0%) | 0 (0.0%) |
| 18 to 19 Year Olds | 86 (100.0%) | 0 (0.0%) |
| 20 to 24 Year Olds | 0 (0.0%) | 9 (100.0%) |
| 25 to 34 Year Olds | 0 (0.0%) | 0 (0.0%) |
| 35 Years and over | 53 (100.0%) | 0 (0.0%) |
| Total | 372 (84.4%) | 69 (15.6%) |
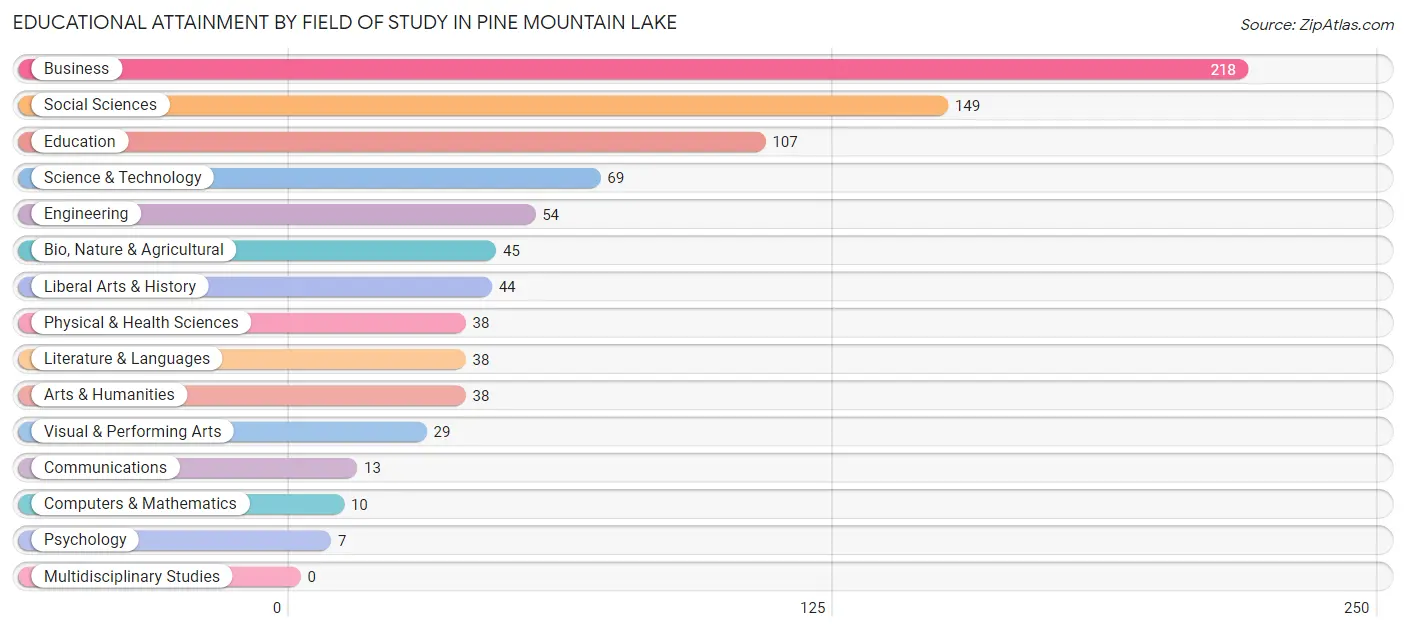
Educational Attainment by Field of Study in Pine Mountain Lake
Business (218 | 25.4%), social sciences (149 | 17.3%), education (107 | 12.5%), science & technology (69 | 8.0%), and engineering (54 | 6.3%) are the most common fields of study among 859 individuals in Pine Mountain Lake who have obtained a bachelor's degree or higher.
| Field of Study | # Graduates | % Graduates |
| Computers & Mathematics | 10 | 1.2% |
| Bio, Nature & Agricultural | 45 | 5.2% |
| Physical & Health Sciences | 38 | 4.4% |
| Psychology | 7 | 0.8% |
| Social Sciences | 149 | 17.3% |
| Engineering | 54 | 6.3% |
| Multidisciplinary Studies | 0 | 0.0% |
| Science & Technology | 69 | 8.0% |
| Business | 218 | 25.4% |
| Education | 107 | 12.5% |
| Literature & Languages | 38 | 4.4% |
| Liberal Arts & History | 44 | 5.1% |
| Visual & Performing Arts | 29 | 3.4% |
| Communications | 13 | 1.5% |
| Arts & Humanities | 38 | 4.4% |
| Total | 859 | 100.0% |
Transportation & Commute in Pine Mountain Lake
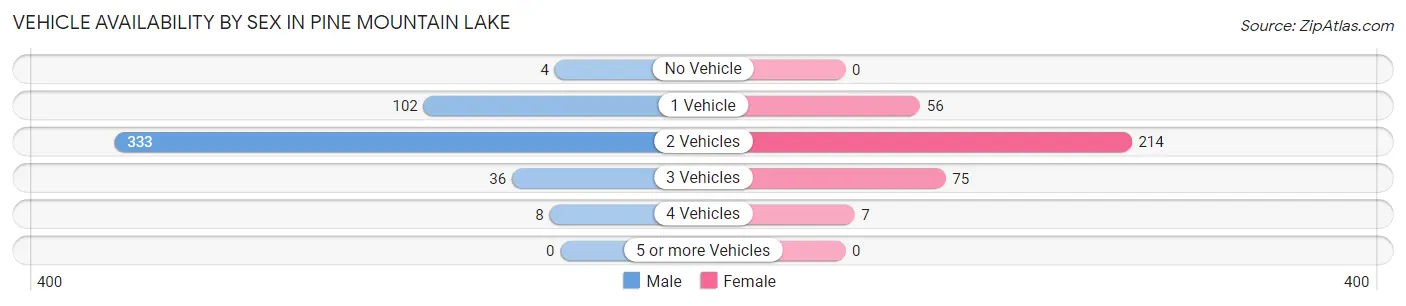
Vehicle Availability by Sex in Pine Mountain Lake
The most prevalent vehicle ownership categories in Pine Mountain Lake are males with 2 vehicles (333, accounting for 68.9%) and females with 2 vehicles (214, making up 94.6%).
| Vehicles Available | Male | Female |
| No Vehicle | 4 (0.8%) | 0 (0.0%) |
| 1 Vehicle | 102 (21.1%) | 56 (15.9%) |
| 2 Vehicles | 333 (68.9%) | 214 (60.8%) |
| 3 Vehicles | 36 (7.4%) | 75 (21.3%) |
| 4 Vehicles | 8 (1.7%) | 7 (2.0%) |
| 5 or more Vehicles | 0 (0.0%) | 0 (0.0%) |
| Total | 483 (100.0%) | 352 (100.0%) |
Commute Time in Pine Mountain Lake
The most frequently occuring commute durations in Pine Mountain Lake are 5 to 9 minutes (191 commuters, 23.0%), 10 to 14 minutes (191 commuters, 23.0%), and 15 to 19 minutes (93 commuters, 11.2%).
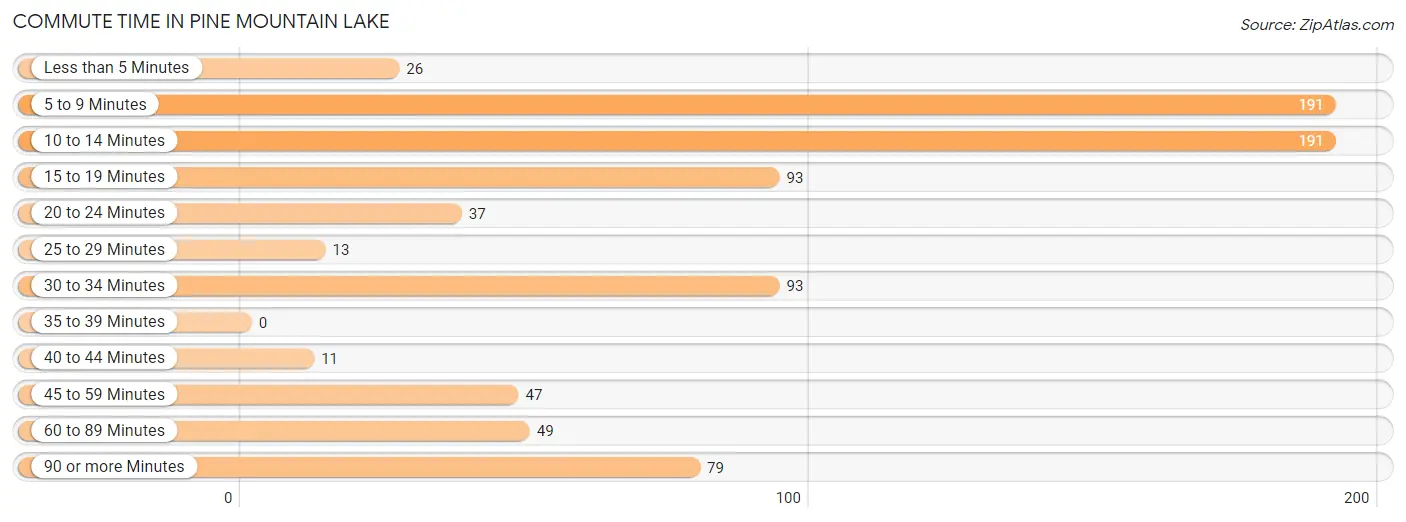
| Commute Time | # Commuters | % Commuters |
| Less than 5 Minutes | 26 | 3.1% |
| 5 to 9 Minutes | 191 | 23.0% |
| 10 to 14 Minutes | 191 | 23.0% |
| 15 to 19 Minutes | 93 | 11.2% |
| 20 to 24 Minutes | 37 | 4.5% |
| 25 to 29 Minutes | 13 | 1.6% |
| 30 to 34 Minutes | 93 | 11.2% |
| 35 to 39 Minutes | 0 | 0.0% |
| 40 to 44 Minutes | 11 | 1.3% |
| 45 to 59 Minutes | 47 | 5.7% |
| 60 to 89 Minutes | 49 | 5.9% |
| 90 or more Minutes | 79 | 9.5% |
Commute Time by Sex in Pine Mountain Lake
The most common commute times in Pine Mountain Lake are 10 to 14 minutes (141 commuters, 29.4%) for males and 5 to 9 minutes (122 commuters, 34.8%) for females.
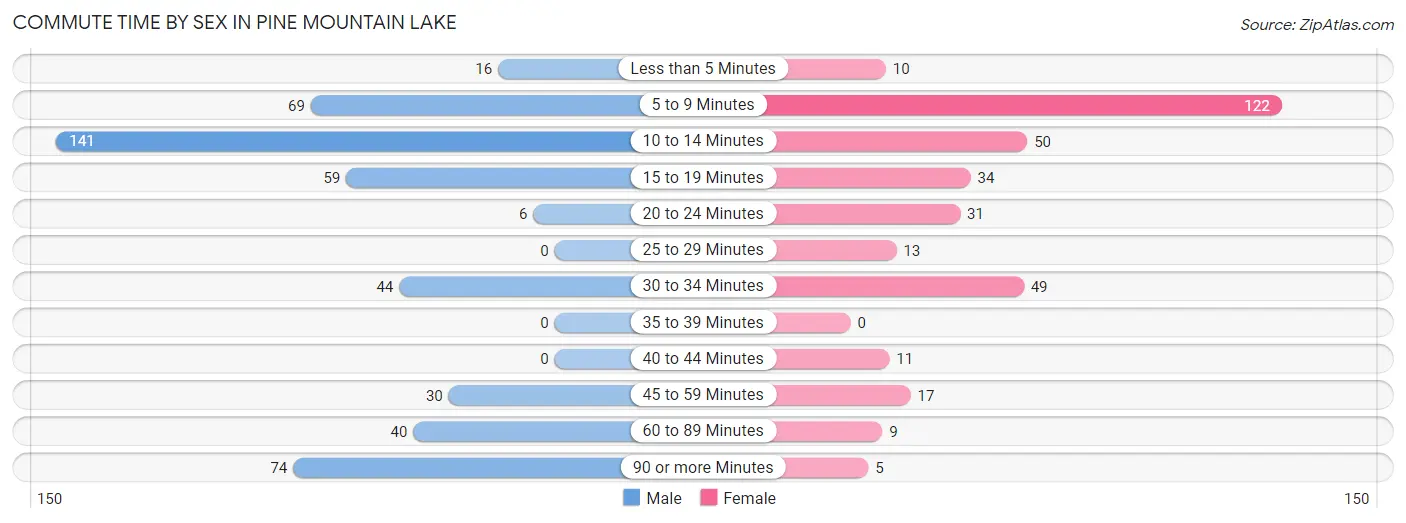
| Commute Time | Male | Female |
| Less than 5 Minutes | 16 (3.3%) | 10 (2.9%) |
| 5 to 9 Minutes | 69 (14.4%) | 122 (34.8%) |
| 10 to 14 Minutes | 141 (29.4%) | 50 (14.2%) |
| 15 to 19 Minutes | 59 (12.3%) | 34 (9.7%) |
| 20 to 24 Minutes | 6 (1.3%) | 31 (8.8%) |
| 25 to 29 Minutes | 0 (0.0%) | 13 (3.7%) |
| 30 to 34 Minutes | 44 (9.2%) | 49 (14.0%) |
| 35 to 39 Minutes | 0 (0.0%) | 0 (0.0%) |
| 40 to 44 Minutes | 0 (0.0%) | 11 (3.1%) |
| 45 to 59 Minutes | 30 (6.3%) | 17 (4.8%) |
| 60 to 89 Minutes | 40 (8.4%) | 9 (2.6%) |
| 90 or more Minutes | 74 (15.4%) | 5 (1.4%) |
Time of Departure to Work by Sex in Pine Mountain Lake
The most frequent times of departure to work in Pine Mountain Lake are 7:30 AM to 7:59 AM (91, 19.0%) for males and 7:30 AM to 7:59 AM (72, 20.5%) for females.
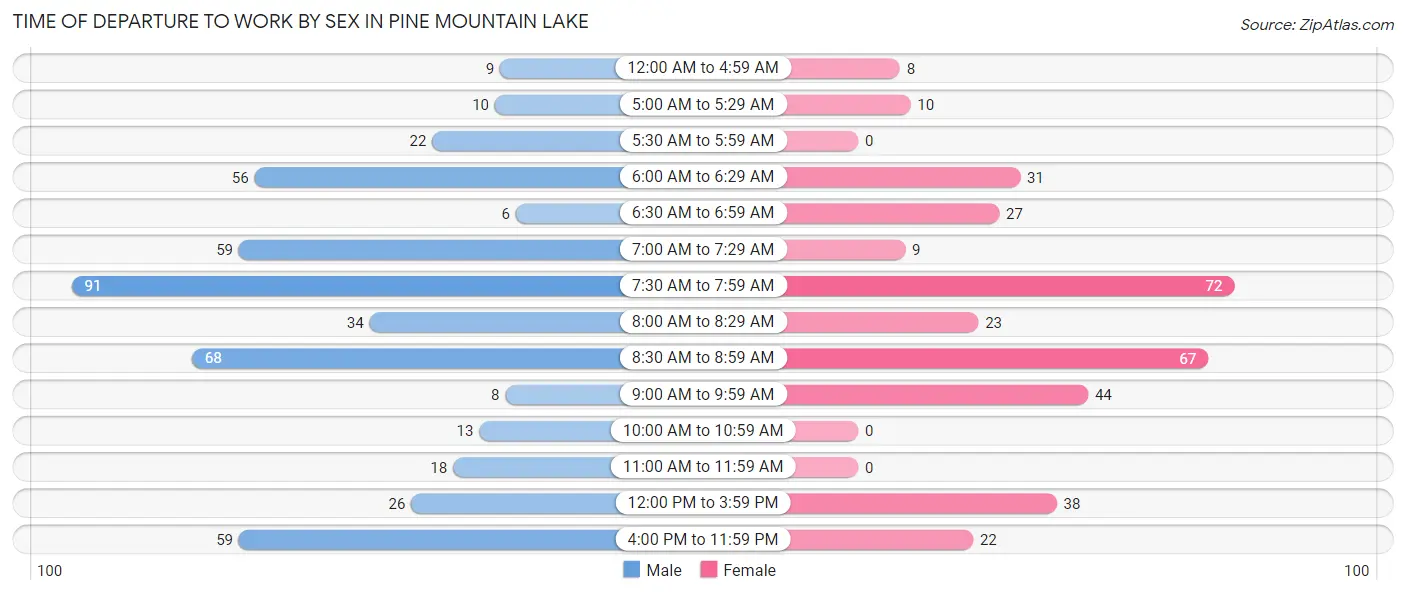
| Time of Departure | Male | Female |
| 12:00 AM to 4:59 AM | 9 (1.9%) | 8 (2.3%) |
| 5:00 AM to 5:29 AM | 10 (2.1%) | 10 (2.9%) |
| 5:30 AM to 5:59 AM | 22 (4.6%) | 0 (0.0%) |
| 6:00 AM to 6:29 AM | 56 (11.7%) | 31 (8.8%) |
| 6:30 AM to 6:59 AM | 6 (1.3%) | 27 (7.7%) |
| 7:00 AM to 7:29 AM | 59 (12.3%) | 9 (2.6%) |
| 7:30 AM to 7:59 AM | 91 (19.0%) | 72 (20.5%) |
| 8:00 AM to 8:29 AM | 34 (7.1%) | 23 (6.6%) |
| 8:30 AM to 8:59 AM | 68 (14.2%) | 67 (19.1%) |
| 9:00 AM to 9:59 AM | 8 (1.7%) | 44 (12.5%) |
| 10:00 AM to 10:59 AM | 13 (2.7%) | 0 (0.0%) |
| 11:00 AM to 11:59 AM | 18 (3.8%) | 0 (0.0%) |
| 12:00 PM to 3:59 PM | 26 (5.4%) | 38 (10.8%) |
| 4:00 PM to 11:59 PM | 59 (12.3%) | 22 (6.3%) |
| Total | 479 (100.0%) | 351 (100.0%) |
Housing Occupancy in Pine Mountain Lake
Occupancy by Ownership in Pine Mountain Lake
Of the total 1,401 dwellings in Pine Mountain Lake, owner-occupied units account for 1,246 (88.9%), while renter-occupied units make up 155 (11.1%).
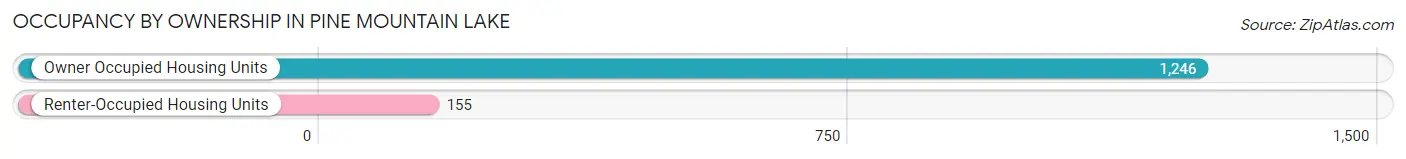
| Occupancy | # Housing Units | % Housing Units |
| Owner Occupied Housing Units | 1,246 | 88.9% |
| Renter-Occupied Housing Units | 155 | 11.1% |
| Total Occupied Housing Units | 1,401 | 100.0% |
Occupancy by Household Size in Pine Mountain Lake
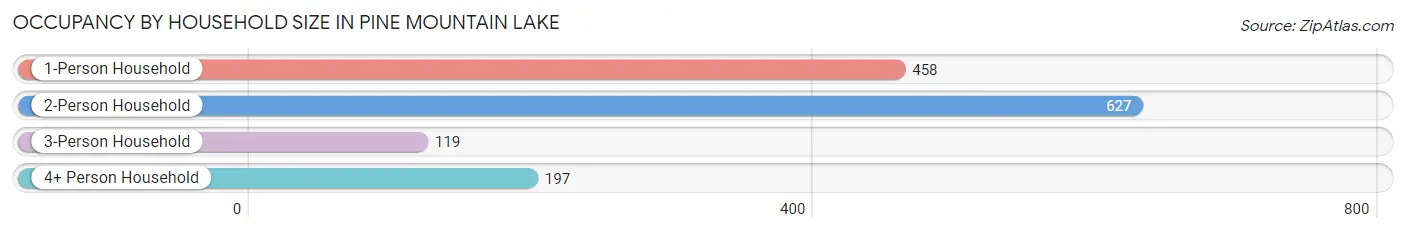
| Household Size | # Housing Units | % Housing Units |
| 1-Person Household | 458 | 32.7% |
| 2-Person Household | 627 | 44.8% |
| 3-Person Household | 119 | 8.5% |
| 4+ Person Household | 197 | 14.1% |
| Total Housing Units | 1,401 | 100.0% |
Occupancy by Ownership by Household Size in Pine Mountain Lake
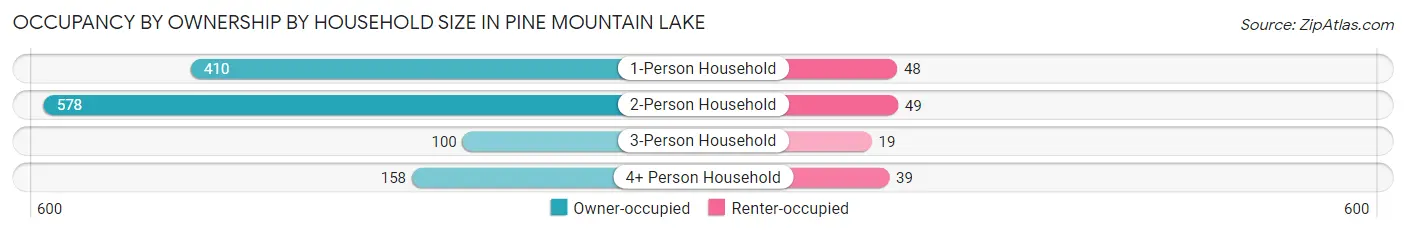
| Household Size | Owner-occupied | Renter-occupied |
| 1-Person Household | 410 (89.5%) | 48 (10.5%) |
| 2-Person Household | 578 (92.2%) | 49 (7.8%) |
| 3-Person Household | 100 (84.0%) | 19 (16.0%) |
| 4+ Person Household | 158 (80.2%) | 39 (19.8%) |
| Total Housing Units | 1,246 (88.9%) | 155 (11.1%) |
Occupancy by Educational Attainment in Pine Mountain Lake
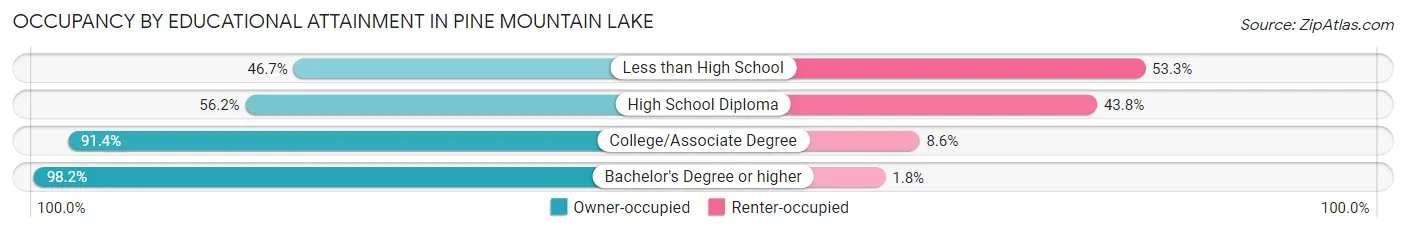
| Household Size | Owner-occupied | Renter-occupied |
| Less than High School | 7 (46.7%) | 8 (53.3%) |
| High School Diploma | 104 (56.2%) | 81 (43.8%) |
| College/Associate Degree | 597 (91.4%) | 56 (8.6%) |
| Bachelor's Degree or higher | 538 (98.2%) | 10 (1.8%) |
Occupancy by Age of Householder in Pine Mountain Lake
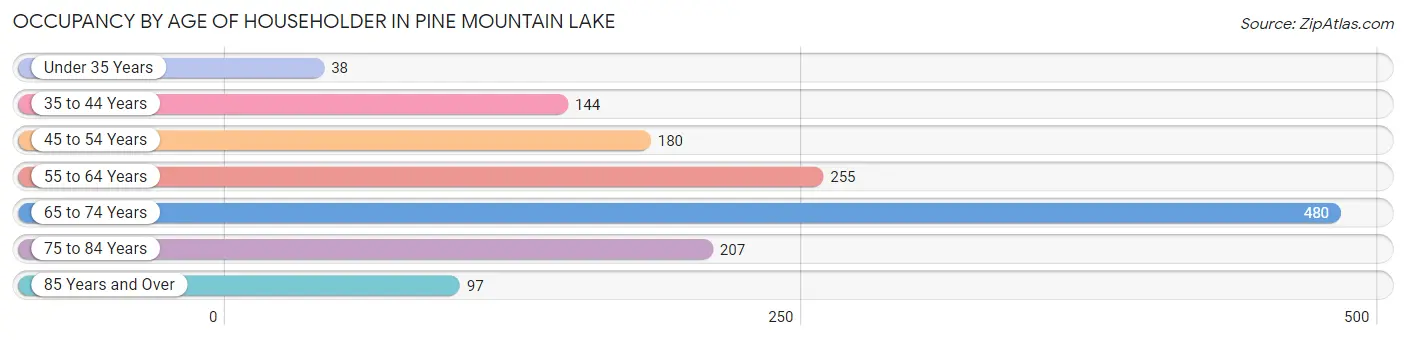
| Age Bracket | # Households | % Households |
| Under 35 Years | 38 | 2.7% |
| 35 to 44 Years | 144 | 10.3% |
| 45 to 54 Years | 180 | 12.9% |
| 55 to 64 Years | 255 | 18.2% |
| 65 to 74 Years | 480 | 34.3% |
| 75 to 84 Years | 207 | 14.8% |
| 85 Years and Over | 97 | 6.9% |
| Total | 1,401 | 100.0% |
Housing Finances in Pine Mountain Lake
Median Income by Occupancy in Pine Mountain Lake
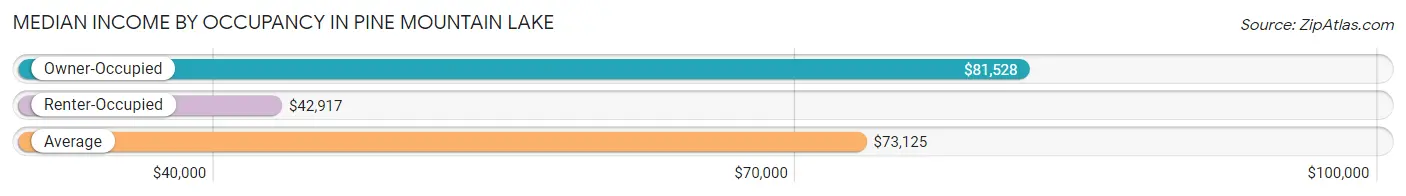
| Occupancy Type | # Households | Median Income |
| Owner-Occupied | 1,246 (88.9%) | $81,528 |
| Renter-Occupied | 155 (11.1%) | $42,917 |
| Average | 1,401 (100.0%) | $73,125 |
Occupancy by Householder Income Bracket in Pine Mountain Lake
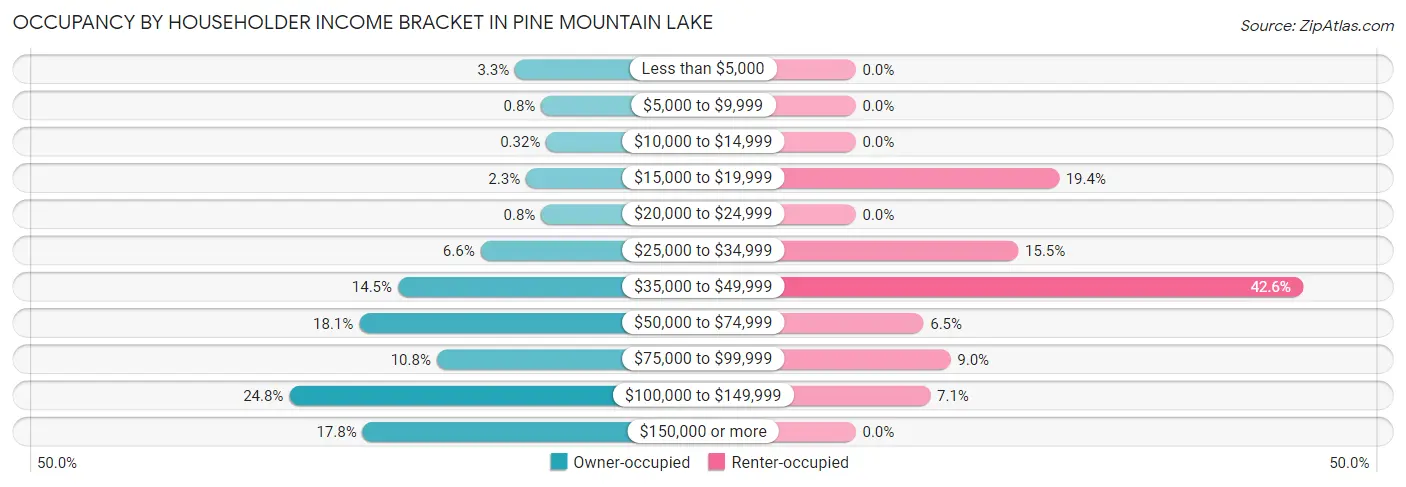
| Income Bracket | Owner-occupied | Renter-occupied |
| Less than $5,000 | 41 (3.3%) | 0 (0.0%) |
| $5,000 to $9,999 | 10 (0.8%) | 0 (0.0%) |
| $10,000 to $14,999 | 4 (0.3%) | 0 (0.0%) |
| $15,000 to $19,999 | 28 (2.2%) | 30 (19.4%) |
| $20,000 to $24,999 | 10 (0.8%) | 0 (0.0%) |
| $25,000 to $34,999 | 82 (6.6%) | 24 (15.5%) |
| $35,000 to $49,999 | 180 (14.4%) | 66 (42.6%) |
| $50,000 to $74,999 | 226 (18.1%) | 10 (6.5%) |
| $75,000 to $99,999 | 134 (10.7%) | 14 (9.0%) |
| $100,000 to $149,999 | 309 (24.8%) | 11 (7.1%) |
| $150,000 or more | 222 (17.8%) | 0 (0.0%) |
| Total | 1,246 (100.0%) | 155 (100.0%) |
Monthly Housing Cost Tiers in Pine Mountain Lake
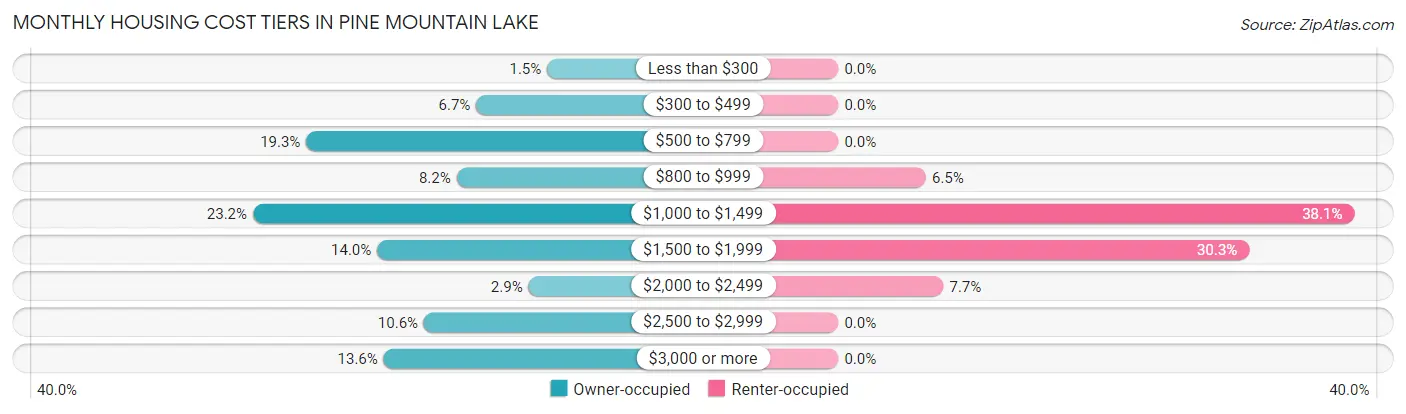
| Monthly Cost | Owner-occupied | Renter-occupied |
| Less than $300 | 19 (1.5%) | 0 (0.0%) |
| $300 to $499 | 84 (6.7%) | 0 (0.0%) |
| $500 to $799 | 240 (19.3%) | 0 (0.0%) |
| $800 to $999 | 102 (8.2%) | 10 (6.5%) |
| $1,000 to $1,499 | 289 (23.2%) | 59 (38.1%) |
| $1,500 to $1,999 | 175 (14.0%) | 47 (30.3%) |
| $2,000 to $2,499 | 36 (2.9%) | 12 (7.7%) |
| $2,500 to $2,999 | 132 (10.6%) | 0 (0.0%) |
| $3,000 or more | 169 (13.6%) | 0 (0.0%) |
| Total | 1,246 (100.0%) | 155 (100.0%) |
Physical Housing Characteristics in Pine Mountain Lake
Housing Structures in Pine Mountain Lake
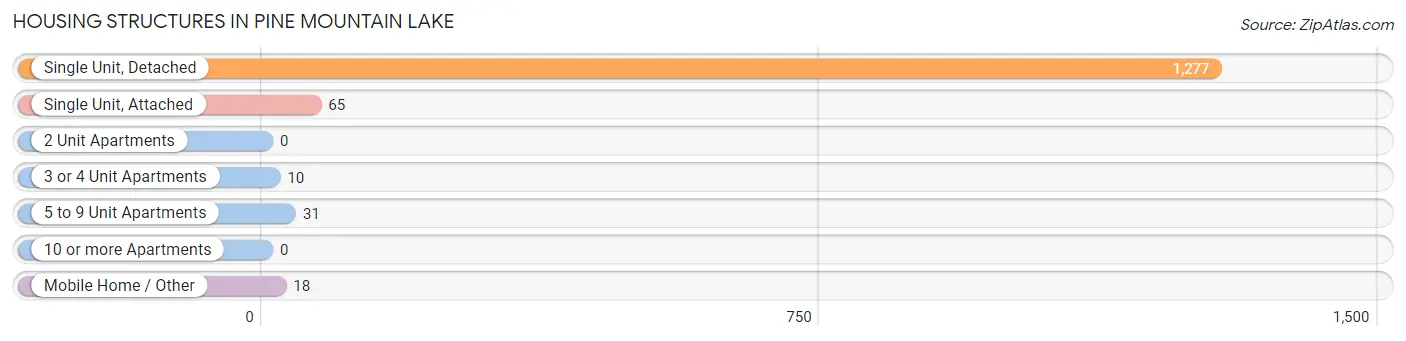
| Structure Type | # Housing Units | % Housing Units |
| Single Unit, Detached | 1,277 | 91.1% |
| Single Unit, Attached | 65 | 4.6% |
| 2 Unit Apartments | 0 | 0.0% |
| 3 or 4 Unit Apartments | 10 | 0.7% |
| 5 to 9 Unit Apartments | 31 | 2.2% |
| 10 or more Apartments | 0 | 0.0% |
| Mobile Home / Other | 18 | 1.3% |
| Total | 1,401 | 100.0% |
Housing Structures by Occupancy in Pine Mountain Lake
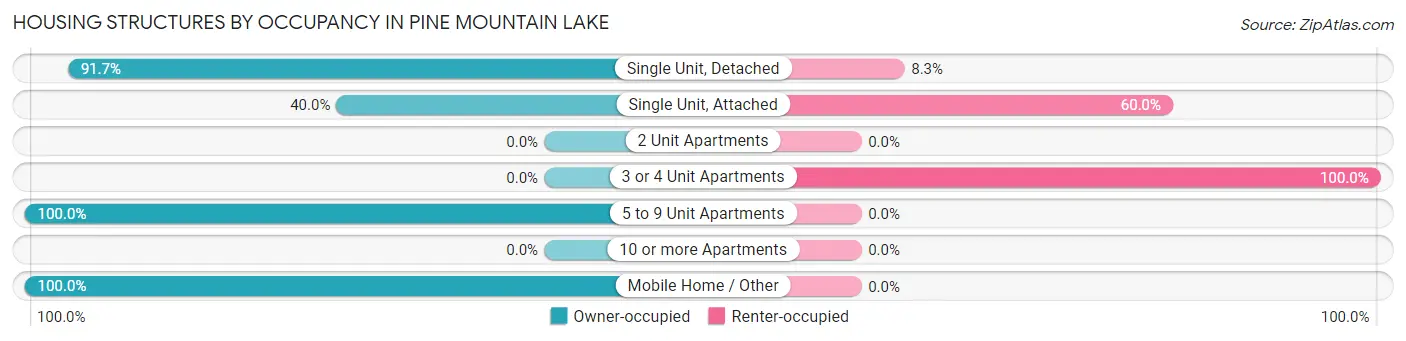
| Structure Type | Owner-occupied | Renter-occupied |
| Single Unit, Detached | 1,171 (91.7%) | 106 (8.3%) |
| Single Unit, Attached | 26 (40.0%) | 39 (60.0%) |
| 2 Unit Apartments | 0 (0.0%) | 0 (0.0%) |
| 3 or 4 Unit Apartments | 0 (0.0%) | 10 (100.0%) |
| 5 to 9 Unit Apartments | 31 (100.0%) | 0 (0.0%) |
| 10 or more Apartments | 0 (0.0%) | 0 (0.0%) |
| Mobile Home / Other | 18 (100.0%) | 0 (0.0%) |
| Total | 1,246 (88.9%) | 155 (11.1%) |
Housing Structures by Number of Rooms in Pine Mountain Lake
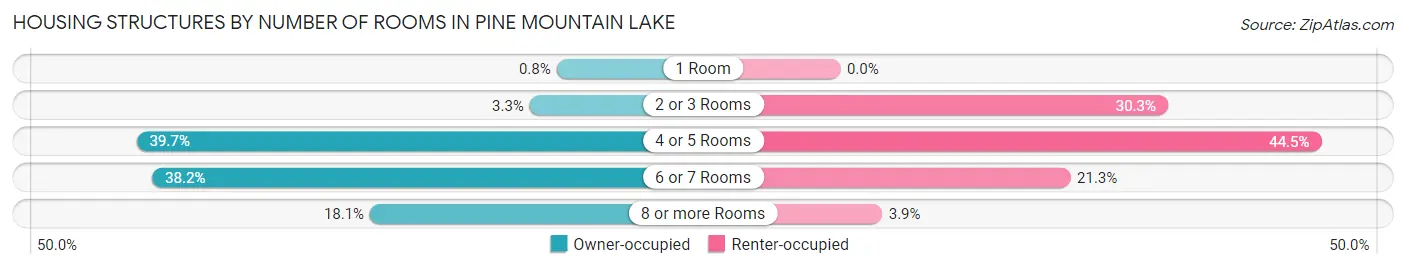
| Number of Rooms | Owner-occupied | Renter-occupied |
| 1 Room | 10 (0.8%) | 0 (0.0%) |
| 2 or 3 Rooms | 41 (3.3%) | 47 (30.3%) |
| 4 or 5 Rooms | 494 (39.7%) | 69 (44.5%) |
| 6 or 7 Rooms | 476 (38.2%) | 33 (21.3%) |
| 8 or more Rooms | 225 (18.1%) | 6 (3.9%) |
| Total | 1,246 (100.0%) | 155 (100.0%) |
Housing Structure by Heating Type in Pine Mountain Lake
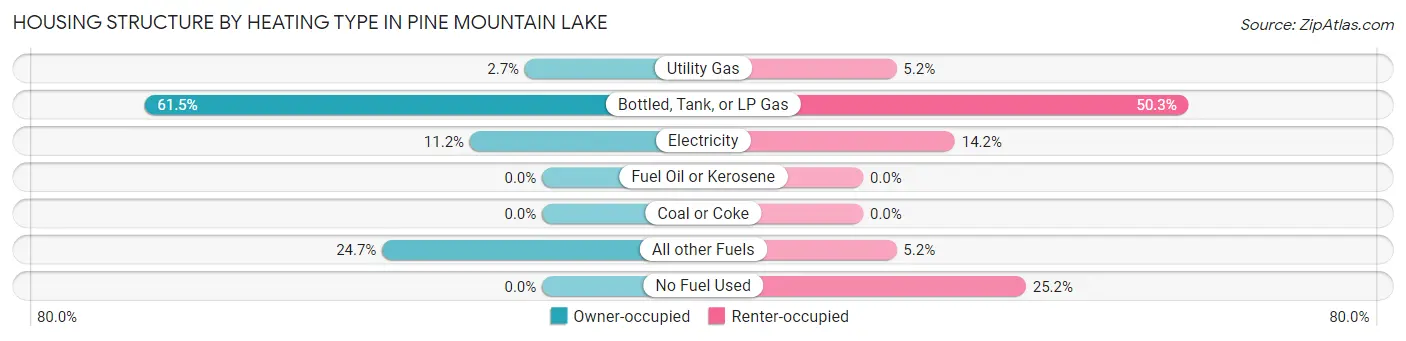
| Heating Type | Owner-occupied | Renter-occupied |
| Utility Gas | 33 (2.6%) | 8 (5.2%) |
| Bottled, Tank, or LP Gas | 766 (61.5%) | 78 (50.3%) |
| Electricity | 139 (11.2%) | 22 (14.2%) |
| Fuel Oil or Kerosene | 0 (0.0%) | 0 (0.0%) |
| Coal or Coke | 0 (0.0%) | 0 (0.0%) |
| All other Fuels | 308 (24.7%) | 8 (5.2%) |
| No Fuel Used | 0 (0.0%) | 39 (25.2%) |
| Total | 1,246 (100.0%) | 155 (100.0%) |
Household Vehicle Usage in Pine Mountain Lake
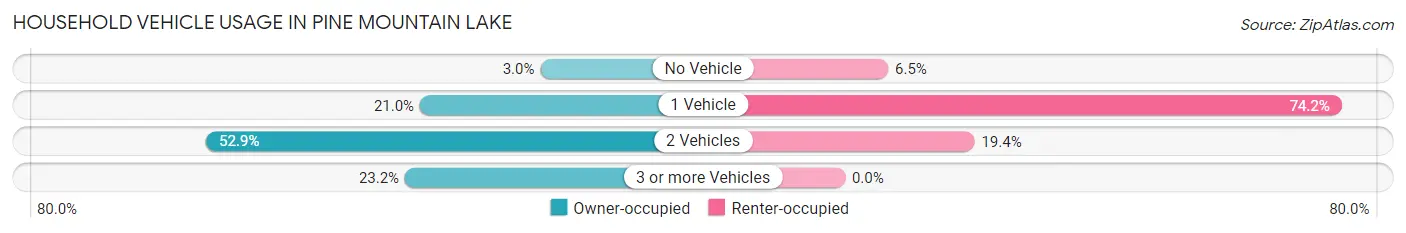
| Vehicles per Household | Owner-occupied | Renter-occupied |
| No Vehicle | 37 (3.0%) | 10 (6.5%) |
| 1 Vehicle | 261 (20.9%) | 115 (74.2%) |
| 2 Vehicles | 659 (52.9%) | 30 (19.4%) |
| 3 or more Vehicles | 289 (23.2%) | 0 (0.0%) |
| Total | 1,246 (100.0%) | 155 (100.0%) |
Real Estate & Mortgages in Pine Mountain Lake
Real Estate and Mortgage Overview in Pine Mountain Lake
| Characteristic | Without Mortgage | With Mortgage |
| Housing Units | 607 | 639 |
| Median Property Value | $346,200 | $403,200 |
| Median Household Income | $64,338 | $179 |
| Monthly Housing Costs | $767 | $169 |
| Real Estate Taxes | $2,406 | $0 |
Property Value by Mortgage Status in Pine Mountain Lake
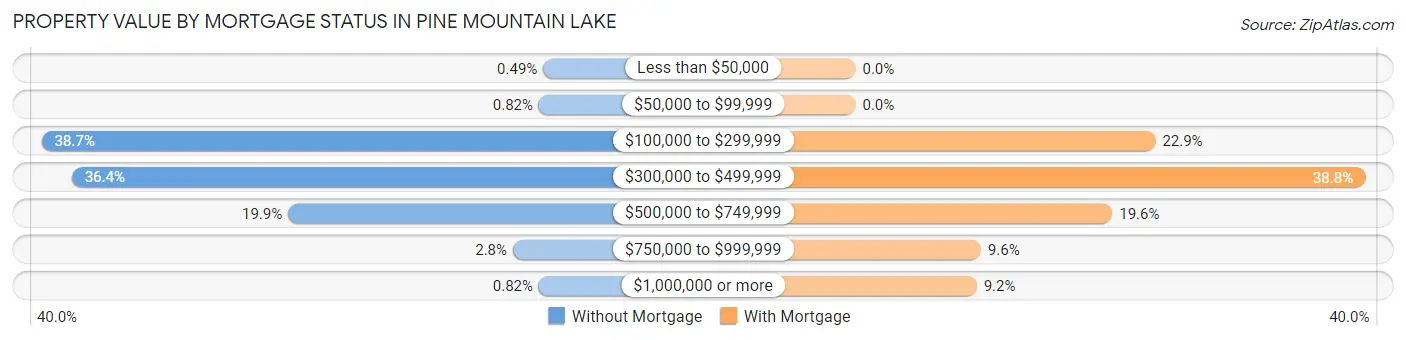
| Property Value | Without Mortgage | With Mortgage |
| Less than $50,000 | 3 (0.5%) | 0 (0.0%) |
| $50,000 to $99,999 | 5 (0.8%) | 0 (0.0%) |
| $100,000 to $299,999 | 235 (38.7%) | 146 (22.9%) |
| $300,000 to $499,999 | 221 (36.4%) | 248 (38.8%) |
| $500,000 to $749,999 | 121 (19.9%) | 125 (19.6%) |
| $750,000 to $999,999 | 17 (2.8%) | 61 (9.6%) |
| $1,000,000 or more | 5 (0.8%) | 59 (9.2%) |
| Total | 607 (100.0%) | 639 (100.0%) |
Household Income by Mortgage Status in Pine Mountain Lake
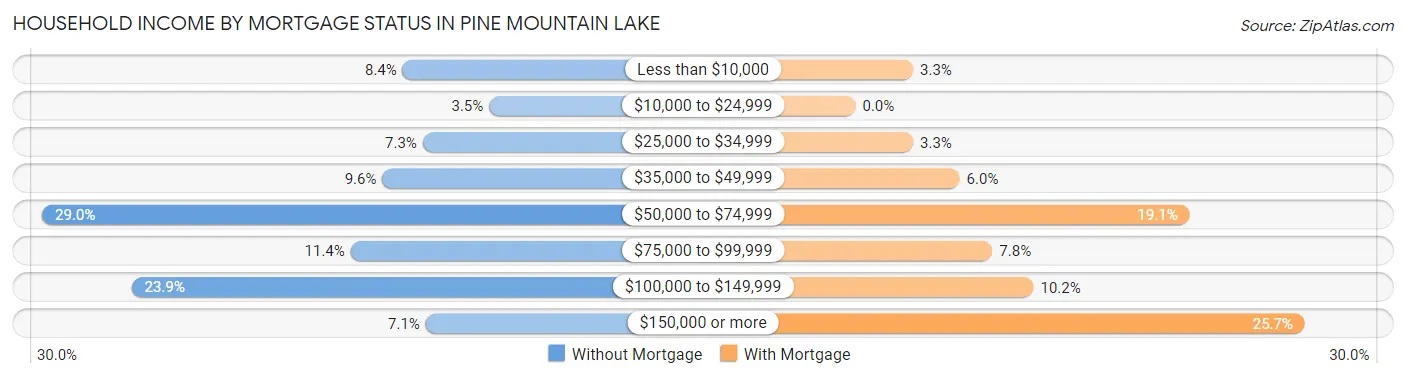
| Household Income | Without Mortgage | With Mortgage |
| Less than $10,000 | 51 (8.4%) | 21 (3.3%) |
| $10,000 to $24,999 | 21 (3.5%) | 0 (0.0%) |
| $25,000 to $34,999 | 44 (7.2%) | 21 (3.3%) |
| $35,000 to $49,999 | 58 (9.6%) | 38 (5.9%) |
| $50,000 to $74,999 | 176 (29.0%) | 122 (19.1%) |
| $75,000 to $99,999 | 69 (11.4%) | 50 (7.8%) |
| $100,000 to $149,999 | 145 (23.9%) | 65 (10.2%) |
| $150,000 or more | 43 (7.1%) | 164 (25.7%) |
| Total | 607 (100.0%) | 639 (100.0%) |
Property Value to Household Income Ratio in Pine Mountain Lake
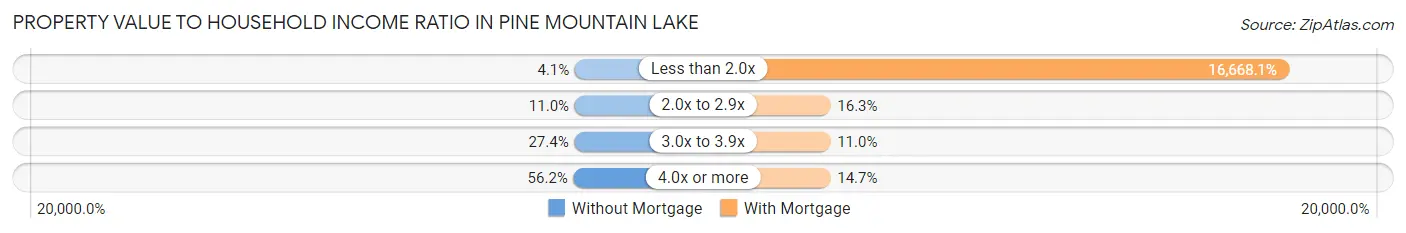
| Value-to-Income Ratio | Without Mortgage | With Mortgage |
| Less than 2.0x | 25 (4.1%) | 106,509 (16,668.1%) |
| 2.0x to 2.9x | 67 (11.0%) | 104 (16.3%) |
| 3.0x to 3.9x | 166 (27.4%) | 70 (11.0%) |
| 4.0x or more | 341 (56.2%) | 94 (14.7%) |
| Total | 607 (100.0%) | 639 (100.0%) |
Real Estate Taxes by Mortgage Status in Pine Mountain Lake
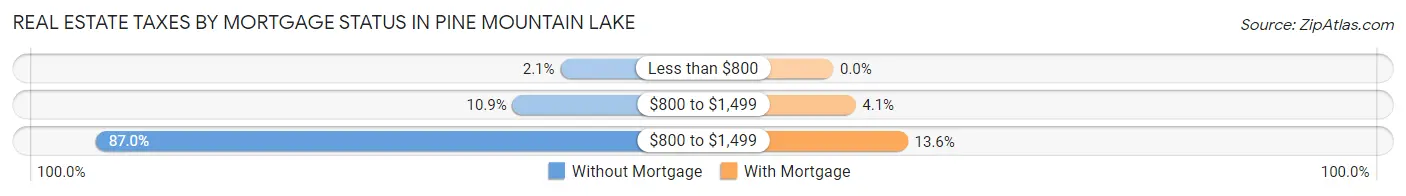
| Property Taxes | Without Mortgage | With Mortgage |
| Less than $800 | 13 (2.1%) | 0 (0.0%) |
| $800 to $1,499 | 66 (10.9%) | 26 (4.1%) |
| $800 to $1,499 | 528 (87.0%) | 87 (13.6%) |
| Total | 607 (100.0%) | 639 (100.0%) |
Health & Disability in Pine Mountain Lake
Health Insurance Coverage by Age in Pine Mountain Lake
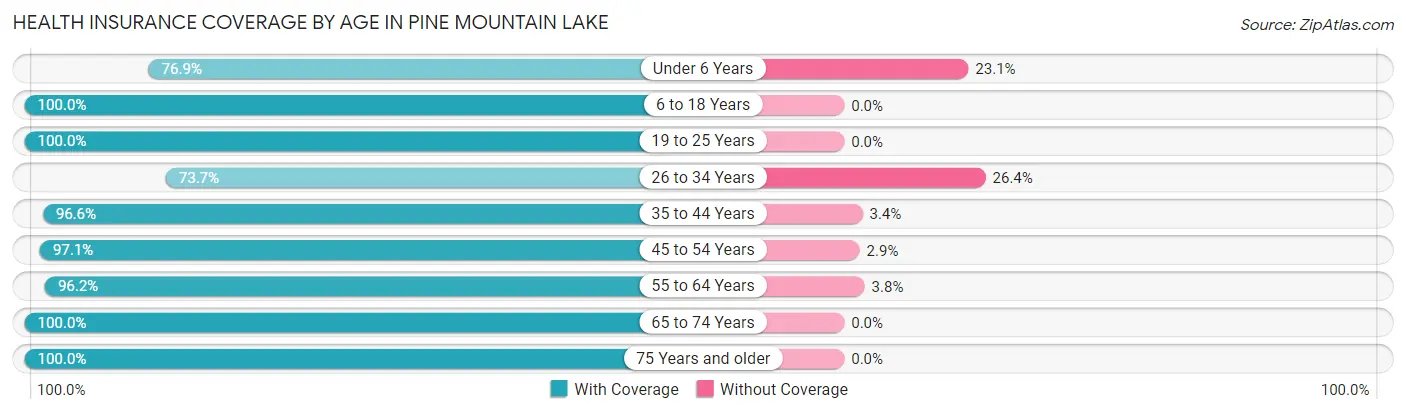
| Age Bracket | With Coverage | Without Coverage |
| Under 6 Years | 93 (76.9%) | 28 (23.1%) |
| 6 to 18 Years | 335 (100.0%) | 0 (0.0%) |
| 19 to 25 Years | 70 (100.0%) | 0 (0.0%) |
| 26 to 34 Years | 109 (73.7%) | 39 (26.4%) |
| 35 to 44 Years | 284 (96.6%) | 10 (3.4%) |
| 45 to 54 Years | 272 (97.1%) | 8 (2.9%) |
| 55 to 64 Years | 456 (96.2%) | 18 (3.8%) |
| 65 to 74 Years | 785 (100.0%) | 0 (0.0%) |
| 75 Years and older | 531 (100.0%) | 0 (0.0%) |
| Total | 2,935 (96.6%) | 103 (3.4%) |
Health Insurance Coverage by Citizenship Status in Pine Mountain Lake
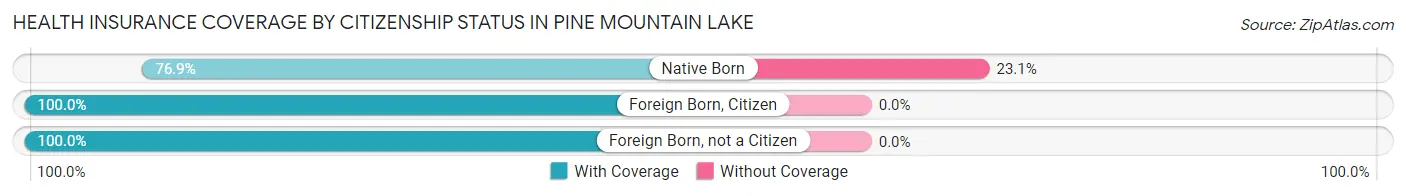
| Citizenship Status | With Coverage | Without Coverage |
| Native Born | 93 (76.9%) | 28 (23.1%) |
| Foreign Born, Citizen | 335 (100.0%) | 0 (0.0%) |
| Foreign Born, not a Citizen | 70 (100.0%) | 0 (0.0%) |
Health Insurance Coverage by Household Income in Pine Mountain Lake
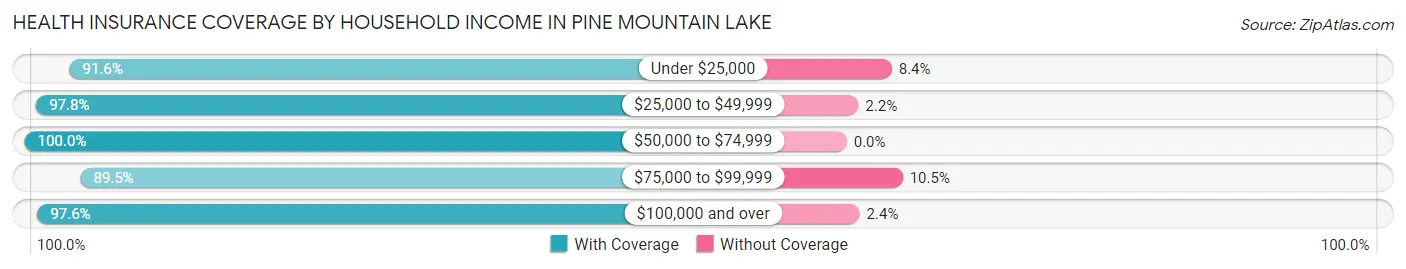
| Household Income | With Coverage | Without Coverage |
| Under $25,000 | 152 (91.6%) | 14 (8.4%) |
| $25,000 to $49,999 | 583 (97.8%) | 13 (2.2%) |
| $50,000 to $74,999 | 511 (100.0%) | 0 (0.0%) |
| $75,000 to $99,999 | 342 (89.5%) | 40 (10.5%) |
| $100,000 and over | 1,294 (97.6%) | 32 (2.4%) |
Public vs Private Health Insurance Coverage by Age in Pine Mountain Lake
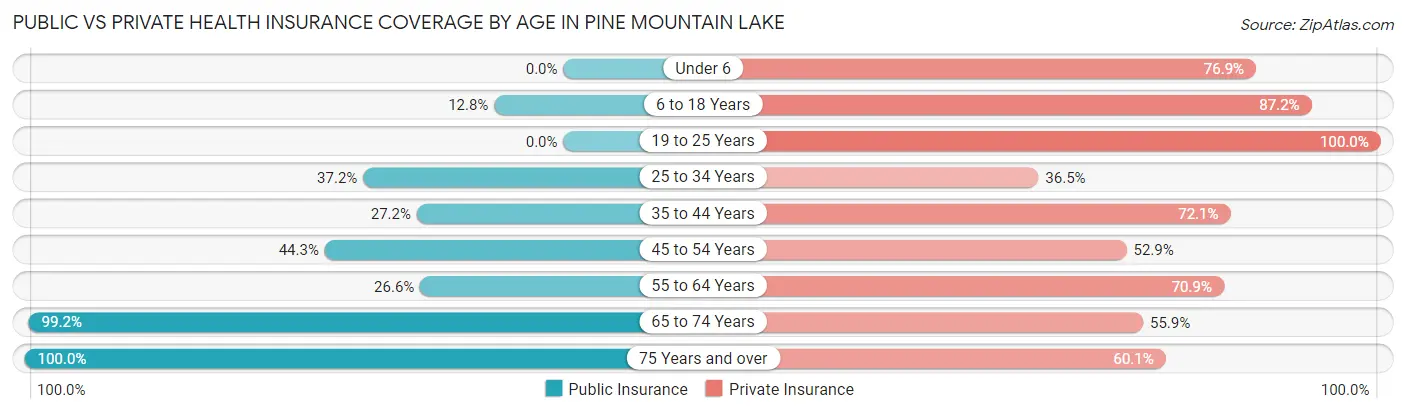
| Age Bracket | Public Insurance | Private Insurance |
| Under 6 | 0 (0.0%) | 93 (76.9%) |
| 6 to 18 Years | 43 (12.8%) | 292 (87.2%) |
| 19 to 25 Years | 0 (0.0%) | 70 (100.0%) |
| 25 to 34 Years | 55 (37.2%) | 54 (36.5%) |
| 35 to 44 Years | 80 (27.2%) | 212 (72.1%) |
| 45 to 54 Years | 124 (44.3%) | 148 (52.9%) |
| 55 to 64 Years | 126 (26.6%) | 336 (70.9%) |
| 65 to 74 Years | 779 (99.2%) | 439 (55.9%) |
| 75 Years and over | 531 (100.0%) | 319 (60.1%) |
| Total | 1,738 (57.2%) | 1,963 (64.6%) |
Disability Status by Sex by Age in Pine Mountain Lake
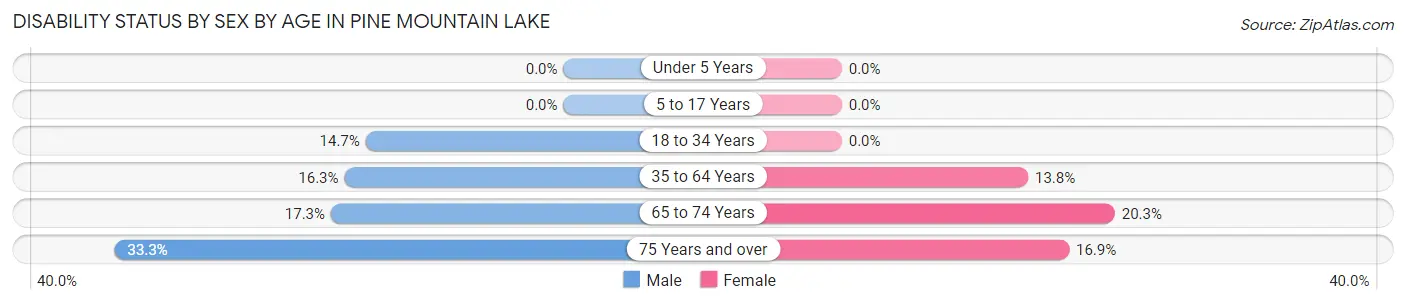
| Age Bracket | Male | Female |
| Under 5 Years | 0 (0.0%) | 0 (0.0%) |
| 5 to 17 Years | 0 (0.0%) | 0 (0.0%) |
| 18 to 34 Years | 32 (14.7%) | 0 (0.0%) |
| 35 to 64 Years | 94 (16.3%) | 65 (13.8%) |
| 65 to 74 Years | 58 (17.3%) | 91 (20.3%) |
| 75 Years and over | 94 (33.3%) | 42 (16.9%) |
Disability Class by Sex by Age in Pine Mountain Lake
Disability Class: Hearing Difficulty
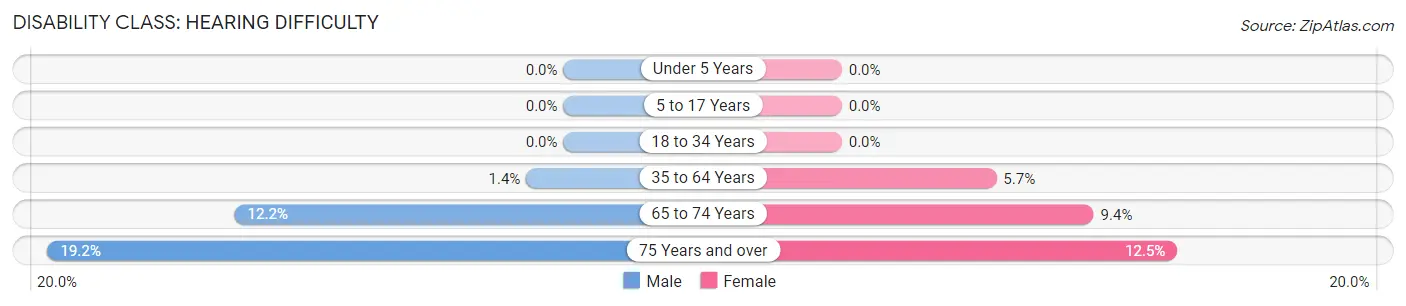
| Age Bracket | Male | Female |
| Under 5 Years | 0 (0.0%) | 0 (0.0%) |
| 5 to 17 Years | 0 (0.0%) | 0 (0.0%) |
| 18 to 34 Years | 0 (0.0%) | 0 (0.0%) |
| 35 to 64 Years | 8 (1.4%) | 27 (5.7%) |
| 65 to 74 Years | 41 (12.2%) | 42 (9.3%) |
| 75 Years and over | 54 (19.2%) | 31 (12.4%) |
Disability Class: Vision Difficulty
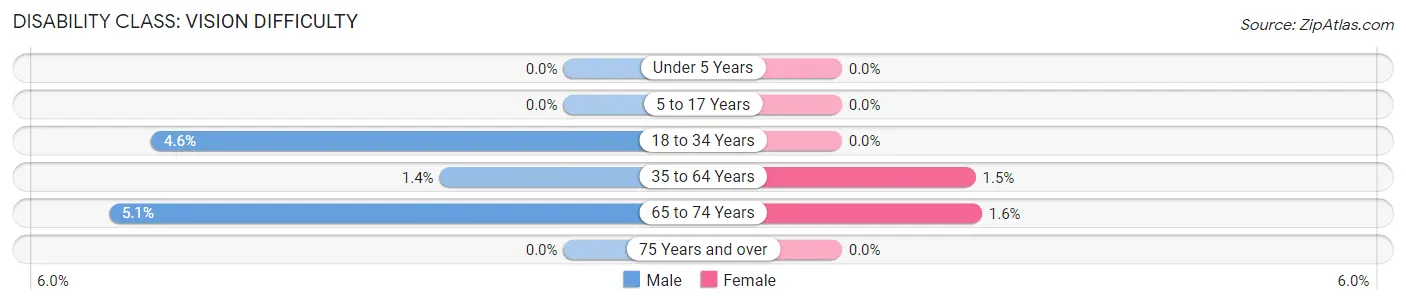
| Age Bracket | Male | Female |
| Under 5 Years | 0 (0.0%) | 0 (0.0%) |
| 5 to 17 Years | 0 (0.0%) | 0 (0.0%) |
| 18 to 34 Years | 10 (4.6%) | 0 (0.0%) |
| 35 to 64 Years | 8 (1.4%) | 7 (1.5%) |
| 65 to 74 Years | 17 (5.1%) | 7 (1.6%) |
| 75 Years and over | 0 (0.0%) | 0 (0.0%) |
Disability Class: Cognitive Difficulty
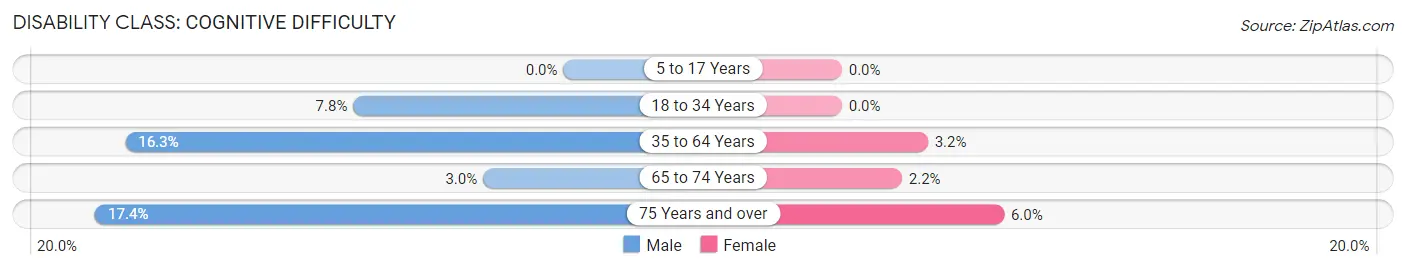
| Age Bracket | Male | Female |
| 5 to 17 Years | 0 (0.0%) | 0 (0.0%) |
| 18 to 34 Years | 17 (7.8%) | 0 (0.0%) |
| 35 to 64 Years | 94 (16.3%) | 15 (3.2%) |
| 65 to 74 Years | 10 (3.0%) | 10 (2.2%) |
| 75 Years and over | 49 (17.4%) | 15 (6.0%) |
Disability Class: Ambulatory Difficulty
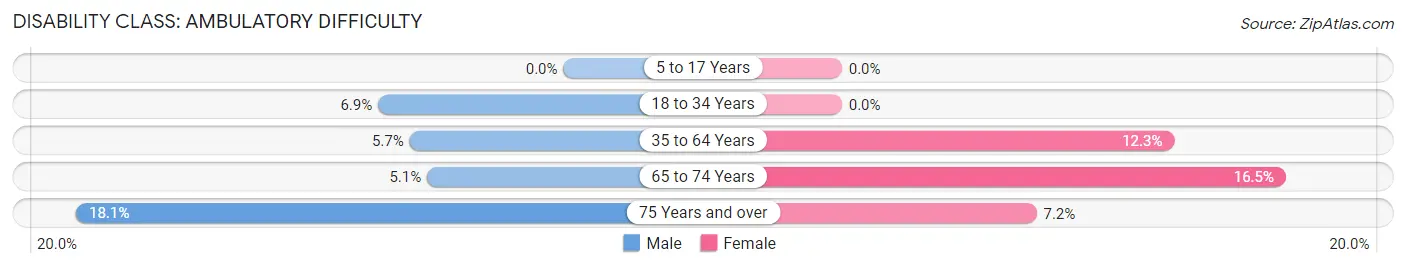
| Age Bracket | Male | Female |
| 5 to 17 Years | 0 (0.0%) | 0 (0.0%) |
| 18 to 34 Years | 15 (6.9%) | 0 (0.0%) |
| 35 to 64 Years | 33 (5.7%) | 58 (12.3%) |
| 65 to 74 Years | 17 (5.1%) | 74 (16.5%) |
| 75 Years and over | 51 (18.1%) | 18 (7.2%) |
Disability Class: Self-Care Difficulty
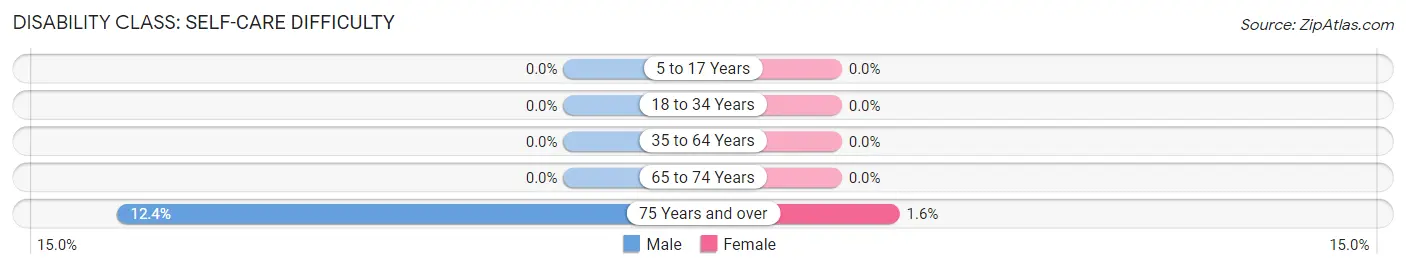
| Age Bracket | Male | Female |
| 5 to 17 Years | 0 (0.0%) | 0 (0.0%) |
| 18 to 34 Years | 0 (0.0%) | 0 (0.0%) |
| 35 to 64 Years | 0 (0.0%) | 0 (0.0%) |
| 65 to 74 Years | 0 (0.0%) | 0 (0.0%) |
| 75 Years and over | 35 (12.4%) | 4 (1.6%) |
Technology Access in Pine Mountain Lake
Computing Device Access in Pine Mountain Lake
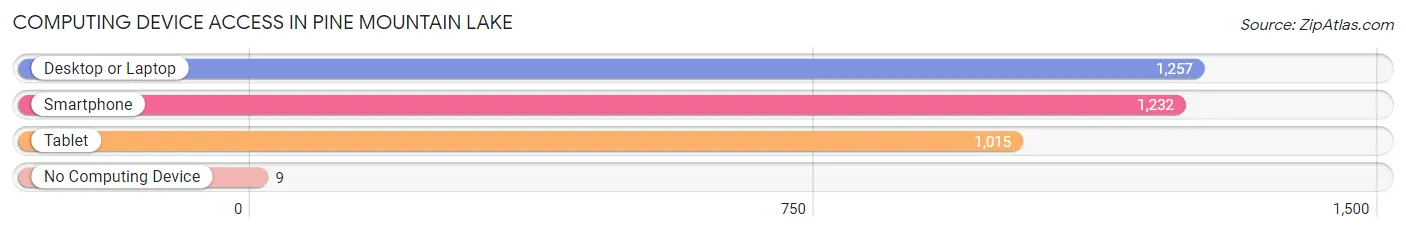
| Device Type | # Households | % Households |
| Desktop or Laptop | 1,257 | 89.7% |
| Smartphone | 1,232 | 87.9% |
| Tablet | 1,015 | 72.5% |
| No Computing Device | 9 | 0.6% |
| Total | 1,401 | 100.0% |
Internet Access in Pine Mountain Lake
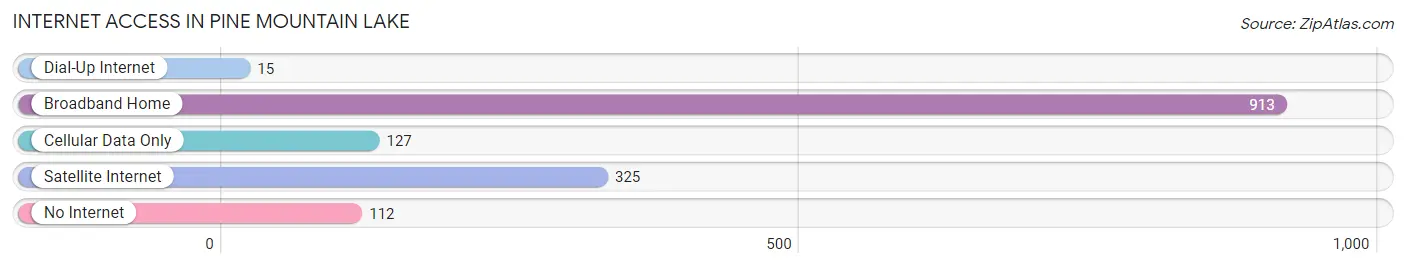
| Internet Type | # Households | % Households |
| Dial-Up Internet | 15 | 1.1% |
| Broadband Home | 913 | 65.2% |
| Cellular Data Only | 127 | 9.1% |
| Satellite Internet | 325 | 23.2% |
| No Internet | 112 | 8.0% |
| Total | 1,401 | 100.0% |
Pine Mountain Lake Summary
Pine Mountain Lake is a census-designated place located in Tuolumne County, California. It is situated in the Sierra Nevada foothills, approximately 25 miles east of Sonora and 25 miles west of Yosemite National Park. The community is located in the foothills of the Sierra Nevada Mountains, at an elevation of 2,400 feet. The population of Pine Mountain Lake was 1,845 at the 2010 census.
History
The area that is now Pine Mountain Lake was originally inhabited by the Miwok Native Americans. The first European settlers arrived in the area in the late 1800s, and the area was known as “Pine Mountain”. In the early 1900s, the area was developed as a summer resort, and the name was changed to “Pine Mountain Lake”. The first homes were built in the 1920s, and the community was incorporated in 1962.
Geography
Pine Mountain Lake is located in the Sierra Nevada foothills, at an elevation of 2,400 feet. The community is situated on the western shore of Pine Mountain Lake, a man-made lake that was created in the early 1900s. The lake is approximately 1,400 acres in size, and is a popular destination for fishing, boating, and other recreational activities. The lake is fed by several creeks, including the Tuolumne River.
The community is surrounded by the Stanislaus National Forest, and is located approximately 25 miles east of Sonora and 25 miles west of Yosemite National Park. The area is known for its scenic beauty, and is a popular destination for outdoor recreation.
Economy
The economy of Pine Mountain Lake is largely based on tourism and recreation. The community is a popular destination for outdoor recreation, and is home to several resorts, campgrounds, and other tourist attractions. The area is also home to several wineries, and is a popular destination for wine tasting.
The community is also home to several businesses, including restaurants, retail stores, and other services. The area is also home to several small businesses, including construction companies, landscaping companies, and other service providers.
Demographics
As of the 2010 census, the population of Pine Mountain Lake was 1,845. The racial makeup of the community was 94.3% White, 0.7% African American, 0.7% Native American, 0.7% Asian, 0.2% Pacific Islander, 1.2% from other races, and 2.1% from two or more races. Hispanic or Latino of any race were 4.2% of the population.
The median income for a household in Pine Mountain Lake was $50,938, and the median income for a family was $58,750. The per capita income for the community was $27,945. About 8.3% of families and 10.2% of the population were below the poverty line, including 14.2% of those under age 18 and 4.2% of those age 65 or over.
Common Questions
What is Per Capita Income in Pine Mountain Lake?
Per Capita income in Pine Mountain Lake is $45,237.
What is the Median Family Income in Pine Mountain Lake?
Median Family Income in Pine Mountain Lake is $84,605.
What is the Median Household income in Pine Mountain Lake?
Median Household Income in Pine Mountain Lake is $73,125.
What is Income or Wage Gap in Pine Mountain Lake?
Income or Wage Gap in Pine Mountain Lake is 25.8%.
Women in Pine Mountain Lake earn 74.2 cents for every dollar earned by a man.
What is Inequality or Gini Index in Pine Mountain Lake?
Inequality or Gini Index in Pine Mountain Lake is 0.42.
What is the Total Population of Pine Mountain Lake?
Total Population of Pine Mountain Lake is 3,038.
What is the Total Male Population of Pine Mountain Lake?
Total Male Population of Pine Mountain Lake is 1,575.
What is the Total Female Population of Pine Mountain Lake?
Total Female Population of Pine Mountain Lake is 1,463.
What is the Ratio of Males per 100 Females in Pine Mountain Lake?
There are 107.66 Males per 100 Females in Pine Mountain Lake.
What is the Ratio of Females per 100 Males in Pine Mountain Lake?
There are 92.89 Females per 100 Males in Pine Mountain Lake.
What is the Median Population Age in Pine Mountain Lake?
Median Population Age in Pine Mountain Lake is 62.5 Years.
What is the Average Family Size in Pine Mountain Lake
Average Family Size in Pine Mountain Lake is 2.6 People.
What is the Average Household Size in Pine Mountain Lake
Average Household Size in Pine Mountain Lake is 2.1 People.
How Large is the Labor Force in Pine Mountain Lake?
There are 1,027 People in the Labor Forcein in Pine Mountain Lake.
What is the Percentage of People in the Labor Force in Pine Mountain Lake?
38.5% of People are in the Labor Force in Pine Mountain Lake.
What is the Unemployment Rate in Pine Mountain Lake?
Unemployment Rate in Pine Mountain Lake is 7.1%.