Loomis, CA Map & Demographics
Loomis Map
Loomis Overview
$63,572
PER CAPITA INCOME
$140,750
AVG FAMILY INCOME
$100,159
AVG HOUSEHOLD INCOME
26.1%
WAGE / INCOME GAP [ % ]
73.9¢/ $1
WAGE / INCOME GAP [ $ ]
0.57
INEQUALITY / GINI INDEX
6,831
TOTAL POPULATION
3,772
MALE POPULATION
3,059
FEMALE POPULATION
123.31
MALES / 100 FEMALES
81.10
FEMALES / 100 MALES
46.6
MEDIAN AGE
3.0
AVG FAMILY SIZE
2.4
AVG HOUSEHOLD SIZE
3,089
LABOR FORCE [ PEOPLE ]
53.7%
PERCENT IN LABOR FORCE
4.0%
UNEMPLOYMENT RATE
Loomis Zip Codes
Loomis Area Codes
Income in Loomis
Income Overview in Loomis
Per Capita Income in Loomis is $63,572, while median incomes of families and households are $140,750 and $100,159 respectively.
| Characteristic | Number | Measure |
| Per Capita Income | 6,831 | $63,572 |
| Median Family Income | 1,768 | $140,750 |
| Mean Family Income | 1,768 | $194,028 |
| Median Household Income | 2,867 | $100,159 |
| Mean Household Income | 2,867 | $147,800 |
| Income Deficit | 1,768 | $0 |
| Wage / Income Gap (%) | 6,831 | 26.08% |
| Wage / Income Gap ($) | 6,831 | 73.92¢ per $1 |
| Gini / Inequality Index | 6,831 | 0.57 |
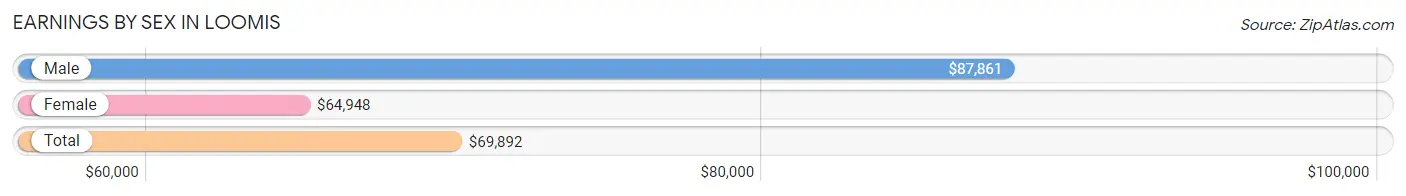
Earnings by Sex in Loomis
Average Earnings in Loomis are $69,892, $87,861 for men and $64,948 for women, a difference of 26.1%.
| Sex | Number | Average Earnings |
| Male | 2,034 (59.7%) | $87,861 |
| Female | 1,371 (40.3%) | $64,948 |
| Total | 3,405 (100.0%) | $69,892 |
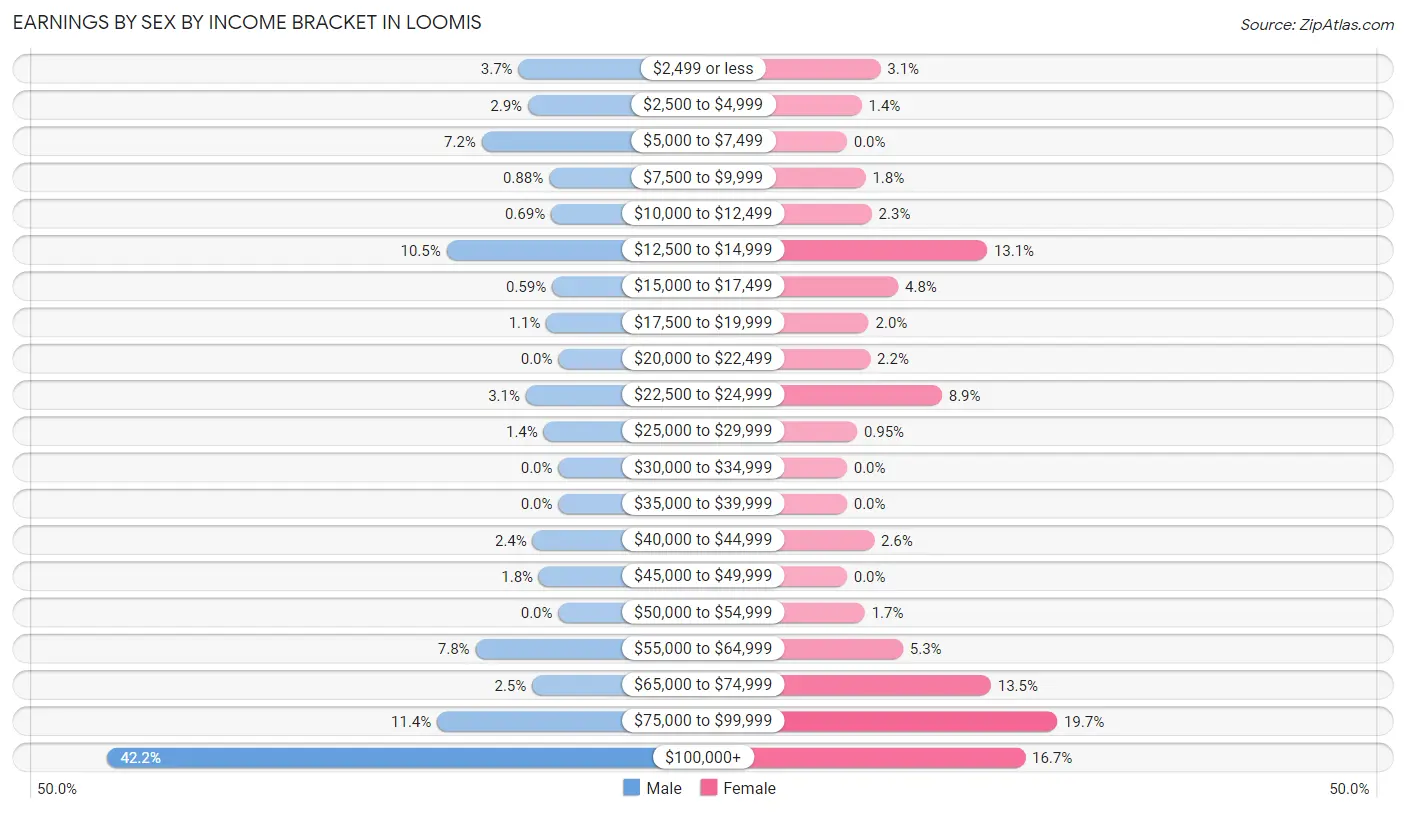
Earnings by Sex by Income Bracket in Loomis
The most common earnings brackets in Loomis are $100,000+ for men (859 | 42.2%) and $75,000 to $99,999 for women (270 | 19.7%).
| Income | Male | Female |
| $2,499 or less | 76 (3.7%) | 43 (3.1%) |
| $2,500 to $4,999 | 58 (2.9%) | 19 (1.4%) |
| $5,000 to $7,499 | 146 (7.2%) | 0 (0.0%) |
| $7,500 to $9,999 | 18 (0.9%) | 24 (1.8%) |
| $10,000 to $12,499 | 14 (0.7%) | 32 (2.3%) |
| $12,500 to $14,999 | 213 (10.5%) | 180 (13.1%) |
| $15,000 to $17,499 | 12 (0.6%) | 66 (4.8%) |
| $17,500 to $19,999 | 23 (1.1%) | 28 (2.0%) |
| $20,000 to $22,499 | 0 (0.0%) | 30 (2.2%) |
| $22,500 to $24,999 | 62 (3.0%) | 122 (8.9%) |
| $25,000 to $29,999 | 28 (1.4%) | 13 (0.9%) |
| $30,000 to $34,999 | 0 (0.0%) | 0 (0.0%) |
| $35,000 to $39,999 | 0 (0.0%) | 0 (0.0%) |
| $40,000 to $44,999 | 49 (2.4%) | 35 (2.5%) |
| $45,000 to $49,999 | 37 (1.8%) | 0 (0.0%) |
| $50,000 to $54,999 | 0 (0.0%) | 23 (1.7%) |
| $55,000 to $64,999 | 158 (7.8%) | 72 (5.2%) |
| $65,000 to $74,999 | 50 (2.5%) | 185 (13.5%) |
| $75,000 to $99,999 | 231 (11.4%) | 270 (19.7%) |
| $100,000+ | 859 (42.2%) | 229 (16.7%) |
| Total | 2,034 (100.0%) | 1,371 (100.0%) |
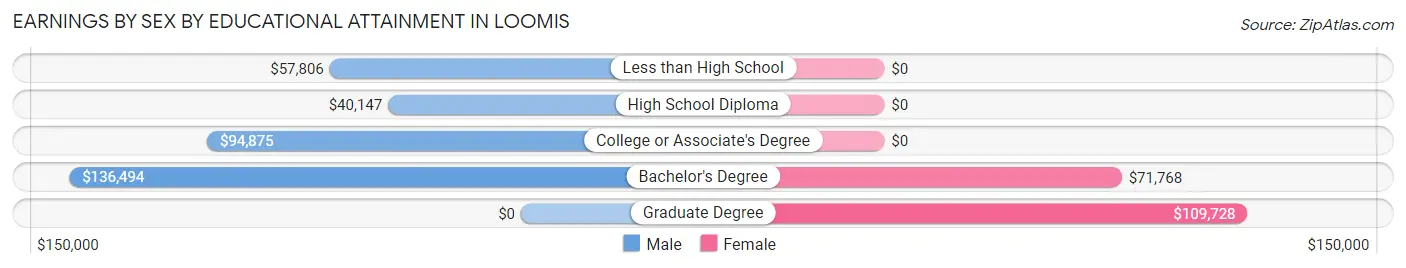
Earnings by Sex by Educational Attainment in Loomis
Average earnings in Loomis are $99,265 for men and $67,850 for women, a difference of 31.7%. Men with an educational attainment of bachelor's degree enjoy the highest average annual earnings of $136,494, while those with high school diploma education earn the least with $40,147. Women with an educational attainment of graduate degree earn the most with the average annual earnings of $109,728, while those with bachelor's degree education have the smallest earnings of $71,768.
| Educational Attainment | Male Income | Female Income |
| Less than High School | $57,806 | $0 |
| High School Diploma | $40,147 | $0 |
| College or Associate's Degree | $94,875 | $0 |
| Bachelor's Degree | $136,494 | $71,768 |
| Graduate Degree | - | - |
| Total | $99,265 | $67,850 |
Family Income in Loomis
Family Income Brackets in Loomis
According to the Loomis family income data, there are 546 families falling into the $200,000+ income range, which is the most common income bracket and makes up 30.9% of all families. Conversely, the $10,000 to $14,999 income bracket is the least frequent group with only 25 families (1.4%) belonging to this category.
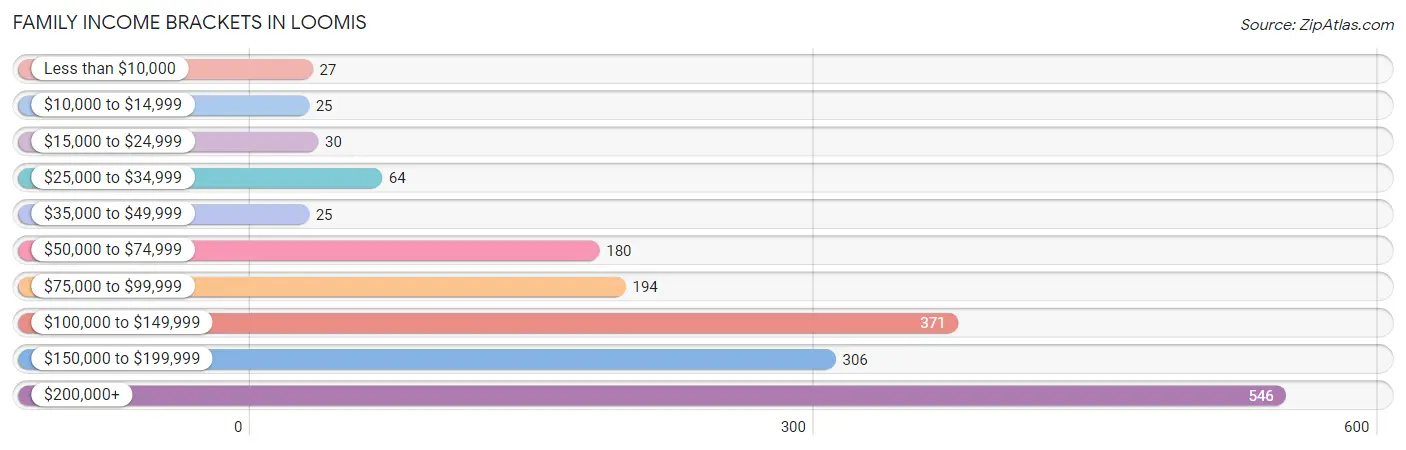
| Income Bracket | # Families | % Families |
| Less than $10,000 | 27 | 1.5% |
| $10,000 to $14,999 | 25 | 1.4% |
| $15,000 to $24,999 | 30 | 1.7% |
| $25,000 to $34,999 | 64 | 3.6% |
| $35,000 to $49,999 | 25 | 1.4% |
| $50,000 to $74,999 | 180 | 10.2% |
| $75,000 to $99,999 | 194 | 11.0% |
| $100,000 to $149,999 | 371 | 21.0% |
| $150,000 to $199,999 | 306 | 17.3% |
| $200,000+ | 546 | 30.9% |
Family Income by Famaliy Size in Loomis
5-person families (182 | 10.3%) account for the highest median family income in Loomis with $230,633 per family, while 2-person families (892 | 50.4%) have the highest median income of $56,296 per family member.
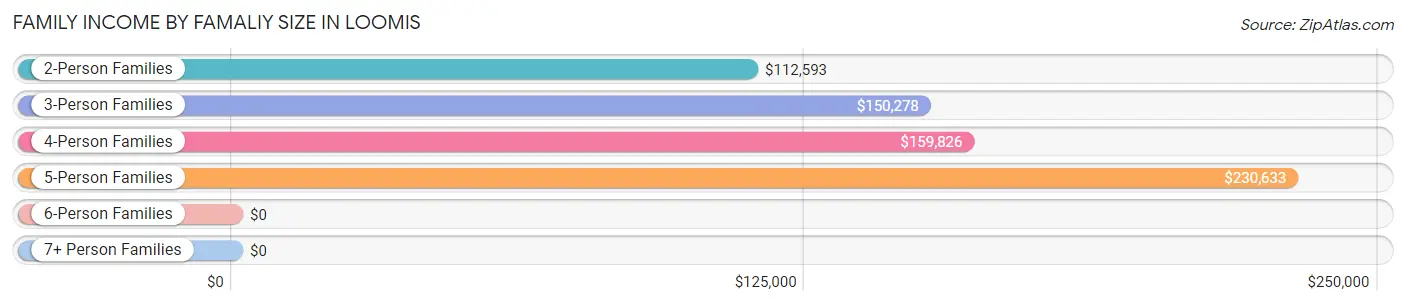
| Income Bracket | # Families | Median Income |
| 2-Person Families | 892 (50.4%) | $112,593 |
| 3-Person Families | 342 (19.3%) | $150,278 |
| 4-Person Families | 329 (18.6%) | $159,826 |
| 5-Person Families | 182 (10.3%) | $230,633 |
| 6-Person Families | 0 (0.0%) | $0 |
| 7+ Person Families | 23 (1.3%) | $0 |
| Total | 1,768 (100.0%) | $140,750 |
Family Income by Number of Earners in Loomis
The median family income in Loomis is $140,750, with families comprising 3+ earners (224) having the highest median family income of $222,761, while families with no earners (359) have the lowest median family income of $83,778, accounting for 12.7% and 20.3% of families, respectively.
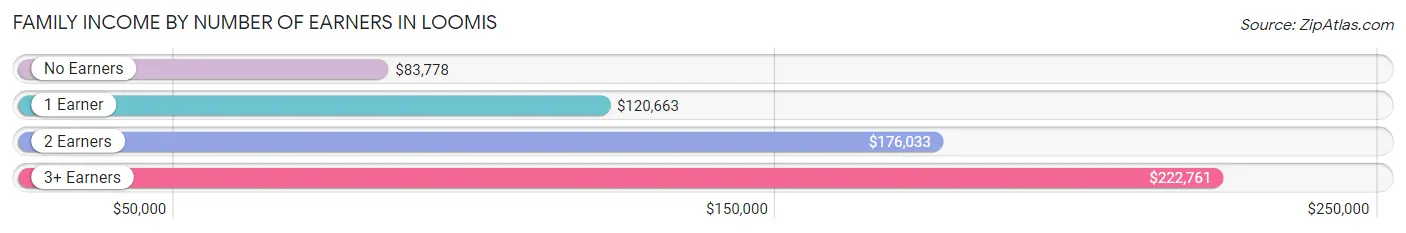
| Number of Earners | # Families | Median Income |
| No Earners | 359 (20.3%) | $83,778 |
| 1 Earner | 434 (24.5%) | $120,663 |
| 2 Earners | 751 (42.5%) | $176,033 |
| 3+ Earners | 224 (12.7%) | $222,761 |
| Total | 1,768 (100.0%) | $140,750 |
Household Income in Loomis
Household Income Brackets in Loomis
With 588 households falling in the category, the $200,000+ income range is the most frequent in Loomis, accounting for 20.5% of all households. In contrast, only 23 households (0.8%) fall into the $10,000 to $14,999 income bracket, making it the least populous group.
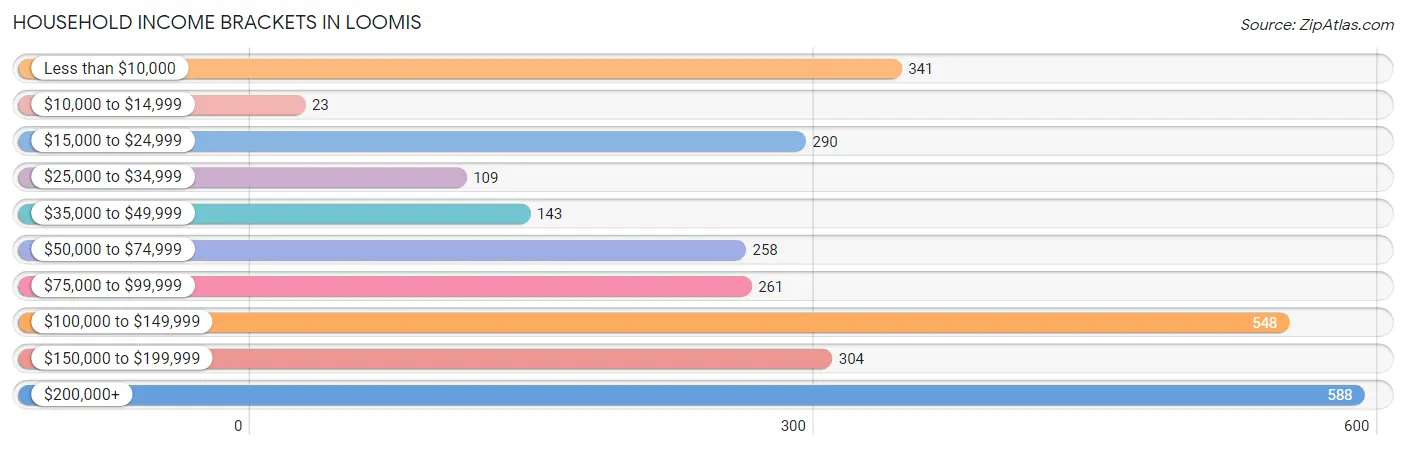
| Income Bracket | # Households | % Households |
| Less than $10,000 | 341 | 11.9% |
| $10,000 to $14,999 | 23 | 0.8% |
| $15,000 to $24,999 | 290 | 10.1% |
| $25,000 to $34,999 | 109 | 3.8% |
| $35,000 to $49,999 | 143 | 5.0% |
| $50,000 to $74,999 | 258 | 9.0% |
| $75,000 to $99,999 | 261 | 9.1% |
| $100,000 to $149,999 | 548 | 19.1% |
| $150,000 to $199,999 | 304 | 10.6% |
| $200,000+ | 588 | 20.5% |
Household Income by Householder Age in Loomis
The median household income in Loomis is $100,159, with the highest median household income of $169,341 found in the 25 to 44 years age bracket for the primary householder. A total of 515 households (18.0%) fall into this category. Meanwhile, the 15 to 24 years age bracket for the primary householder has the lowest median household income of $0, with 20 households (0.7%) in this group.
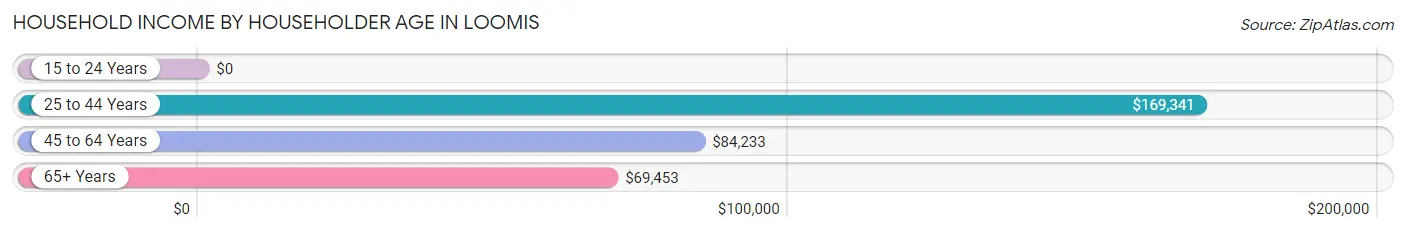
| Income Bracket | # Households | Median Income |
| 15 to 24 Years | 20 (0.7%) | $0 |
| 25 to 44 Years | 515 (18.0%) | $169,341 |
| 45 to 64 Years | 1,361 (47.5%) | $84,233 |
| 65+ Years | 971 (33.9%) | $69,453 |
| Total | 2,867 (100.0%) | $100,159 |
Poverty in Loomis
Income Below Poverty by Sex and Age in Loomis
With 9.8% poverty level for males and 8.0% for females among the residents of Loomis, 55 to 64 year old males and 18 to 24 year old females are the most vulnerable to poverty, with 259 males (57.2%) and 20 females (32.8%) in their respective age groups living below the poverty level.
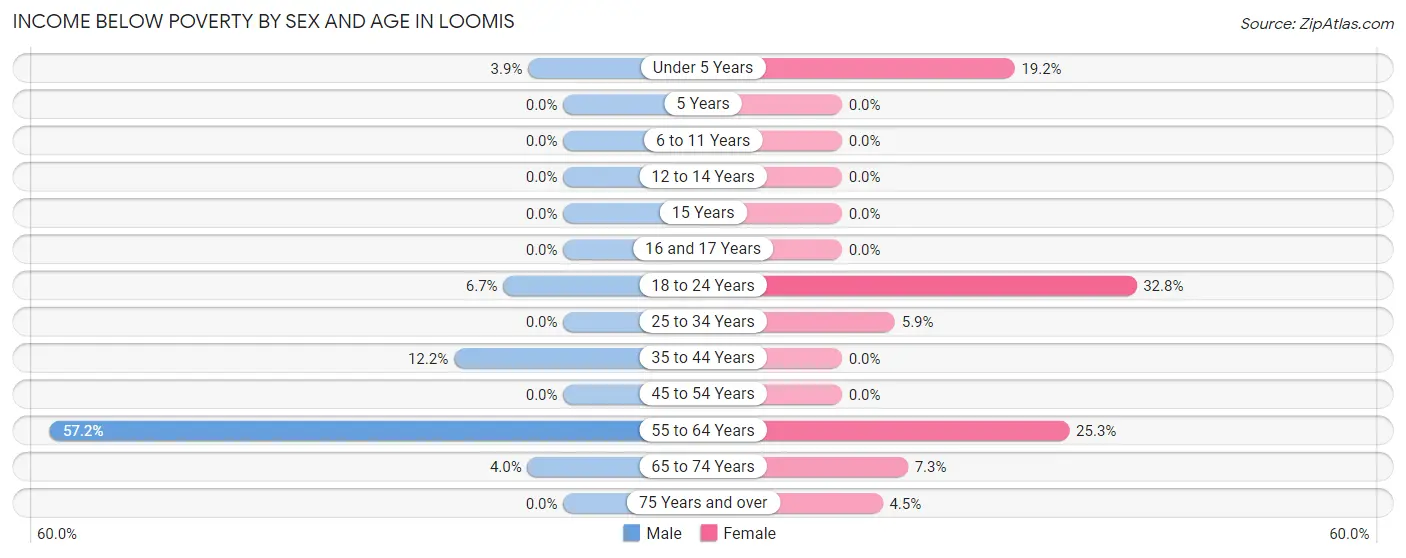
| Age Bracket | Male | Female |
| Under 5 Years | 9 (3.9%) | 10 (19.2%) |
| 5 Years | 0 (0.0%) | 0 (0.0%) |
| 6 to 11 Years | 0 (0.0%) | 0 (0.0%) |
| 12 to 14 Years | 0 (0.0%) | 0 (0.0%) |
| 15 Years | 0 (0.0%) | 0 (0.0%) |
| 16 and 17 Years | 0 (0.0%) | 0 (0.0%) |
| 18 to 24 Years | 32 (6.7%) | 20 (32.8%) |
| 25 to 34 Years | 0 (0.0%) | 21 (5.9%) |
| 35 to 44 Years | 53 (12.2%) | 0 (0.0%) |
| 45 to 54 Years | 0 (0.0%) | 0 (0.0%) |
| 55 to 64 Years | 259 (57.2%) | 137 (25.3%) |
| 65 to 74 Years | 14 (4.0%) | 38 (7.3%) |
| 75 Years and over | 0 (0.0%) | 17 (4.5%) |
| Total | 367 (9.8%) | 243 (8.0%) |
Income Above Poverty by Sex and Age in Loomis
According to the poverty statistics in Loomis, males aged 5 years and females aged 5 years are the age groups that are most secure financially, with 100.0% of males and 100.0% of females in these age groups living above the poverty line.
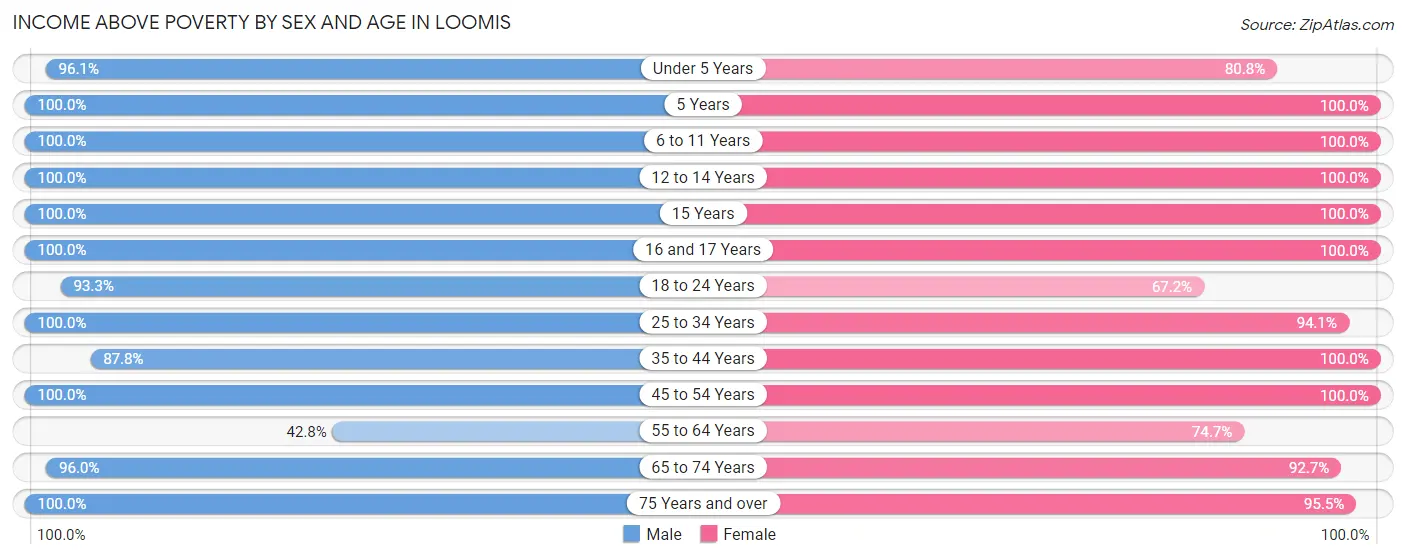
| Age Bracket | Male | Female |
| Under 5 Years | 221 (96.1%) | 42 (80.8%) |
| 5 Years | 16 (100.0%) | 11 (100.0%) |
| 6 to 11 Years | 350 (100.0%) | 103 (100.0%) |
| 12 to 14 Years | 116 (100.0%) | 78 (100.0%) |
| 15 Years | 82 (100.0%) | 18 (100.0%) |
| 16 and 17 Years | 66 (100.0%) | 147 (100.0%) |
| 18 to 24 Years | 448 (93.3%) | 41 (67.2%) |
| 25 to 34 Years | 259 (100.0%) | 335 (94.1%) |
| 35 to 44 Years | 382 (87.8%) | 322 (100.0%) |
| 45 to 54 Years | 677 (100.0%) | 456 (100.0%) |
| 55 to 64 Years | 194 (42.8%) | 404 (74.7%) |
| 65 to 74 Years | 337 (96.0%) | 480 (92.7%) |
| 75 Years and over | 235 (100.0%) | 358 (95.5%) |
| Total | 3,383 (90.2%) | 2,795 (92.0%) |
Income Below Poverty Among Married-Couple Families in Loomis
The poverty statistics for married-couple families in Loomis show that 0.9% or 14 of the total 1,533 families live below the poverty line. Families with no children have the highest poverty rate of 1.7%, comprising of 14 families. On the other hand, families with 1 or 2 children have the lowest poverty rate of 0.0%, which includes 0 families.
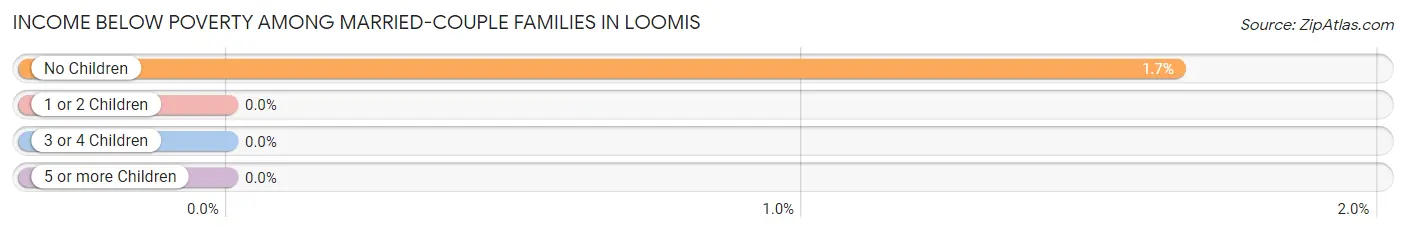
| Children | Above Poverty | Below Poverty |
| No Children | 837 (98.4%) | 14 (1.7%) |
| 1 or 2 Children | 539 (100.0%) | 0 (0.0%) |
| 3 or 4 Children | 143 (100.0%) | 0 (0.0%) |
| 5 or more Children | 0 (0.0%) | 0 (0.0%) |
| Total | 1,519 (99.1%) | 14 (0.9%) |
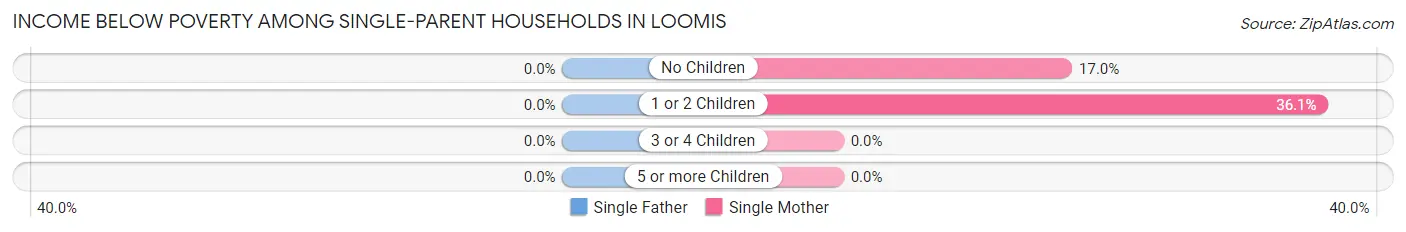
Income Below Poverty Among Single-Parent Households in Loomis
| Children | Single Father | Single Mother |
| No Children | 0 (0.0%) | 24 (17.0%) |
| 1 or 2 Children | 0 (0.0%) | 13 (36.1%) |
| 3 or 4 Children | 0 (0.0%) | 0 (0.0%) |
| 5 or more Children | 0 (0.0%) | 0 (0.0%) |
| Total | 0 (0.0%) | 37 (20.9%) |
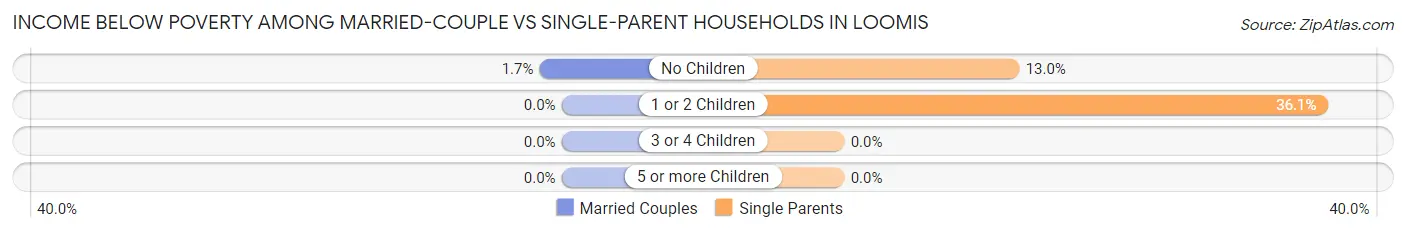
Income Below Poverty Among Married-Couple vs Single-Parent Households in Loomis
The poverty data for Loomis shows that 14 of the married-couple family households (0.9%) and 37 of the single-parent households (15.7%) are living below the poverty level. Within the married-couple family households, those with no children have the highest poverty rate, with 14 households (1.7%) falling below the poverty line. Among the single-parent households, those with 1 or 2 children have the highest poverty rate, with 13 household (36.1%) living below poverty.
| Children | Married-Couple Families | Single-Parent Households |
| No Children | 14 (1.7%) | 24 (13.0%) |
| 1 or 2 Children | 0 (0.0%) | 13 (36.1%) |
| 3 or 4 Children | 0 (0.0%) | 0 (0.0%) |
| 5 or more Children | 0 (0.0%) | 0 (0.0%) |
| Total | 14 (0.9%) | 37 (15.7%) |
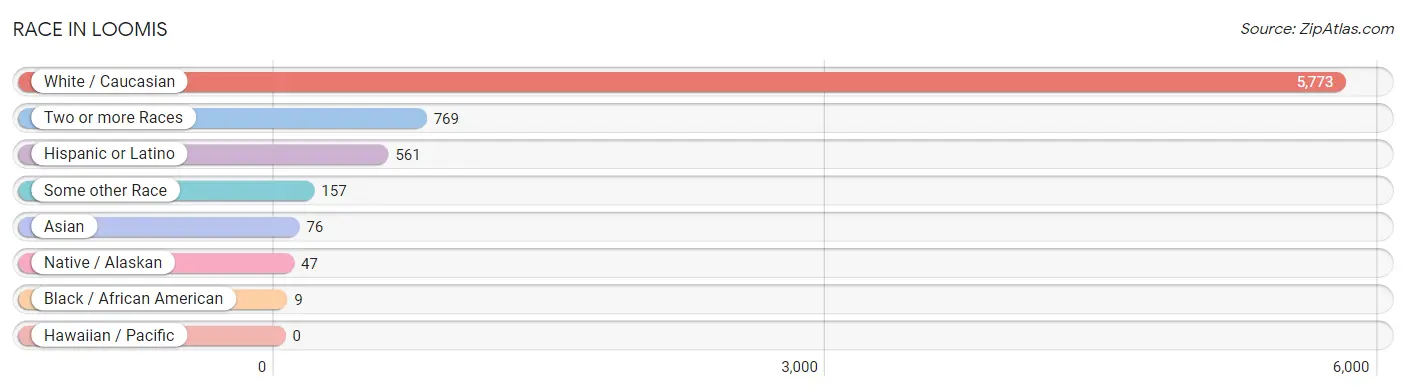
Race in Loomis
The most populous races in Loomis are White / Caucasian (5,773 | 84.5%), Two or more Races (769 | 11.3%), and Hispanic or Latino (561 | 8.2%).
| Race | # Population | % Population |
| Asian | 76 | 1.1% |
| Black / African American | 9 | 0.1% |
| Hawaiian / Pacific | 0 | 0.0% |
| Hispanic or Latino | 561 | 8.2% |
| Native / Alaskan | 47 | 0.7% |
| White / Caucasian | 5,773 | 84.5% |
| Two or more Races | 769 | 11.3% |
| Some other Race | 157 | 2.3% |
| Total | 6,831 | 100.0% |
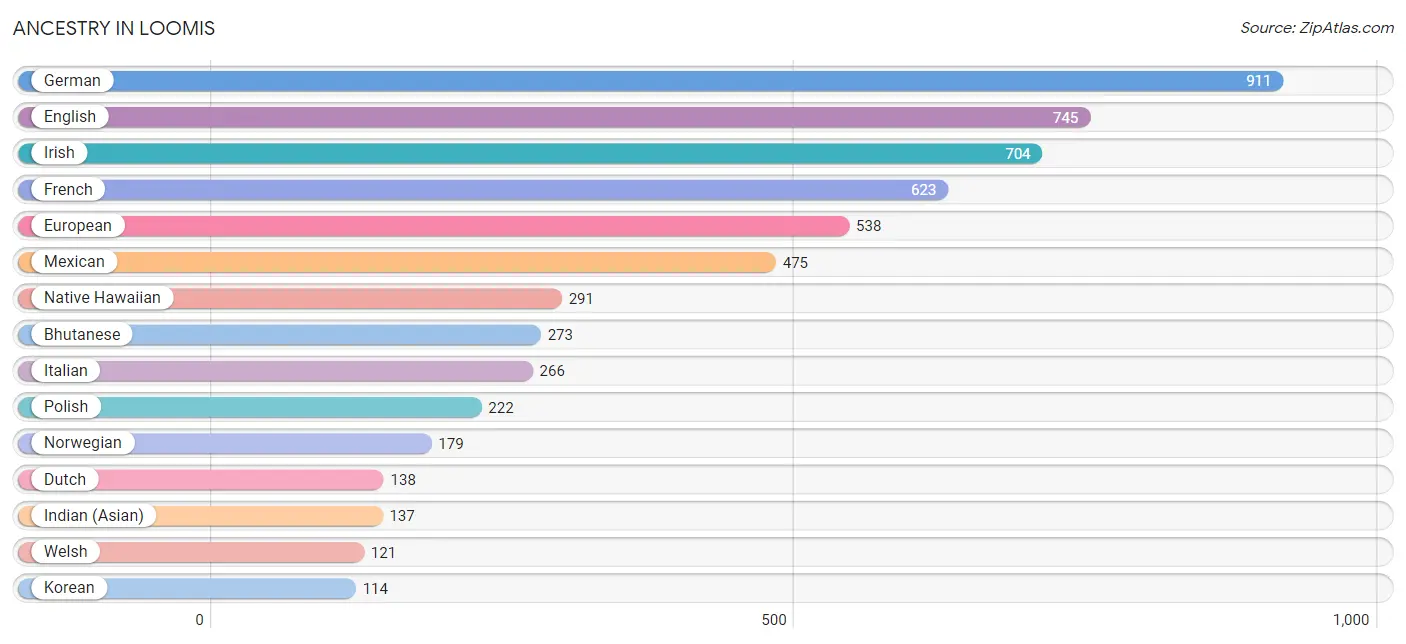
Ancestry in Loomis
The most populous ancestries reported in Loomis are German (911 | 13.3%), English (745 | 10.9%), Irish (704 | 10.3%), French (623 | 9.1%), and European (538 | 7.9%), together accounting for 51.6% of all Loomis residents.
| Ancestry | # Population | % Population |
| American | 99 | 1.5% |
| Armenian | 15 | 0.2% |
| Bhutanese | 273 | 4.0% |
| British | 8 | 0.1% |
| Burmese | 77 | 1.1% |
| Central American | 24 | 0.4% |
| Cherokee | 86 | 1.3% |
| Costa Rican | 24 | 0.4% |
| Czech | 75 | 1.1% |
| Danish | 22 | 0.3% |
| Dutch | 138 | 2.0% |
| Eastern European | 17 | 0.3% |
| English | 745 | 10.9% |
| European | 538 | 7.9% |
| Finnish | 64 | 0.9% |
| French | 623 | 9.1% |
| French Canadian | 10 | 0.2% |
| German | 911 | 13.3% |
| Indian (Asian) | 137 | 2.0% |
| Irish | 704 | 10.3% |
| Italian | 266 | 3.9% |
| Korean | 114 | 1.7% |
| Mexican | 475 | 7.0% |
| Mexican American Indian | 42 | 0.6% |
| Native Hawaiian | 291 | 4.3% |
| Nigerian | 8 | 0.1% |
| Norwegian | 179 | 2.6% |
| Polish | 222 | 3.3% |
| Portuguese | 62 | 0.9% |
| Romanian | 17 | 0.3% |
| Russian | 14 | 0.2% |
| Samoan | 77 | 1.1% |
| Scandinavian | 46 | 0.7% |
| Scotch-Irish | 98 | 1.4% |
| Scottish | 97 | 1.4% |
| Spaniard | 37 | 0.5% |
| Spanish | 25 | 0.4% |
| Sri Lankan | 77 | 1.1% |
| Subsaharan African | 8 | 0.1% |
| Swedish | 37 | 0.5% |
| Swiss | 15 | 0.2% |
| Thai | 109 | 1.6% |
| Ukrainian | 21 | 0.3% |
| Welsh | 121 | 1.8% |
| Yugoslavian | 17 | 0.3% | View All 45 Rows |
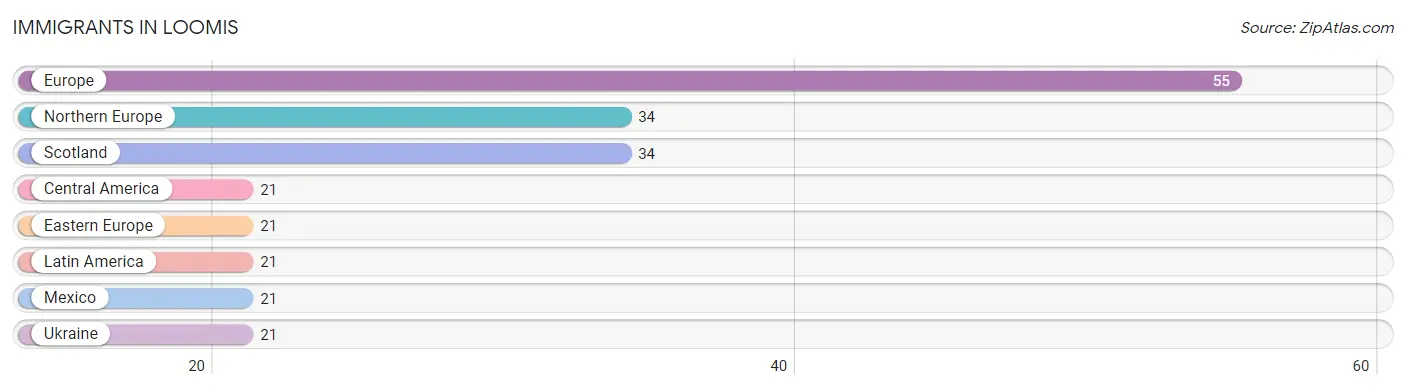
Immigrants in Loomis
The most numerous immigrant groups reported in Loomis came from Europe (55 | 0.8%), Northern Europe (34 | 0.5%), Scotland (34 | 0.5%), Central America (21 | 0.3%), and Eastern Europe (21 | 0.3%), together accounting for 2.4% of all Loomis residents.
| Immigration Origin | # Population | % Population |
| Central America | 21 | 0.3% |
| Eastern Europe | 21 | 0.3% |
| Europe | 55 | 0.8% |
| Latin America | 21 | 0.3% |
| Mexico | 21 | 0.3% |
| Northern Europe | 34 | 0.5% |
| Scotland | 34 | 0.5% |
| Ukraine | 21 | 0.3% | View All 8 Rows |
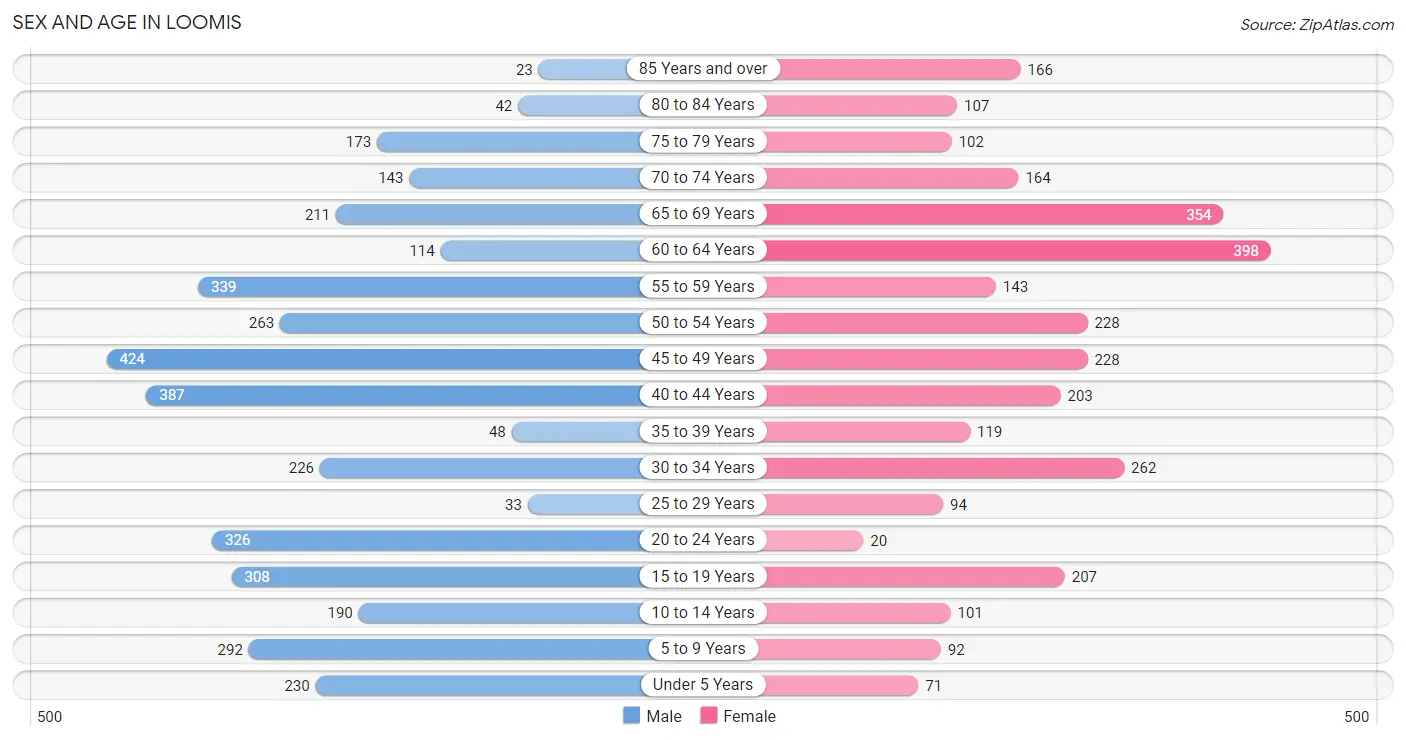
Sex and Age in Loomis
Sex and Age in Loomis
The most populous age groups in Loomis are 45 to 49 Years (424 | 11.2%) for men and 60 to 64 Years (398 | 13.0%) for women.
| Age Bracket | Male | Female |
| Under 5 Years | 230 (6.1%) | 71 (2.3%) |
| 5 to 9 Years | 292 (7.7%) | 92 (3.0%) |
| 10 to 14 Years | 190 (5.0%) | 101 (3.3%) |
| 15 to 19 Years | 308 (8.2%) | 207 (6.8%) |
| 20 to 24 Years | 326 (8.6%) | 20 (0.6%) |
| 25 to 29 Years | 33 (0.9%) | 94 (3.1%) |
| 30 to 34 Years | 226 (6.0%) | 262 (8.6%) |
| 35 to 39 Years | 48 (1.3%) | 119 (3.9%) |
| 40 to 44 Years | 387 (10.3%) | 203 (6.6%) |
| 45 to 49 Years | 424 (11.2%) | 228 (7.4%) |
| 50 to 54 Years | 263 (7.0%) | 228 (7.4%) |
| 55 to 59 Years | 339 (9.0%) | 143 (4.7%) |
| 60 to 64 Years | 114 (3.0%) | 398 (13.0%) |
| 65 to 69 Years | 211 (5.6%) | 354 (11.6%) |
| 70 to 74 Years | 143 (3.8%) | 164 (5.4%) |
| 75 to 79 Years | 173 (4.6%) | 102 (3.3%) |
| 80 to 84 Years | 42 (1.1%) | 107 (3.5%) |
| 85 Years and over | 23 (0.6%) | 166 (5.4%) |
| Total | 3,772 (100.0%) | 3,059 (100.0%) |
Families and Households in Loomis
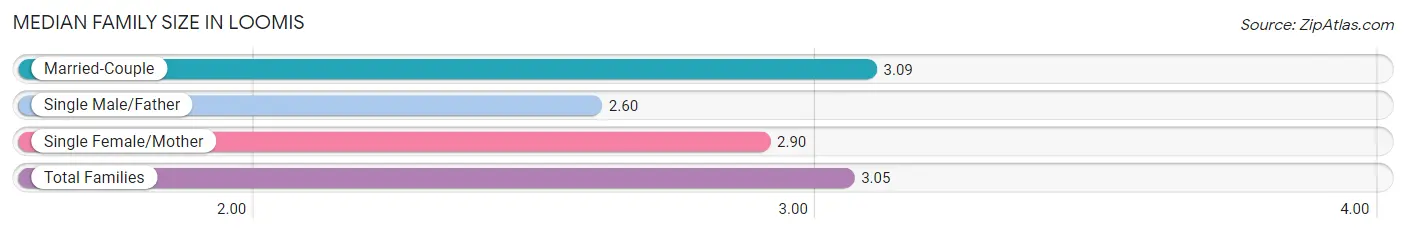
Median Family Size in Loomis
The median family size in Loomis is 3.05 persons per family, with married-couple families (1,533 | 86.7%) accounting for the largest median family size of 3.09 persons per family. On the other hand, single male/father families (58 | 3.3%) represent the smallest median family size with 2.60 persons per family.
| Family Type | # Families | Family Size |
| Married-Couple | 1,533 (86.7%) | 3.09 |
| Single Male/Father | 58 (3.3%) | 2.60 |
| Single Female/Mother | 177 (10.0%) | 2.90 |
| Total Families | 1,768 (100.0%) | 3.05 |
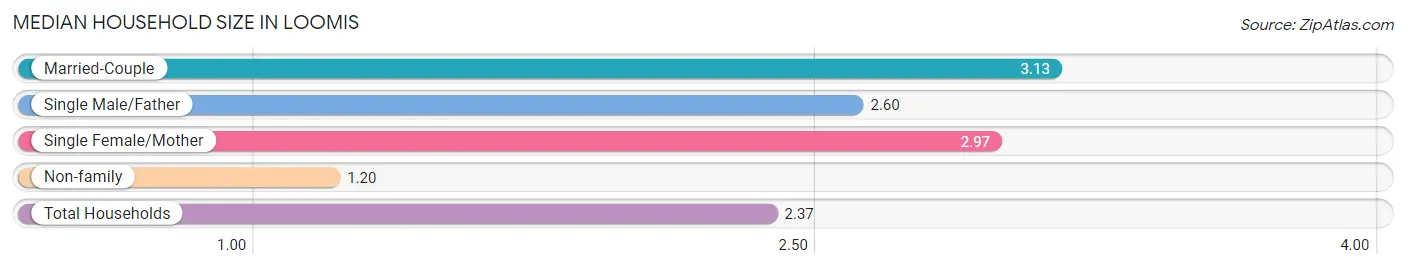
Median Household Size in Loomis
The median household size in Loomis is 2.37 persons per household, with married-couple households (1,533 | 53.5%) accounting for the largest median household size of 3.13 persons per household. non-family households (1,099 | 38.3%) represent the smallest median household size with 1.20 persons per household.
| Household Type | # Households | Household Size |
| Married-Couple | 1,533 (53.5%) | 3.13 |
| Single Male/Father | 58 (2.0%) | 2.60 |
| Single Female/Mother | 177 (6.2%) | 2.97 |
| Non-family | 1,099 (38.3%) | 1.20 |
| Total Households | 2,867 (100.0%) | 2.37 |
Household Size by Marriage Status in Loomis
Out of a total of 2,867 households in Loomis, 1,768 (61.7%) are family households, while 1,099 (38.3%) are nonfamily households. The most numerous type of family households are 2-person households, comprising 873, and the most common type of nonfamily households are 1-person households, comprising 960.
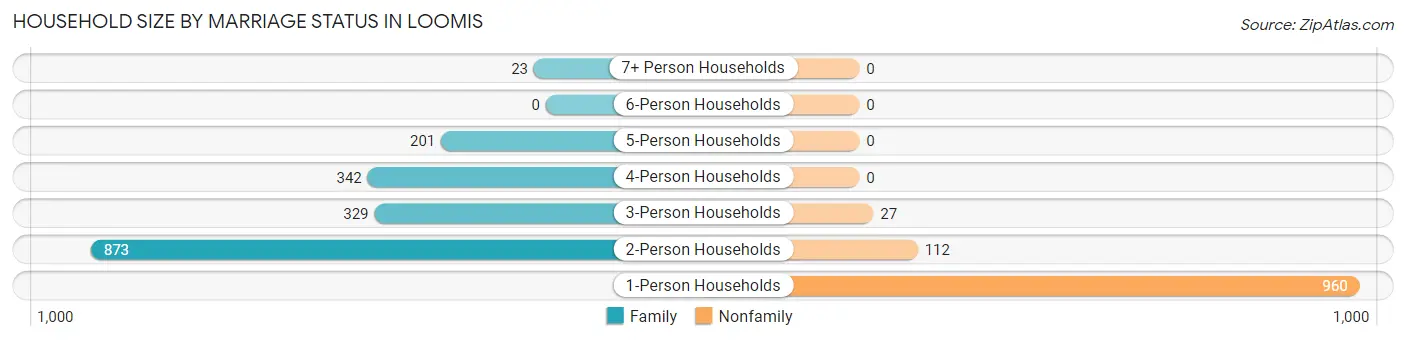
| Household Size | Family Households | Nonfamily Households |
| 1-Person Households | - | 960 (33.5%) |
| 2-Person Households | 873 (30.4%) | 112 (3.9%) |
| 3-Person Households | 329 (11.5%) | 27 (0.9%) |
| 4-Person Households | 342 (11.9%) | 0 (0.0%) |
| 5-Person Households | 201 (7.0%) | 0 (0.0%) |
| 6-Person Households | 0 (0.0%) | 0 (0.0%) |
| 7+ Person Households | 23 (0.8%) | 0 (0.0%) |
| Total | 1,768 (61.7%) | 1,099 (38.3%) |
Female Fertility in Loomis
Fertility by Age in Loomis
Average fertility rate in Loomis is 34.0 births per 1,000 women. Women in the age bracket of 20 to 34 years have the highest fertility rate with 93.0 births per 1,000 women. Women in the age bracket of 20 to 34 years acount for 79.5% of all women with births.
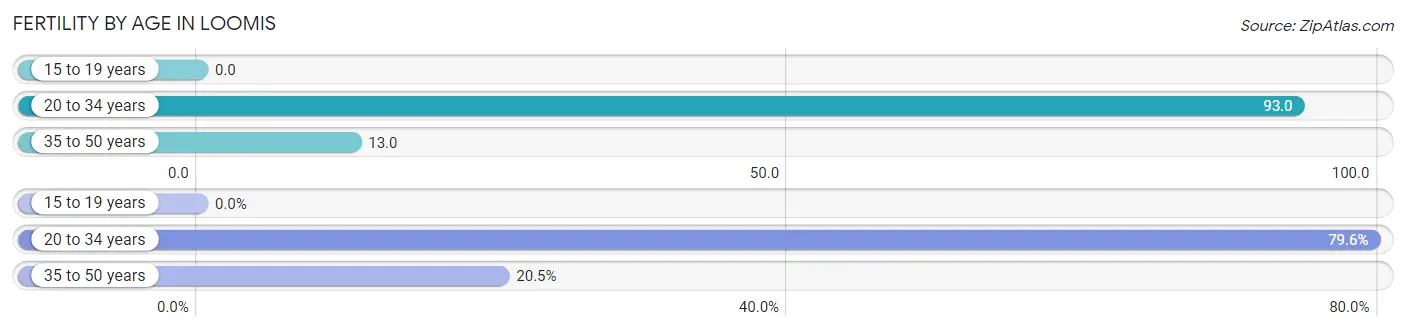
| Age Bracket | Women with Births | Births / 1,000 Women |
| 15 to 19 years | 0 (0.0%) | 0.0 |
| 20 to 34 years | 35 (79.5%) | 93.0 |
| 35 to 50 years | 9 (20.4%) | 13.0 |
| Total | 44 (100.0%) | 34.0 |
Fertility by Age by Marriage Status in Loomis
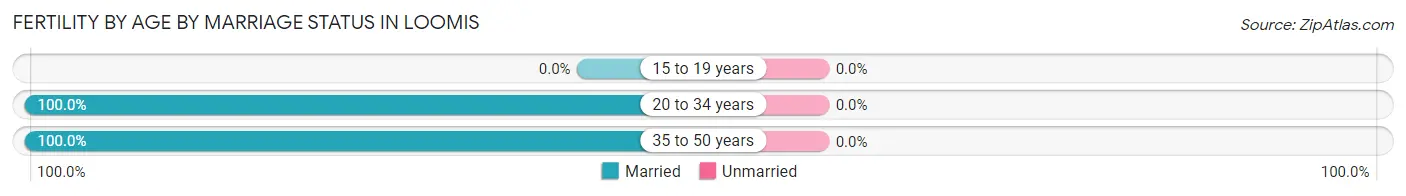
| Age Bracket | Married | Unmarried |
| 15 to 19 years | 0 (0.0%) | 0 (0.0%) |
| 20 to 34 years | 35 (100.0%) | 0 (0.0%) |
| 35 to 50 years | 9 (100.0%) | 0 (0.0%) |
| Total | 44 (100.0%) | 0 (0.0%) |
Fertility by Education in Loomis
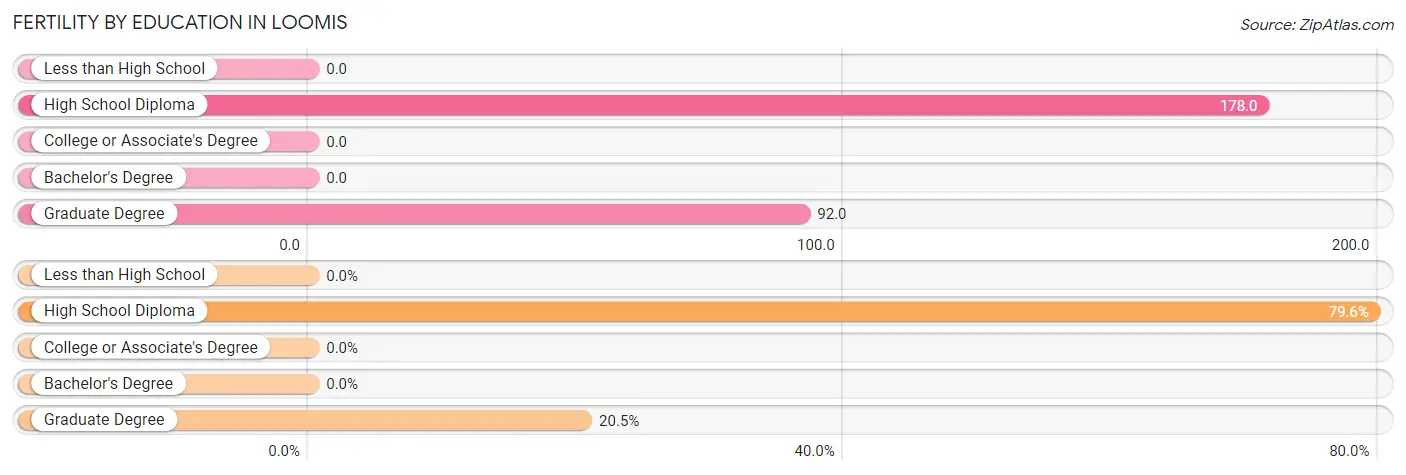
| Educational Attainment | Women with Births | Births / 1,000 Women |
| Less than High School | 0 (0.0%) | 0.0 |
| High School Diploma | 35 (79.5%) | 178.0 |
| College or Associate's Degree | 0 (0.0%) | 0.0 |
| Bachelor's Degree | 0 (0.0%) | 0.0 |
| Graduate Degree | 9 (20.4%) | 92.0 |
| Total | 44 (100.0%) | 34.0 |
Fertility by Education by Marriage Status in Loomis
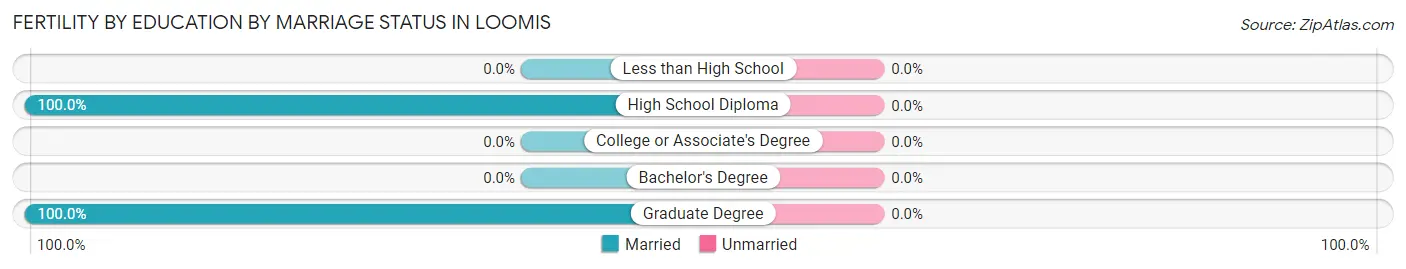
| Educational Attainment | Married | Unmarried |
| Less than High School | 0 (0.0%) | 0 (0.0%) |
| High School Diploma | 35 (100.0%) | 0 (0.0%) |
| College or Associate's Degree | 0 (0.0%) | 0 (0.0%) |
| Bachelor's Degree | 0 (0.0%) | 0 (0.0%) |
| Graduate Degree | 9 (100.0%) | 0 (0.0%) |
| Total | 44 (100.0%) | 0 (0.0%) |
Employment Characteristics in Loomis
Employment by Class of Employer in Loomis
Among the 2,933 employed individuals in Loomis, private company employees (1,510 | 51.5%), local government employees (374 | 12.8%), and self-employed (not incorporated) (349 | 11.9%) make up the most common classes of employment.
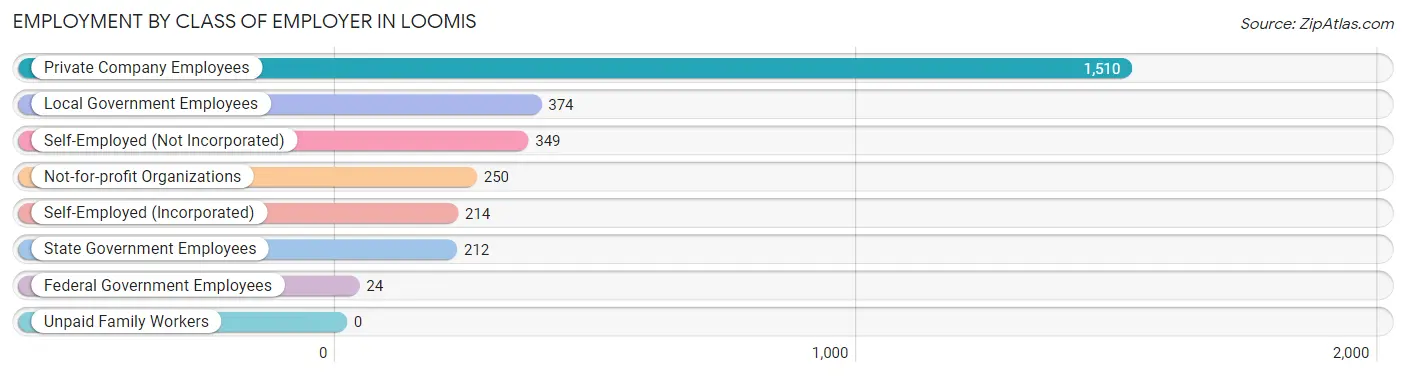
| Employer Class | # Employees | % Employees |
| Private Company Employees | 1,510 | 51.5% |
| Self-Employed (Incorporated) | 214 | 7.3% |
| Self-Employed (Not Incorporated) | 349 | 11.9% |
| Not-for-profit Organizations | 250 | 8.5% |
| Local Government Employees | 374 | 12.8% |
| State Government Employees | 212 | 7.2% |
| Federal Government Employees | 24 | 0.8% |
| Unpaid Family Workers | 0 | 0.0% |
| Total | 2,933 | 100.0% |
Employment Status by Age in Loomis
According to the labor force statistics for Loomis, out of the total population over 16 years of age (5,752), 53.7% or 3,089 individuals are in the labor force, with 4.0% or 124 of them unemployed. The age group with the highest labor force participation rate is 30 to 34 years, with 91.4% or 446 individuals in the labor force. Within the labor force, the 20 to 24 years age range has the highest percentage of unemployed individuals, with 17.5% or 42 of them being unemployed.
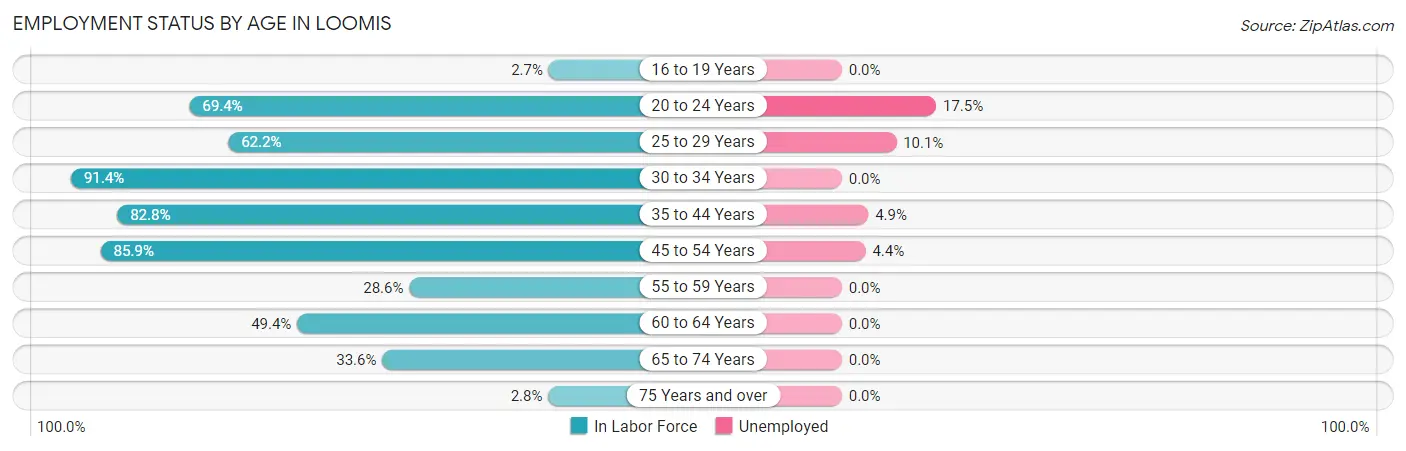
| Age Bracket | In Labor Force | Unemployed |
| 16 to 19 Years | 11 (2.7%) | 0 (0.0%) |
| 20 to 24 Years | 240 (69.4%) | 42 (17.5%) |
| 25 to 29 Years | 79 (62.2%) | 8 (10.1%) |
| 30 to 34 Years | 446 (91.4%) | 0 (0.0%) |
| 35 to 44 Years | 627 (82.8%) | 31 (4.9%) |
| 45 to 54 Years | 982 (85.9%) | 43 (4.4%) |
| 55 to 59 Years | 138 (28.6%) | 0 (0.0%) |
| 60 to 64 Years | 253 (49.4%) | 0 (0.0%) |
| 65 to 74 Years | 293 (33.6%) | 0 (0.0%) |
| 75 Years and over | 17 (2.8%) | 0 (0.0%) |
| Total | 3,089 (53.7%) | 124 (4.0%) |
Employment Status by Educational Attainment in Loomis
According to labor force statistics for Loomis, 72.0% of individuals (2,526) out of the total population between 25 and 64 years of age (3,509) are in the labor force, with 3.2% or 81 of them being unemployed. The group with the highest labor force participation rate are those with the educational attainment of college / associate degree, with 89.8% or 990 individuals in the labor force. Within the labor force, individuals with high school diploma education have the highest percentage of unemployment, with 8.5% or 28 of them being unemployed.
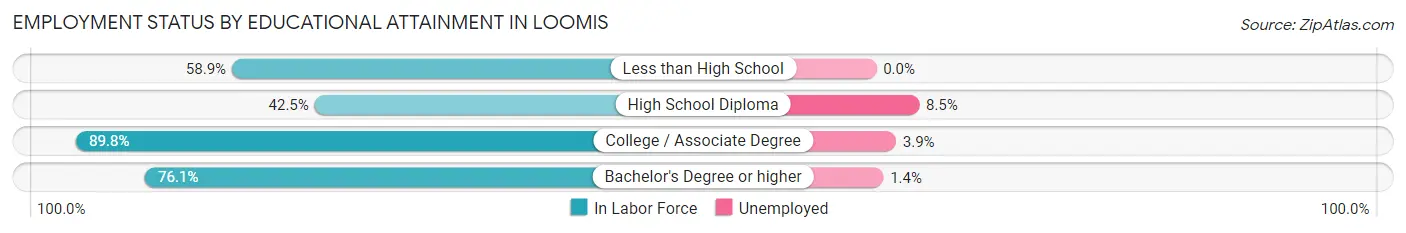
| Educational Attainment | In Labor Force | Unemployed |
| Less than High School | 119 (58.9%) | 0 (0.0%) |
| High School Diploma | 329 (42.5%) | 66 (8.5%) |
| College / Associate Degree | 990 (89.8%) | 43 (3.9%) |
| Bachelor's Degree or higher | 1,087 (76.1%) | 20 (1.4%) |
| Total | 2,526 (72.0%) | 112 (3.2%) |
Employment Occupations by Sex in Loomis
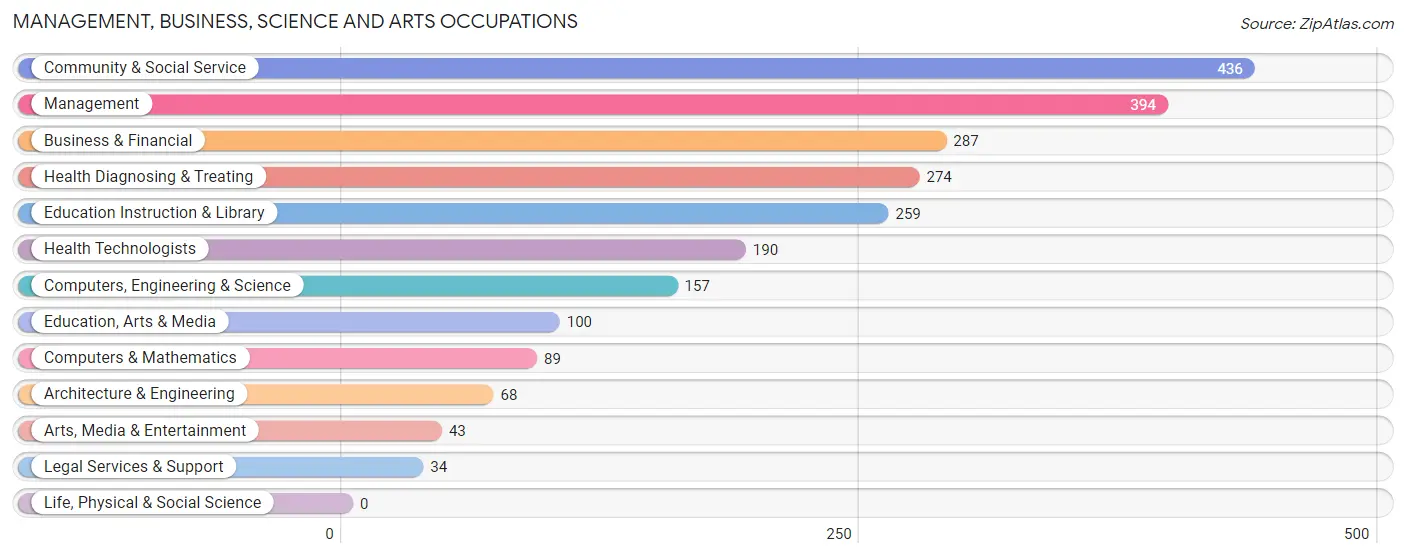
Management, Business, Science and Arts Occupations
The most common Management, Business, Science and Arts occupations in Loomis are Community & Social Service (436 | 14.7%), Management (394 | 13.3%), Business & Financial (287 | 9.7%), Health Diagnosing & Treating (274 | 9.2%), and Education Instruction & Library (259 | 8.7%).
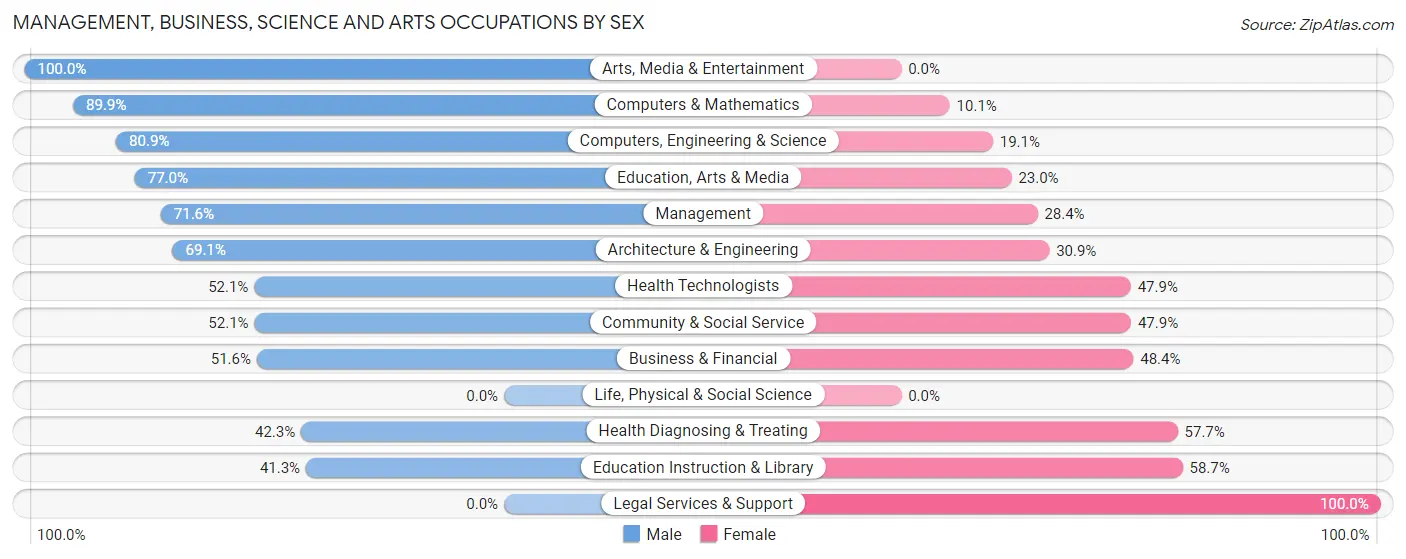
Management, Business, Science and Arts Occupations by Sex
Within the Management, Business, Science and Arts occupations in Loomis, the most male-oriented occupations are Arts, Media & Entertainment (100.0%), Computers & Mathematics (89.9%), and Computers, Engineering & Science (80.9%), while the most female-oriented occupations are Legal Services & Support (100.0%), Education Instruction & Library (58.7%), and Health Diagnosing & Treating (57.7%).
| Occupation | Male | Female |
| Management | 282 (71.6%) | 112 (28.4%) |
| Business & Financial | 148 (51.6%) | 139 (48.4%) |
| Computers, Engineering & Science | 127 (80.9%) | 30 (19.1%) |
| Computers & Mathematics | 80 (89.9%) | 9 (10.1%) |
| Architecture & Engineering | 47 (69.1%) | 21 (30.9%) |
| Life, Physical & Social Science | 0 (0.0%) | 0 (0.0%) |
| Community & Social Service | 227 (52.1%) | 209 (47.9%) |
| Education, Arts & Media | 77 (77.0%) | 23 (23.0%) |
| Legal Services & Support | 0 (0.0%) | 34 (100.0%) |
| Education Instruction & Library | 107 (41.3%) | 152 (58.7%) |
| Arts, Media & Entertainment | 43 (100.0%) | 0 (0.0%) |
| Health Diagnosing & Treating | 116 (42.3%) | 158 (57.7%) |
| Health Technologists | 99 (52.1%) | 91 (47.9%) |
| Total (Category) | 900 (58.1%) | 648 (41.9%) |
| Total (Overall) | 1,807 (61.0%) | 1,155 (39.0%) |
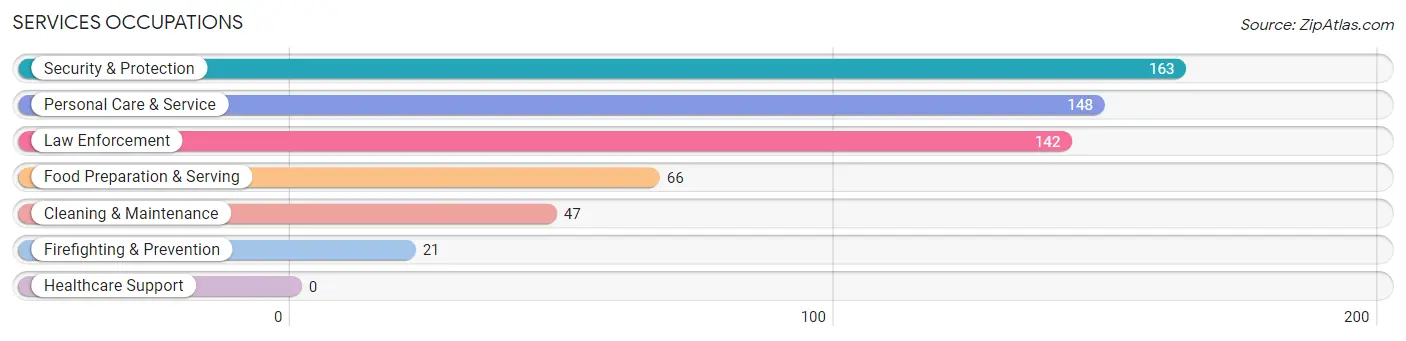
Services Occupations
The most common Services occupations in Loomis are Security & Protection (163 | 5.5%), Personal Care & Service (148 | 5.0%), Law Enforcement (142 | 4.8%), Food Preparation & Serving (66 | 2.2%), and Cleaning & Maintenance (47 | 1.6%).
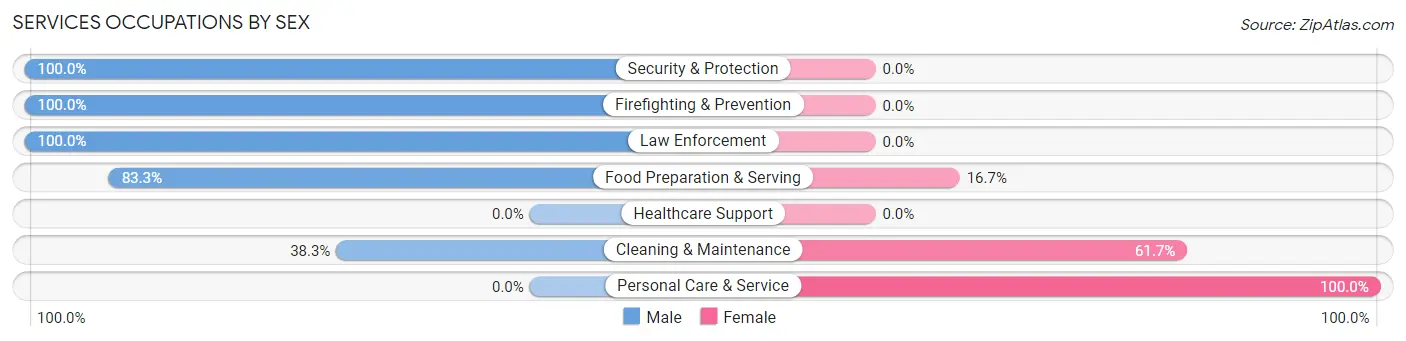
Services Occupations by Sex
Within the Services occupations in Loomis, the most male-oriented occupations are Security & Protection (100.0%), Firefighting & Prevention (100.0%), and Law Enforcement (100.0%), while the most female-oriented occupations are Personal Care & Service (100.0%), Cleaning & Maintenance (61.7%), and Food Preparation & Serving (16.7%).
| Occupation | Male | Female |
| Healthcare Support | 0 (0.0%) | 0 (0.0%) |
| Security & Protection | 163 (100.0%) | 0 (0.0%) |
| Firefighting & Prevention | 21 (100.0%) | 0 (0.0%) |
| Law Enforcement | 142 (100.0%) | 0 (0.0%) |
| Food Preparation & Serving | 55 (83.3%) | 11 (16.7%) |
| Cleaning & Maintenance | 18 (38.3%) | 29 (61.7%) |
| Personal Care & Service | 0 (0.0%) | 148 (100.0%) |
| Total (Category) | 236 (55.7%) | 188 (44.3%) |
| Total (Overall) | 1,807 (61.0%) | 1,155 (39.0%) |
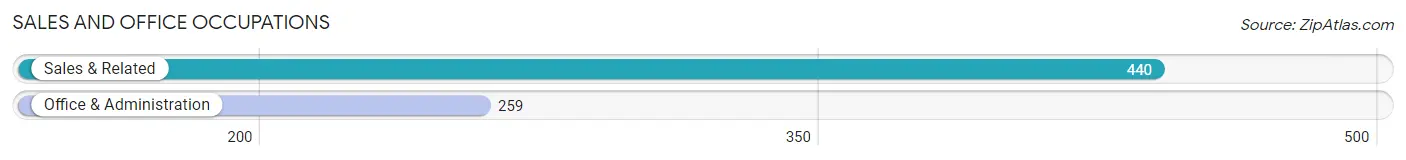
Sales and Office Occupations
The most common Sales and Office occupations in Loomis are Sales & Related (440 | 14.8%), and Office & Administration (259 | 8.7%).
Sales and Office Occupations by Sex
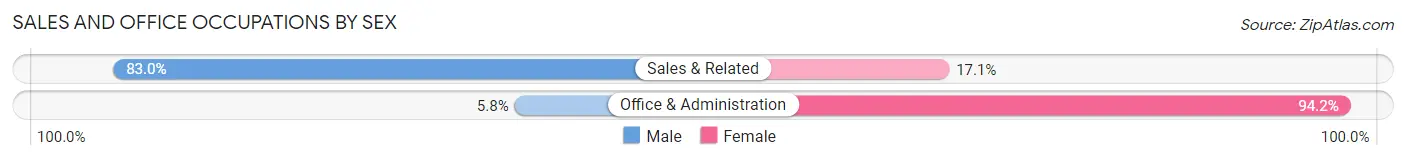
| Occupation | Male | Female |
| Sales & Related | 365 (83.0%) | 75 (17.1%) |
| Office & Administration | 15 (5.8%) | 244 (94.2%) |
| Total (Category) | 380 (54.4%) | 319 (45.6%) |
| Total (Overall) | 1,807 (61.0%) | 1,155 (39.0%) |
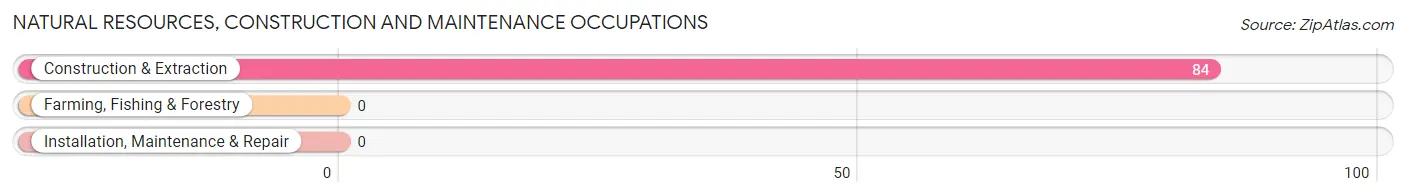
Natural Resources, Construction and Maintenance Occupations
The most common Natural Resources, Construction and Maintenance occupations in Loomis are , and Construction & Extraction (84 | 2.8%).
Natural Resources, Construction and Maintenance Occupations by Sex
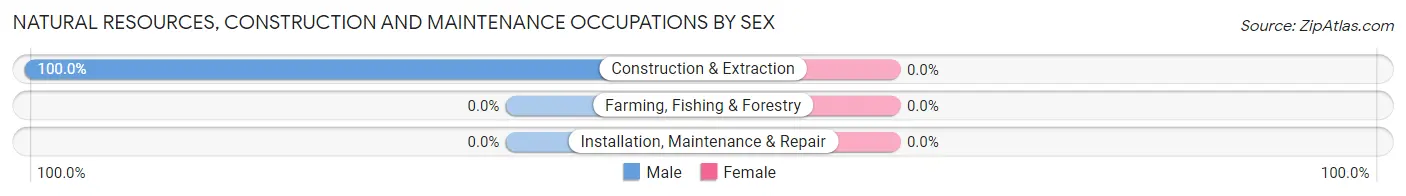
| Occupation | Male | Female |
| Farming, Fishing & Forestry | 0 (0.0%) | 0 (0.0%) |
| Construction & Extraction | 84 (100.0%) | 0 (0.0%) |
| Installation, Maintenance & Repair | 0 (0.0%) | 0 (0.0%) |
| Total (Category) | 84 (100.0%) | 0 (0.0%) |
| Total (Overall) | 1,807 (61.0%) | 1,155 (39.0%) |
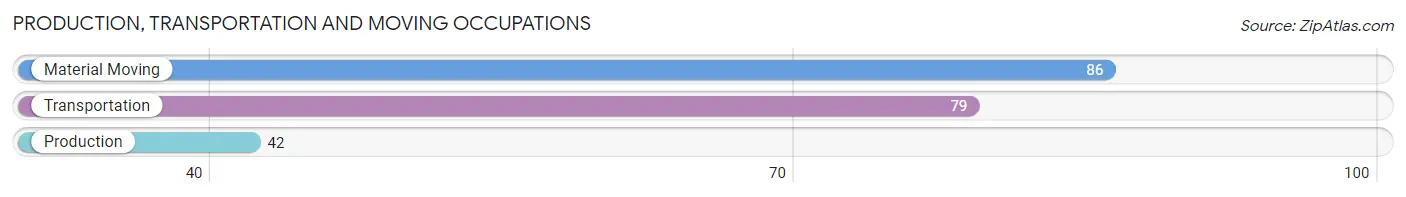
Production, Transportation and Moving Occupations
The most common Production, Transportation and Moving occupations in Loomis are Material Moving (86 | 2.9%), Transportation (79 | 2.7%), and Production (42 | 1.4%).
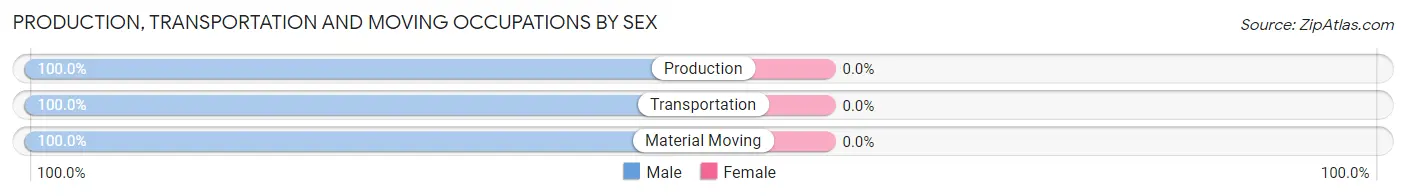
Production, Transportation and Moving Occupations by Sex
| Occupation | Male | Female |
| Production | 42 (100.0%) | 0 (0.0%) |
| Transportation | 79 (100.0%) | 0 (0.0%) |
| Material Moving | 86 (100.0%) | 0 (0.0%) |
| Total (Category) | 207 (100.0%) | 0 (0.0%) |
| Total (Overall) | 1,807 (61.0%) | 1,155 (39.0%) |
Employment Industries by Sex in Loomis
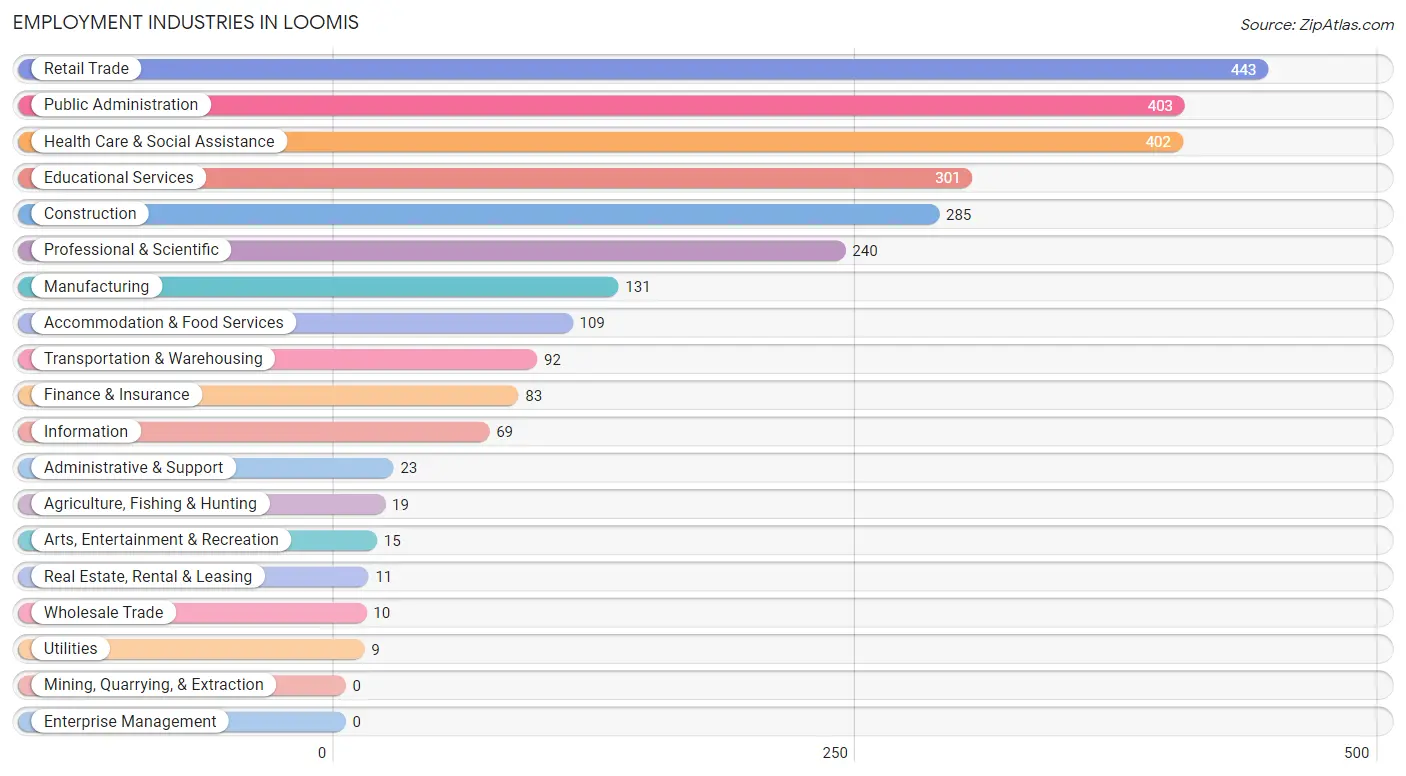
Employment Industries in Loomis
The major employment industries in Loomis include Retail Trade (443 | 15.0%), Public Administration (403 | 13.6%), Health Care & Social Assistance (402 | 13.6%), Educational Services (301 | 10.2%), and Construction (285 | 9.6%).
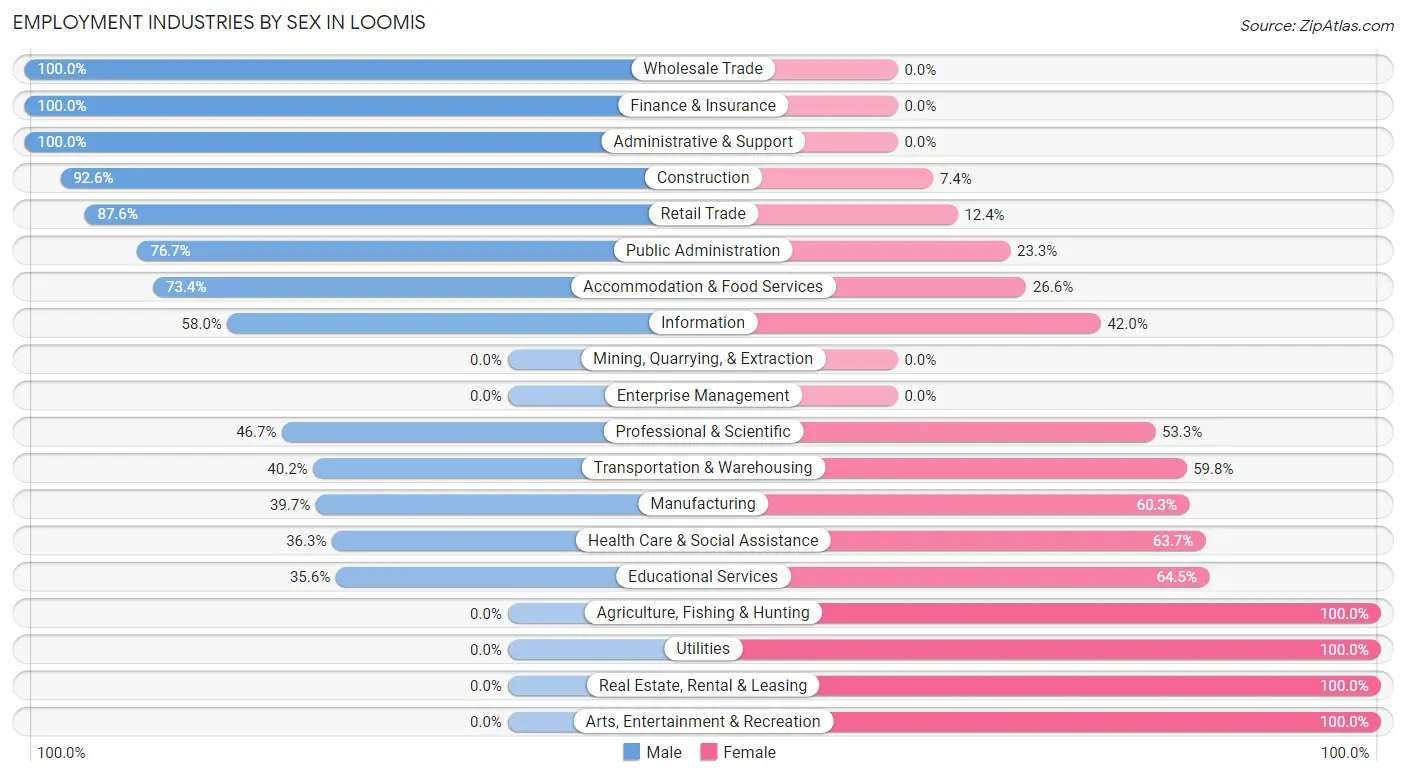
Employment Industries by Sex in Loomis
The Loomis industries that see more men than women are Wholesale Trade (100.0%), Finance & Insurance (100.0%), and Administrative & Support (100.0%), whereas the industries that tend to have a higher number of women are Agriculture, Fishing & Hunting (100.0%), Utilities (100.0%), and Real Estate, Rental & Leasing (100.0%).
| Industry | Male | Female |
| Agriculture, Fishing & Hunting | 0 (0.0%) | 19 (100.0%) |
| Mining, Quarrying, & Extraction | 0 (0.0%) | 0 (0.0%) |
| Construction | 264 (92.6%) | 21 (7.4%) |
| Manufacturing | 52 (39.7%) | 79 (60.3%) |
| Wholesale Trade | 10 (100.0%) | 0 (0.0%) |
| Retail Trade | 388 (87.6%) | 55 (12.4%) |
| Transportation & Warehousing | 37 (40.2%) | 55 (59.8%) |
| Utilities | 0 (0.0%) | 9 (100.0%) |
| Information | 40 (58.0%) | 29 (42.0%) |
| Finance & Insurance | 83 (100.0%) | 0 (0.0%) |
| Real Estate, Rental & Leasing | 0 (0.0%) | 11 (100.0%) |
| Professional & Scientific | 112 (46.7%) | 128 (53.3%) |
| Enterprise Management | 0 (0.0%) | 0 (0.0%) |
| Administrative & Support | 23 (100.0%) | 0 (0.0%) |
| Educational Services | 107 (35.5%) | 194 (64.4%) |
| Health Care & Social Assistance | 146 (36.3%) | 256 (63.7%) |
| Arts, Entertainment & Recreation | 0 (0.0%) | 15 (100.0%) |
| Accommodation & Food Services | 80 (73.4%) | 29 (26.6%) |
| Public Administration | 309 (76.7%) | 94 (23.3%) |
| Total | 1,807 (61.0%) | 1,155 (39.0%) |
Education in Loomis
School Enrollment in Loomis
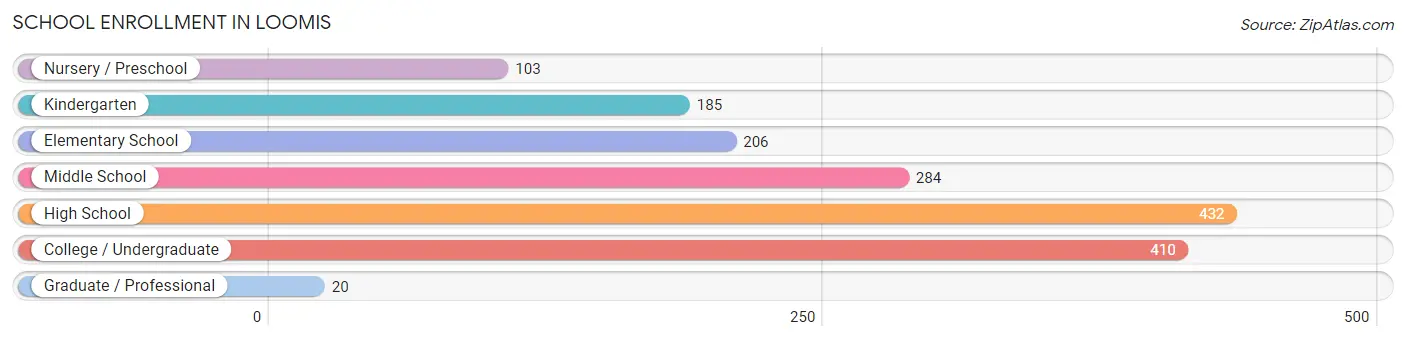
The most common levels of schooling among the 1,640 students in Loomis are high school (432 | 26.3%), college / undergraduate (410 | 25.0%), and middle school (284 | 17.3%).
| School Level | # Students | % Students |
| Nursery / Preschool | 103 | 6.3% |
| Kindergarten | 185 | 11.3% |
| Elementary School | 206 | 12.6% |
| Middle School | 284 | 17.3% |
| High School | 432 | 26.3% |
| College / Undergraduate | 410 | 25.0% |
| Graduate / Professional | 20 | 1.2% |
| Total | 1,640 | 100.0% |
School Enrollment by Age by Funding Source in Loomis
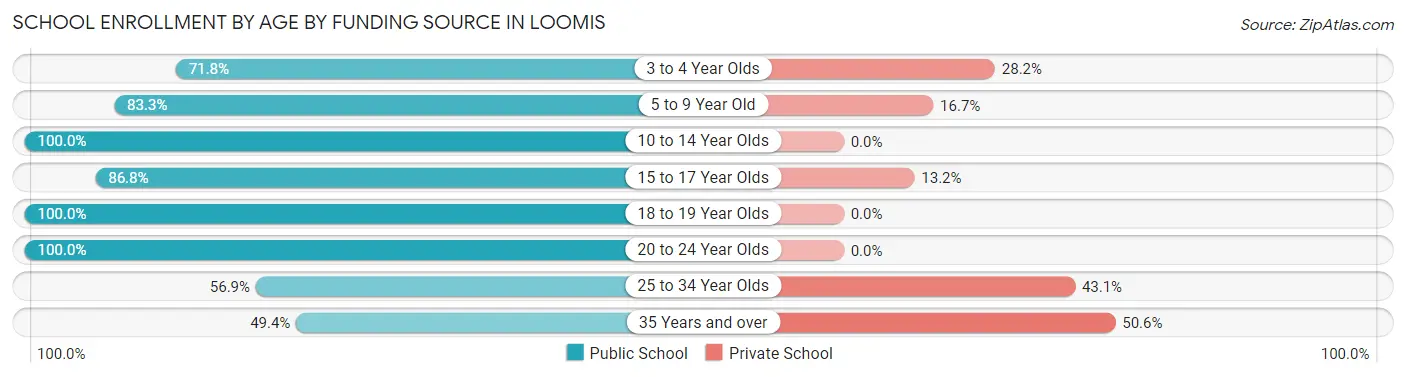
Out of a total of 1,640 students who are enrolled in schools in Loomis, 207 (12.6%) attend a private institution, while the remaining 1,433 (87.4%) are enrolled in public schools. The age group of 35 years and over has the highest likelihood of being enrolled in private schools, with 43 (50.6% in the age bracket) enrolled. Conversely, the age group of 10 to 14 year olds has the lowest likelihood of being enrolled in a private school, with 291 (100.0% in the age bracket) attending a public institution.
| Age Bracket | Public School | Private School |
| 3 to 4 Year Olds | 74 (71.8%) | 29 (28.2%) |
| 5 to 9 Year Old | 320 (83.3%) | 64 (16.7%) |
| 10 to 14 Year Olds | 291 (100.0%) | 0 (0.0%) |
| 15 to 17 Year Olds | 277 (86.8%) | 42 (13.2%) |
| 18 to 19 Year Olds | 152 (100.0%) | 0 (0.0%) |
| 20 to 24 Year Olds | 241 (100.0%) | 0 (0.0%) |
| 25 to 34 Year Olds | 37 (56.9%) | 28 (43.1%) |
| 35 Years and over | 42 (49.4%) | 43 (50.6%) |
| Total | 1,433 (87.4%) | 207 (12.6%) |
Educational Attainment by Field of Study in Loomis
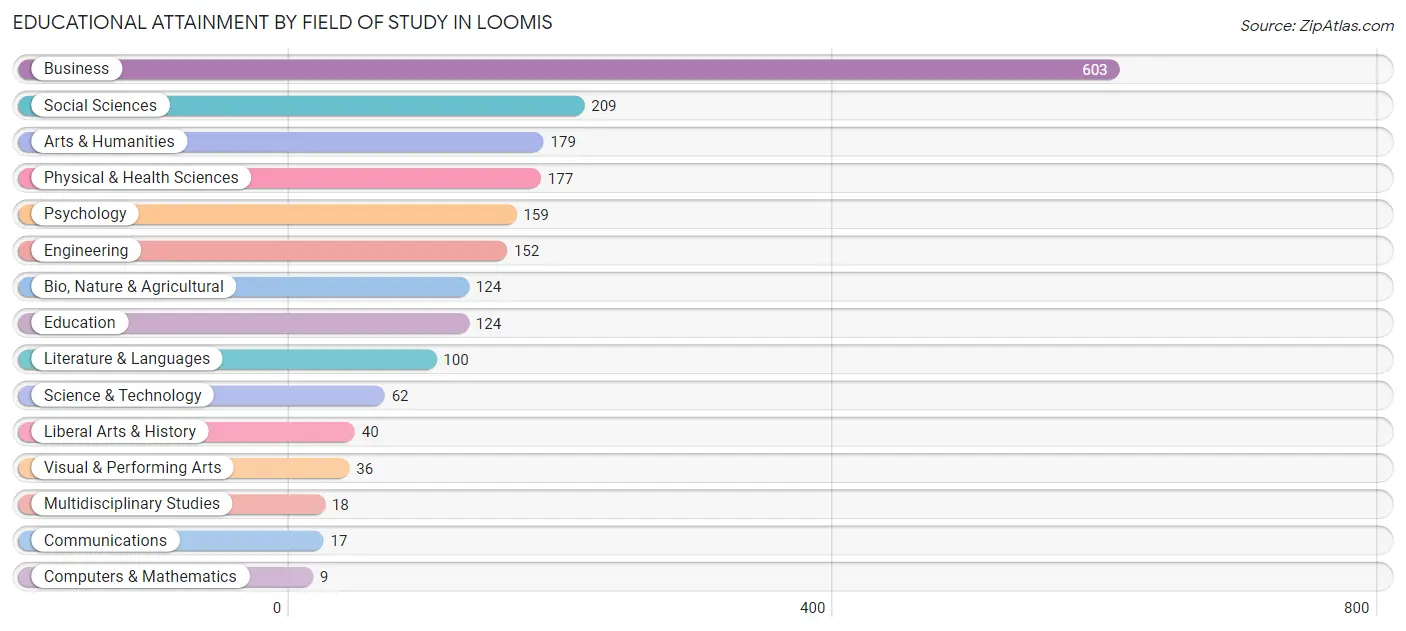
Business (603 | 30.0%), social sciences (209 | 10.4%), arts & humanities (179 | 8.9%), physical & health sciences (177 | 8.8%), and psychology (159 | 7.9%) are the most common fields of study among 2,009 individuals in Loomis who have obtained a bachelor's degree or higher.
| Field of Study | # Graduates | % Graduates |
| Computers & Mathematics | 9 | 0.4% |
| Bio, Nature & Agricultural | 124 | 6.2% |
| Physical & Health Sciences | 177 | 8.8% |
| Psychology | 159 | 7.9% |
| Social Sciences | 209 | 10.4% |
| Engineering | 152 | 7.6% |
| Multidisciplinary Studies | 18 | 0.9% |
| Science & Technology | 62 | 3.1% |
| Business | 603 | 30.0% |
| Education | 124 | 6.2% |
| Literature & Languages | 100 | 5.0% |
| Liberal Arts & History | 40 | 2.0% |
| Visual & Performing Arts | 36 | 1.8% |
| Communications | 17 | 0.9% |
| Arts & Humanities | 179 | 8.9% |
| Total | 2,009 | 100.0% |
Transportation & Commute in Loomis
Vehicle Availability by Sex in Loomis
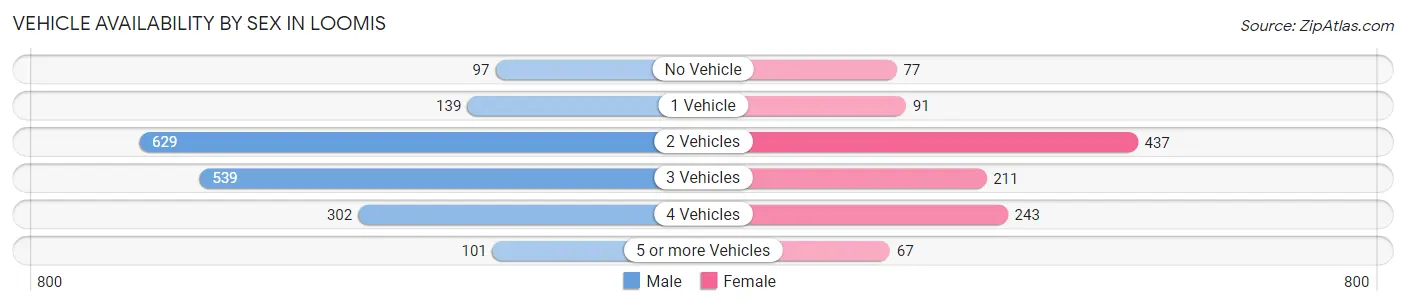
The most prevalent vehicle ownership categories in Loomis are males with 2 vehicles (629, accounting for 34.8%) and females with 2 vehicles (437, making up 55.9%).
| Vehicles Available | Male | Female |
| No Vehicle | 97 (5.4%) | 77 (6.8%) |
| 1 Vehicle | 139 (7.7%) | 91 (8.1%) |
| 2 Vehicles | 629 (34.8%) | 437 (38.8%) |
| 3 Vehicles | 539 (29.8%) | 211 (18.7%) |
| 4 Vehicles | 302 (16.7%) | 243 (21.6%) |
| 5 or more Vehicles | 101 (5.6%) | 67 (5.9%) |
| Total | 1,807 (100.0%) | 1,126 (100.0%) |
Commute Time in Loomis
The most frequently occuring commute durations in Loomis are 20 to 24 minutes (342 commuters, 15.5%), 10 to 14 minutes (335 commuters, 15.2%), and 15 to 19 minutes (285 commuters, 12.9%).
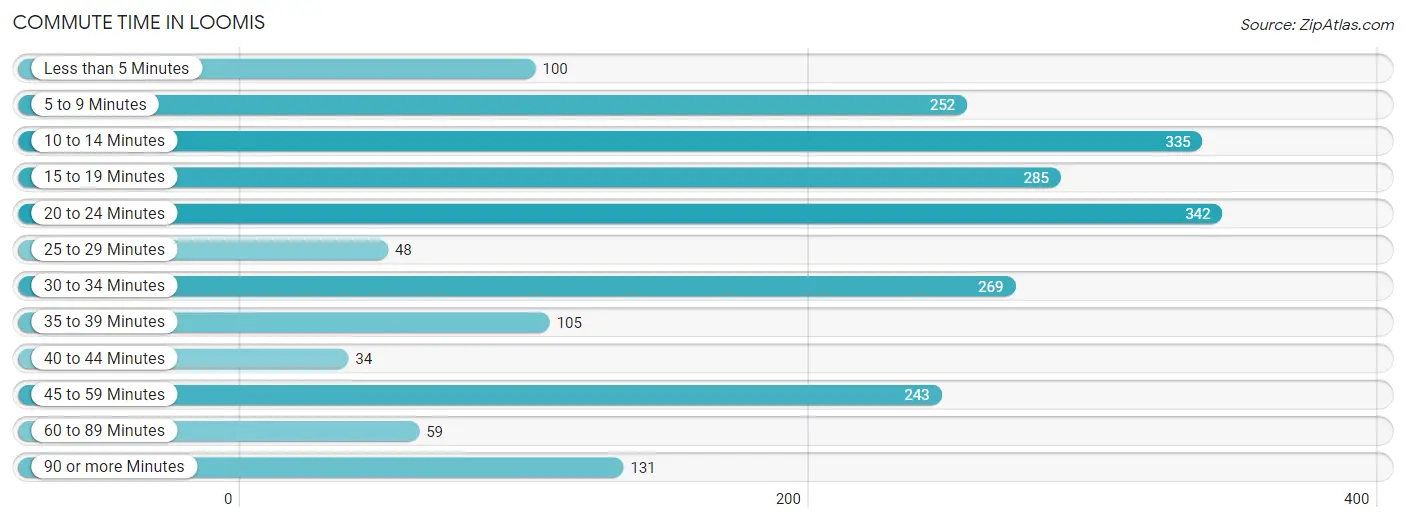
| Commute Time | # Commuters | % Commuters |
| Less than 5 Minutes | 100 | 4.5% |
| 5 to 9 Minutes | 252 | 11.4% |
| 10 to 14 Minutes | 335 | 15.2% |
| 15 to 19 Minutes | 285 | 12.9% |
| 20 to 24 Minutes | 342 | 15.5% |
| 25 to 29 Minutes | 48 | 2.2% |
| 30 to 34 Minutes | 269 | 12.2% |
| 35 to 39 Minutes | 105 | 4.8% |
| 40 to 44 Minutes | 34 | 1.5% |
| 45 to 59 Minutes | 243 | 11.0% |
| 60 to 89 Minutes | 59 | 2.7% |
| 90 or more Minutes | 131 | 5.9% |
Commute Time by Sex in Loomis
The most common commute times in Loomis are 20 to 24 minutes (283 commuters, 20.4%) for males and 30 to 34 minutes (173 commuters, 21.2%) for females.
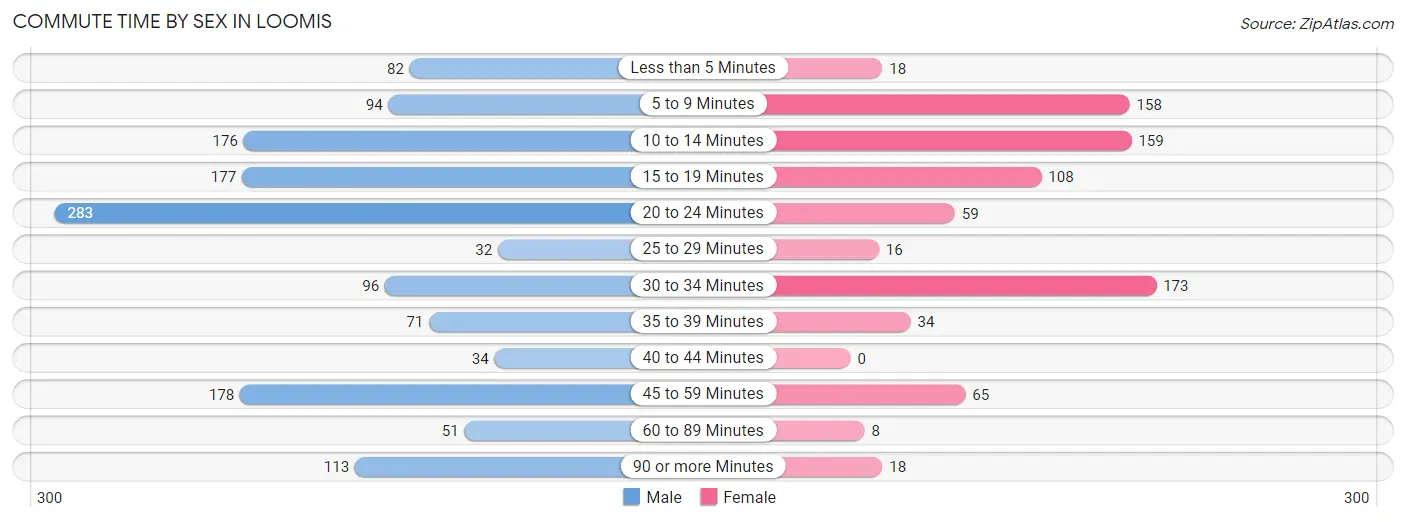
| Commute Time | Male | Female |
| Less than 5 Minutes | 82 (5.9%) | 18 (2.2%) |
| 5 to 9 Minutes | 94 (6.8%) | 158 (19.4%) |
| 10 to 14 Minutes | 176 (12.7%) | 159 (19.5%) |
| 15 to 19 Minutes | 177 (12.8%) | 108 (13.2%) |
| 20 to 24 Minutes | 283 (20.4%) | 59 (7.2%) |
| 25 to 29 Minutes | 32 (2.3%) | 16 (2.0%) |
| 30 to 34 Minutes | 96 (6.9%) | 173 (21.2%) |
| 35 to 39 Minutes | 71 (5.1%) | 34 (4.2%) |
| 40 to 44 Minutes | 34 (2.5%) | 0 (0.0%) |
| 45 to 59 Minutes | 178 (12.8%) | 65 (8.0%) |
| 60 to 89 Minutes | 51 (3.7%) | 8 (1.0%) |
| 90 or more Minutes | 113 (8.2%) | 18 (2.2%) |
Time of Departure to Work by Sex in Loomis
The most frequent times of departure to work in Loomis are 5:30 AM to 5:59 AM (187, 13.5%) for males and 9:00 AM to 9:59 AM (176, 21.6%) for females.
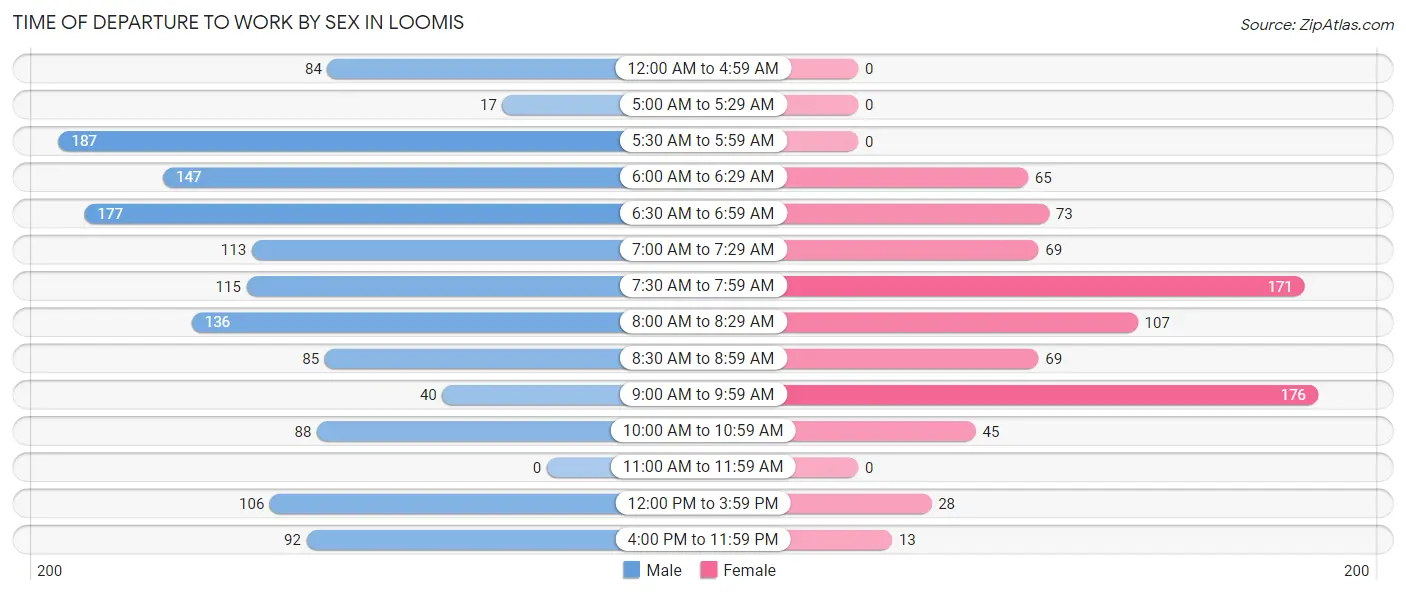
| Time of Departure | Male | Female |
| 12:00 AM to 4:59 AM | 84 (6.1%) | 0 (0.0%) |
| 5:00 AM to 5:29 AM | 17 (1.2%) | 0 (0.0%) |
| 5:30 AM to 5:59 AM | 187 (13.5%) | 0 (0.0%) |
| 6:00 AM to 6:29 AM | 147 (10.6%) | 65 (8.0%) |
| 6:30 AM to 6:59 AM | 177 (12.8%) | 73 (8.9%) |
| 7:00 AM to 7:29 AM | 113 (8.2%) | 69 (8.5%) |
| 7:30 AM to 7:59 AM | 115 (8.3%) | 171 (21.0%) |
| 8:00 AM to 8:29 AM | 136 (9.8%) | 107 (13.1%) |
| 8:30 AM to 8:59 AM | 85 (6.1%) | 69 (8.5%) |
| 9:00 AM to 9:59 AM | 40 (2.9%) | 176 (21.6%) |
| 10:00 AM to 10:59 AM | 88 (6.3%) | 45 (5.5%) |
| 11:00 AM to 11:59 AM | 0 (0.0%) | 0 (0.0%) |
| 12:00 PM to 3:59 PM | 106 (7.6%) | 28 (3.4%) |
| 4:00 PM to 11:59 PM | 92 (6.6%) | 13 (1.6%) |
| Total | 1,387 (100.0%) | 816 (100.0%) |
Housing Occupancy in Loomis
Occupancy by Ownership in Loomis
Of the total 2,867 dwellings in Loomis, owner-occupied units account for 2,469 (86.1%), while renter-occupied units make up 398 (13.9%).
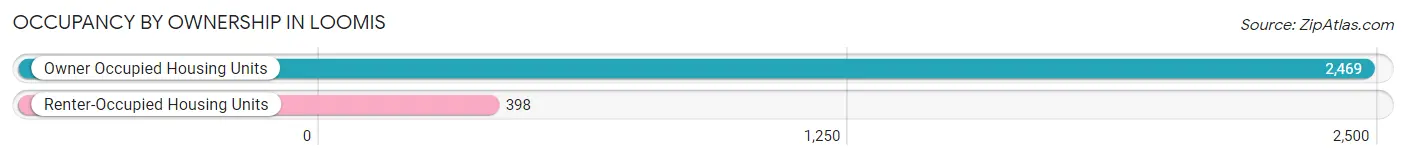
| Occupancy | # Housing Units | % Housing Units |
| Owner Occupied Housing Units | 2,469 | 86.1% |
| Renter-Occupied Housing Units | 398 | 13.9% |
| Total Occupied Housing Units | 2,867 | 100.0% |
Occupancy by Household Size in Loomis
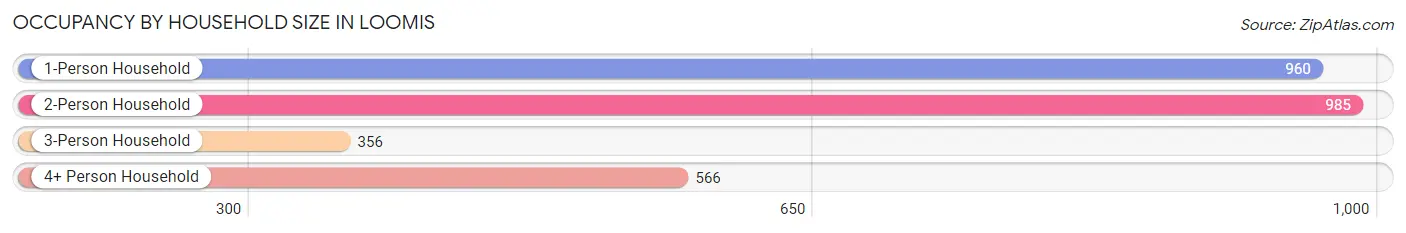
| Household Size | # Housing Units | % Housing Units |
| 1-Person Household | 960 | 33.5% |
| 2-Person Household | 985 | 34.4% |
| 3-Person Household | 356 | 12.4% |
| 4+ Person Household | 566 | 19.7% |
| Total Housing Units | 2,867 | 100.0% |
Occupancy by Ownership by Household Size in Loomis
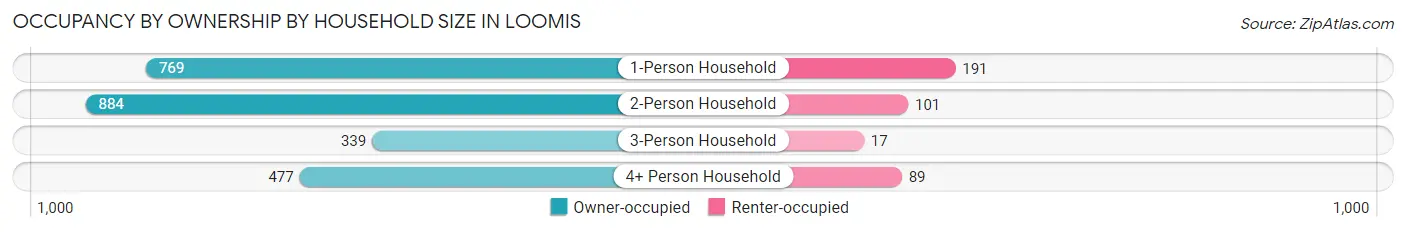
| Household Size | Owner-occupied | Renter-occupied |
| 1-Person Household | 769 (80.1%) | 191 (19.9%) |
| 2-Person Household | 884 (89.7%) | 101 (10.2%) |
| 3-Person Household | 339 (95.2%) | 17 (4.8%) |
| 4+ Person Household | 477 (84.3%) | 89 (15.7%) |
| Total Housing Units | 2,469 (86.1%) | 398 (13.9%) |
Occupancy by Educational Attainment in Loomis
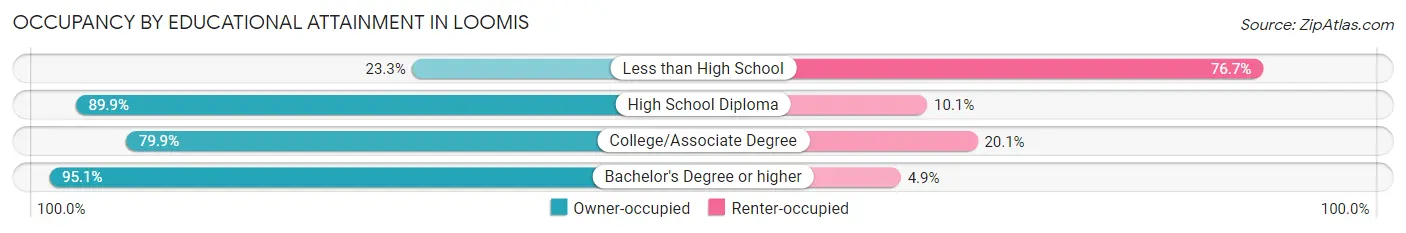
| Household Size | Owner-occupied | Renter-occupied |
| Less than High School | 27 (23.3%) | 89 (76.7%) |
| High School Diploma | 445 (89.9%) | 50 (10.1%) |
| College/Associate Degree | 784 (79.9%) | 197 (20.1%) |
| Bachelor's Degree or higher | 1,213 (95.1%) | 62 (4.9%) |
Occupancy by Age of Householder in Loomis
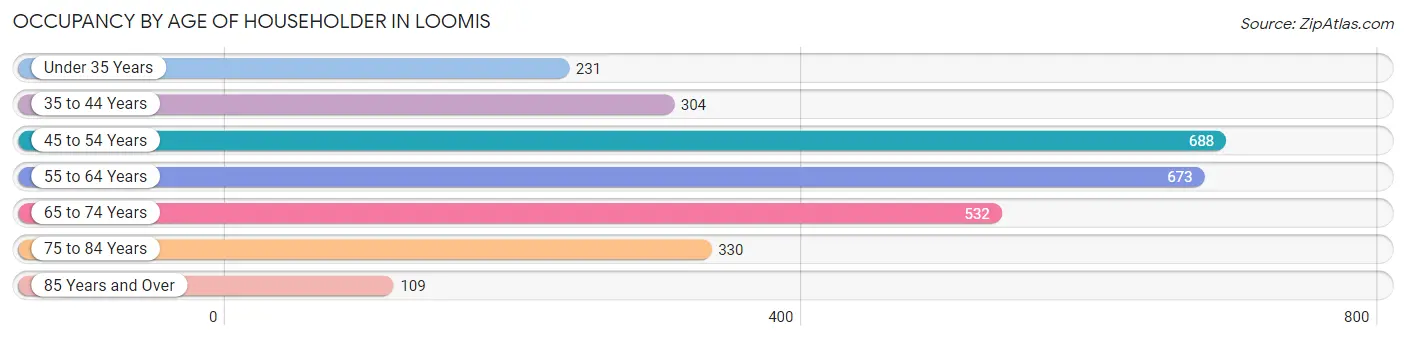
| Age Bracket | # Households | % Households |
| Under 35 Years | 231 | 8.1% |
| 35 to 44 Years | 304 | 10.6% |
| 45 to 54 Years | 688 | 24.0% |
| 55 to 64 Years | 673 | 23.5% |
| 65 to 74 Years | 532 | 18.6% |
| 75 to 84 Years | 330 | 11.5% |
| 85 Years and Over | 109 | 3.8% |
| Total | 2,867 | 100.0% |
Housing Finances in Loomis
Median Income by Occupancy in Loomis
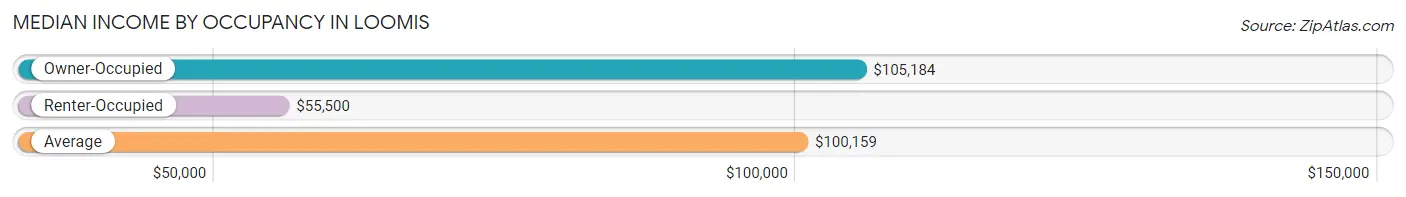
| Occupancy Type | # Households | Median Income |
| Owner-Occupied | 2,469 (86.1%) | $105,184 |
| Renter-Occupied | 398 (13.9%) | $55,500 |
| Average | 2,867 (100.0%) | $100,159 |
Occupancy by Householder Income Bracket in Loomis
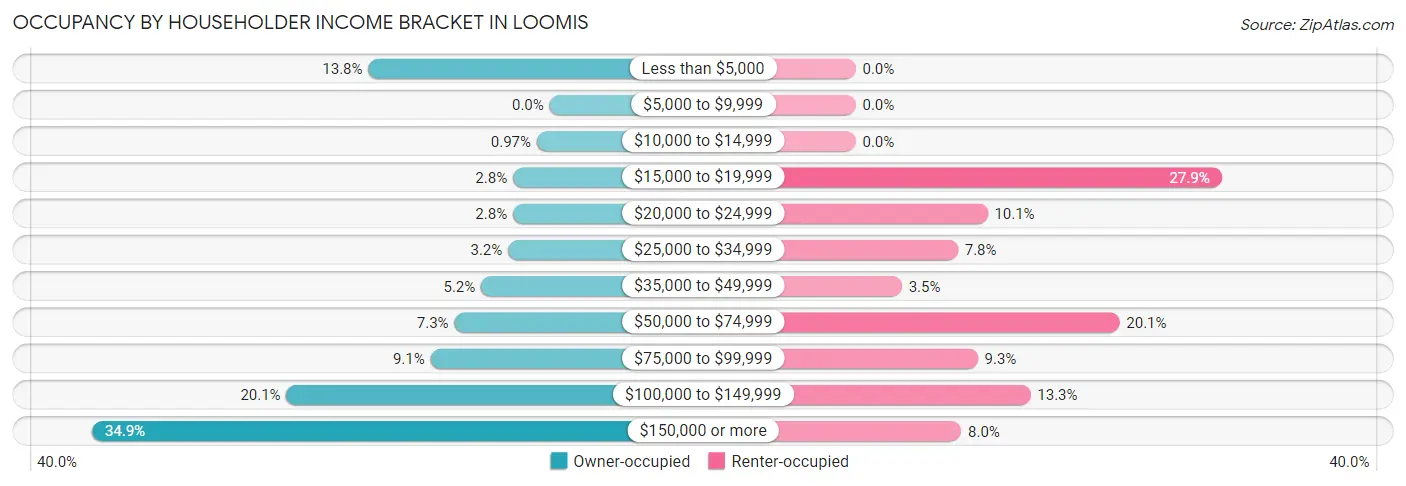
| Income Bracket | Owner-occupied | Renter-occupied |
| Less than $5,000 | 341 (13.8%) | 0 (0.0%) |
| $5,000 to $9,999 | 0 (0.0%) | 0 (0.0%) |
| $10,000 to $14,999 | 24 (1.0%) | 0 (0.0%) |
| $15,000 to $19,999 | 69 (2.8%) | 111 (27.9%) |
| $20,000 to $24,999 | 69 (2.8%) | 40 (10.1%) |
| $25,000 to $34,999 | 78 (3.2%) | 31 (7.8%) |
| $35,000 to $49,999 | 129 (5.2%) | 14 (3.5%) |
| $50,000 to $74,999 | 179 (7.2%) | 80 (20.1%) |
| $75,000 to $99,999 | 224 (9.1%) | 37 (9.3%) |
| $100,000 to $149,999 | 495 (20.1%) | 53 (13.3%) |
| $150,000 or more | 861 (34.9%) | 32 (8.0%) |
| Total | 2,469 (100.0%) | 398 (100.0%) |
Monthly Housing Cost Tiers in Loomis
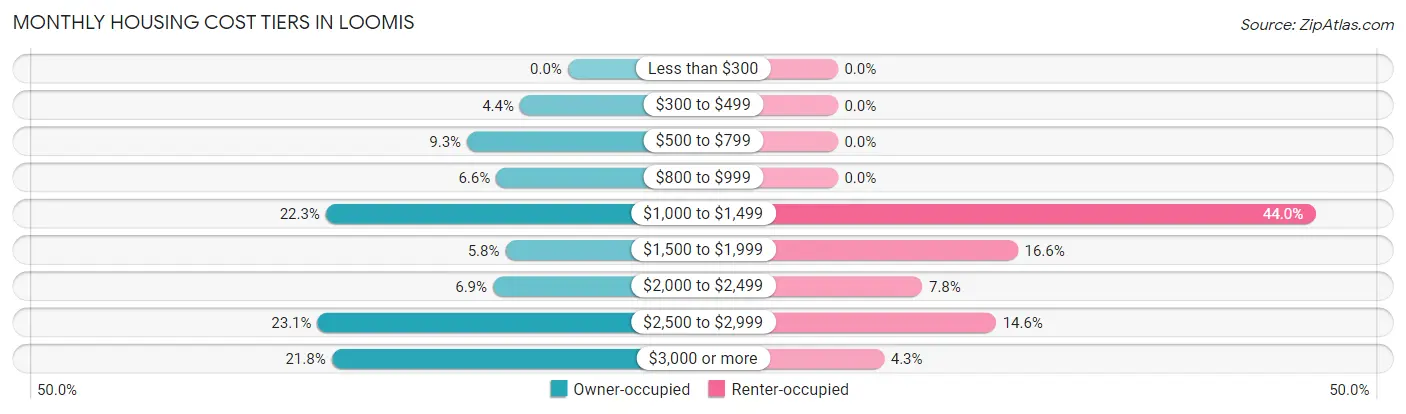
| Monthly Cost | Owner-occupied | Renter-occupied |
| Less than $300 | 0 (0.0%) | 0 (0.0%) |
| $300 to $499 | 109 (4.4%) | 0 (0.0%) |
| $500 to $799 | 229 (9.3%) | 0 (0.0%) |
| $800 to $999 | 163 (6.6%) | 0 (0.0%) |
| $1,000 to $1,499 | 550 (22.3%) | 175 (44.0%) |
| $1,500 to $1,999 | 142 (5.8%) | 66 (16.6%) |
| $2,000 to $2,499 | 170 (6.9%) | 31 (7.8%) |
| $2,500 to $2,999 | 569 (23.1%) | 58 (14.6%) |
| $3,000 or more | 537 (21.7%) | 17 (4.3%) |
| Total | 2,469 (100.0%) | 398 (100.0%) |
Physical Housing Characteristics in Loomis
Housing Structures in Loomis
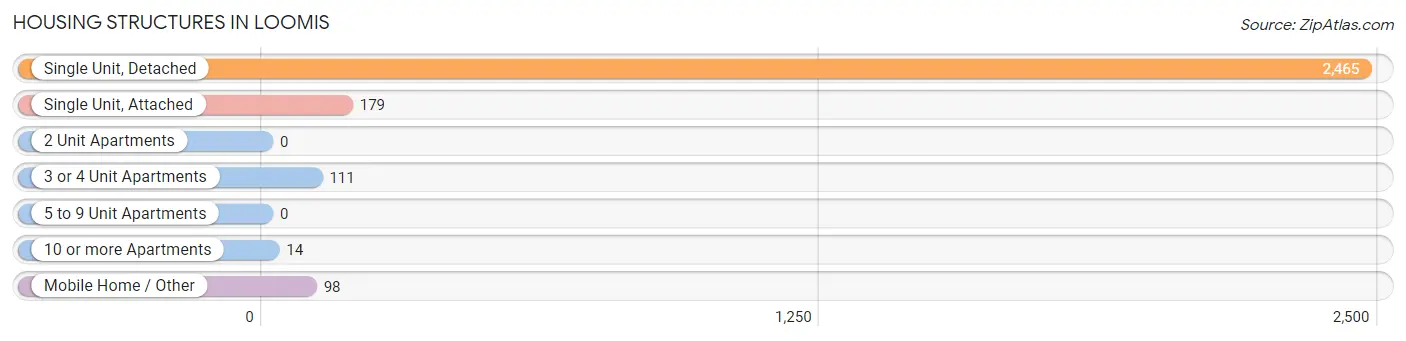
| Structure Type | # Housing Units | % Housing Units |
| Single Unit, Detached | 2,465 | 86.0% |
| Single Unit, Attached | 179 | 6.2% |
| 2 Unit Apartments | 0 | 0.0% |
| 3 or 4 Unit Apartments | 111 | 3.9% |
| 5 to 9 Unit Apartments | 0 | 0.0% |
| 10 or more Apartments | 14 | 0.5% |
| Mobile Home / Other | 98 | 3.4% |
| Total | 2,867 | 100.0% |
Housing Structures by Occupancy in Loomis
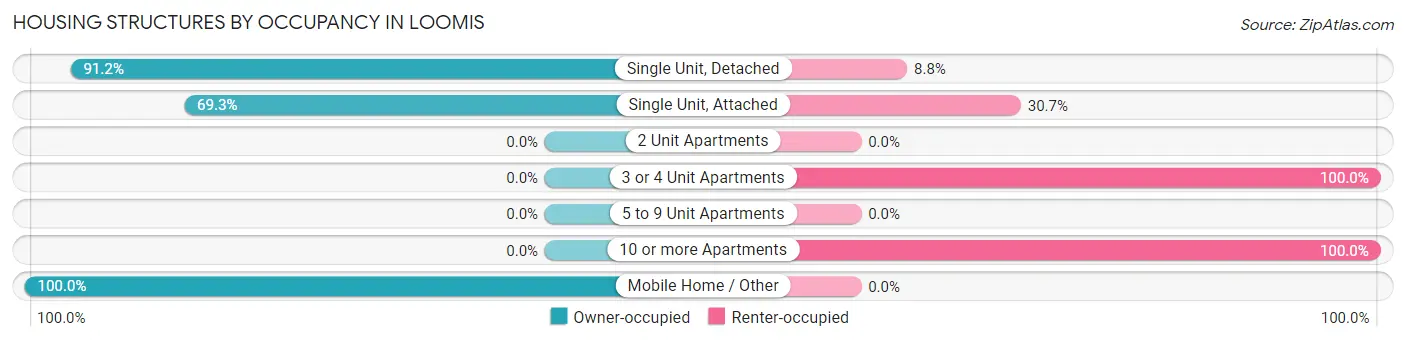
| Structure Type | Owner-occupied | Renter-occupied |
| Single Unit, Detached | 2,247 (91.2%) | 218 (8.8%) |
| Single Unit, Attached | 124 (69.3%) | 55 (30.7%) |
| 2 Unit Apartments | 0 (0.0%) | 0 (0.0%) |
| 3 or 4 Unit Apartments | 0 (0.0%) | 111 (100.0%) |
| 5 to 9 Unit Apartments | 0 (0.0%) | 0 (0.0%) |
| 10 or more Apartments | 0 (0.0%) | 14 (100.0%) |
| Mobile Home / Other | 98 (100.0%) | 0 (0.0%) |
| Total | 2,469 (86.1%) | 398 (13.9%) |
Housing Structures by Number of Rooms in Loomis
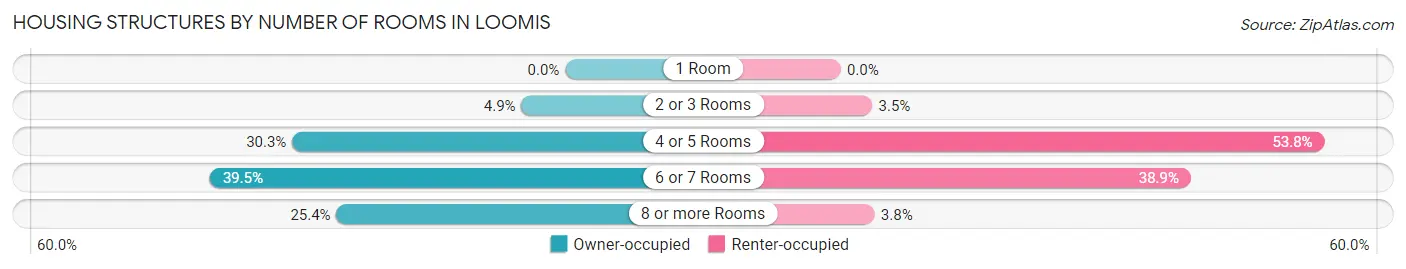
| Number of Rooms | Owner-occupied | Renter-occupied |
| 1 Room | 0 (0.0%) | 0 (0.0%) |
| 2 or 3 Rooms | 120 (4.9%) | 14 (3.5%) |
| 4 or 5 Rooms | 748 (30.3%) | 214 (53.8%) |
| 6 or 7 Rooms | 974 (39.5%) | 155 (38.9%) |
| 8 or more Rooms | 627 (25.4%) | 15 (3.8%) |
| Total | 2,469 (100.0%) | 398 (100.0%) |
Housing Structure by Heating Type in Loomis
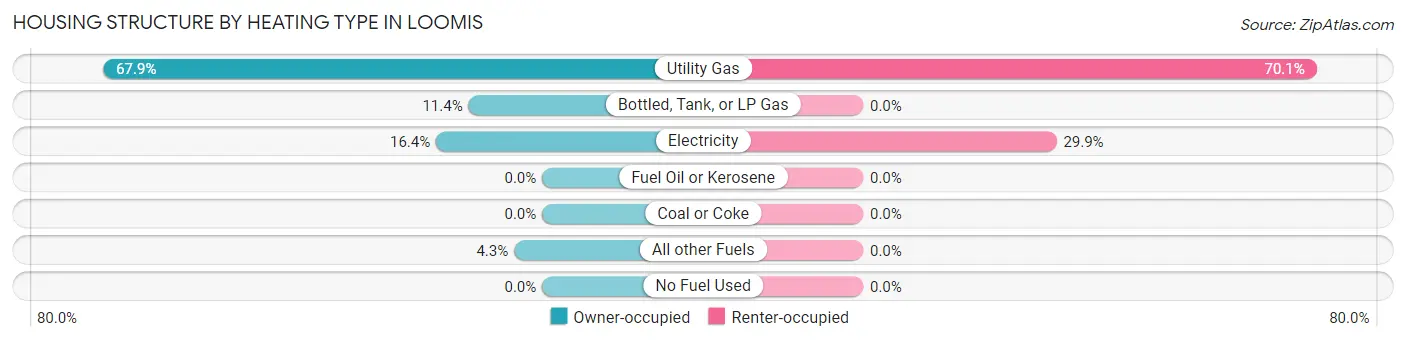
| Heating Type | Owner-occupied | Renter-occupied |
| Utility Gas | 1,676 (67.9%) | 279 (70.1%) |
| Bottled, Tank, or LP Gas | 281 (11.4%) | 0 (0.0%) |
| Electricity | 405 (16.4%) | 119 (29.9%) |
| Fuel Oil or Kerosene | 0 (0.0%) | 0 (0.0%) |
| Coal or Coke | 0 (0.0%) | 0 (0.0%) |
| All other Fuels | 107 (4.3%) | 0 (0.0%) |
| No Fuel Used | 0 (0.0%) | 0 (0.0%) |
| Total | 2,469 (100.0%) | 398 (100.0%) |
Household Vehicle Usage in Loomis
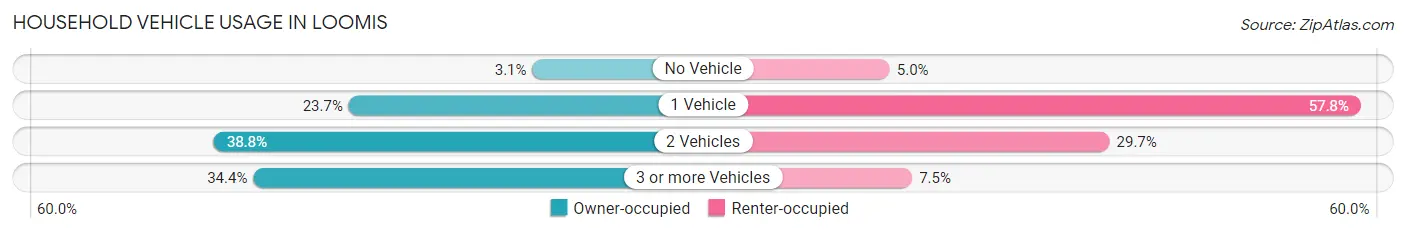
| Vehicles per Household | Owner-occupied | Renter-occupied |
| No Vehicle | 77 (3.1%) | 20 (5.0%) |
| 1 Vehicle | 585 (23.7%) | 230 (57.8%) |
| 2 Vehicles | 958 (38.8%) | 118 (29.6%) |
| 3 or more Vehicles | 849 (34.4%) | 30 (7.5%) |
| Total | 2,469 (100.0%) | 398 (100.0%) |
Real Estate & Mortgages in Loomis
Real Estate and Mortgage Overview in Loomis
| Characteristic | Without Mortgage | With Mortgage |
| Housing Units | 618 | 1,851 |
| Median Property Value | $494,300 | $640,100 |
| Median Household Income | $74,554 | $678 |
| Monthly Housing Costs | $752 | $522 |
| Real Estate Taxes | $3,000 | $0 |
Property Value by Mortgage Status in Loomis
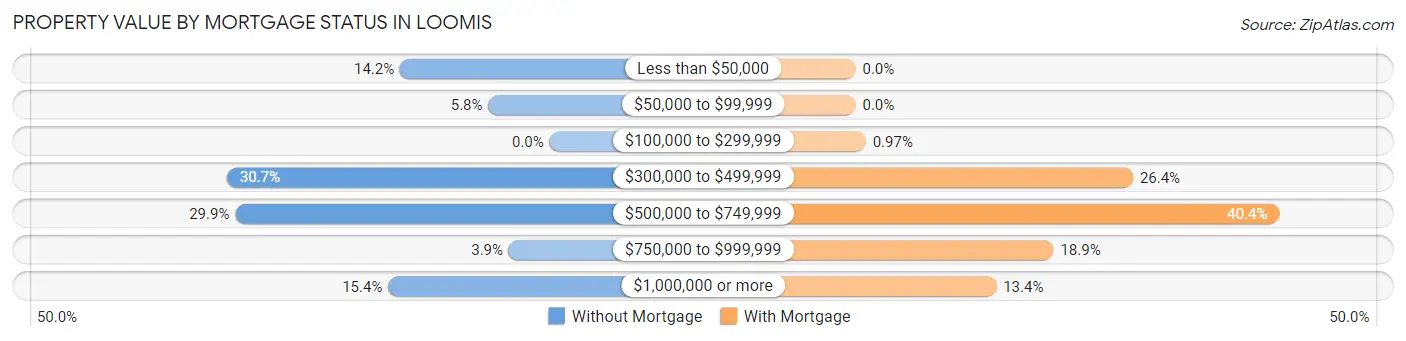
| Property Value | Without Mortgage | With Mortgage |
| Less than $50,000 | 88 (14.2%) | 0 (0.0%) |
| $50,000 to $99,999 | 36 (5.8%) | 0 (0.0%) |
| $100,000 to $299,999 | 0 (0.0%) | 18 (1.0%) |
| $300,000 to $499,999 | 190 (30.7%) | 489 (26.4%) |
| $500,000 to $749,999 | 185 (29.9%) | 747 (40.4%) |
| $750,000 to $999,999 | 24 (3.9%) | 349 (18.9%) |
| $1,000,000 or more | 95 (15.4%) | 248 (13.4%) |
| Total | 618 (100.0%) | 1,851 (100.0%) |
Household Income by Mortgage Status in Loomis
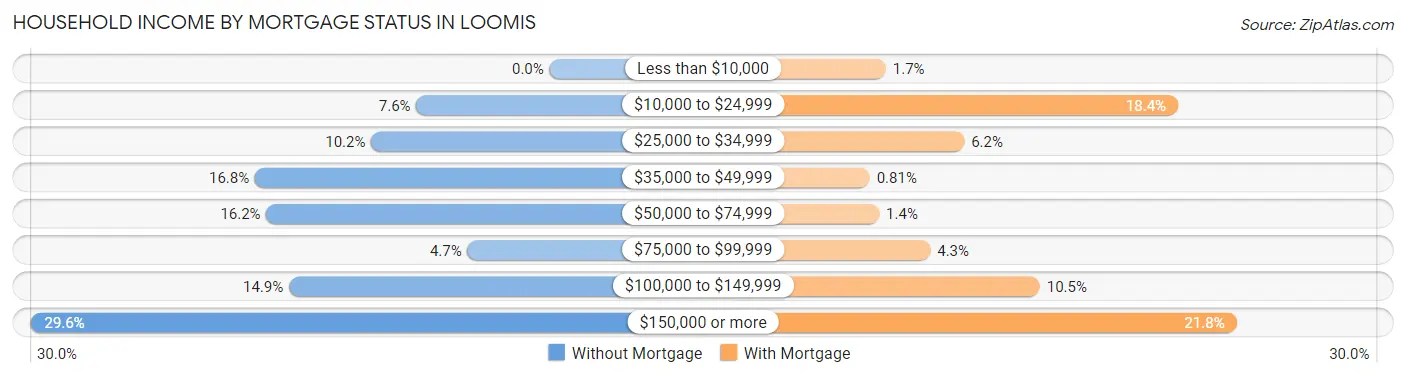
| Household Income | Without Mortgage | With Mortgage |
| Less than $10,000 | 0 (0.0%) | 32 (1.7%) |
| $10,000 to $24,999 | 47 (7.6%) | 341 (18.4%) |
| $25,000 to $34,999 | 63 (10.2%) | 115 (6.2%) |
| $35,000 to $49,999 | 104 (16.8%) | 15 (0.8%) |
| $50,000 to $74,999 | 100 (16.2%) | 25 (1.3%) |
| $75,000 to $99,999 | 29 (4.7%) | 79 (4.3%) |
| $100,000 to $149,999 | 92 (14.9%) | 195 (10.5%) |
| $150,000 or more | 183 (29.6%) | 403 (21.8%) |
| Total | 618 (100.0%) | 1,851 (100.0%) |
Property Value to Household Income Ratio in Loomis
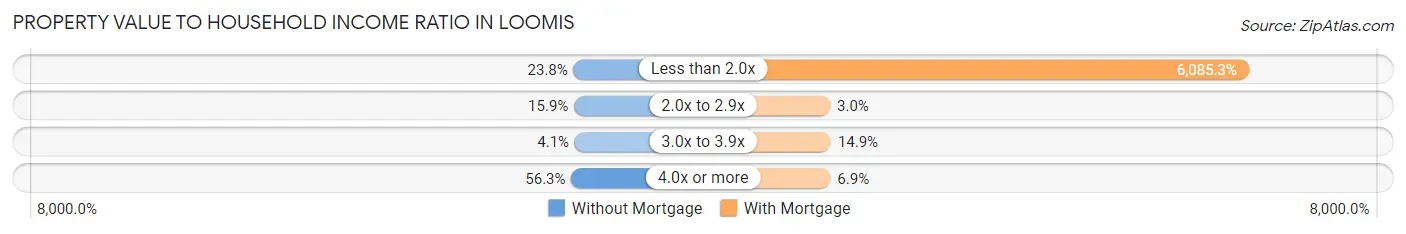
| Value-to-Income Ratio | Without Mortgage | With Mortgage |
| Less than 2.0x | 147 (23.8%) | 112,639 (6,085.3%) |
| 2.0x to 2.9x | 98 (15.9%) | 56 (3.0%) |
| 3.0x to 3.9x | 25 (4.1%) | 275 (14.9%) |
| 4.0x or more | 348 (56.3%) | 127 (6.9%) |
| Total | 618 (100.0%) | 1,851 (100.0%) |
Real Estate Taxes by Mortgage Status in Loomis
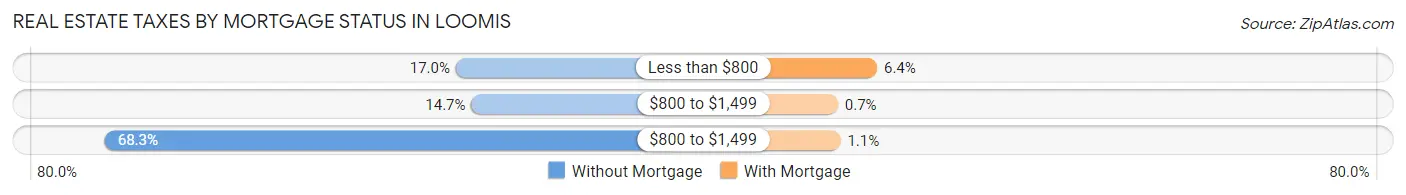
| Property Taxes | Without Mortgage | With Mortgage |
| Less than $800 | 105 (17.0%) | 119 (6.4%) |
| $800 to $1,499 | 91 (14.7%) | 13 (0.7%) |
| $800 to $1,499 | 422 (68.3%) | 20 (1.1%) |
| Total | 618 (100.0%) | 1,851 (100.0%) |
Health & Disability in Loomis
Health Insurance Coverage by Age in Loomis
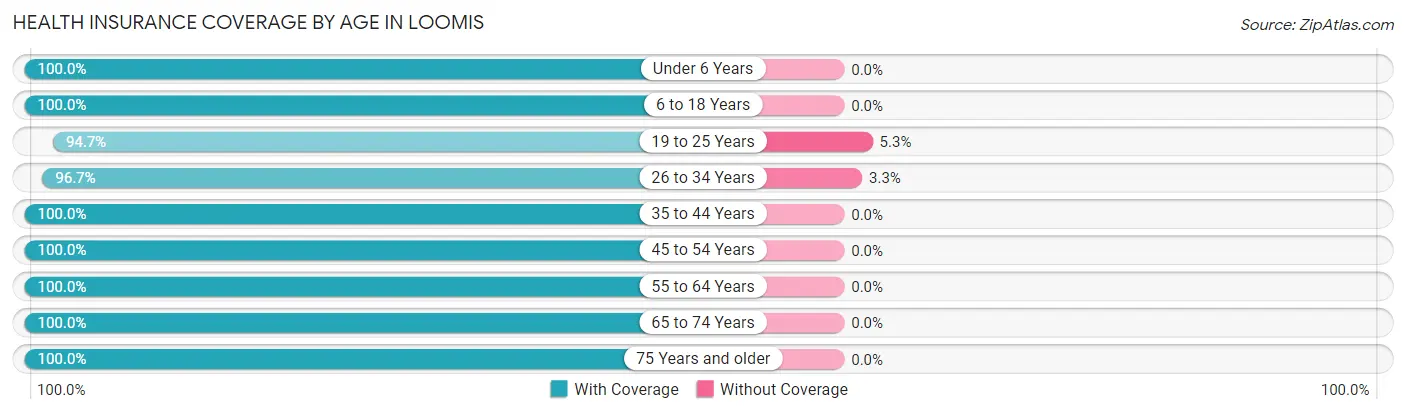
| Age Bracket | With Coverage | Without Coverage |
| Under 6 Years | 328 (100.0%) | 0 (0.0%) |
| 6 to 18 Years | 1,117 (100.0%) | 0 (0.0%) |
| 19 to 25 Years | 376 (94.7%) | 21 (5.3%) |
| 26 to 34 Years | 582 (96.7%) | 20 (3.3%) |
| 35 to 44 Years | 757 (100.0%) | 0 (0.0%) |
| 45 to 54 Years | 1,133 (100.0%) | 0 (0.0%) |
| 55 to 64 Years | 994 (100.0%) | 0 (0.0%) |
| 65 to 74 Years | 869 (100.0%) | 0 (0.0%) |
| 75 Years and older | 610 (100.0%) | 0 (0.0%) |
| Total | 6,766 (99.4%) | 41 (0.6%) |
Health Insurance Coverage by Citizenship Status in Loomis
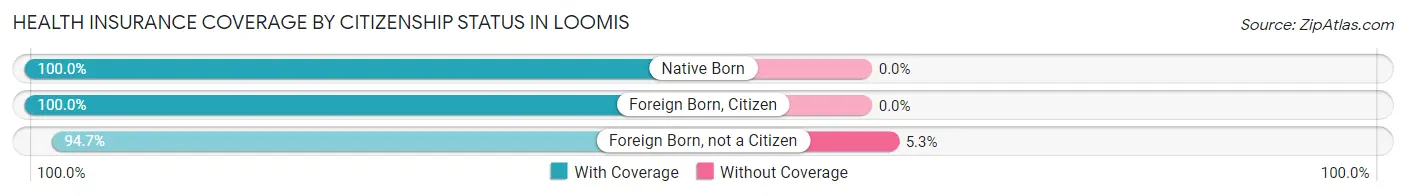
| Citizenship Status | With Coverage | Without Coverage |
| Native Born | 328 (100.0%) | 0 (0.0%) |
| Foreign Born, Citizen | 1,117 (100.0%) | 0 (0.0%) |
| Foreign Born, not a Citizen | 376 (94.7%) | 21 (5.3%) |
Health Insurance Coverage by Household Income in Loomis
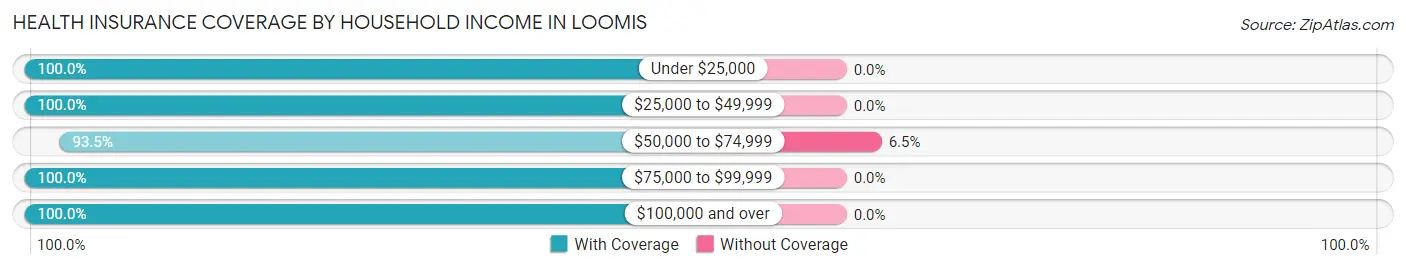
| Household Income | With Coverage | Without Coverage |
| Under $25,000 | 772 (100.0%) | 0 (0.0%) |
| $25,000 to $49,999 | 444 (100.0%) | 0 (0.0%) |
| $50,000 to $74,999 | 586 (93.5%) | 41 (6.5%) |
| $75,000 to $99,999 | 514 (100.0%) | 0 (0.0%) |
| $100,000 and over | 4,442 (100.0%) | 0 (0.0%) |
Public vs Private Health Insurance Coverage by Age in Loomis
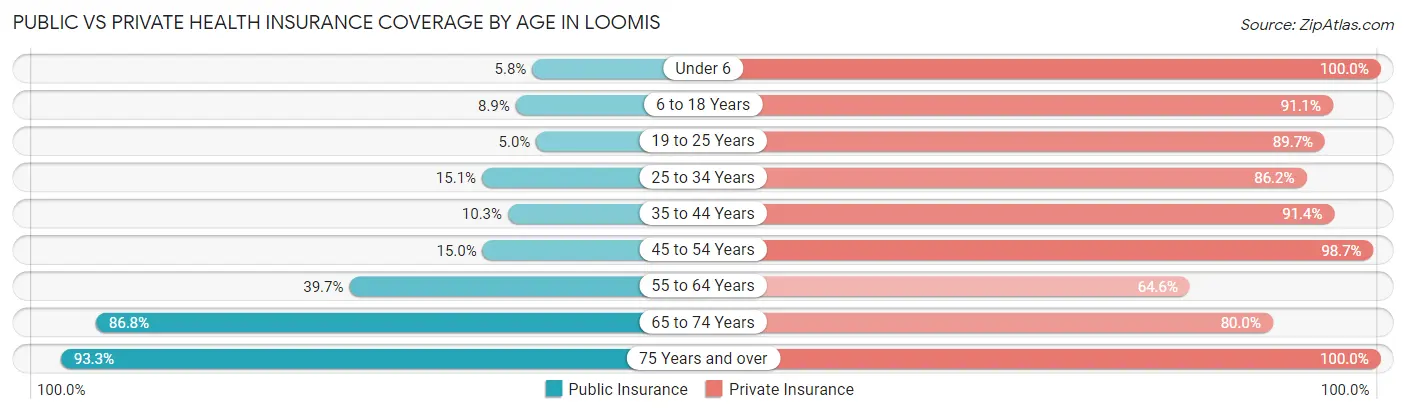
| Age Bracket | Public Insurance | Private Insurance |
| Under 6 | 19 (5.8%) | 328 (100.0%) |
| 6 to 18 Years | 99 (8.9%) | 1,018 (91.1%) |
| 19 to 25 Years | 20 (5.0%) | 356 (89.7%) |
| 25 to 34 Years | 91 (15.1%) | 519 (86.2%) |
| 35 to 44 Years | 78 (10.3%) | 692 (91.4%) |
| 45 to 54 Years | 170 (15.0%) | 1,118 (98.7%) |
| 55 to 64 Years | 395 (39.7%) | 642 (64.6%) |
| 65 to 74 Years | 754 (86.8%) | 695 (80.0%) |
| 75 Years and over | 569 (93.3%) | 610 (100.0%) |
| Total | 2,195 (32.3%) | 5,978 (87.8%) |
Disability Status by Sex by Age in Loomis
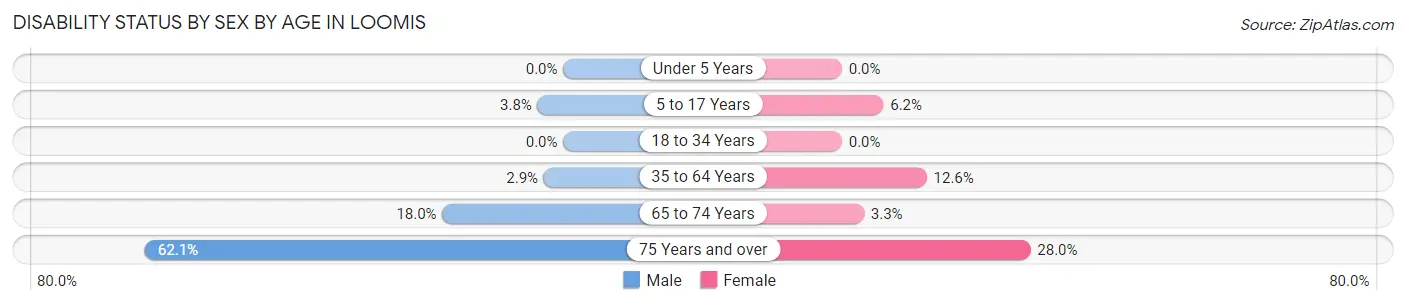
| Age Bracket | Male | Female |
| Under 5 Years | 0 (0.0%) | 0 (0.0%) |
| 5 to 17 Years | 24 (3.8%) | 22 (6.2%) |
| 18 to 34 Years | 0 (0.0%) | 0 (0.0%) |
| 35 to 64 Years | 45 (2.9%) | 166 (12.6%) |
| 65 to 74 Years | 63 (17.9%) | 17 (3.3%) |
| 75 Years and over | 146 (62.1%) | 105 (28.0%) |
Disability Class by Sex by Age in Loomis
Disability Class: Hearing Difficulty
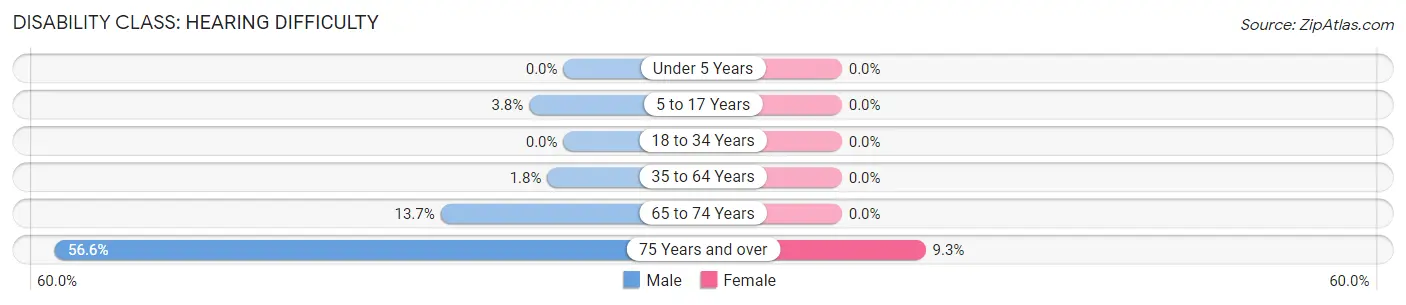
| Age Bracket | Male | Female |
| Under 5 Years | 0 (0.0%) | 0 (0.0%) |
| 5 to 17 Years | 24 (3.8%) | 0 (0.0%) |
| 18 to 34 Years | 0 (0.0%) | 0 (0.0%) |
| 35 to 64 Years | 28 (1.8%) | 0 (0.0%) |
| 65 to 74 Years | 48 (13.7%) | 0 (0.0%) |
| 75 Years and over | 133 (56.6%) | 35 (9.3%) |
Disability Class: Vision Difficulty
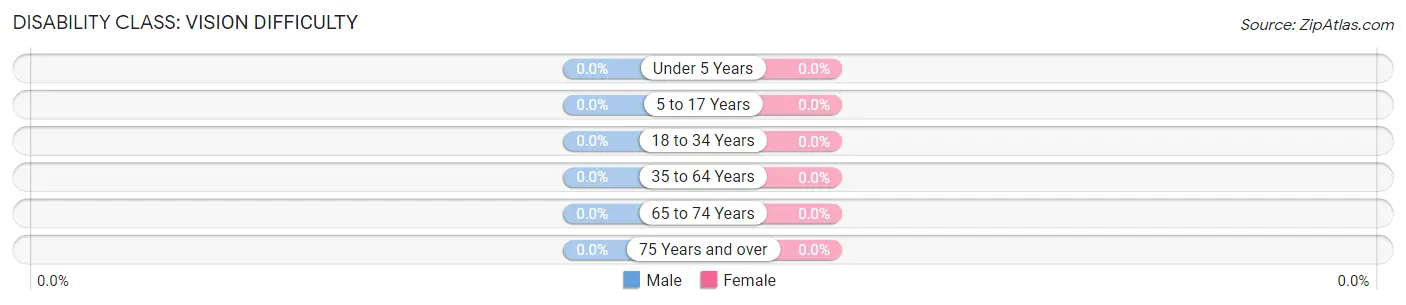
| Age Bracket | Male | Female |
| Under 5 Years | 0 (0.0%) | 0 (0.0%) |
| 5 to 17 Years | 0 (0.0%) | 0 (0.0%) |
| 18 to 34 Years | 0 (0.0%) | 0 (0.0%) |
| 35 to 64 Years | 0 (0.0%) | 0 (0.0%) |
| 65 to 74 Years | 0 (0.0%) | 0 (0.0%) |
| 75 Years and over | 0 (0.0%) | 0 (0.0%) |
Disability Class: Cognitive Difficulty
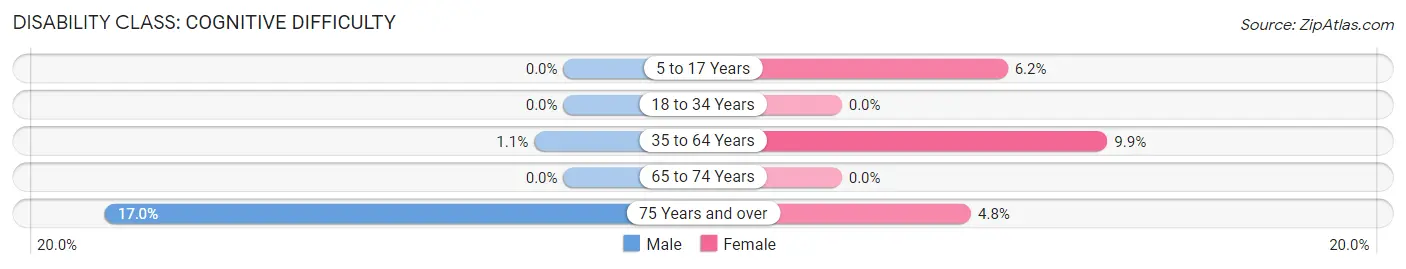
| Age Bracket | Male | Female |
| 5 to 17 Years | 0 (0.0%) | 22 (6.2%) |
| 18 to 34 Years | 0 (0.0%) | 0 (0.0%) |
| 35 to 64 Years | 17 (1.1%) | 130 (9.9%) |
| 65 to 74 Years | 0 (0.0%) | 0 (0.0%) |
| 75 Years and over | 40 (17.0%) | 18 (4.8%) |
Disability Class: Ambulatory Difficulty
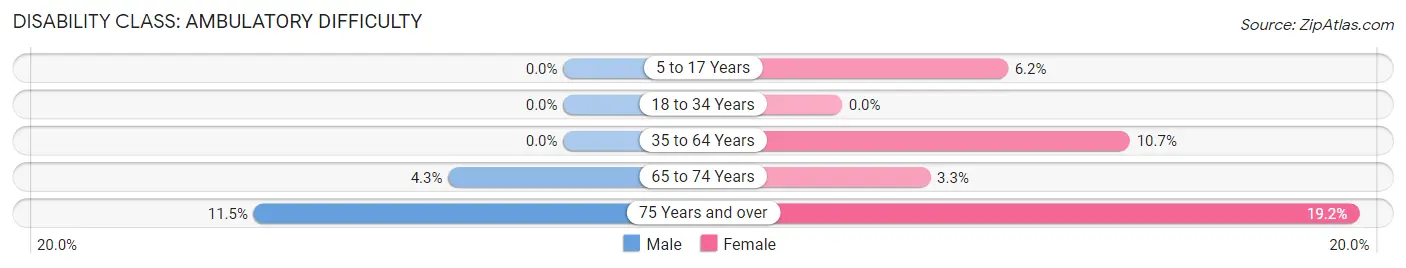
| Age Bracket | Male | Female |
| 5 to 17 Years | 0 (0.0%) | 22 (6.2%) |
| 18 to 34 Years | 0 (0.0%) | 0 (0.0%) |
| 35 to 64 Years | 0 (0.0%) | 141 (10.7%) |
| 65 to 74 Years | 15 (4.3%) | 17 (3.3%) |
| 75 Years and over | 27 (11.5%) | 72 (19.2%) |
Disability Class: Self-Care Difficulty
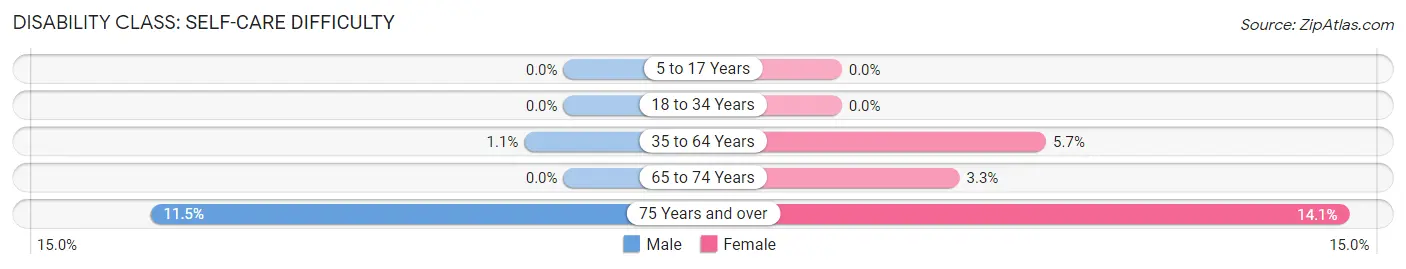
| Age Bracket | Male | Female |
| 5 to 17 Years | 0 (0.0%) | 0 (0.0%) |
| 18 to 34 Years | 0 (0.0%) | 0 (0.0%) |
| 35 to 64 Years | 17 (1.1%) | 75 (5.7%) |
| 65 to 74 Years | 0 (0.0%) | 17 (3.3%) |
| 75 Years and over | 27 (11.5%) | 53 (14.1%) |
Technology Access in Loomis
Computing Device Access in Loomis
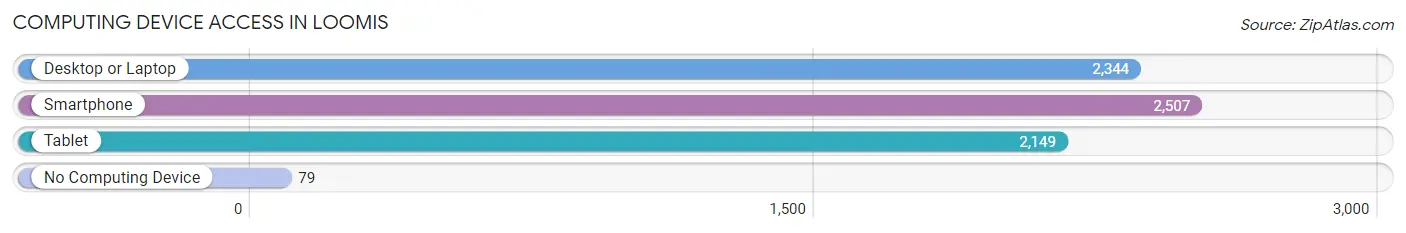
| Device Type | # Households | % Households |
| Desktop or Laptop | 2,344 | 81.8% |
| Smartphone | 2,507 | 87.4% |
| Tablet | 2,149 | 75.0% |
| No Computing Device | 79 | 2.8% |
| Total | 2,867 | 100.0% |
Internet Access in Loomis
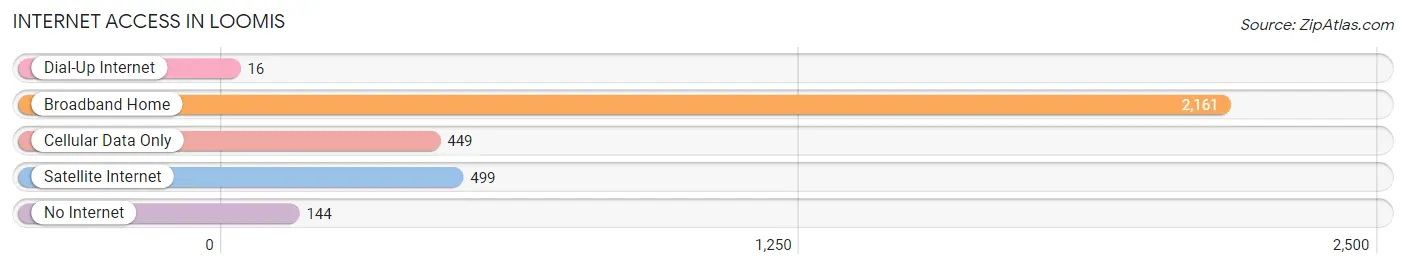
| Internet Type | # Households | % Households |
| Dial-Up Internet | 16 | 0.6% |
| Broadband Home | 2,161 | 75.4% |
| Cellular Data Only | 449 | 15.7% |
| Satellite Internet | 499 | 17.4% |
| No Internet | 144 | 5.0% |
| Total | 2,867 | 100.0% |
Loomis Summary
Loomis is a small town located in Placer County, California, United States. It is situated in the Sierra Nevada foothills, approximately 25 miles northeast of Sacramento. The population was 6,430 at the 2010 census, up from 5,344 at the 2000 census.
History
The area that is now Loomis was originally inhabited by the Maidu Indians. The first non-native settlers arrived in the area in the 1850s, and the town was officially founded in 1864. It was named after James Loomis, a local rancher and businessman.
In the late 19th century, Loomis was a thriving agricultural community, with orchards, vineyards, and grain fields. The town was also home to several sawmills and a brickyard. In the early 20th century, the town began to decline as the agricultural industry shifted away from the area.
Geography
Loomis is located at 38°48'25" North, 121°11'17" West (38.806944, -121.188056). It is situated in the Sierra Nevada foothills, approximately 25 miles northeast of Sacramento. The town is located at an elevation of 845 feet (258 m).
The town is bordered by the cities of Rocklin to the north, Lincoln to the east, and Granite Bay to the south. The town is also bordered by the unincorporated communities of Sheridan to the west and Penryn to the northwest.
Climate
Loomis has a Mediterranean climate, with hot, dry summers and cool, wet winters. The average annual temperature is 61°F (16°C). The average annual precipitation is 22.5 inches (572 mm).
Demographics
As of the 2010 census, there were 6,430 people, 2,521 households, and 1,717 families residing in the town. The population density was 1,845.3 people per square mile (715.2/km2). There were 2,717 housing units at an average density of 776.3 per square mile (300.2/km2). The racial makeup of the town was 87.2% White, 1.2% African American, 0.7% Native American, 5.2% Asian, 0.2% Pacific Islander, 2.7% from other races, and 3.0% from two or more races. Hispanic or Latino of any race were 8.2% of the population.
Economy
Loomis is a small, rural town with a primarily agricultural economy. The town is home to several wineries, as well as a number of small businesses. The town is also home to several large employers, including the Placer County Sheriff's Office, the Placer County Fire Department, and the Placer County Water Agency.
The town is also home to several educational institutions, including Del Oro High School, Franklin Elementary School, and Loomis Grammar School.
Conclusion
Loomis is a small town located in Placer County, California, United States. It is situated in the Sierra Nevada foothills, approximately 25 miles northeast of Sacramento. The population was 6,430 at the 2010 census, up from 5,344 at the 2000 census. The town has a Mediterranean climate, with hot, dry summers and cool, wet winters. The town has a primarily agricultural economy, with several wineries and small businesses. The town is also home to several large employers, including the Placer County Sheriff's Office, the Placer County Fire Department, and the Placer County Water Agency.
Common Questions
What is Per Capita Income in Loomis?
Per Capita income in Loomis is $63,572.
What is the Median Family Income in Loomis?
Median Family Income in Loomis is $140,750.
What is the Median Household income in Loomis?
Median Household Income in Loomis is $100,159.
What is Income or Wage Gap in Loomis?
Income or Wage Gap in Loomis is 26.1%.
Women in Loomis earn 73.9 cents for every dollar earned by a man.
What is Inequality or Gini Index in Loomis?
Inequality or Gini Index in Loomis is 0.57.
What is the Total Population of Loomis?
Total Population of Loomis is 6,831.
What is the Total Male Population of Loomis?
Total Male Population of Loomis is 3,772.
What is the Total Female Population of Loomis?
Total Female Population of Loomis is 3,059.
What is the Ratio of Males per 100 Females in Loomis?
There are 123.31 Males per 100 Females in Loomis.
What is the Ratio of Females per 100 Males in Loomis?
There are 81.10 Females per 100 Males in Loomis.
What is the Median Population Age in Loomis?
Median Population Age in Loomis is 46.6 Years.
What is the Average Family Size in Loomis
Average Family Size in Loomis is 3.0 People.
What is the Average Household Size in Loomis
Average Household Size in Loomis is 2.4 People.
How Large is the Labor Force in Loomis?
There are 3,089 People in the Labor Forcein in Loomis.
What is the Percentage of People in the Labor Force in Loomis?
53.7% of People are in the Labor Force in Loomis.
What is the Unemployment Rate in Loomis?
Unemployment Rate in Loomis is 4.0%.