El Sobrante CDP Riverside County, CA Map & Demographics
El Sobrante CDP Riverside County Overview
$62,417
PER CAPITA INCOME
$194,056
AVG FAMILY INCOME
$180,761
AVG HOUSEHOLD INCOME
13.6%
WAGE / INCOME GAP [ % ]
86.4¢/ $1
WAGE / INCOME GAP [ $ ]
0.35
INEQUALITY / GINI INDEX
12,127
TOTAL POPULATION
6,052
MALE POPULATION
6,075
FEMALE POPULATION
99.62
MALES / 100 FEMALES
100.38
FEMALES / 100 MALES
39.2
MEDIAN AGE
3.4
AVG FAMILY SIZE
3.2
AVG HOUSEHOLD SIZE
6,938
LABOR FORCE [ PEOPLE ]
71.9%
PERCENT IN LABOR FORCE
4.0%
UNEMPLOYMENT RATE
Income in El Sobrante CDP Riverside County
Income Overview in El Sobrante CDP Riverside County
Per Capita Income in El Sobrante CDP Riverside County is $62,417, while median incomes of families and households are $194,056 and $180,761 respectively.
| Characteristic | Number | Measure |
| Per Capita Income | 12,127 | $62,417 |
| Median Family Income | 3,350 | $194,056 |
| Mean Family Income | 3,350 | $203,824 |
| Median Household Income | 3,784 | $180,761 |
| Mean Household Income | 3,784 | $195,230 |
| Income Deficit | 3,350 | $0 |
| Wage / Income Gap (%) | 12,127 | 13.60% |
| Wage / Income Gap ($) | 12,127 | 86.40¢ per $1 |
| Gini / Inequality Index | 12,127 | 0.35 |
Earnings by Sex in El Sobrante CDP Riverside County
Average Earnings in El Sobrante CDP Riverside County are $73,707, $80,149 for men and $69,250 for women, a difference of 13.6%.
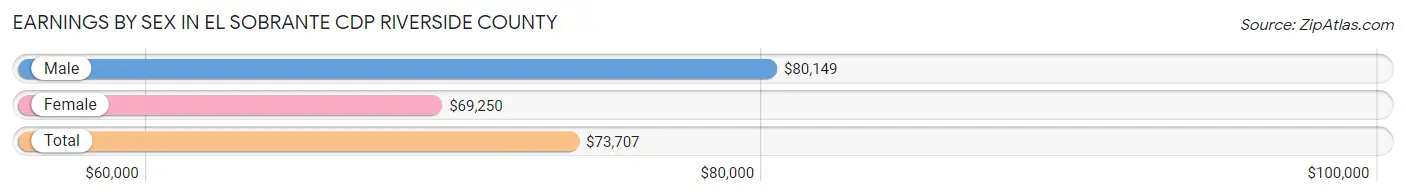
| Sex | Number | Average Earnings |
| Male | 4,018 (58.3%) | $80,149 |
| Female | 2,877 (41.7%) | $69,250 |
| Total | 6,895 (100.0%) | $73,707 |
Earnings by Sex by Income Bracket in El Sobrante CDP Riverside County
The most common earnings brackets in El Sobrante CDP Riverside County are $100,000+ for men (1,615 | 40.2%) and $100,000+ for women (1,080 | 37.5%).
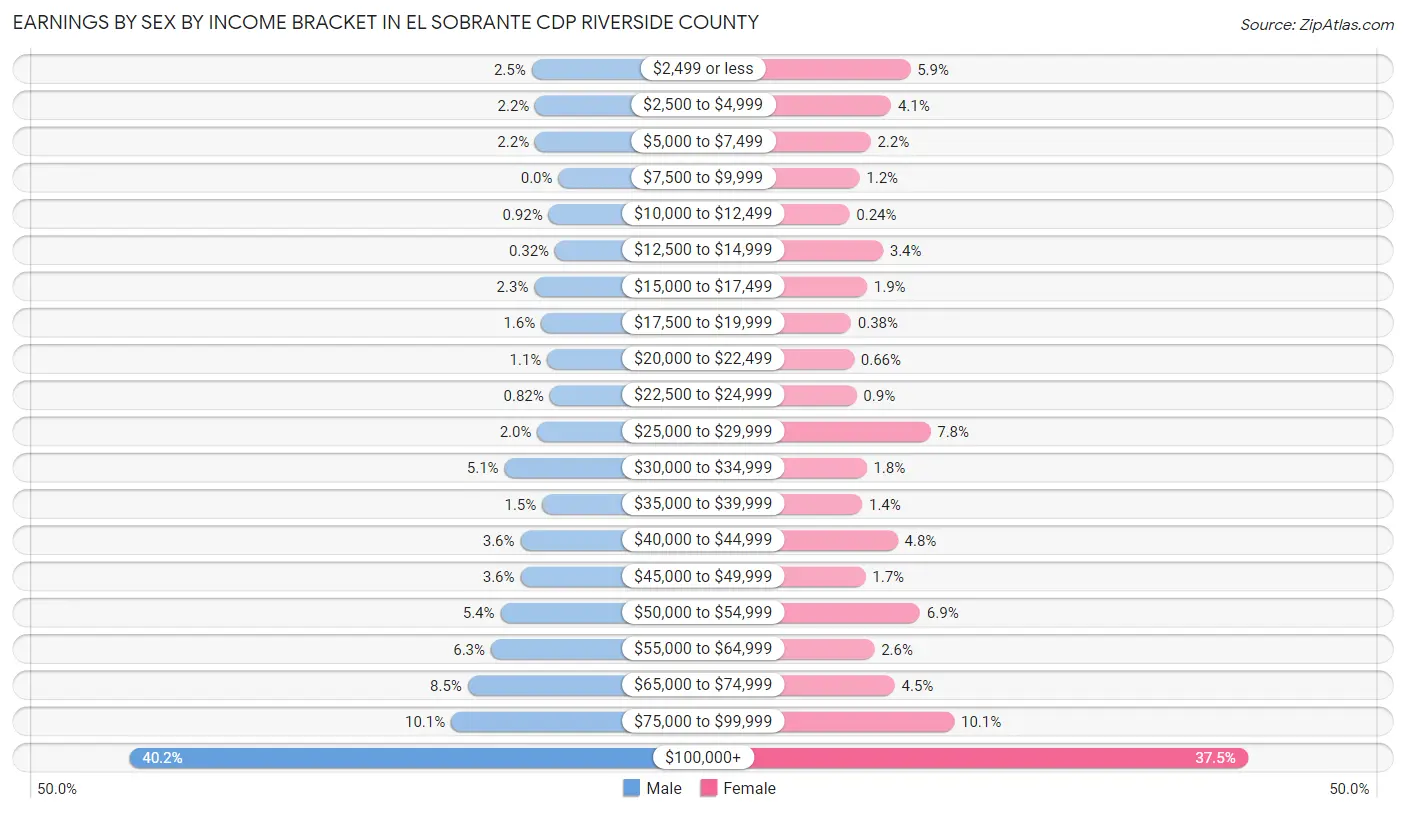
| Income | Male | Female |
| $2,499 or less | 101 (2.5%) | 171 (5.9%) |
| $2,500 to $4,999 | 87 (2.2%) | 119 (4.1%) |
| $5,000 to $7,499 | 88 (2.2%) | 64 (2.2%) |
| $7,500 to $9,999 | 0 (0.0%) | 34 (1.2%) |
| $10,000 to $12,499 | 37 (0.9%) | 7 (0.2%) |
| $12,500 to $14,999 | 13 (0.3%) | 97 (3.4%) |
| $15,000 to $17,499 | 91 (2.3%) | 54 (1.9%) |
| $17,500 to $19,999 | 65 (1.6%) | 11 (0.4%) |
| $20,000 to $22,499 | 42 (1.1%) | 19 (0.7%) |
| $22,500 to $24,999 | 33 (0.8%) | 26 (0.9%) |
| $25,000 to $29,999 | 79 (2.0%) | 225 (7.8%) |
| $30,000 to $34,999 | 203 (5.1%) | 53 (1.8%) |
| $35,000 to $39,999 | 61 (1.5%) | 41 (1.4%) |
| $40,000 to $44,999 | 143 (3.6%) | 137 (4.8%) |
| $45,000 to $49,999 | 143 (3.6%) | 50 (1.7%) |
| $50,000 to $54,999 | 218 (5.4%) | 197 (6.9%) |
| $55,000 to $64,999 | 254 (6.3%) | 74 (2.6%) |
| $65,000 to $74,999 | 341 (8.5%) | 129 (4.5%) |
| $75,000 to $99,999 | 404 (10.1%) | 289 (10.1%) |
| $100,000+ | 1,615 (40.2%) | 1,080 (37.5%) |
| Total | 4,018 (100.0%) | 2,877 (100.0%) |
Earnings by Sex by Educational Attainment in El Sobrante CDP Riverside County
Average earnings in El Sobrante CDP Riverside County are $84,948 for men and $78,675 for women, a difference of 7.4%. Men with an educational attainment of graduate degree enjoy the highest average annual earnings of $141,250, while those with high school diploma education earn the least with $59,245. Women with an educational attainment of graduate degree earn the most with the average annual earnings of $111,833, while those with college or associate's degree education have the smallest earnings of $48,606.
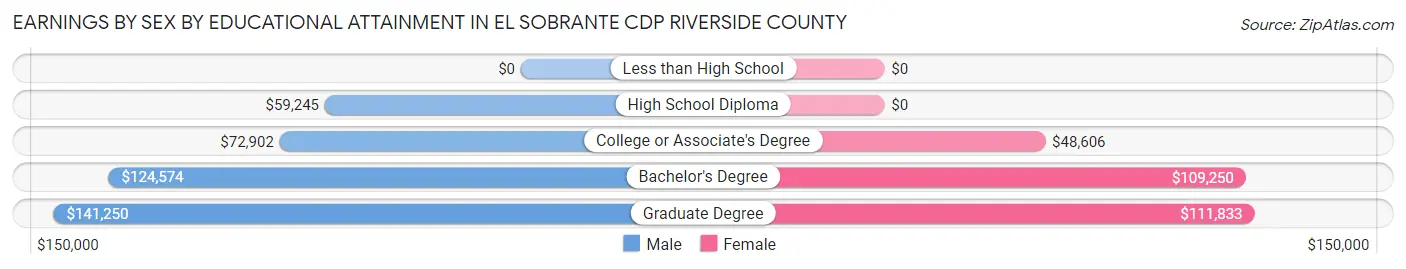
| Educational Attainment | Male Income | Female Income |
| Less than High School | - | - |
| High School Diploma | $59,245 | $0 |
| College or Associate's Degree | $72,902 | $48,606 |
| Bachelor's Degree | $124,574 | $109,250 |
| Graduate Degree | $141,250 | $111,833 |
| Total | $84,948 | $78,675 |
Family Income in El Sobrante CDP Riverside County
Family Income Brackets in El Sobrante CDP Riverside County
According to the El Sobrante CDP Riverside County family income data, there are 1,625 families falling into the $200,000+ income range, which is the most common income bracket and makes up 48.5% of all families.
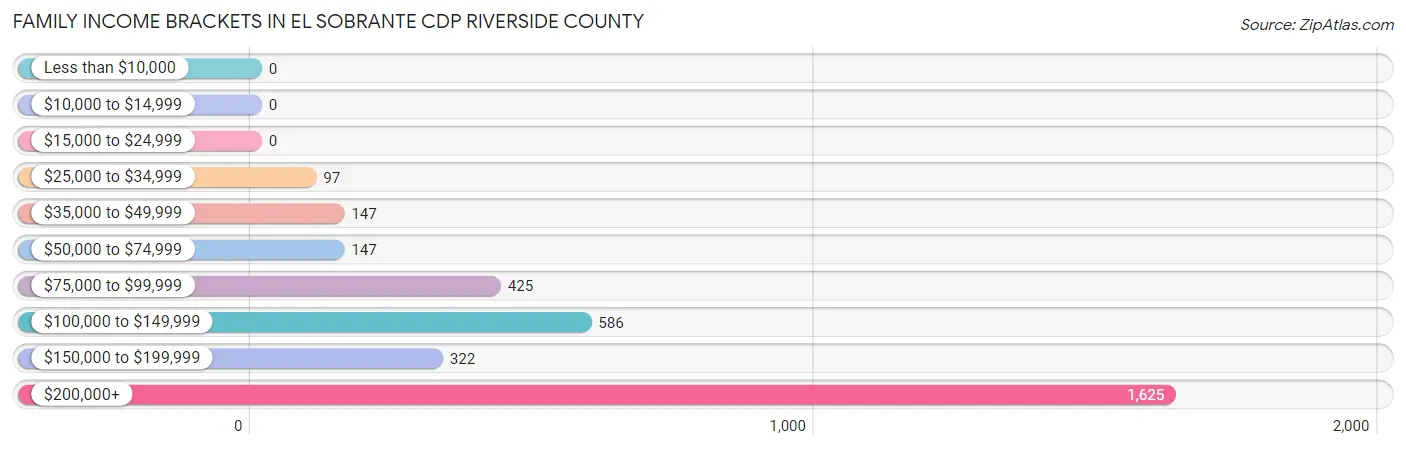
| Income Bracket | # Families | % Families |
| Less than $10,000 | 0 | 0.0% |
| $10,000 to $14,999 | 0 | 0.0% |
| $15,000 to $24,999 | 0 | 0.0% |
| $25,000 to $34,999 | 97 | 2.9% |
| $35,000 to $49,999 | 147 | 4.4% |
| $50,000 to $74,999 | 147 | 4.4% |
| $75,000 to $99,999 | 425 | 12.7% |
| $100,000 to $149,999 | 586 | 17.5% |
| $150,000 to $199,999 | 322 | 9.6% |
| $200,000+ | 1,625 | 48.5% |
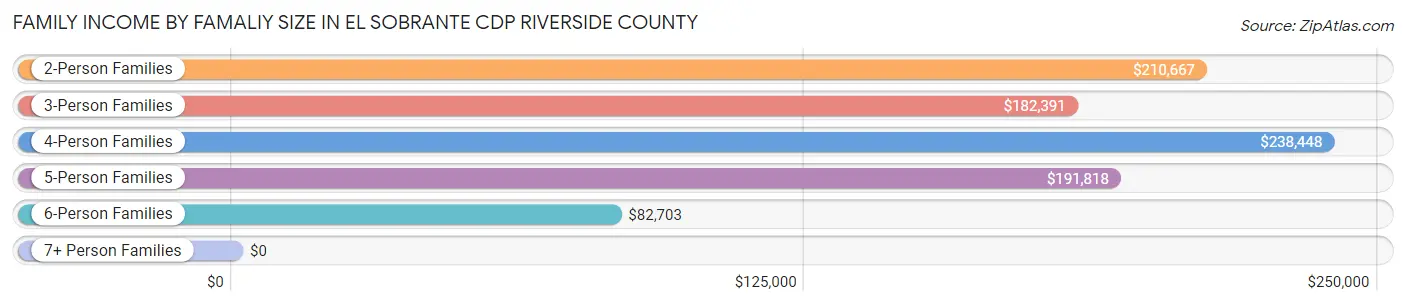
Family Income by Famaliy Size in El Sobrante CDP Riverside County
4-person families (930 | 27.8%) account for the highest median family income in El Sobrante CDP Riverside County with $238,448 per family, while 2-person families (1,306 | 39.0%) have the highest median income of $105,334 per family member.
| Income Bracket | # Families | Median Income |
| 2-Person Families | 1,306 (39.0%) | $210,667 |
| 3-Person Families | 604 (18.0%) | $182,391 |
| 4-Person Families | 930 (27.8%) | $238,448 |
| 5-Person Families | 330 (9.9%) | $191,818 |
| 6-Person Families | 166 (5.0%) | $82,703 |
| 7+ Person Families | 14 (0.4%) | $0 |
| Total | 3,350 (100.0%) | $194,056 |
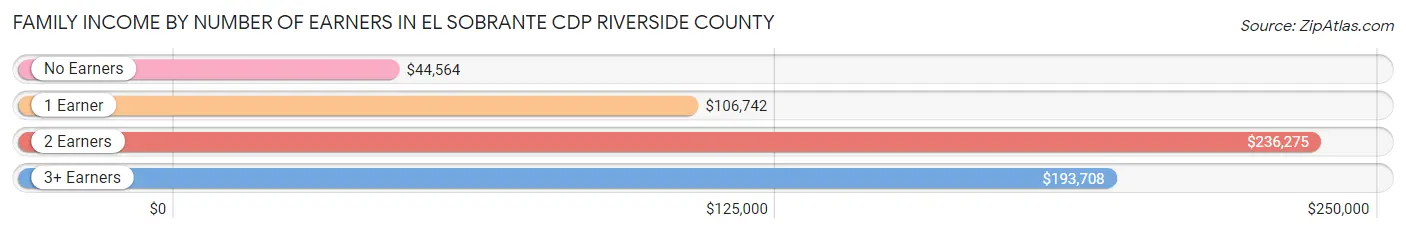
Family Income by Number of Earners in El Sobrante CDP Riverside County
The median family income in El Sobrante CDP Riverside County is $194,056, with families comprising 2 earners (2,094) having the highest median family income of $236,275, while families with no earners (189) have the lowest median family income of $44,564, accounting for 62.5% and 5.6% of families, respectively.
| Number of Earners | # Families | Median Income |
| No Earners | 189 (5.6%) | $44,564 |
| 1 Earner | 676 (20.2%) | $106,742 |
| 2 Earners | 2,094 (62.5%) | $236,275 |
| 3+ Earners | 391 (11.7%) | $193,708 |
| Total | 3,350 (100.0%) | $194,056 |
Household Income in El Sobrante CDP Riverside County
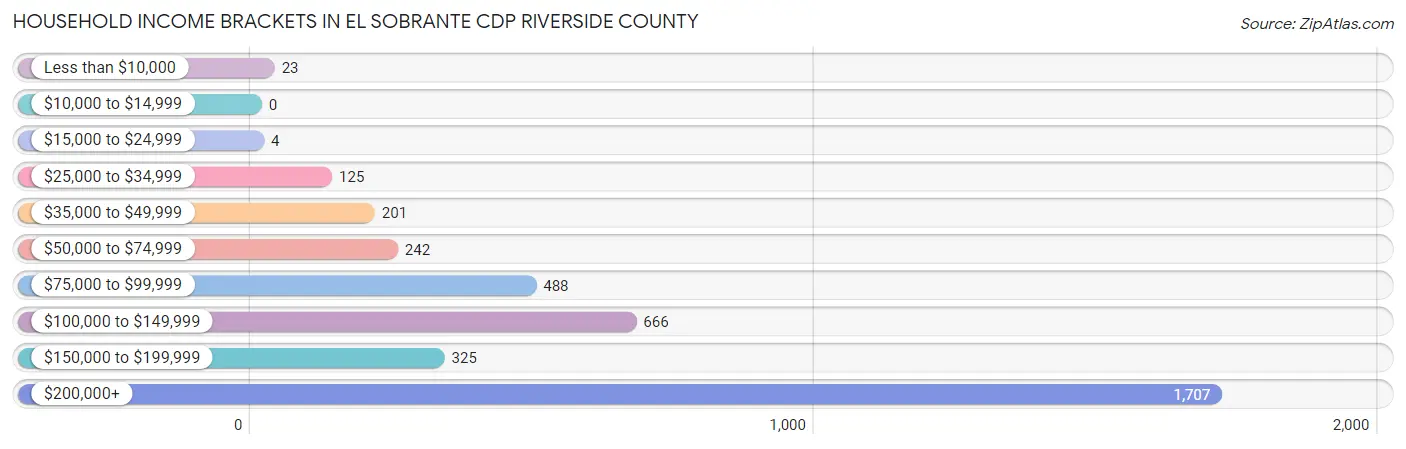
Household Income Brackets in El Sobrante CDP Riverside County
With 1,707 households falling in the category, the $200,000+ income range is the most frequent in El Sobrante CDP Riverside County, accounting for 45.1% of all households.
| Income Bracket | # Households | % Households |
| Less than $10,000 | 23 | 0.6% |
| $10,000 to $14,999 | 0 | 0.0% |
| $15,000 to $24,999 | 4 | 0.1% |
| $25,000 to $34,999 | 125 | 3.3% |
| $35,000 to $49,999 | 201 | 5.3% |
| $50,000 to $74,999 | 242 | 6.4% |
| $75,000 to $99,999 | 488 | 12.9% |
| $100,000 to $149,999 | 666 | 17.6% |
| $150,000 to $199,999 | 325 | 8.6% |
| $200,000+ | 1,707 | 45.1% |
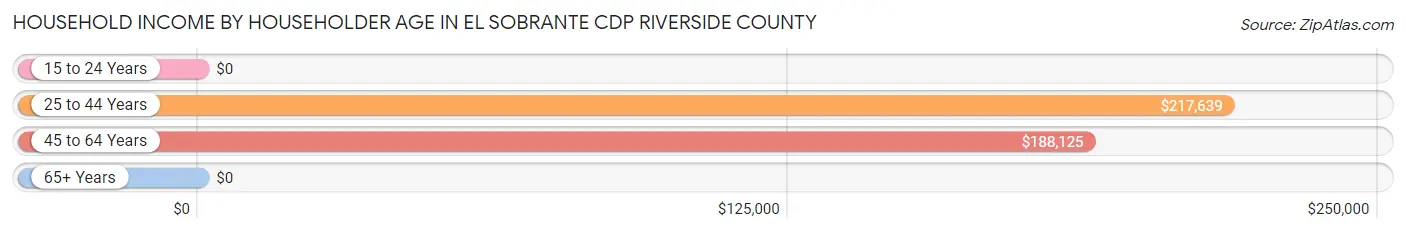
Household Income by Householder Age in El Sobrante CDP Riverside County
The median household income in El Sobrante CDP Riverside County is $180,761, with the highest median household income of $217,639 found in the 25 to 44 years age bracket for the primary householder. A total of 1,164 households (30.8%) fall into this category.
| Income Bracket | # Households | Median Income |
| 15 to 24 Years | 0 (0.0%) | $0 |
| 25 to 44 Years | 1,164 (30.8%) | $217,639 |
| 45 to 64 Years | 2,053 (54.2%) | $188,125 |
| 65+ Years | 567 (15.0%) | $0 |
| Total | 3,784 (100.0%) | $180,761 |
Poverty in El Sobrante CDP Riverside County
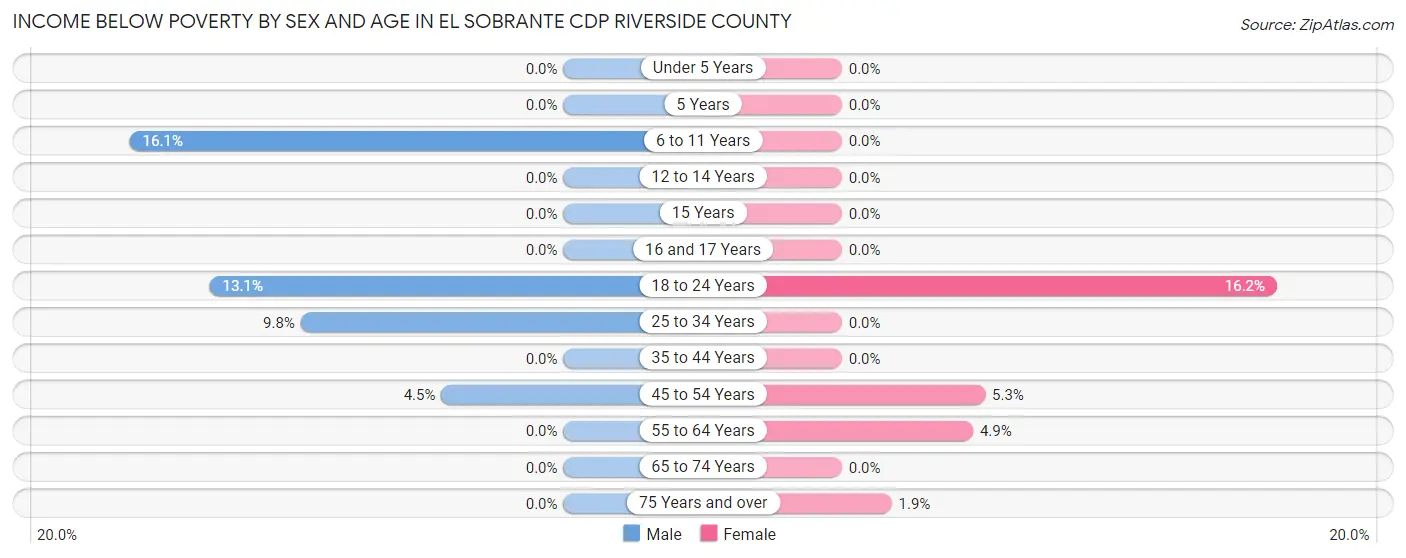
Income Below Poverty by Sex and Age in El Sobrante CDP Riverside County
With 4.0% poverty level for males and 2.9% for females among the residents of El Sobrante CDP Riverside County, 6 to 11 year old males and 18 to 24 year old females are the most vulnerable to poverty, with 52 males (16.1%) and 73 females (16.2%) in their respective age groups living below the poverty level.
| Age Bracket | Male | Female |
| Under 5 Years | 0 (0.0%) | 0 (0.0%) |
| 5 Years | 0 (0.0%) | 0 (0.0%) |
| 6 to 11 Years | 52 (16.1%) | 0 (0.0%) |
| 12 to 14 Years | 0 (0.0%) | 0 (0.0%) |
| 15 Years | 0 (0.0%) | 0 (0.0%) |
| 16 and 17 Years | 0 (0.0%) | 0 (0.0%) |
| 18 to 24 Years | 60 (13.1%) | 73 (16.2%) |
| 25 to 34 Years | 77 (9.8%) | 0 (0.0%) |
| 35 to 44 Years | 0 (0.0%) | 0 (0.0%) |
| 45 to 54 Years | 51 (4.5%) | 57 (5.3%) |
| 55 to 64 Years | 0 (0.0%) | 43 (4.9%) |
| 65 to 74 Years | 0 (0.0%) | 0 (0.0%) |
| 75 Years and over | 0 (0.0%) | 3 (1.8%) |
| Total | 240 (4.0%) | 176 (2.9%) |
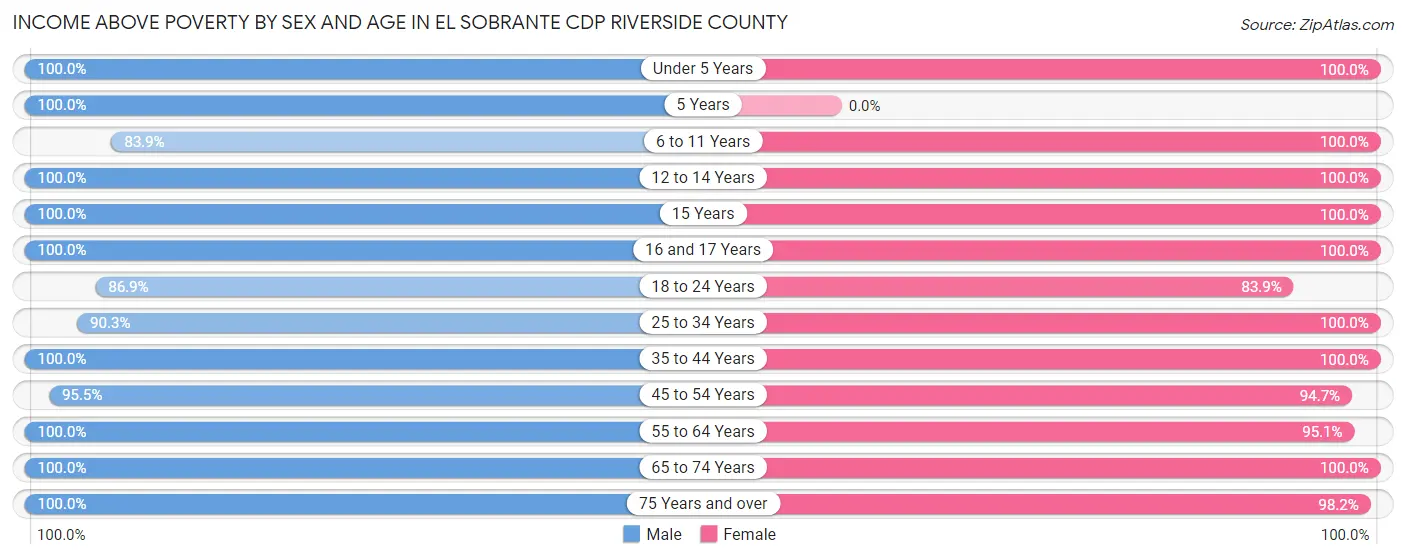
Income Above Poverty by Sex and Age in El Sobrante CDP Riverside County
According to the poverty statistics in El Sobrante CDP Riverside County, males aged under 5 years and females aged under 5 years are the age groups that are most secure financially, with 100.0% of males and 100.0% of females in these age groups living above the poverty line.
| Age Bracket | Male | Female |
| Under 5 Years | 206 (100.0%) | 154 (100.0%) |
| 5 Years | 75 (100.0%) | 0 (0.0%) |
| 6 to 11 Years | 271 (83.9%) | 937 (100.0%) |
| 12 to 14 Years | 313 (100.0%) | 394 (100.0%) |
| 15 Years | 43 (100.0%) | 33 (100.0%) |
| 16 and 17 Years | 166 (100.0%) | 119 (100.0%) |
| 18 to 24 Years | 397 (86.9%) | 379 (83.9%) |
| 25 to 34 Years | 713 (90.2%) | 478 (100.0%) |
| 35 to 44 Years | 1,118 (100.0%) | 946 (100.0%) |
| 45 to 54 Years | 1,075 (95.5%) | 1,015 (94.7%) |
| 55 to 64 Years | 771 (100.0%) | 840 (95.1%) |
| 65 to 74 Years | 553 (100.0%) | 445 (100.0%) |
| 75 Years and over | 111 (100.0%) | 159 (98.2%) |
| Total | 5,812 (96.0%) | 5,899 (97.1%) |
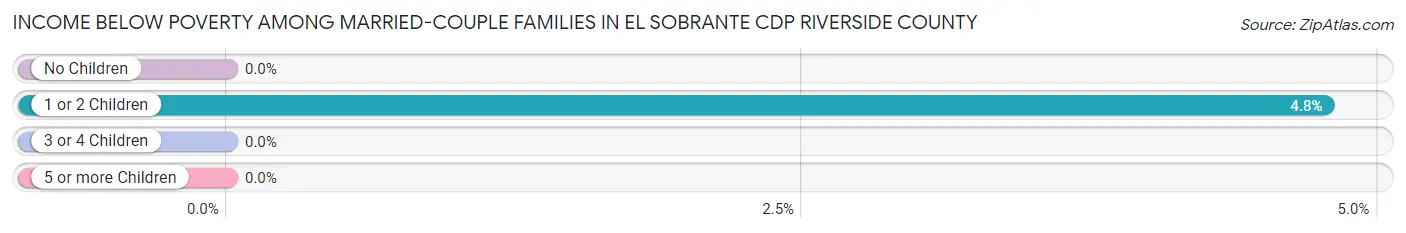
Income Below Poverty Among Married-Couple Families in El Sobrante CDP Riverside County
The poverty statistics for married-couple families in El Sobrante CDP Riverside County show that 1.8% or 51 of the total 2,786 families live below the poverty line. Families with 1 or 2 children have the highest poverty rate of 4.8%, comprising of 51 families. On the other hand, families with no children have the lowest poverty rate of 0.0%, which includes 0 families.
| Children | Above Poverty | Below Poverty |
| No Children | 1,494 (100.0%) | 0 (0.0%) |
| 1 or 2 Children | 1,019 (95.2%) | 51 (4.8%) |
| 3 or 4 Children | 208 (100.0%) | 0 (0.0%) |
| 5 or more Children | 14 (100.0%) | 0 (0.0%) |
| Total | 2,735 (98.2%) | 51 (1.8%) |
Income Below Poverty Among Single-Parent Households in El Sobrante CDP Riverside County
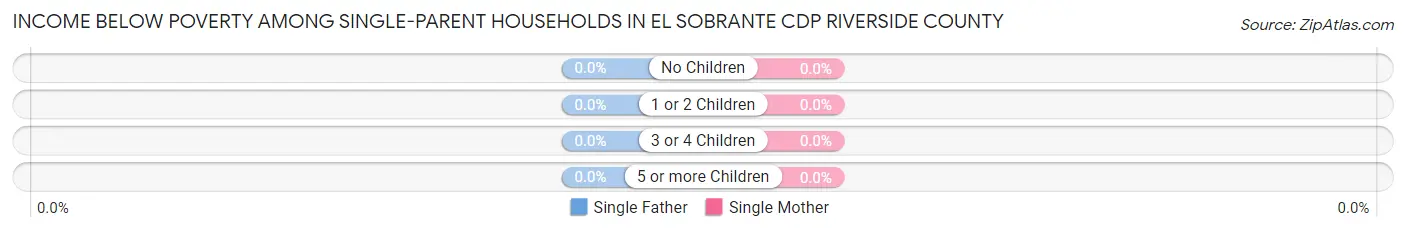
| Children | Single Father | Single Mother |
| No Children | 0 (0.0%) | 0 (0.0%) |
| 1 or 2 Children | 0 (0.0%) | 0 (0.0%) |
| 3 or 4 Children | 0 (0.0%) | 0 (0.0%) |
| 5 or more Children | 0 (0.0%) | 0 (0.0%) |
| Total | 0 (0.0%) | 0 (0.0%) |
Income Below Poverty Among Married-Couple vs Single-Parent Households in El Sobrante CDP Riverside County
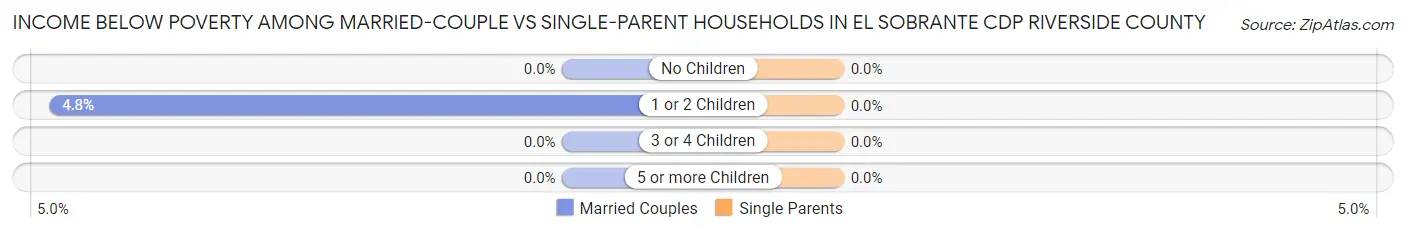
| Children | Married-Couple Families | Single-Parent Households |
| No Children | 0 (0.0%) | 0 (0.0%) |
| 1 or 2 Children | 51 (4.8%) | 0 (0.0%) |
| 3 or 4 Children | 0 (0.0%) | 0 (0.0%) |
| 5 or more Children | 0 (0.0%) | 0 (0.0%) |
| Total | 51 (1.8%) | 0 (0.0%) |
Race in El Sobrante CDP Riverside County
The most populous races in El Sobrante CDP Riverside County are White / Caucasian (6,806 | 56.1%), Hispanic or Latino (3,801 | 31.3%), and Some other Race (2,020 | 16.7%).
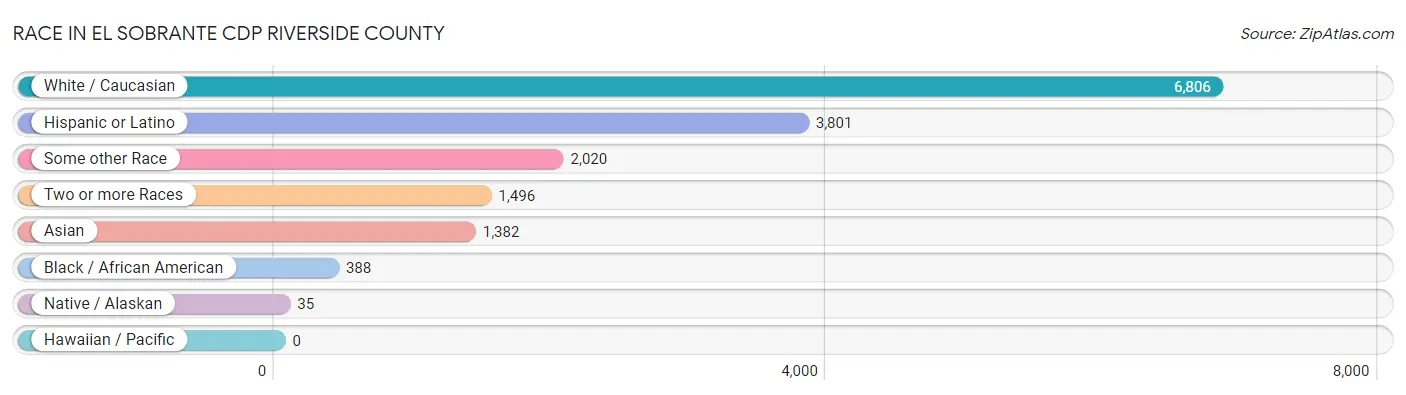
| Race | # Population | % Population |
| Asian | 1,382 | 11.4% |
| Black / African American | 388 | 3.2% |
| Hawaiian / Pacific | 0 | 0.0% |
| Hispanic or Latino | 3,801 | 31.3% |
| Native / Alaskan | 35 | 0.3% |
| White / Caucasian | 6,806 | 56.1% |
| Two or more Races | 1,496 | 12.3% |
| Some other Race | 2,020 | 16.7% |
| Total | 12,127 | 100.0% |
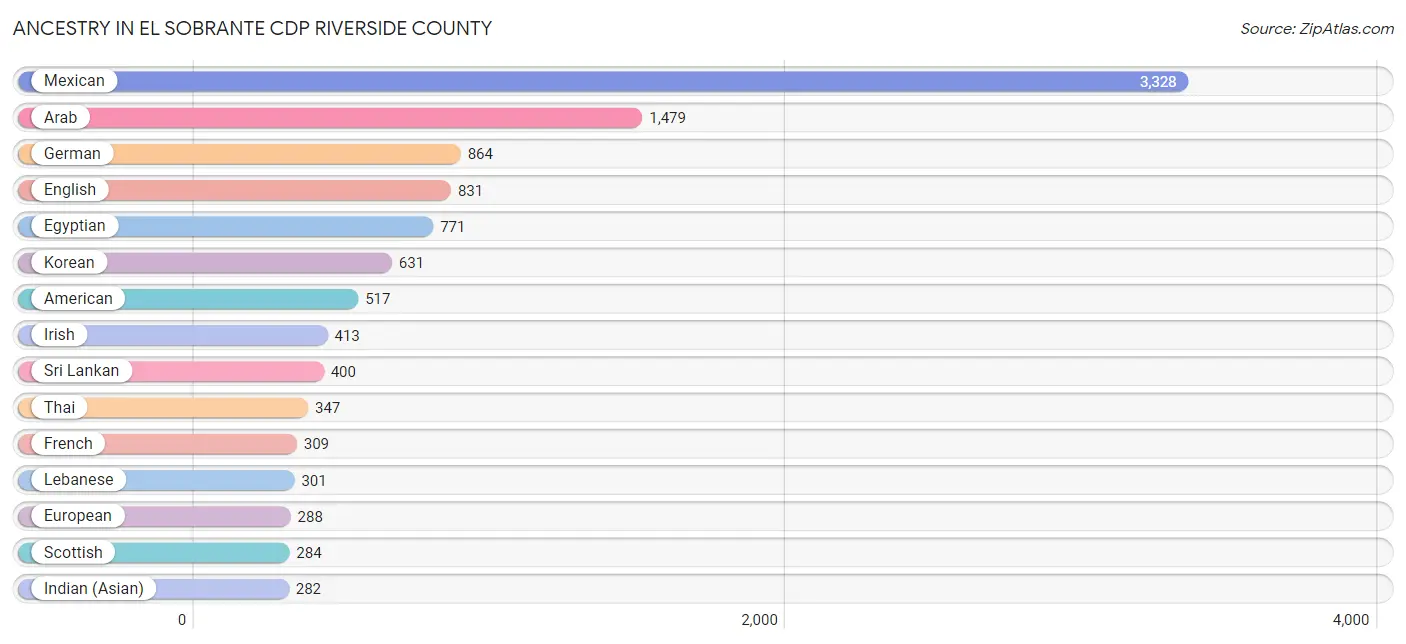
Ancestry in El Sobrante CDP Riverside County
The most populous ancestries reported in El Sobrante CDP Riverside County are Mexican (3,328 | 27.4%), Arab (1,479 | 12.2%), German (864 | 7.1%), English (831 | 6.9%), and Egyptian (771 | 6.4%), together accounting for 60.0% of all El Sobrante CDP Riverside County residents.
| Ancestry | # Population | % Population |
| Afghan | 56 | 0.5% |
| African | 95 | 0.8% |
| American | 517 | 4.3% |
| Arab | 1,479 | 12.2% |
| Argentinean | 36 | 0.3% |
| Australian | 64 | 0.5% |
| Austrian | 5 | 0.0% |
| British | 127 | 1.1% |
| Burmese | 181 | 1.5% |
| Cajun | 19 | 0.2% |
| Central American | 202 | 1.7% |
| Central American Indian | 54 | 0.4% |
| Cherokee | 7 | 0.1% |
| Colombian | 16 | 0.1% |
| Danish | 16 | 0.1% |
| Dutch | 113 | 0.9% |
| Eastern European | 21 | 0.2% |
| Ecuadorian | 13 | 0.1% |
| Egyptian | 771 | 6.4% |
| English | 831 | 6.9% |
| European | 288 | 2.4% |
| French | 309 | 2.5% |
| German | 864 | 7.1% |
| Ghanaian | 3 | 0.0% |
| Guatemalan | 28 | 0.2% |
| Hungarian | 55 | 0.4% |
| Indian (Asian) | 282 | 2.3% |
| Irish | 413 | 3.4% |
| Italian | 249 | 2.1% |
| Jordanian | 194 | 1.6% |
| Korean | 631 | 5.2% |
| Latvian | 28 | 0.2% |
| Lebanese | 301 | 2.5% |
| Mexican | 3,328 | 27.4% |
| New Zealander | 8 | 0.1% |
| Nicaraguan | 4 | 0.0% |
| Northern European | 52 | 0.4% |
| Norwegian | 49 | 0.4% |
| Pakistani | 2 | 0.0% |
| Polish | 125 | 1.0% |
| Portuguese | 4 | 0.0% |
| Puerto Rican | 79 | 0.6% |
| Salvadoran | 170 | 1.4% |
| Scandinavian | 54 | 0.4% |
| Scotch-Irish | 80 | 0.7% |
| Scottish | 284 | 2.3% |
| South American | 65 | 0.5% |
| Spaniard | 87 | 0.7% |
| Spanish | 31 | 0.3% |
| Sri Lankan | 400 | 3.3% |
| Subsaharan African | 98 | 0.8% |
| Swedish | 146 | 1.2% |
| Swiss | 29 | 0.2% |
| Thai | 347 | 2.9% |
| Turkish | 52 | 0.4% |
| Welsh | 49 | 0.4% |
| Yaqui | 35 | 0.3% | View All 57 Rows |
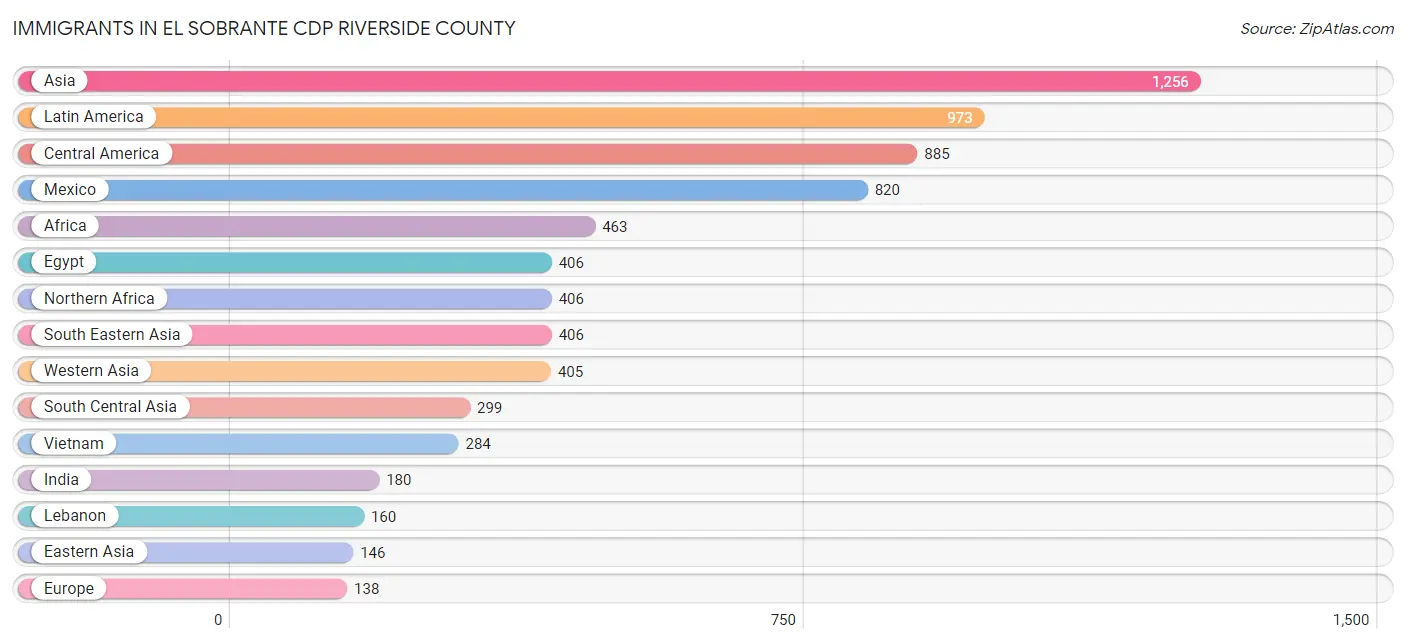
Immigrants in El Sobrante CDP Riverside County
The most numerous immigrant groups reported in El Sobrante CDP Riverside County came from Asia (1,256 | 10.4%), Latin America (973 | 8.0%), Central America (885 | 7.3%), Mexico (820 | 6.8%), and Africa (463 | 3.8%), together accounting for 36.3% of all El Sobrante CDP Riverside County residents.
| Immigration Origin | # Population | % Population |
| Afghanistan | 48 | 0.4% |
| Africa | 463 | 3.8% |
| Argentina | 25 | 0.2% |
| Asia | 1,256 | 10.4% |
| Brazil | 2 | 0.0% |
| Canada | 132 | 1.1% |
| Caribbean | 61 | 0.5% |
| Central America | 885 | 7.3% |
| China | 27 | 0.2% |
| Costa Rica | 9 | 0.1% |
| Eastern Africa | 54 | 0.4% |
| Eastern Asia | 146 | 1.2% |
| Eastern Europe | 55 | 0.4% |
| Egypt | 406 | 3.4% |
| El Salvador | 56 | 0.5% |
| England | 46 | 0.4% |
| Europe | 138 | 1.1% |
| France | 14 | 0.1% |
| Ghana | 3 | 0.0% |
| Hungary | 55 | 0.4% |
| India | 180 | 1.5% |
| Iran | 71 | 0.6% |
| Iraq | 33 | 0.3% |
| Israel | 46 | 0.4% |
| Jamaica | 61 | 0.5% |
| Jordan | 107 | 0.9% |
| Kenya | 54 | 0.4% |
| Korea | 119 | 1.0% |
| Kuwait | 7 | 0.1% |
| Latin America | 973 | 8.0% |
| Lebanon | 160 | 1.3% |
| Mexico | 820 | 6.8% |
| Northern Africa | 406 | 3.4% |
| Northern Europe | 69 | 0.6% |
| Oceania | 8 | 0.1% |
| Philippines | 120 | 1.0% |
| South America | 27 | 0.2% |
| South Central Asia | 299 | 2.5% |
| South Eastern Asia | 406 | 3.4% |
| Thailand | 2 | 0.0% |
| Turkey | 52 | 0.4% |
| Vietnam | 284 | 2.3% |
| Western Africa | 3 | 0.0% |
| Western Asia | 405 | 3.3% |
| Western Europe | 14 | 0.1% | View All 45 Rows |
Sex and Age in El Sobrante CDP Riverside County
Sex and Age in El Sobrante CDP Riverside County
The most populous age groups in El Sobrante CDP Riverside County are 35 to 39 Years (708 | 11.7%) for men and 10 to 14 Years (722 | 11.9%) for women.
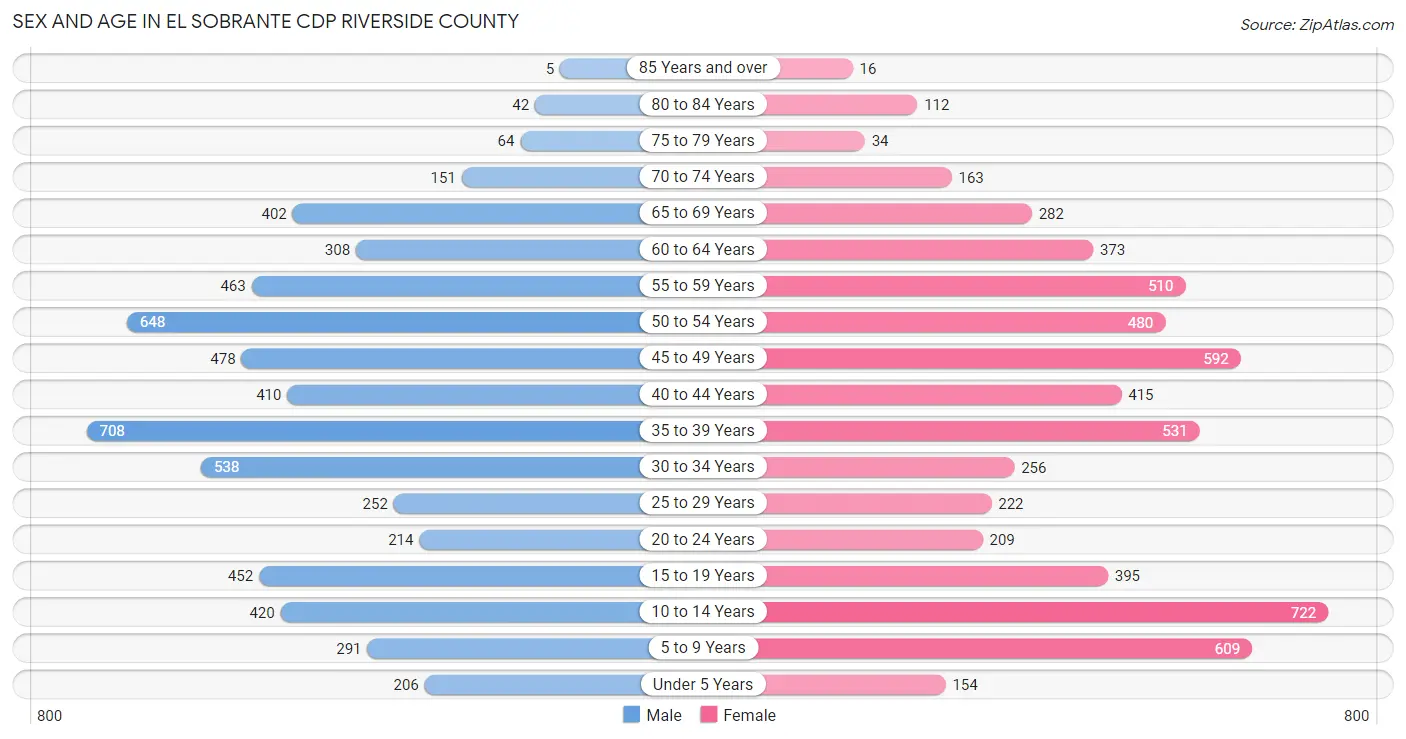
| Age Bracket | Male | Female |
| Under 5 Years | 206 (3.4%) | 154 (2.5%) |
| 5 to 9 Years | 291 (4.8%) | 609 (10.0%) |
| 10 to 14 Years | 420 (6.9%) | 722 (11.9%) |
| 15 to 19 Years | 452 (7.5%) | 395 (6.5%) |
| 20 to 24 Years | 214 (3.5%) | 209 (3.4%) |
| 25 to 29 Years | 252 (4.2%) | 222 (3.6%) |
| 30 to 34 Years | 538 (8.9%) | 256 (4.2%) |
| 35 to 39 Years | 708 (11.7%) | 531 (8.7%) |
| 40 to 44 Years | 410 (6.8%) | 415 (6.8%) |
| 45 to 49 Years | 478 (7.9%) | 592 (9.7%) |
| 50 to 54 Years | 648 (10.7%) | 480 (7.9%) |
| 55 to 59 Years | 463 (7.6%) | 510 (8.4%) |
| 60 to 64 Years | 308 (5.1%) | 373 (6.1%) |
| 65 to 69 Years | 402 (6.6%) | 282 (4.6%) |
| 70 to 74 Years | 151 (2.5%) | 163 (2.7%) |
| 75 to 79 Years | 64 (1.1%) | 34 (0.6%) |
| 80 to 84 Years | 42 (0.7%) | 112 (1.8%) |
| 85 Years and over | 5 (0.1%) | 16 (0.3%) |
| Total | 6,052 (100.0%) | 6,075 (100.0%) |
Families and Households in El Sobrante CDP Riverside County
Median Family Size in El Sobrante CDP Riverside County
The median family size in El Sobrante CDP Riverside County is 3.37 persons per family, with single female/mother families (320 | 9.6%) accounting for the largest median family size of 3.63 persons per family. On the other hand, single male/father families (244 | 7.3%) represent the smallest median family size with 2.62 persons per family.
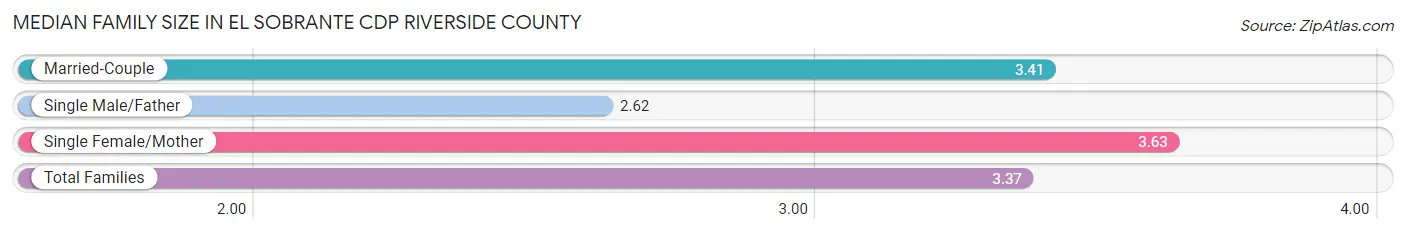
| Family Type | # Families | Family Size |
| Married-Couple | 2,786 (83.2%) | 3.41 |
| Single Male/Father | 244 (7.3%) | 2.62 |
| Single Female/Mother | 320 (9.6%) | 3.63 |
| Total Families | 3,350 (100.0%) | 3.37 |
Median Household Size in El Sobrante CDP Riverside County
The median household size in El Sobrante CDP Riverside County is 3.19 persons per household, with single female/mother households (320 | 8.5%) accounting for the largest median household size of 4.18 persons per household. non-family households (434 | 11.5%) represent the smallest median household size with 1.27 persons per household.
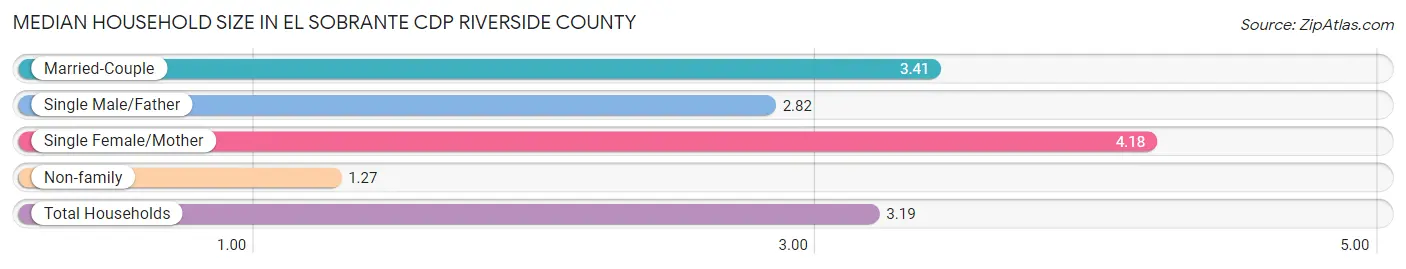
| Household Type | # Households | Household Size |
| Married-Couple | 2,786 (73.6%) | 3.41 |
| Single Male/Father | 244 (6.5%) | 2.82 |
| Single Female/Mother | 320 (8.5%) | 4.18 |
| Non-family | 434 (11.5%) | 1.27 |
| Total Households | 3,784 (100.0%) | 3.19 |
Household Size by Marriage Status in El Sobrante CDP Riverside County
Out of a total of 3,784 households in El Sobrante CDP Riverside County, 3,350 (88.5%) are family households, while 434 (11.5%) are nonfamily households. The most numerous type of family households are 2-person households, comprising 1,193, and the most common type of nonfamily households are 1-person households, comprising 343.
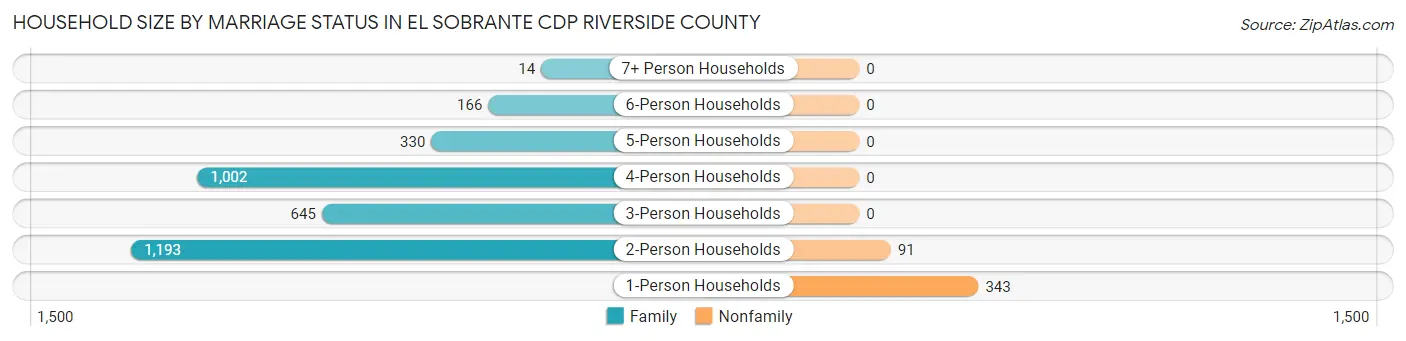
| Household Size | Family Households | Nonfamily Households |
| 1-Person Households | - | 343 (9.1%) |
| 2-Person Households | 1,193 (31.5%) | 91 (2.4%) |
| 3-Person Households | 645 (17.1%) | 0 (0.0%) |
| 4-Person Households | 1,002 (26.5%) | 0 (0.0%) |
| 5-Person Households | 330 (8.7%) | 0 (0.0%) |
| 6-Person Households | 166 (4.4%) | 0 (0.0%) |
| 7+ Person Households | 14 (0.4%) | 0 (0.0%) |
| Total | 3,350 (88.5%) | 434 (11.5%) |
Female Fertility in El Sobrante CDP Riverside County
Fertility by Age in El Sobrante CDP Riverside County
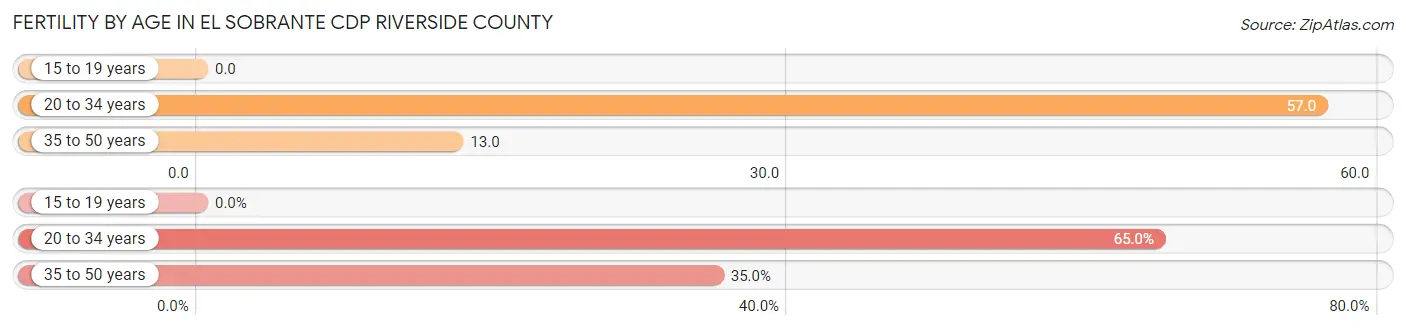
Average fertility rate in El Sobrante CDP Riverside County is 23.0 births per 1,000 women. Women in the age bracket of 20 to 34 years have the highest fertility rate with 57.0 births per 1,000 women. Women in the age bracket of 20 to 34 years acount for 65.0% of all women with births.
| Age Bracket | Women with Births | Births / 1,000 Women |
| 15 to 19 years | 0 (0.0%) | 0.0 |
| 20 to 34 years | 39 (65.0%) | 57.0 |
| 35 to 50 years | 21 (35.0%) | 13.0 |
| Total | 60 (100.0%) | 23.0 |
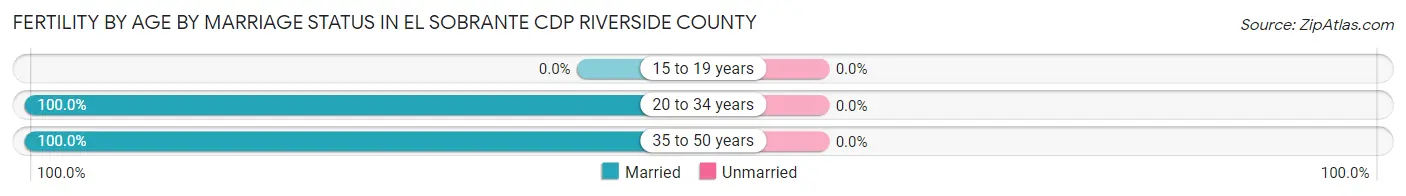
Fertility by Age by Marriage Status in El Sobrante CDP Riverside County
| Age Bracket | Married | Unmarried |
| 15 to 19 years | 0 (0.0%) | 0 (0.0%) |
| 20 to 34 years | 39 (100.0%) | 0 (0.0%) |
| 35 to 50 years | 21 (100.0%) | 0 (0.0%) |
| Total | 60 (100.0%) | 0 (0.0%) |
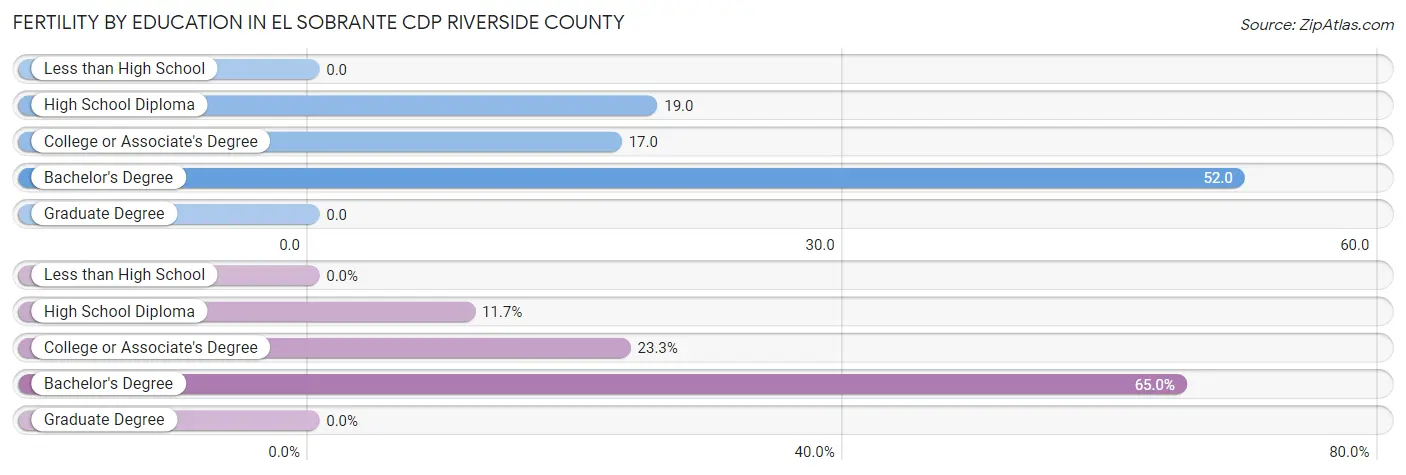
Fertility by Education in El Sobrante CDP Riverside County
| Educational Attainment | Women with Births | Births / 1,000 Women |
| Less than High School | 0 (0.0%) | 0.0 |
| High School Diploma | 7 (11.7%) | 19.0 |
| College or Associate's Degree | 14 (23.3%) | 17.0 |
| Bachelor's Degree | 39 (65.0%) | 52.0 |
| Graduate Degree | 0 (0.0%) | 0.0 |
| Total | 60 (100.0%) | 23.0 |
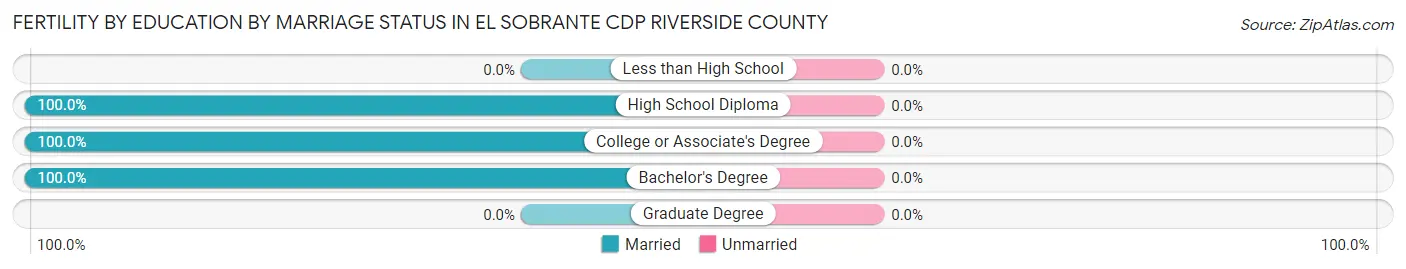
Fertility by Education by Marriage Status in El Sobrante CDP Riverside County
| Educational Attainment | Married | Unmarried |
| Less than High School | 0 (0.0%) | 0 (0.0%) |
| High School Diploma | 7 (100.0%) | 0 (0.0%) |
| College or Associate's Degree | 14 (100.0%) | 0 (0.0%) |
| Bachelor's Degree | 39 (100.0%) | 0 (0.0%) |
| Graduate Degree | 0 (0.0%) | 0 (0.0%) |
| Total | 60 (100.0%) | 0 (0.0%) |
Employment Characteristics in El Sobrante CDP Riverside County
Employment by Class of Employer in El Sobrante CDP Riverside County
Among the 6,404 employed individuals in El Sobrante CDP Riverside County, private company employees (3,859 | 60.3%), local government employees (754 | 11.8%), and state government employees (548 | 8.6%) make up the most common classes of employment.
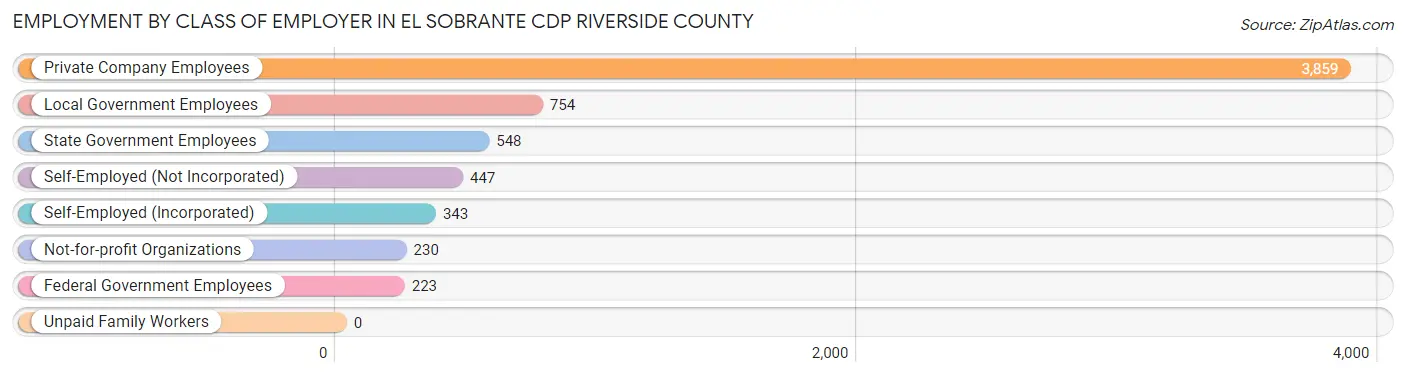
| Employer Class | # Employees | % Employees |
| Private Company Employees | 3,859 | 60.3% |
| Self-Employed (Incorporated) | 343 | 5.4% |
| Self-Employed (Not Incorporated) | 447 | 7.0% |
| Not-for-profit Organizations | 230 | 3.6% |
| Local Government Employees | 754 | 11.8% |
| State Government Employees | 548 | 8.6% |
| Federal Government Employees | 223 | 3.5% |
| Unpaid Family Workers | 0 | 0.0% |
| Total | 6,404 | 100.0% |
Employment Status by Age in El Sobrante CDP Riverside County
According to the labor force statistics for El Sobrante CDP Riverside County, out of the total population over 16 years of age (9,649), 71.9% or 6,938 individuals are in the labor force, with 4.0% or 278 of them unemployed. The age group with the highest labor force participation rate is 30 to 34 years, with 99.1% or 787 individuals in the labor force. Within the labor force, the 20 to 24 years age range has the highest percentage of unemployed individuals, with 22.0% or 54 of them being unemployed.
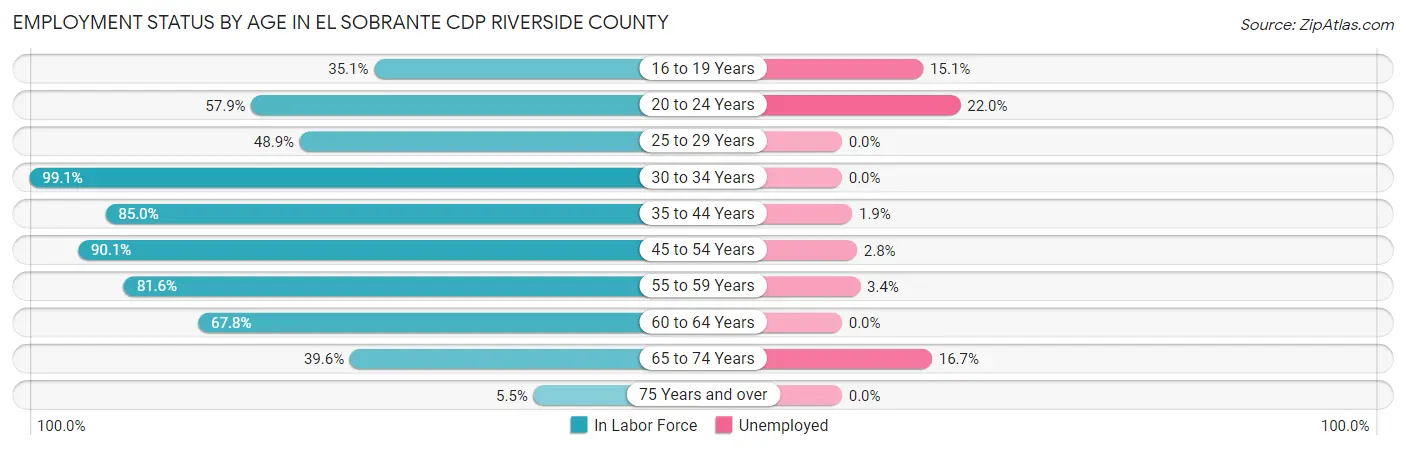
| Age Bracket | In Labor Force | Unemployed |
| 16 to 19 Years | 271 (35.1%) | 41 (15.1%) |
| 20 to 24 Years | 245 (57.9%) | 54 (22.0%) |
| 25 to 29 Years | 232 (48.9%) | 0 (0.0%) |
| 30 to 34 Years | 787 (99.1%) | 0 (0.0%) |
| 35 to 44 Years | 1,754 (85.0%) | 33 (1.9%) |
| 45 to 54 Years | 1,980 (90.1%) | 55 (2.8%) |
| 55 to 59 Years | 794 (81.6%) | 27 (3.4%) |
| 60 to 64 Years | 462 (67.8%) | 0 (0.0%) |
| 65 to 74 Years | 395 (39.6%) | 66 (16.7%) |
| 75 Years and over | 15 (5.5%) | 0 (0.0%) |
| Total | 6,938 (71.9%) | 278 (4.0%) |
Employment Status by Educational Attainment in El Sobrante CDP Riverside County
According to labor force statistics for El Sobrante CDP Riverside County, 83.7% of individuals (6,013) out of the total population between 25 and 64 years of age (7,184) are in the labor force, with 1.9% or 114 of them being unemployed. The group with the highest labor force participation rate are those with the educational attainment of bachelor's degree or higher, with 89.5% or 3,155 individuals in the labor force. Within the labor force, individuals with high school diploma education have the highest percentage of unemployment, with 12.7% or 96 of them being unemployed.
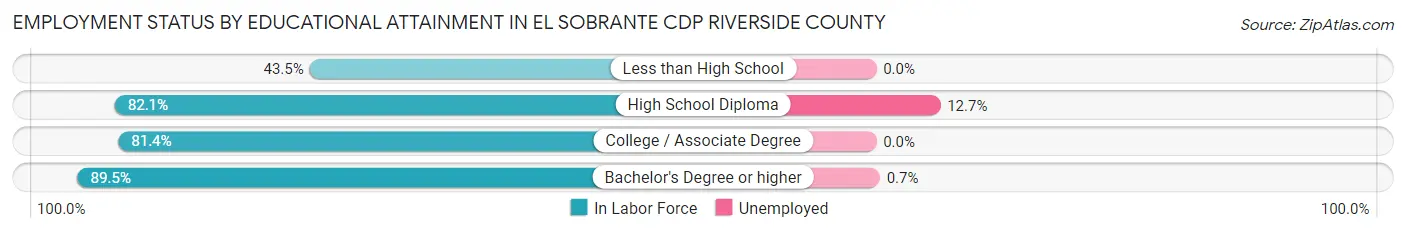
| Educational Attainment | In Labor Force | Unemployed |
| Less than High School | 148 (43.5%) | 0 (0.0%) |
| High School Diploma | 756 (82.1%) | 117 (12.7%) |
| College / Associate Degree | 1,952 (81.4%) | 0 (0.0%) |
| Bachelor's Degree or higher | 3,155 (89.5%) | 25 (0.7%) |
| Total | 6,013 (83.7%) | 136 (1.9%) |
Employment Occupations by Sex in El Sobrante CDP Riverside County
Management, Business, Science and Arts Occupations
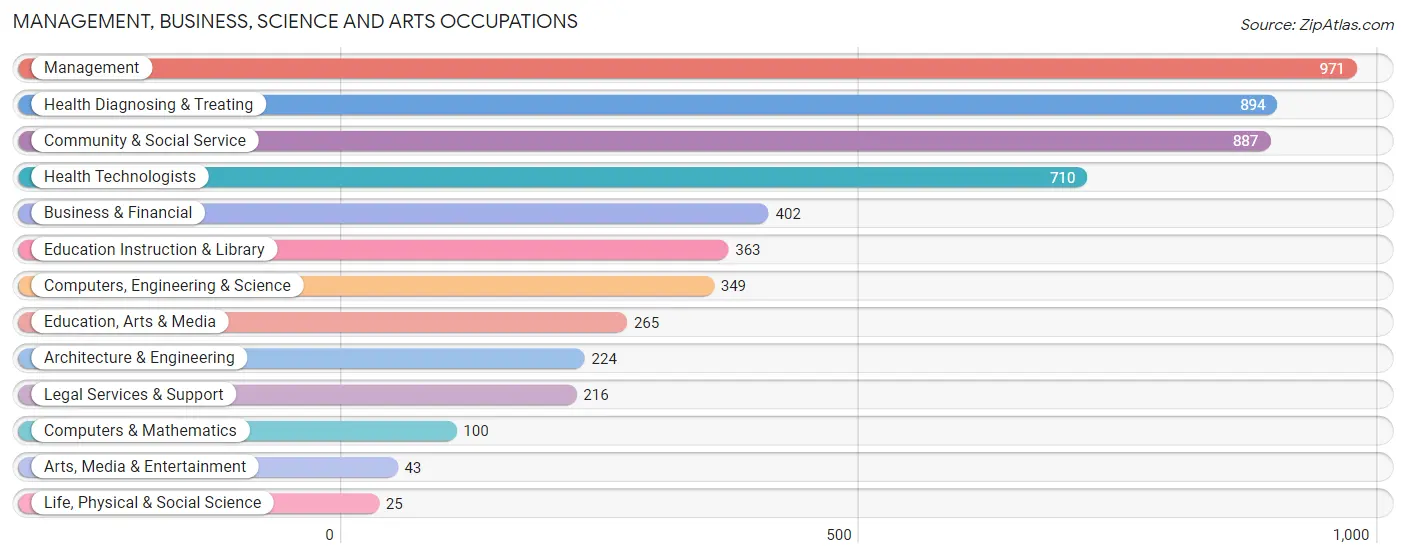
The most common Management, Business, Science and Arts occupations in El Sobrante CDP Riverside County are Management (971 | 14.6%), Health Diagnosing & Treating (894 | 13.4%), Community & Social Service (887 | 13.3%), Health Technologists (710 | 10.7%), and Business & Financial (402 | 6.0%).
Management, Business, Science and Arts Occupations by Sex
Within the Management, Business, Science and Arts occupations in El Sobrante CDP Riverside County, the most male-oriented occupations are Architecture & Engineering (87.9%), Computers, Engineering & Science (83.7%), and Computers & Mathematics (82.0%), while the most female-oriented occupations are Arts, Media & Entertainment (100.0%), Education, Arts & Media (88.7%), and Education Instruction & Library (71.6%).
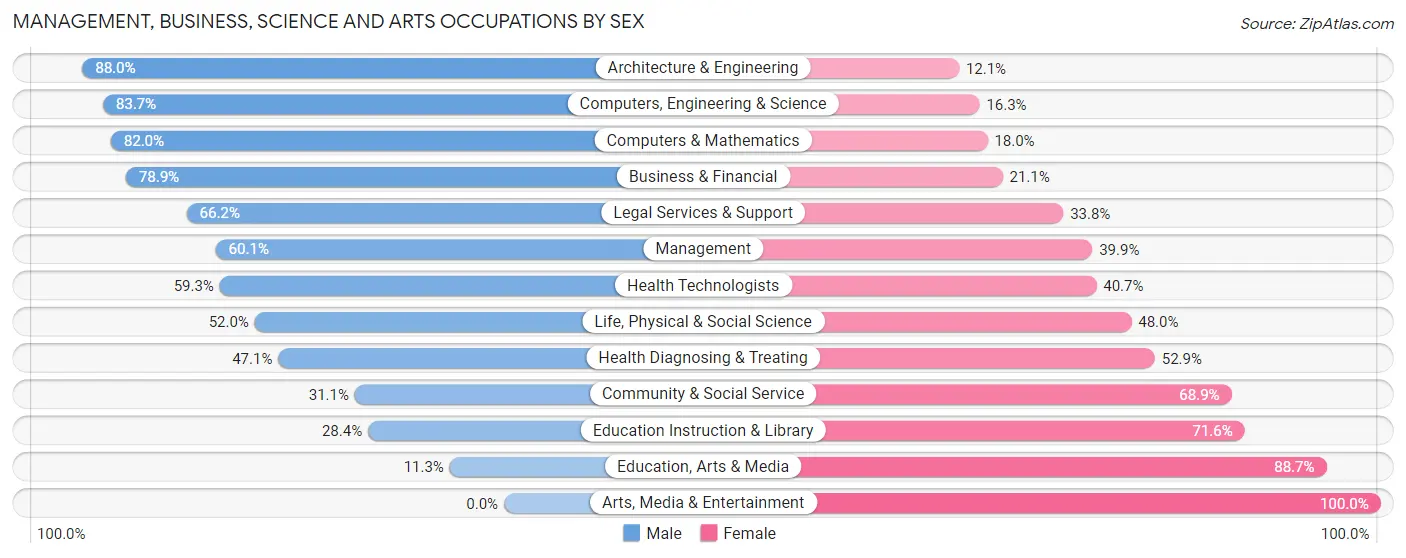
| Occupation | Male | Female |
| Management | 584 (60.1%) | 387 (39.9%) |
| Business & Financial | 317 (78.9%) | 85 (21.1%) |
| Computers, Engineering & Science | 292 (83.7%) | 57 (16.3%) |
| Computers & Mathematics | 82 (82.0%) | 18 (18.0%) |
| Architecture & Engineering | 197 (87.9%) | 27 (12.0%) |
| Life, Physical & Social Science | 13 (52.0%) | 12 (48.0%) |
| Community & Social Service | 276 (31.1%) | 611 (68.9%) |
| Education, Arts & Media | 30 (11.3%) | 235 (88.7%) |
| Legal Services & Support | 143 (66.2%) | 73 (33.8%) |
| Education Instruction & Library | 103 (28.4%) | 260 (71.6%) |
| Arts, Media & Entertainment | 0 (0.0%) | 43 (100.0%) |
| Health Diagnosing & Treating | 421 (47.1%) | 473 (52.9%) |
| Health Technologists | 421 (59.3%) | 289 (40.7%) |
| Total (Category) | 1,890 (53.9%) | 1,613 (46.1%) |
| Total (Overall) | 3,945 (59.3%) | 2,713 (40.7%) |
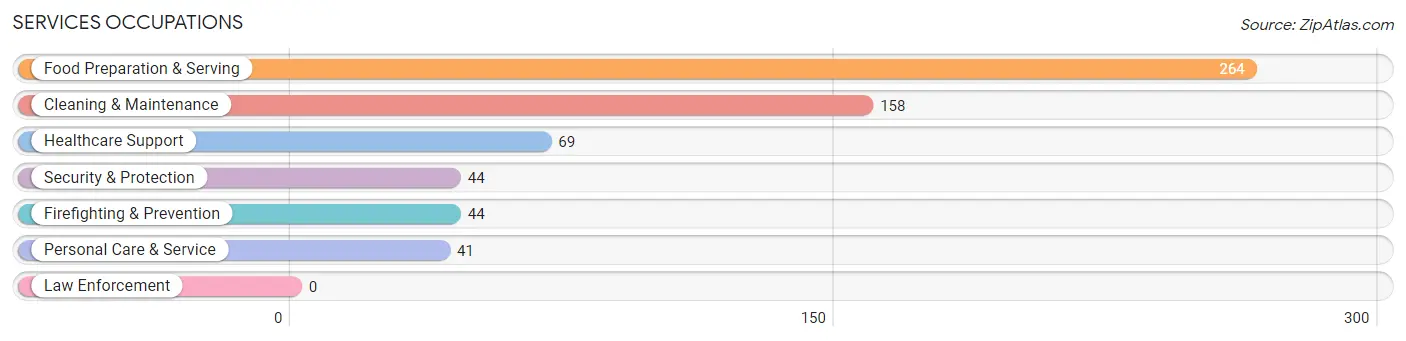
Services Occupations
The most common Services occupations in El Sobrante CDP Riverside County are Food Preparation & Serving (264 | 4.0%), Cleaning & Maintenance (158 | 2.4%), Healthcare Support (69 | 1.0%), Security & Protection (44 | 0.7%), and Firefighting & Prevention (44 | 0.7%).
Services Occupations by Sex
Within the Services occupations in El Sobrante CDP Riverside County, the most male-oriented occupations are Security & Protection (100.0%), Firefighting & Prevention (100.0%), and Cleaning & Maintenance (100.0%), while the most female-oriented occupations are Healthcare Support (100.0%), Personal Care & Service (73.2%), and Food Preparation & Serving (51.9%).
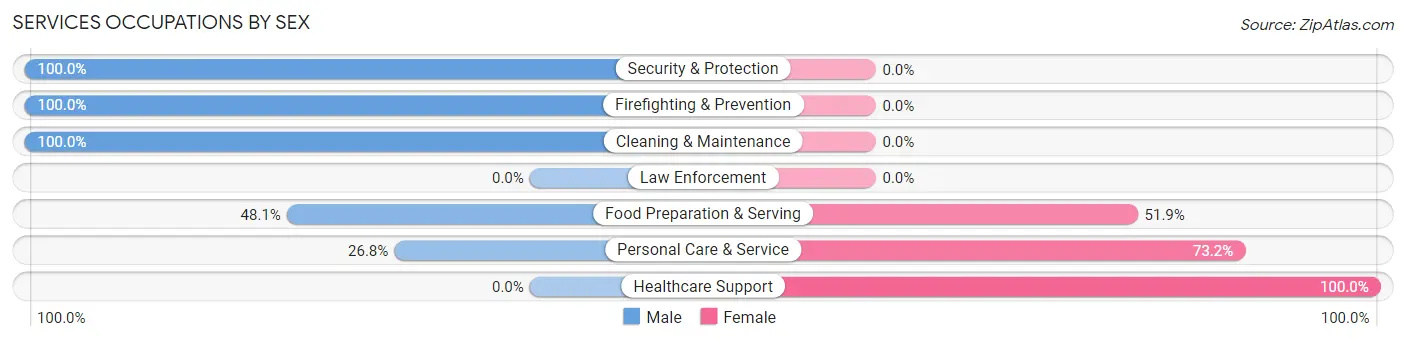
| Occupation | Male | Female |
| Healthcare Support | 0 (0.0%) | 69 (100.0%) |
| Security & Protection | 44 (100.0%) | 0 (0.0%) |
| Firefighting & Prevention | 44 (100.0%) | 0 (0.0%) |
| Law Enforcement | 0 (0.0%) | 0 (0.0%) |
| Food Preparation & Serving | 127 (48.1%) | 137 (51.9%) |
| Cleaning & Maintenance | 158 (100.0%) | 0 (0.0%) |
| Personal Care & Service | 11 (26.8%) | 30 (73.2%) |
| Total (Category) | 340 (59.0%) | 236 (41.0%) |
| Total (Overall) | 3,945 (59.3%) | 2,713 (40.7%) |
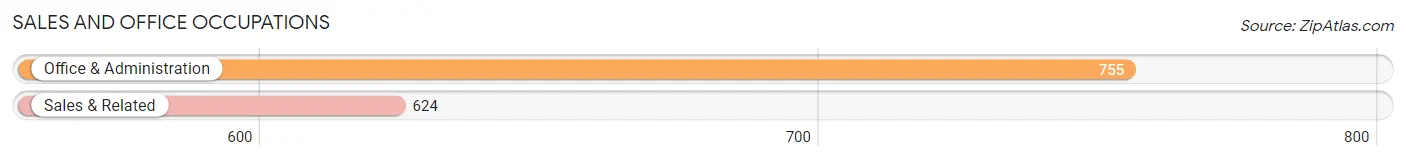
Sales and Office Occupations
The most common Sales and Office occupations in El Sobrante CDP Riverside County are Office & Administration (755 | 11.3%), and Sales & Related (624 | 9.4%).
Sales and Office Occupations by Sex
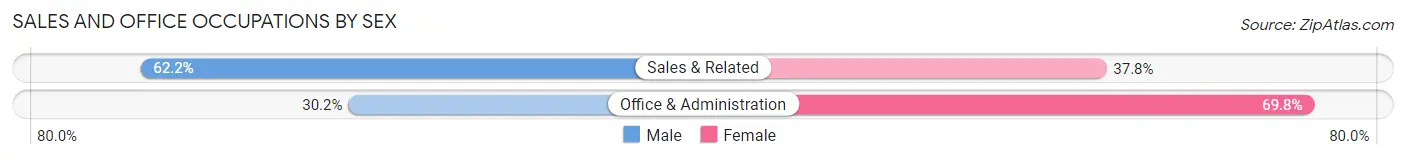
| Occupation | Male | Female |
| Sales & Related | 388 (62.2%) | 236 (37.8%) |
| Office & Administration | 228 (30.2%) | 527 (69.8%) |
| Total (Category) | 616 (44.7%) | 763 (55.3%) |
| Total (Overall) | 3,945 (59.3%) | 2,713 (40.7%) |
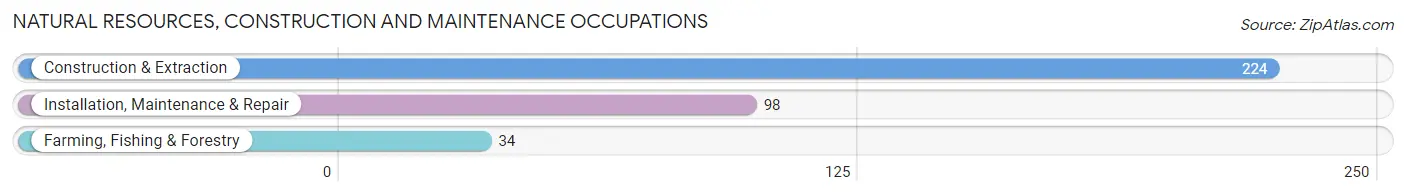
Natural Resources, Construction and Maintenance Occupations
The most common Natural Resources, Construction and Maintenance occupations in El Sobrante CDP Riverside County are Construction & Extraction (224 | 3.4%), Installation, Maintenance & Repair (98 | 1.5%), and Farming, Fishing & Forestry (34 | 0.5%).
Natural Resources, Construction and Maintenance Occupations by Sex
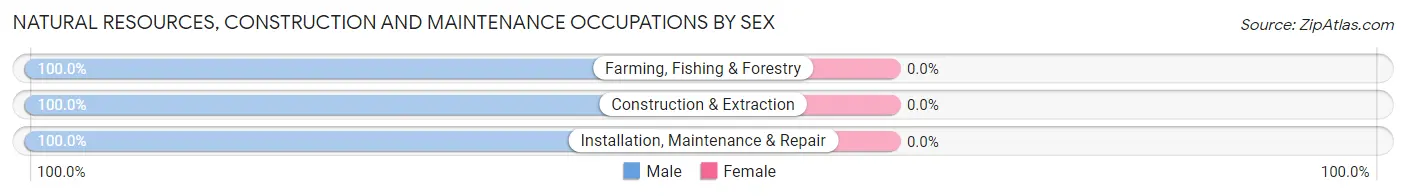
| Occupation | Male | Female |
| Farming, Fishing & Forestry | 34 (100.0%) | 0 (0.0%) |
| Construction & Extraction | 224 (100.0%) | 0 (0.0%) |
| Installation, Maintenance & Repair | 98 (100.0%) | 0 (0.0%) |
| Total (Category) | 356 (100.0%) | 0 (0.0%) |
| Total (Overall) | 3,945 (59.3%) | 2,713 (40.7%) |
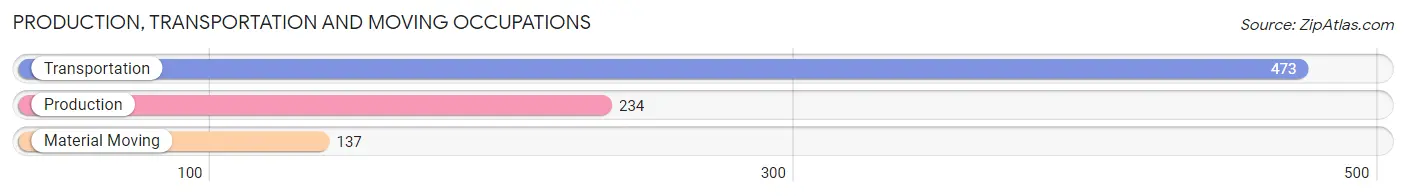
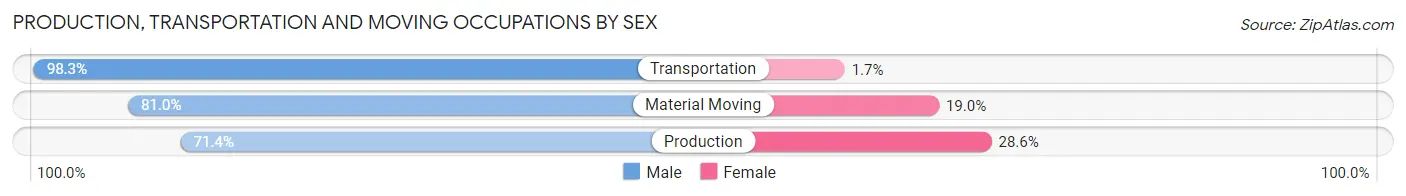
Production, Transportation and Moving Occupations
The most common Production, Transportation and Moving occupations in El Sobrante CDP Riverside County are Transportation (473 | 7.1%), Production (234 | 3.5%), and Material Moving (137 | 2.1%).
Production, Transportation and Moving Occupations by Sex
| Occupation | Male | Female |
| Production | 167 (71.4%) | 67 (28.6%) |
| Transportation | 465 (98.3%) | 8 (1.7%) |
| Material Moving | 111 (81.0%) | 26 (19.0%) |
| Total (Category) | 743 (88.0%) | 101 (12.0%) |
| Total (Overall) | 3,945 (59.3%) | 2,713 (40.7%) |
Employment Industries by Sex in El Sobrante CDP Riverside County
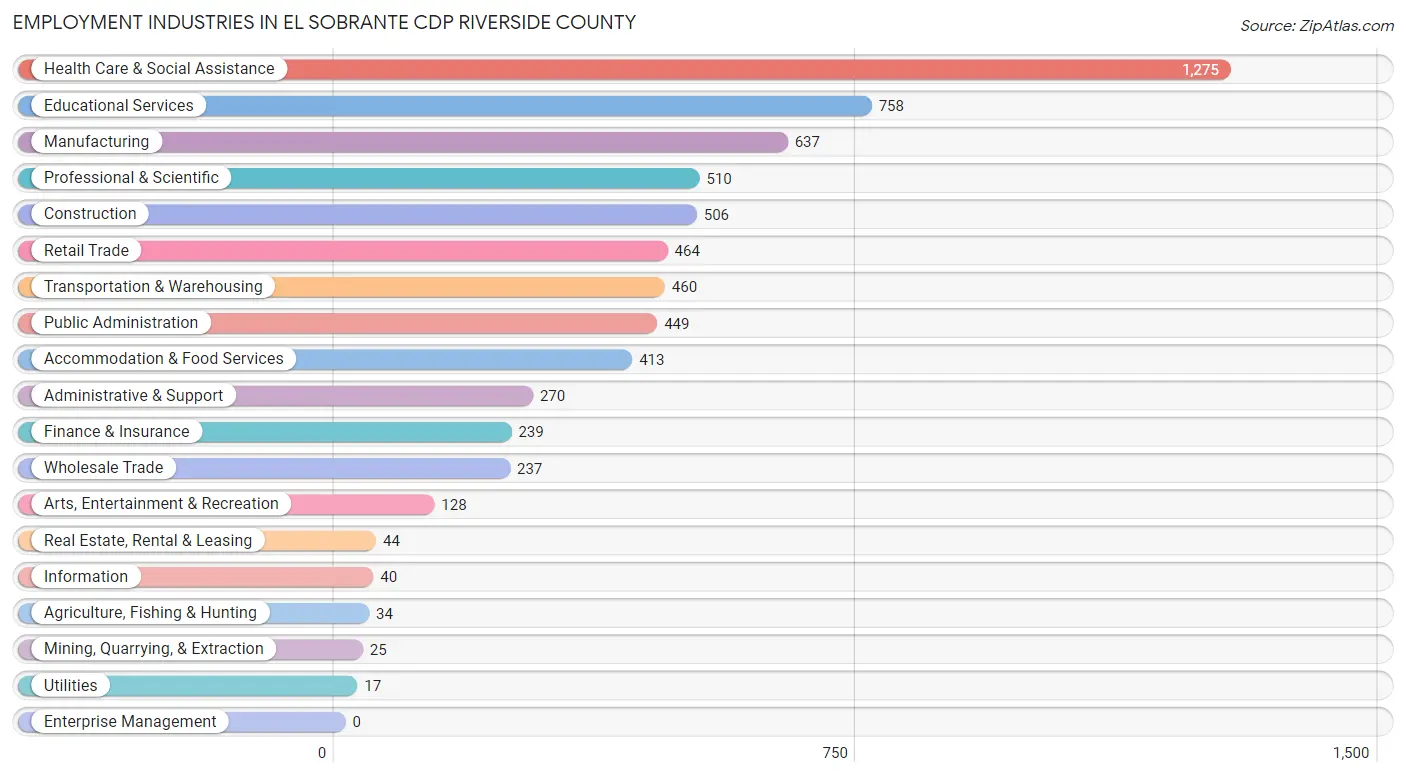
Employment Industries in El Sobrante CDP Riverside County
The major employment industries in El Sobrante CDP Riverside County include Health Care & Social Assistance (1,275 | 19.2%), Educational Services (758 | 11.4%), Manufacturing (637 | 9.6%), Professional & Scientific (510 | 7.7%), and Construction (506 | 7.6%).
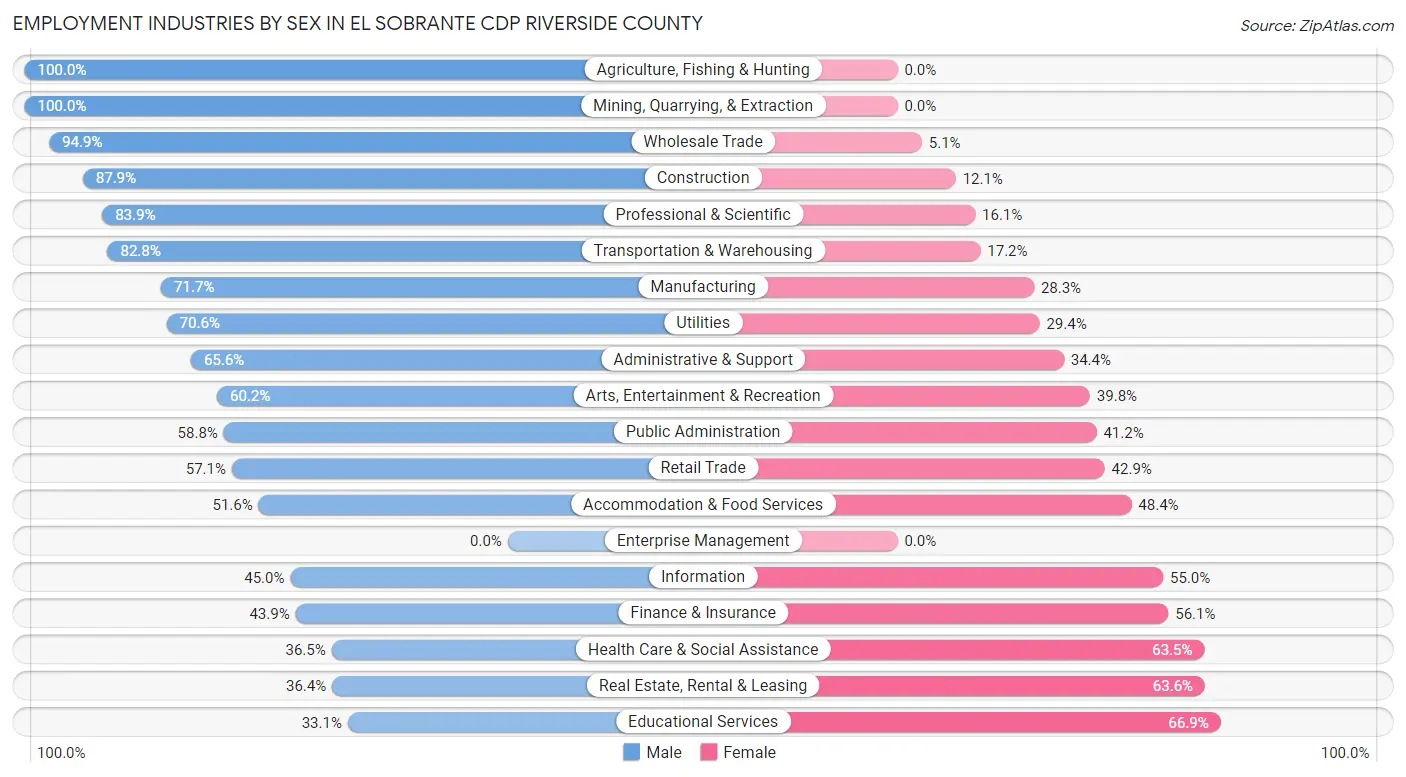
Employment Industries by Sex in El Sobrante CDP Riverside County
The El Sobrante CDP Riverside County industries that see more men than women are Agriculture, Fishing & Hunting (100.0%), Mining, Quarrying, & Extraction (100.0%), and Wholesale Trade (94.9%), whereas the industries that tend to have a higher number of women are Educational Services (66.9%), Real Estate, Rental & Leasing (63.6%), and Health Care & Social Assistance (63.5%).
| Industry | Male | Female |
| Agriculture, Fishing & Hunting | 34 (100.0%) | 0 (0.0%) |
| Mining, Quarrying, & Extraction | 25 (100.0%) | 0 (0.0%) |
| Construction | 445 (87.9%) | 61 (12.1%) |
| Manufacturing | 457 (71.7%) | 180 (28.3%) |
| Wholesale Trade | 225 (94.9%) | 12 (5.1%) |
| Retail Trade | 265 (57.1%) | 199 (42.9%) |
| Transportation & Warehousing | 381 (82.8%) | 79 (17.2%) |
| Utilities | 12 (70.6%) | 5 (29.4%) |
| Information | 18 (45.0%) | 22 (55.0%) |
| Finance & Insurance | 105 (43.9%) | 134 (56.1%) |
| Real Estate, Rental & Leasing | 16 (36.4%) | 28 (63.6%) |
| Professional & Scientific | 428 (83.9%) | 82 (16.1%) |
| Enterprise Management | 0 (0.0%) | 0 (0.0%) |
| Administrative & Support | 177 (65.6%) | 93 (34.4%) |
| Educational Services | 251 (33.1%) | 507 (66.9%) |
| Health Care & Social Assistance | 465 (36.5%) | 810 (63.5%) |
| Arts, Entertainment & Recreation | 77 (60.2%) | 51 (39.8%) |
| Accommodation & Food Services | 213 (51.6%) | 200 (48.4%) |
| Public Administration | 264 (58.8%) | 185 (41.2%) |
| Total | 3,945 (59.3%) | 2,713 (40.7%) |
Education in El Sobrante CDP Riverside County
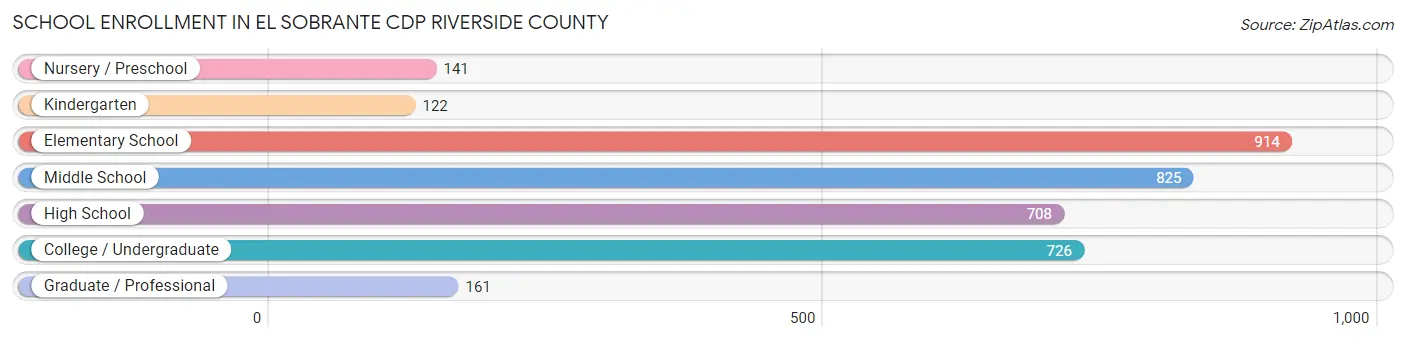
School Enrollment in El Sobrante CDP Riverside County
The most common levels of schooling among the 3,597 students in El Sobrante CDP Riverside County are elementary school (914 | 25.4%), middle school (825 | 22.9%), and college / undergraduate (726 | 20.2%).
| School Level | # Students | % Students |
| Nursery / Preschool | 141 | 3.9% |
| Kindergarten | 122 | 3.4% |
| Elementary School | 914 | 25.4% |
| Middle School | 825 | 22.9% |
| High School | 708 | 19.7% |
| College / Undergraduate | 726 | 20.2% |
| Graduate / Professional | 161 | 4.5% |
| Total | 3,597 | 100.0% |
School Enrollment by Age by Funding Source in El Sobrante CDP Riverside County
Out of a total of 3,597 students who are enrolled in schools in El Sobrante CDP Riverside County, 921 (25.6%) attend a private institution, while the remaining 2,676 (74.4%) are enrolled in public schools. The age group of 3 to 4 year olds has the highest likelihood of being enrolled in private schools, with 141 (100.0% in the age bracket) enrolled. Conversely, the age group of 20 to 24 year olds has the lowest likelihood of being enrolled in a private school, with 284 (100.0% in the age bracket) attending a public institution.
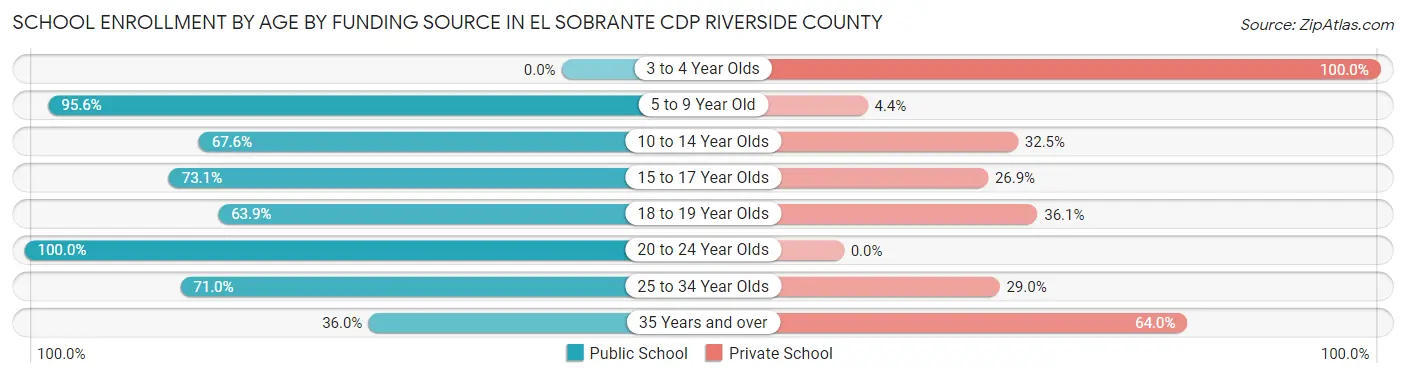
| Age Bracket | Public School | Private School |
| 3 to 4 Year Olds | 0 (0.0%) | 141 (100.0%) |
| 5 to 9 Year Old | 860 (95.6%) | 40 (4.4%) |
| 10 to 14 Year Olds | 768 (67.5%) | 369 (32.5%) |
| 15 to 17 Year Olds | 264 (73.1%) | 97 (26.9%) |
| 18 to 19 Year Olds | 280 (63.9%) | 158 (36.1%) |
| 20 to 24 Year Olds | 284 (100.0%) | 0 (0.0%) |
| 25 to 34 Year Olds | 203 (71.0%) | 83 (29.0%) |
| 35 Years and over | 18 (36.0%) | 32 (64.0%) |
| Total | 2,676 (74.4%) | 921 (25.6%) |
Educational Attainment by Field of Study in El Sobrante CDP Riverside County
Science & technology (619 | 15.2%), business (515 | 12.6%), physical & health sciences (444 | 10.9%), bio, nature & agricultural (401 | 9.9%), and social sciences (393 | 9.7%) are the most common fields of study among 4,073 individuals in El Sobrante CDP Riverside County who have obtained a bachelor's degree or higher.
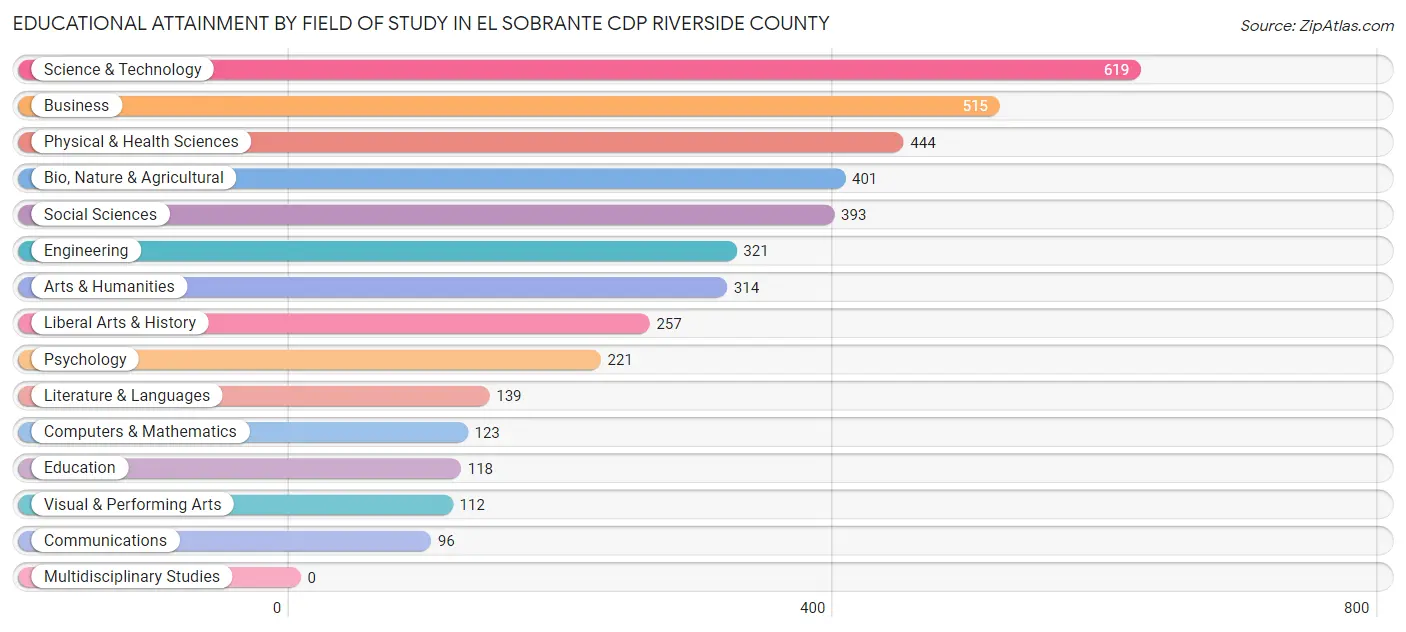
| Field of Study | # Graduates | % Graduates |
| Computers & Mathematics | 123 | 3.0% |
| Bio, Nature & Agricultural | 401 | 9.9% |
| Physical & Health Sciences | 444 | 10.9% |
| Psychology | 221 | 5.4% |
| Social Sciences | 393 | 9.7% |
| Engineering | 321 | 7.9% |
| Multidisciplinary Studies | 0 | 0.0% |
| Science & Technology | 619 | 15.2% |
| Business | 515 | 12.6% |
| Education | 118 | 2.9% |
| Literature & Languages | 139 | 3.4% |
| Liberal Arts & History | 257 | 6.3% |
| Visual & Performing Arts | 112 | 2.8% |
| Communications | 96 | 2.4% |
| Arts & Humanities | 314 | 7.7% |
| Total | 4,073 | 100.0% |
Transportation & Commute in El Sobrante CDP Riverside County
Vehicle Availability by Sex in El Sobrante CDP Riverside County
The most prevalent vehicle ownership categories in El Sobrante CDP Riverside County are males with 2 vehicles (1,780, accounting for 46.6%) and females with 2 vehicles (1,225, making up 68.8%).
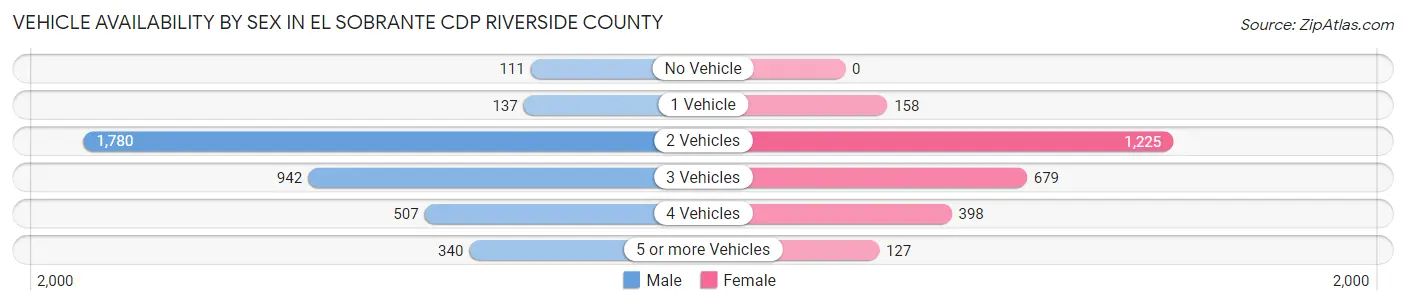
| Vehicles Available | Male | Female |
| No Vehicle | 111 (2.9%) | 0 (0.0%) |
| 1 Vehicle | 137 (3.6%) | 158 (6.1%) |
| 2 Vehicles | 1,780 (46.6%) | 1,225 (47.3%) |
| 3 Vehicles | 942 (24.7%) | 679 (26.3%) |
| 4 Vehicles | 507 (13.3%) | 398 (15.4%) |
| 5 or more Vehicles | 340 (8.9%) | 127 (4.9%) |
| Total | 3,817 (100.0%) | 2,587 (100.0%) |
Commute Time in El Sobrante CDP Riverside County
The most frequently occuring commute durations in El Sobrante CDP Riverside County are 60 to 89 minutes (893 commuters, 15.7%), 15 to 19 minutes (822 commuters, 14.4%), and 20 to 24 minutes (734 commuters, 12.9%).
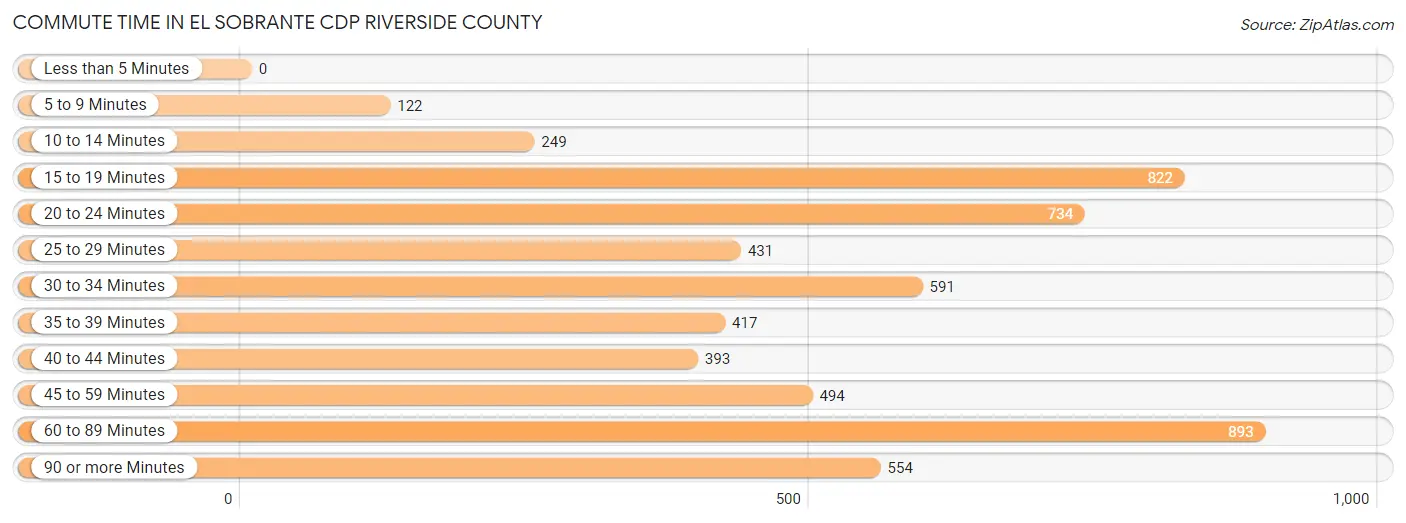
| Commute Time | # Commuters | % Commuters |
| Less than 5 Minutes | 0 | 0.0% |
| 5 to 9 Minutes | 122 | 2.1% |
| 10 to 14 Minutes | 249 | 4.4% |
| 15 to 19 Minutes | 822 | 14.4% |
| 20 to 24 Minutes | 734 | 12.9% |
| 25 to 29 Minutes | 431 | 7.6% |
| 30 to 34 Minutes | 591 | 10.4% |
| 35 to 39 Minutes | 417 | 7.3% |
| 40 to 44 Minutes | 393 | 6.9% |
| 45 to 59 Minutes | 494 | 8.7% |
| 60 to 89 Minutes | 893 | 15.7% |
| 90 or more Minutes | 554 | 9.7% |
Commute Time by Sex in El Sobrante CDP Riverside County
The most common commute times in El Sobrante CDP Riverside County are 60 to 89 minutes (537 commuters, 15.4%) for males and 15 to 19 minutes (380 commuters, 17.1%) for females.
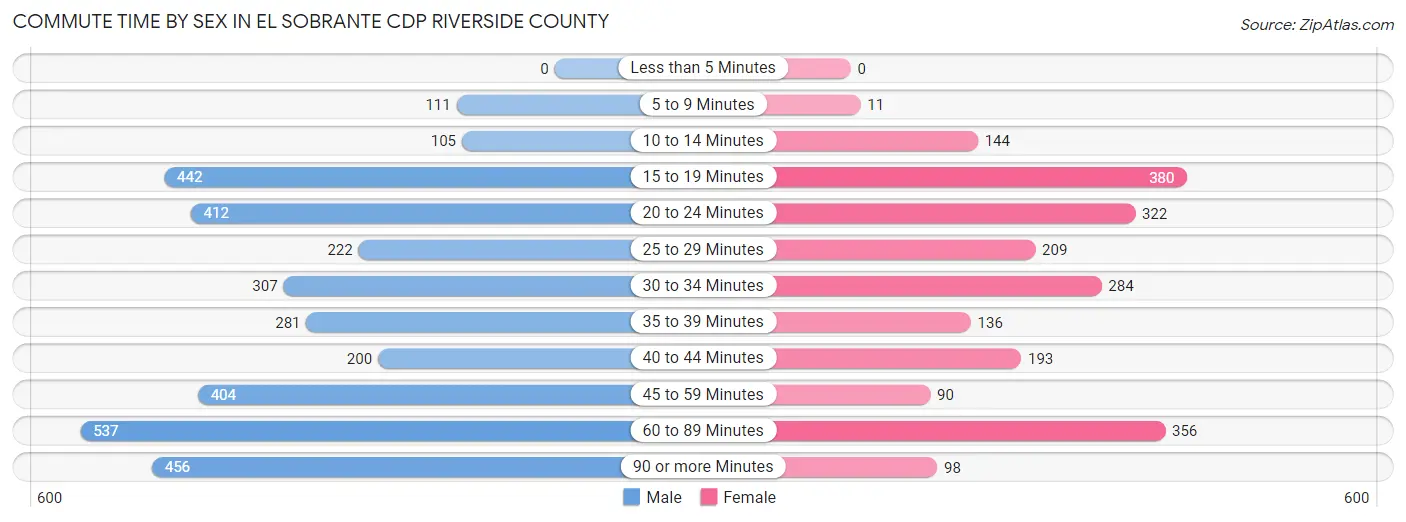
| Commute Time | Male | Female |
| Less than 5 Minutes | 0 (0.0%) | 0 (0.0%) |
| 5 to 9 Minutes | 111 (3.2%) | 11 (0.5%) |
| 10 to 14 Minutes | 105 (3.0%) | 144 (6.5%) |
| 15 to 19 Minutes | 442 (12.7%) | 380 (17.1%) |
| 20 to 24 Minutes | 412 (11.8%) | 322 (14.5%) |
| 25 to 29 Minutes | 222 (6.4%) | 209 (9.4%) |
| 30 to 34 Minutes | 307 (8.8%) | 284 (12.8%) |
| 35 to 39 Minutes | 281 (8.1%) | 136 (6.1%) |
| 40 to 44 Minutes | 200 (5.8%) | 193 (8.7%) |
| 45 to 59 Minutes | 404 (11.6%) | 90 (4.1%) |
| 60 to 89 Minutes | 537 (15.4%) | 356 (16.0%) |
| 90 or more Minutes | 456 (13.1%) | 98 (4.4%) |
Time of Departure to Work by Sex in El Sobrante CDP Riverside County
The most frequent times of departure to work in El Sobrante CDP Riverside County are 7:00 AM to 7:29 AM (515, 14.8%) for males and 7:00 AM to 7:29 AM (449, 20.2%) for females.
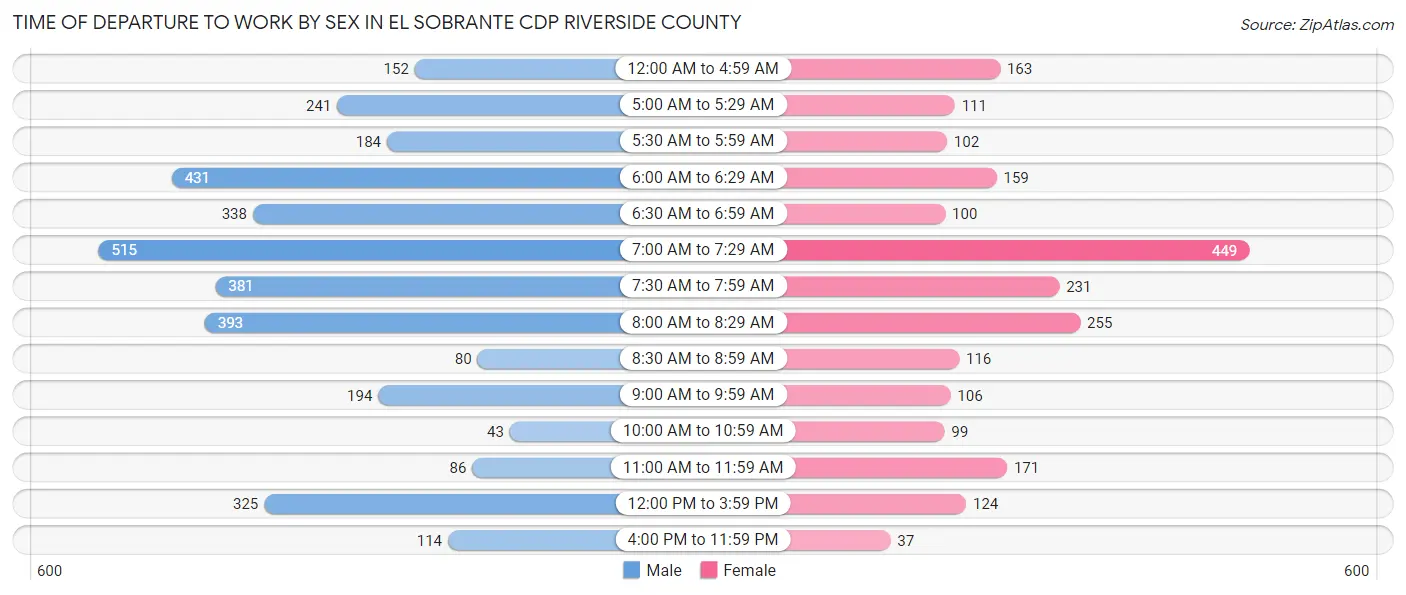
| Time of Departure | Male | Female |
| 12:00 AM to 4:59 AM | 152 (4.4%) | 163 (7.3%) |
| 5:00 AM to 5:29 AM | 241 (6.9%) | 111 (5.0%) |
| 5:30 AM to 5:59 AM | 184 (5.3%) | 102 (4.6%) |
| 6:00 AM to 6:29 AM | 431 (12.4%) | 159 (7.1%) |
| 6:30 AM to 6:59 AM | 338 (9.7%) | 100 (4.5%) |
| 7:00 AM to 7:29 AM | 515 (14.8%) | 449 (20.2%) |
| 7:30 AM to 7:59 AM | 381 (11.0%) | 231 (10.4%) |
| 8:00 AM to 8:29 AM | 393 (11.3%) | 255 (11.5%) |
| 8:30 AM to 8:59 AM | 80 (2.3%) | 116 (5.2%) |
| 9:00 AM to 9:59 AM | 194 (5.6%) | 106 (4.8%) |
| 10:00 AM to 10:59 AM | 43 (1.2%) | 99 (4.4%) |
| 11:00 AM to 11:59 AM | 86 (2.5%) | 171 (7.7%) |
| 12:00 PM to 3:59 PM | 325 (9.3%) | 124 (5.6%) |
| 4:00 PM to 11:59 PM | 114 (3.3%) | 37 (1.7%) |
| Total | 3,477 (100.0%) | 2,223 (100.0%) |
Housing Occupancy in El Sobrante CDP Riverside County
Occupancy by Ownership in El Sobrante CDP Riverside County
Of the total 3,784 dwellings in El Sobrante CDP Riverside County, owner-occupied units account for 3,483 (92.0%), while renter-occupied units make up 301 (8.0%).
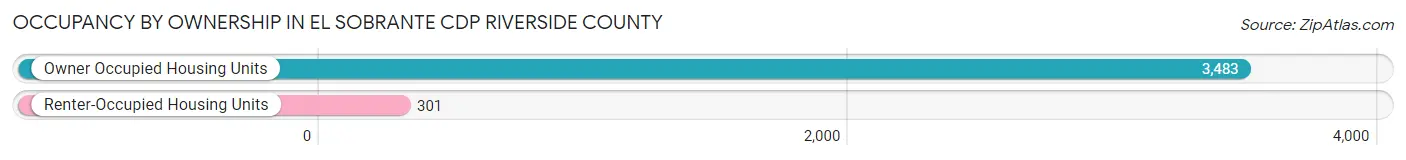
| Occupancy | # Housing Units | % Housing Units |
| Owner Occupied Housing Units | 3,483 | 92.0% |
| Renter-Occupied Housing Units | 301 | 8.0% |
| Total Occupied Housing Units | 3,784 | 100.0% |
Occupancy by Household Size in El Sobrante CDP Riverside County
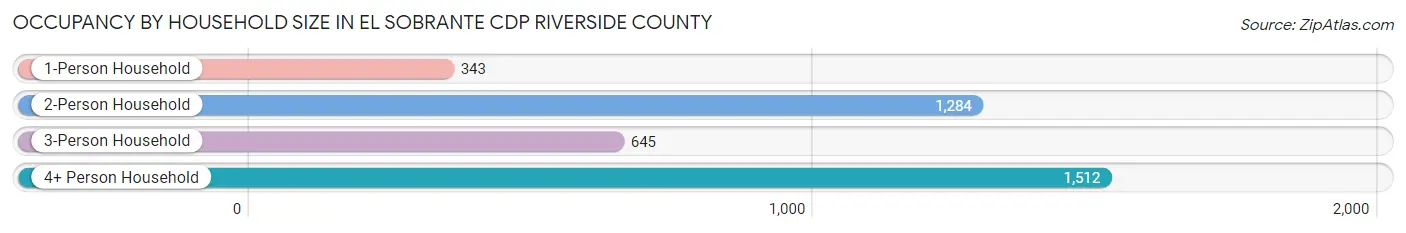
| Household Size | # Housing Units | % Housing Units |
| 1-Person Household | 343 | 9.1% |
| 2-Person Household | 1,284 | 33.9% |
| 3-Person Household | 645 | 17.1% |
| 4+ Person Household | 1,512 | 40.0% |
| Total Housing Units | 3,784 | 100.0% |
Occupancy by Ownership by Household Size in El Sobrante CDP Riverside County
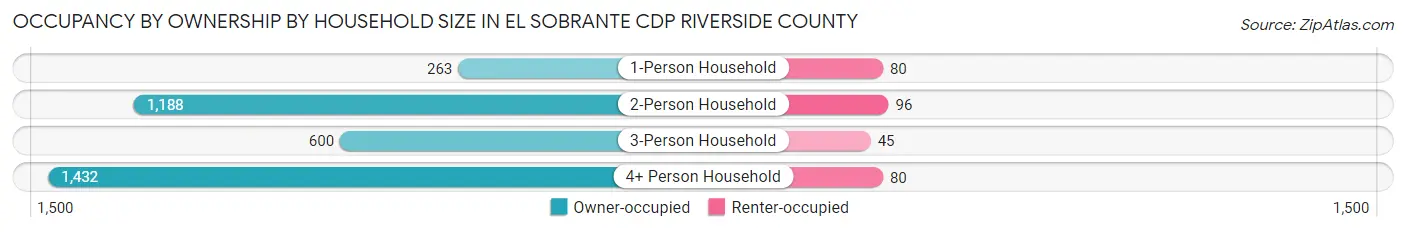
| Household Size | Owner-occupied | Renter-occupied |
| 1-Person Household | 263 (76.7%) | 80 (23.3%) |
| 2-Person Household | 1,188 (92.5%) | 96 (7.5%) |
| 3-Person Household | 600 (93.0%) | 45 (7.0%) |
| 4+ Person Household | 1,432 (94.7%) | 80 (5.3%) |
| Total Housing Units | 3,483 (92.0%) | 301 (8.0%) |
Occupancy by Educational Attainment in El Sobrante CDP Riverside County
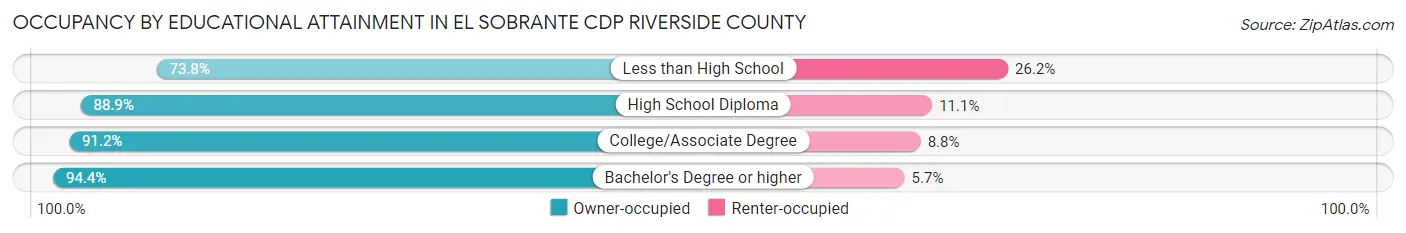
| Household Size | Owner-occupied | Renter-occupied |
| Less than High School | 110 (73.8%) | 39 (26.2%) |
| High School Diploma | 264 (88.9%) | 33 (11.1%) |
| College/Associate Degree | 1,155 (91.2%) | 112 (8.8%) |
| Bachelor's Degree or higher | 1,954 (94.4%) | 117 (5.7%) |
Occupancy by Age of Householder in El Sobrante CDP Riverside County
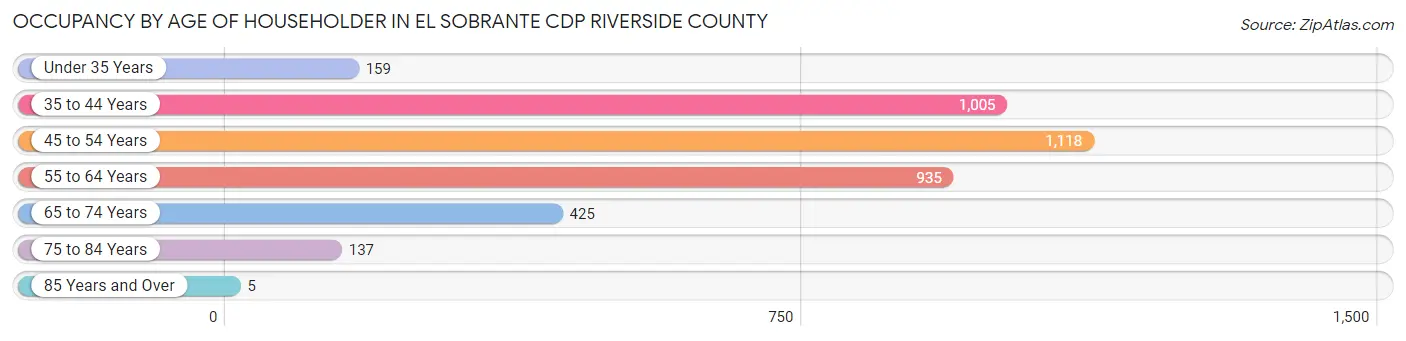
| Age Bracket | # Households | % Households |
| Under 35 Years | 159 | 4.2% |
| 35 to 44 Years | 1,005 | 26.6% |
| 45 to 54 Years | 1,118 | 29.5% |
| 55 to 64 Years | 935 | 24.7% |
| 65 to 74 Years | 425 | 11.2% |
| 75 to 84 Years | 137 | 3.6% |
| 85 Years and Over | 5 | 0.1% |
| Total | 3,784 | 100.0% |
Housing Finances in El Sobrante CDP Riverside County
Median Income by Occupancy in El Sobrante CDP Riverside County
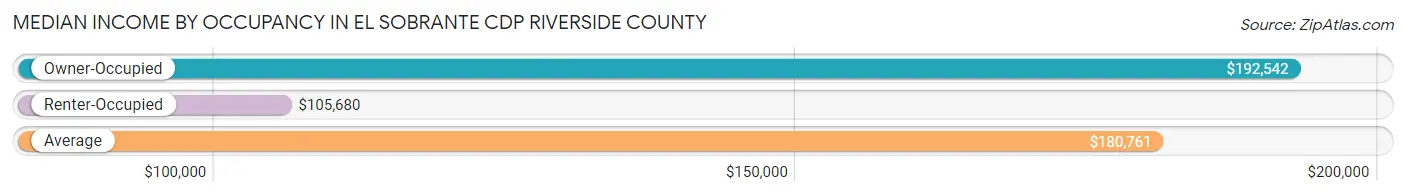
| Occupancy Type | # Households | Median Income |
| Owner-Occupied | 3,483 (92.0%) | $192,542 |
| Renter-Occupied | 301 (8.0%) | $105,680 |
| Average | 3,784 (100.0%) | $180,761 |
Occupancy by Householder Income Bracket in El Sobrante CDP Riverside County
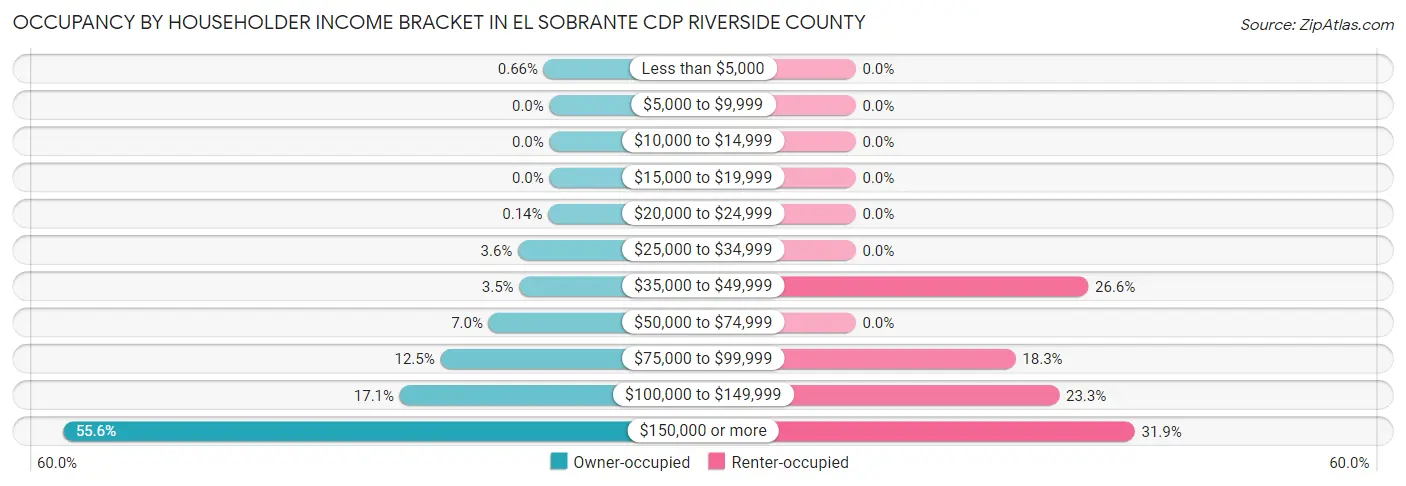
| Income Bracket | Owner-occupied | Renter-occupied |
| Less than $5,000 | 23 (0.7%) | 0 (0.0%) |
| $5,000 to $9,999 | 0 (0.0%) | 0 (0.0%) |
| $10,000 to $14,999 | 0 (0.0%) | 0 (0.0%) |
| $15,000 to $19,999 | 0 (0.0%) | 0 (0.0%) |
| $20,000 to $24,999 | 5 (0.1%) | 0 (0.0%) |
| $25,000 to $34,999 | 125 (3.6%) | 0 (0.0%) |
| $35,000 to $49,999 | 120 (3.5%) | 80 (26.6%) |
| $50,000 to $74,999 | 242 (7.0%) | 0 (0.0%) |
| $75,000 to $99,999 | 434 (12.5%) | 55 (18.3%) |
| $100,000 to $149,999 | 596 (17.1%) | 70 (23.3%) |
| $150,000 or more | 1,938 (55.6%) | 96 (31.9%) |
| Total | 3,483 (100.0%) | 301 (100.0%) |
Monthly Housing Cost Tiers in El Sobrante CDP Riverside County
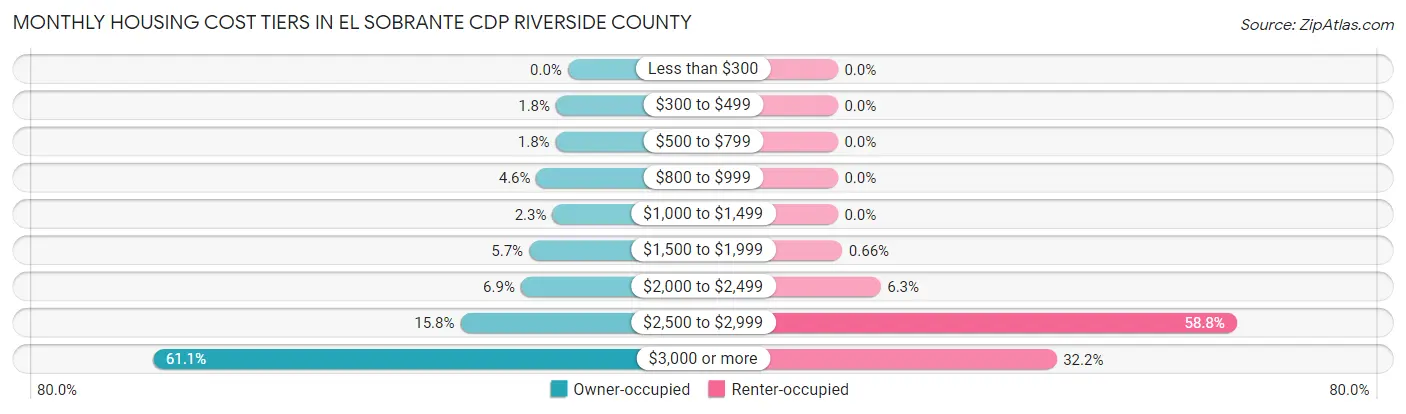
| Monthly Cost | Owner-occupied | Renter-occupied |
| Less than $300 | 0 (0.0%) | 0 (0.0%) |
| $300 to $499 | 61 (1.8%) | 0 (0.0%) |
| $500 to $799 | 63 (1.8%) | 0 (0.0%) |
| $800 to $999 | 161 (4.6%) | 0 (0.0%) |
| $1,000 to $1,499 | 79 (2.3%) | 0 (0.0%) |
| $1,500 to $1,999 | 199 (5.7%) | 2 (0.7%) |
| $2,000 to $2,499 | 241 (6.9%) | 19 (6.3%) |
| $2,500 to $2,999 | 551 (15.8%) | 177 (58.8%) |
| $3,000 or more | 2,128 (61.1%) | 97 (32.2%) |
| Total | 3,483 (100.0%) | 301 (100.0%) |
Physical Housing Characteristics in El Sobrante CDP Riverside County
Housing Structures in El Sobrante CDP Riverside County
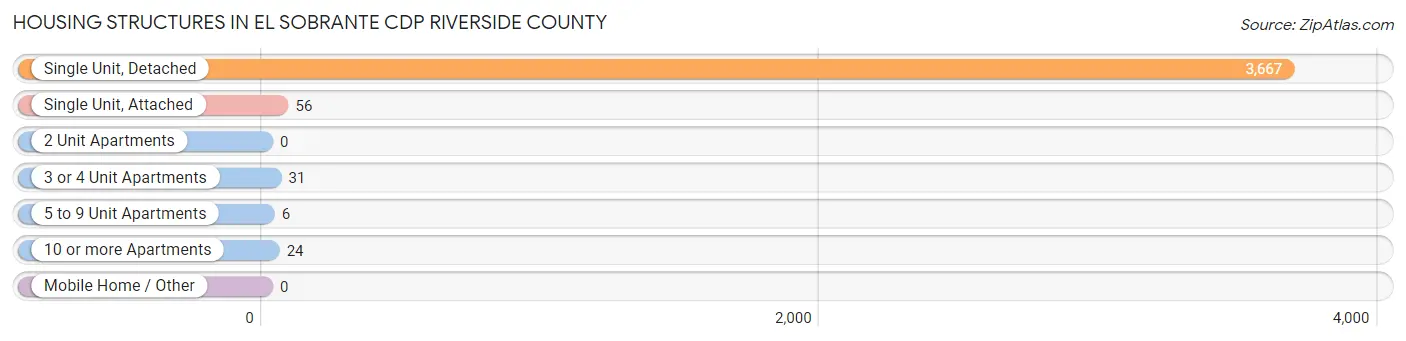
| Structure Type | # Housing Units | % Housing Units |
| Single Unit, Detached | 3,667 | 96.9% |
| Single Unit, Attached | 56 | 1.5% |
| 2 Unit Apartments | 0 | 0.0% |
| 3 or 4 Unit Apartments | 31 | 0.8% |
| 5 to 9 Unit Apartments | 6 | 0.2% |
| 10 or more Apartments | 24 | 0.6% |
| Mobile Home / Other | 0 | 0.0% |
| Total | 3,784 | 100.0% |
Housing Structures by Occupancy in El Sobrante CDP Riverside County
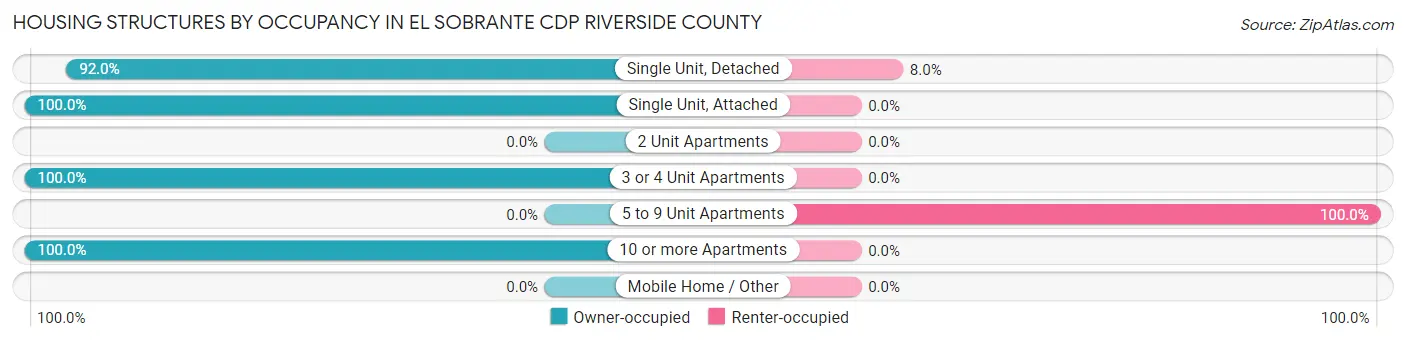
| Structure Type | Owner-occupied | Renter-occupied |
| Single Unit, Detached | 3,372 (92.0%) | 295 (8.0%) |
| Single Unit, Attached | 56 (100.0%) | 0 (0.0%) |
| 2 Unit Apartments | 0 (0.0%) | 0 (0.0%) |
| 3 or 4 Unit Apartments | 31 (100.0%) | 0 (0.0%) |
| 5 to 9 Unit Apartments | 0 (0.0%) | 6 (100.0%) |
| 10 or more Apartments | 24 (100.0%) | 0 (0.0%) |
| Mobile Home / Other | 0 (0.0%) | 0 (0.0%) |
| Total | 3,483 (92.0%) | 301 (8.0%) |
Housing Structures by Number of Rooms in El Sobrante CDP Riverside County
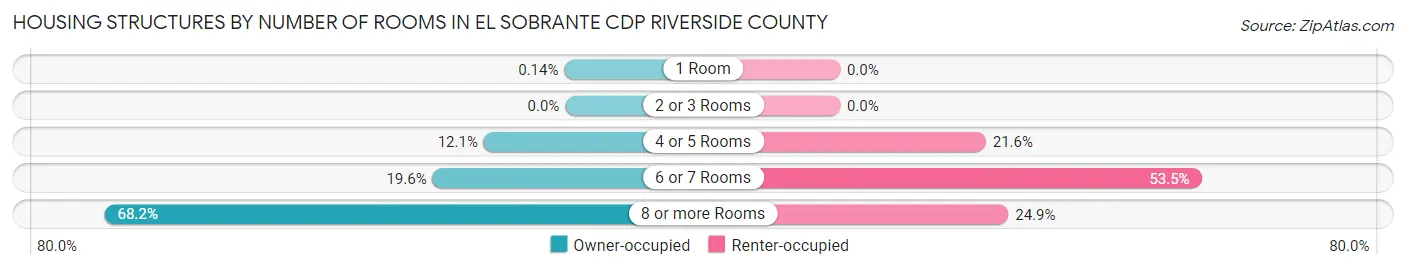
| Number of Rooms | Owner-occupied | Renter-occupied |
| 1 Room | 5 (0.1%) | 0 (0.0%) |
| 2 or 3 Rooms | 0 (0.0%) | 0 (0.0%) |
| 4 or 5 Rooms | 420 (12.1%) | 65 (21.6%) |
| 6 or 7 Rooms | 684 (19.6%) | 161 (53.5%) |
| 8 or more Rooms | 2,374 (68.2%) | 75 (24.9%) |
| Total | 3,483 (100.0%) | 301 (100.0%) |
Housing Structure by Heating Type in El Sobrante CDP Riverside County
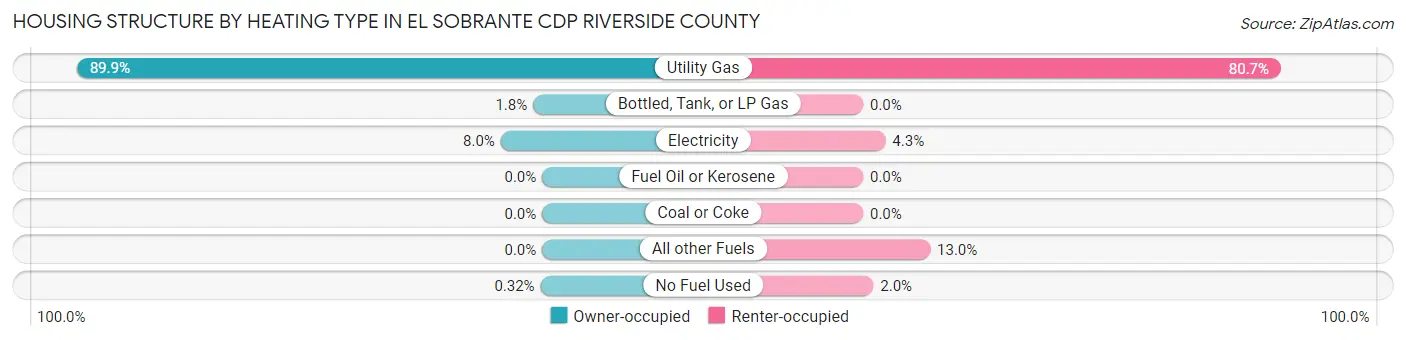
| Heating Type | Owner-occupied | Renter-occupied |
| Utility Gas | 3,132 (89.9%) | 243 (80.7%) |
| Bottled, Tank, or LP Gas | 61 (1.8%) | 0 (0.0%) |
| Electricity | 279 (8.0%) | 13 (4.3%) |
| Fuel Oil or Kerosene | 0 (0.0%) | 0 (0.0%) |
| Coal or Coke | 0 (0.0%) | 0 (0.0%) |
| All other Fuels | 0 (0.0%) | 39 (13.0%) |
| No Fuel Used | 11 (0.3%) | 6 (2.0%) |
| Total | 3,483 (100.0%) | 301 (100.0%) |
Household Vehicle Usage in El Sobrante CDP Riverside County
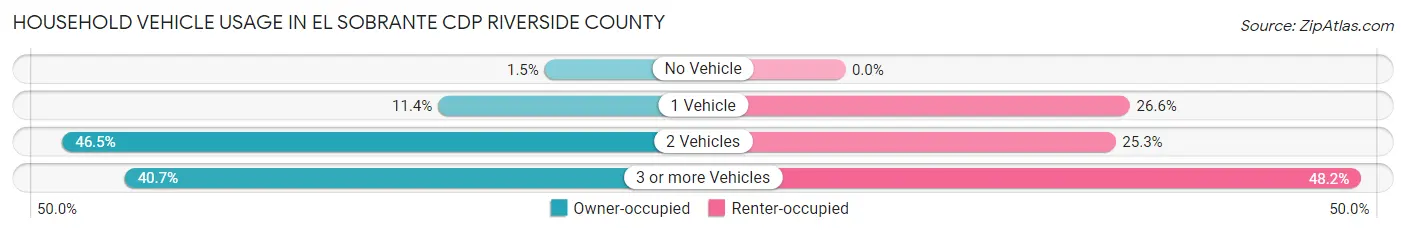
| Vehicles per Household | Owner-occupied | Renter-occupied |
| No Vehicle | 51 (1.5%) | 0 (0.0%) |
| 1 Vehicle | 397 (11.4%) | 80 (26.6%) |
| 2 Vehicles | 1,619 (46.5%) | 76 (25.3%) |
| 3 or more Vehicles | 1,416 (40.6%) | 145 (48.2%) |
| Total | 3,483 (100.0%) | 301 (100.0%) |
Real Estate & Mortgages in El Sobrante CDP Riverside County
Real Estate and Mortgage Overview in El Sobrante CDP Riverside County
| Characteristic | Without Mortgage | With Mortgage |
| Housing Units | 387 | 3,096 |
| Median Property Value | $699,400 | $707,500 |
| Median Household Income | $104,875 | $1,833 |
| Monthly Housing Costs | $857 | $2,128 |
| Real Estate Taxes | $6,291 | $42 |
Property Value by Mortgage Status in El Sobrante CDP Riverside County
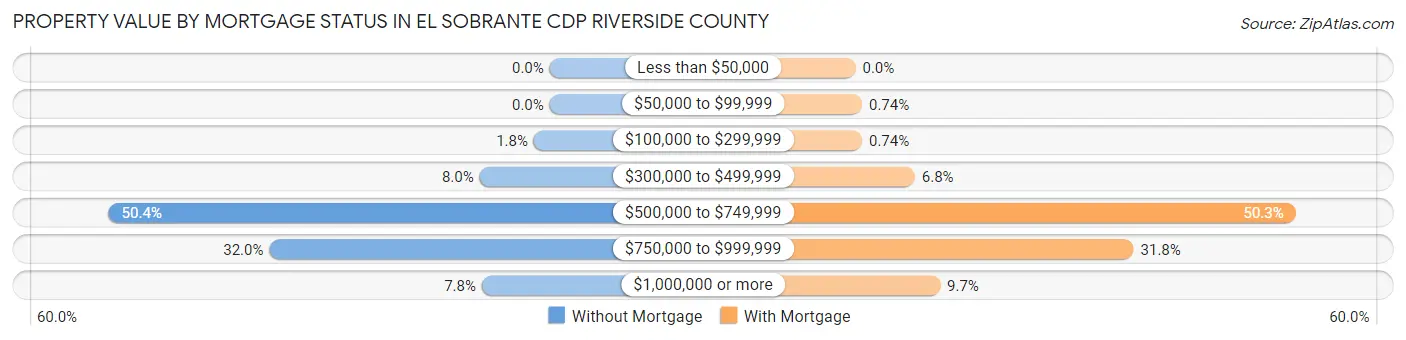
| Property Value | Without Mortgage | With Mortgage |
| Less than $50,000 | 0 (0.0%) | 0 (0.0%) |
| $50,000 to $99,999 | 0 (0.0%) | 23 (0.7%) |
| $100,000 to $299,999 | 7 (1.8%) | 23 (0.7%) |
| $300,000 to $499,999 | 31 (8.0%) | 210 (6.8%) |
| $500,000 to $749,999 | 195 (50.4%) | 1,557 (50.3%) |
| $750,000 to $999,999 | 124 (32.0%) | 984 (31.8%) |
| $1,000,000 or more | 30 (7.7%) | 299 (9.7%) |
| Total | 387 (100.0%) | 3,096 (100.0%) |
Household Income by Mortgage Status in El Sobrante CDP Riverside County
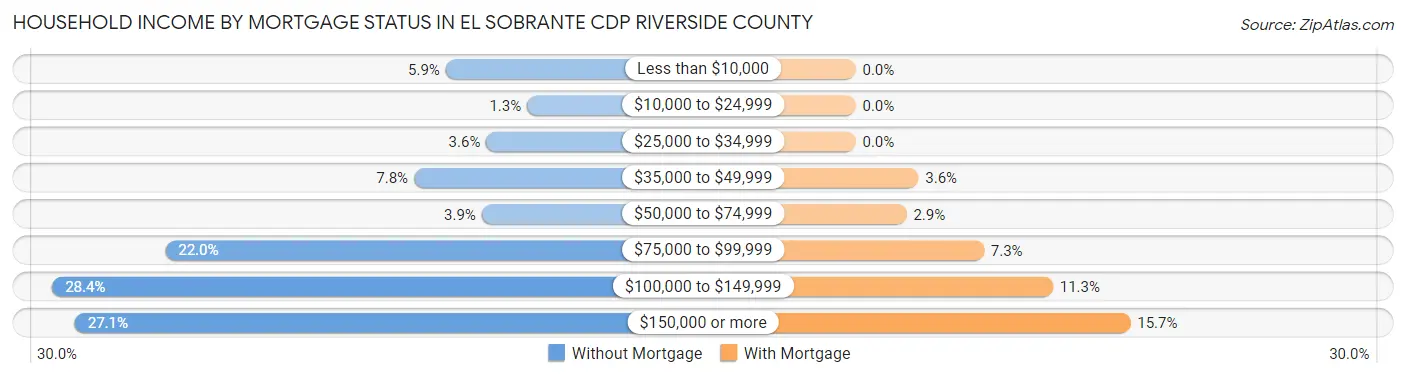
| Household Income | Without Mortgage | With Mortgage |
| Less than $10,000 | 23 (5.9%) | 0 (0.0%) |
| $10,000 to $24,999 | 5 (1.3%) | 0 (0.0%) |
| $25,000 to $34,999 | 14 (3.6%) | 0 (0.0%) |
| $35,000 to $49,999 | 30 (7.7%) | 111 (3.6%) |
| $50,000 to $74,999 | 15 (3.9%) | 90 (2.9%) |
| $75,000 to $99,999 | 85 (22.0%) | 227 (7.3%) |
| $100,000 to $149,999 | 110 (28.4%) | 349 (11.3%) |
| $150,000 or more | 105 (27.1%) | 486 (15.7%) |
| Total | 387 (100.0%) | 3,096 (100.0%) |
Property Value to Household Income Ratio in El Sobrante CDP Riverside County
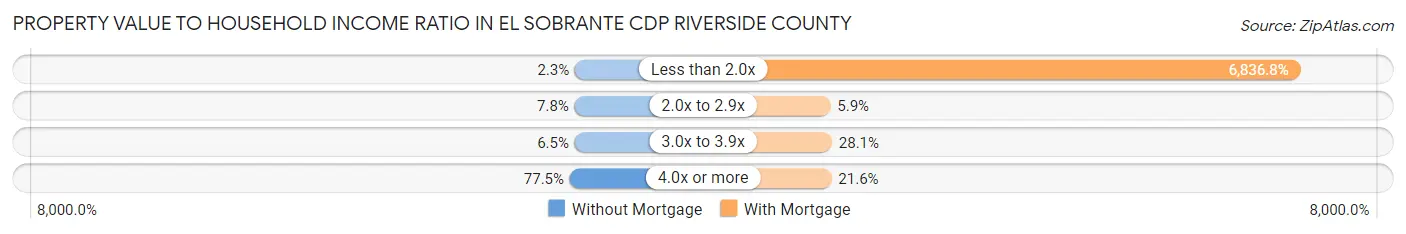
| Value-to-Income Ratio | Without Mortgage | With Mortgage |
| Less than 2.0x | 9 (2.3%) | 211,667 (6,836.8%) |
| 2.0x to 2.9x | 30 (7.7%) | 184 (5.9%) |
| 3.0x to 3.9x | 25 (6.5%) | 870 (28.1%) |
| 4.0x or more | 300 (77.5%) | 668 (21.6%) |
| Total | 387 (100.0%) | 3,096 (100.0%) |
Real Estate Taxes by Mortgage Status in El Sobrante CDP Riverside County
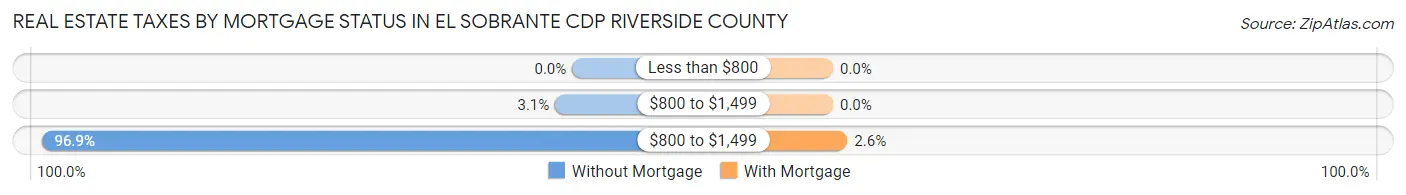
| Property Taxes | Without Mortgage | With Mortgage |
| Less than $800 | 0 (0.0%) | 0 (0.0%) |
| $800 to $1,499 | 12 (3.1%) | 0 (0.0%) |
| $800 to $1,499 | 375 (96.9%) | 81 (2.6%) |
| Total | 387 (100.0%) | 3,096 (100.0%) |
Health & Disability in El Sobrante CDP Riverside County
Health Insurance Coverage by Age in El Sobrante CDP Riverside County
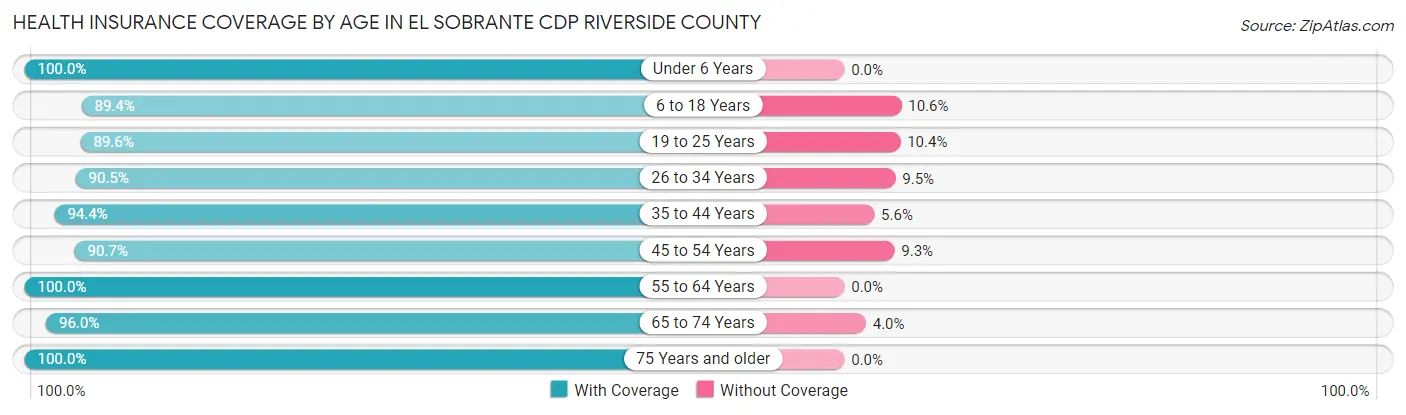
| Age Bracket | With Coverage | Without Coverage |
| Under 6 Years | 435 (100.0%) | 0 (0.0%) |
| 6 to 18 Years | 2,252 (89.4%) | 268 (10.6%) |
| 19 to 25 Years | 799 (89.6%) | 93 (10.4%) |
| 26 to 34 Years | 989 (90.5%) | 104 (9.5%) |
| 35 to 44 Years | 1,949 (94.4%) | 115 (5.6%) |
| 45 to 54 Years | 1,993 (90.7%) | 205 (9.3%) |
| 55 to 64 Years | 1,654 (100.0%) | 0 (0.0%) |
| 65 to 74 Years | 958 (96.0%) | 40 (4.0%) |
| 75 Years and older | 273 (100.0%) | 0 (0.0%) |
| Total | 11,302 (93.2%) | 825 (6.8%) |
Health Insurance Coverage by Citizenship Status in El Sobrante CDP Riverside County
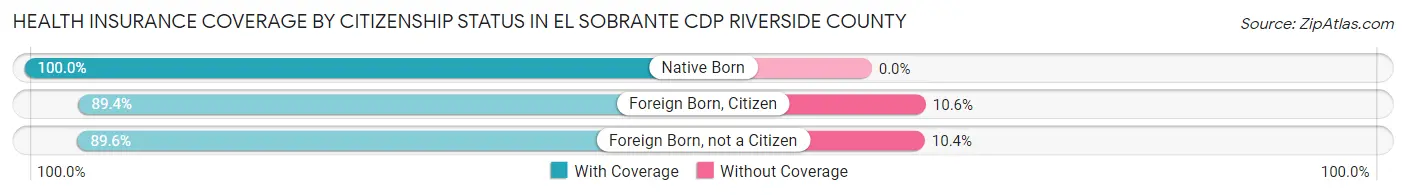
| Citizenship Status | With Coverage | Without Coverage |
| Native Born | 435 (100.0%) | 0 (0.0%) |
| Foreign Born, Citizen | 2,252 (89.4%) | 268 (10.6%) |
| Foreign Born, not a Citizen | 799 (89.6%) | 93 (10.4%) |
Health Insurance Coverage by Household Income in El Sobrante CDP Riverside County

| Household Income | With Coverage | Without Coverage |
| Under $25,000 | 28 (100.0%) | 0 (0.0%) |
| $25,000 to $49,999 | 600 (65.3%) | 319 (34.7%) |
| $50,000 to $74,999 | 646 (100.0%) | 0 (0.0%) |
| $75,000 to $99,999 | 1,535 (81.5%) | 348 (18.5%) |
| $100,000 and over | 8,446 (98.2%) | 158 (1.8%) |
Public vs Private Health Insurance Coverage by Age in El Sobrante CDP Riverside County
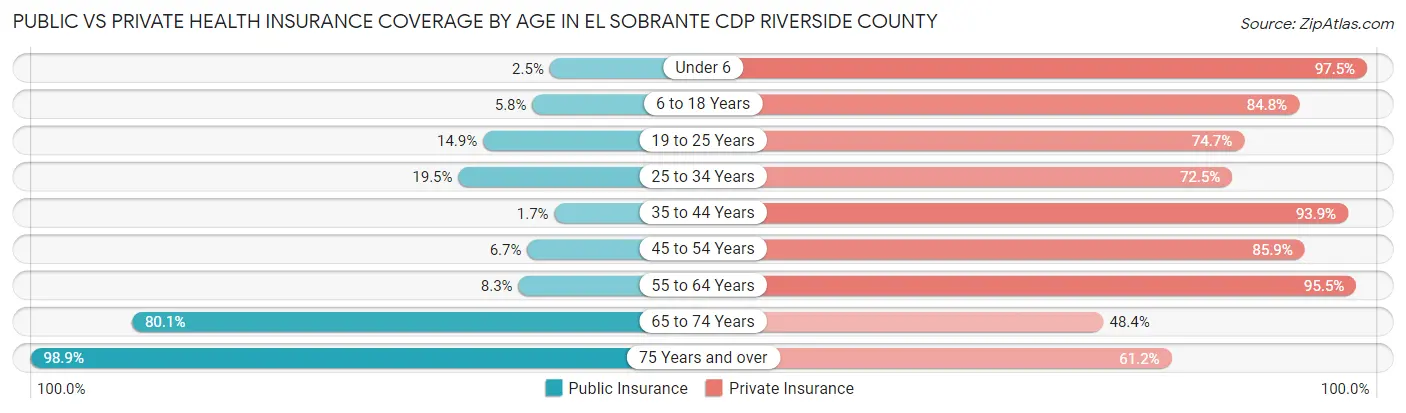
| Age Bracket | Public Insurance | Private Insurance |
| Under 6 | 11 (2.5%) | 424 (97.5%) |
| 6 to 18 Years | 145 (5.8%) | 2,138 (84.8%) |
| 19 to 25 Years | 133 (14.9%) | 666 (74.7%) |
| 25 to 34 Years | 213 (19.5%) | 792 (72.5%) |
| 35 to 44 Years | 34 (1.7%) | 1,939 (93.9%) |
| 45 to 54 Years | 147 (6.7%) | 1,888 (85.9%) |
| 55 to 64 Years | 138 (8.3%) | 1,579 (95.5%) |
| 65 to 74 Years | 799 (80.1%) | 483 (48.4%) |
| 75 Years and over | 270 (98.9%) | 167 (61.2%) |
| Total | 1,890 (15.6%) | 10,076 (83.1%) |
Disability Status by Sex by Age in El Sobrante CDP Riverside County
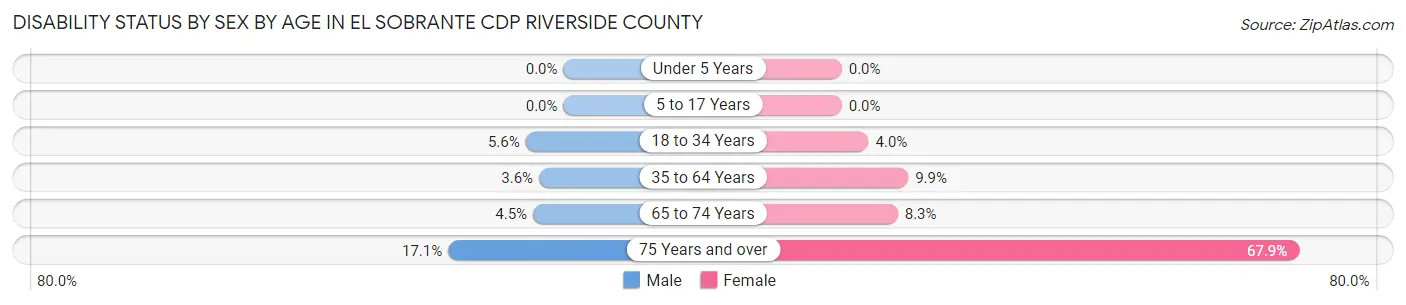
| Age Bracket | Male | Female |
| Under 5 Years | 0 (0.0%) | 0 (0.0%) |
| 5 to 17 Years | 0 (0.0%) | 0 (0.0%) |
| 18 to 34 Years | 70 (5.6%) | 37 (4.0%) |
| 35 to 64 Years | 109 (3.6%) | 286 (9.9%) |
| 65 to 74 Years | 25 (4.5%) | 37 (8.3%) |
| 75 Years and over | 19 (17.1%) | 110 (67.9%) |
Disability Class by Sex by Age in El Sobrante CDP Riverside County
Disability Class: Hearing Difficulty
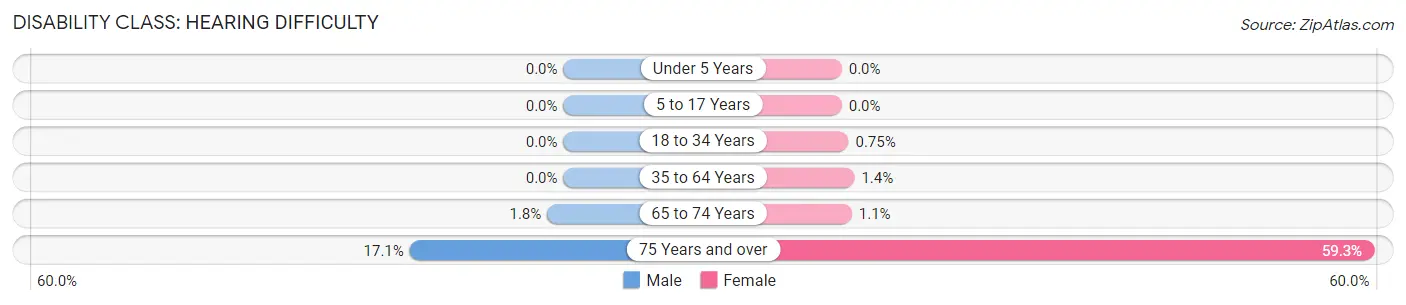
| Age Bracket | Male | Female |
| Under 5 Years | 0 (0.0%) | 0 (0.0%) |
| 5 to 17 Years | 0 (0.0%) | 0 (0.0%) |
| 18 to 34 Years | 0 (0.0%) | 7 (0.7%) |
| 35 to 64 Years | 0 (0.0%) | 41 (1.4%) |
| 65 to 74 Years | 10 (1.8%) | 5 (1.1%) |
| 75 Years and over | 19 (17.1%) | 96 (59.3%) |
Disability Class: Vision Difficulty
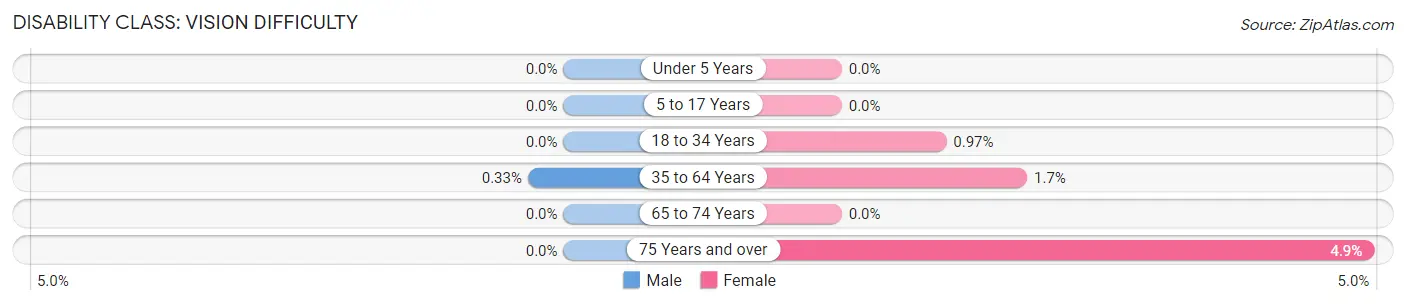
| Age Bracket | Male | Female |
| Under 5 Years | 0 (0.0%) | 0 (0.0%) |
| 5 to 17 Years | 0 (0.0%) | 0 (0.0%) |
| 18 to 34 Years | 0 (0.0%) | 9 (1.0%) |
| 35 to 64 Years | 10 (0.3%) | 50 (1.7%) |
| 65 to 74 Years | 0 (0.0%) | 0 (0.0%) |
| 75 Years and over | 0 (0.0%) | 8 (4.9%) |
Disability Class: Cognitive Difficulty
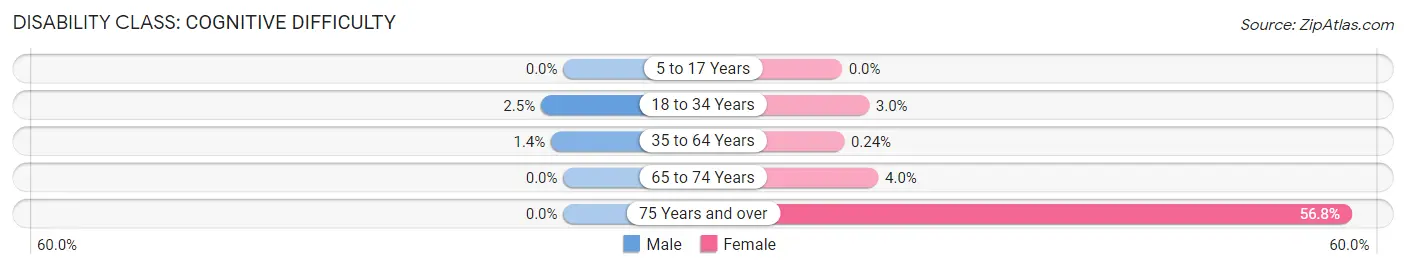
| Age Bracket | Male | Female |
| 5 to 17 Years | 0 (0.0%) | 0 (0.0%) |
| 18 to 34 Years | 31 (2.5%) | 28 (3.0%) |
| 35 to 64 Years | 41 (1.4%) | 7 (0.2%) |
| 65 to 74 Years | 0 (0.0%) | 18 (4.0%) |
| 75 Years and over | 0 (0.0%) | 92 (56.8%) |
Disability Class: Ambulatory Difficulty
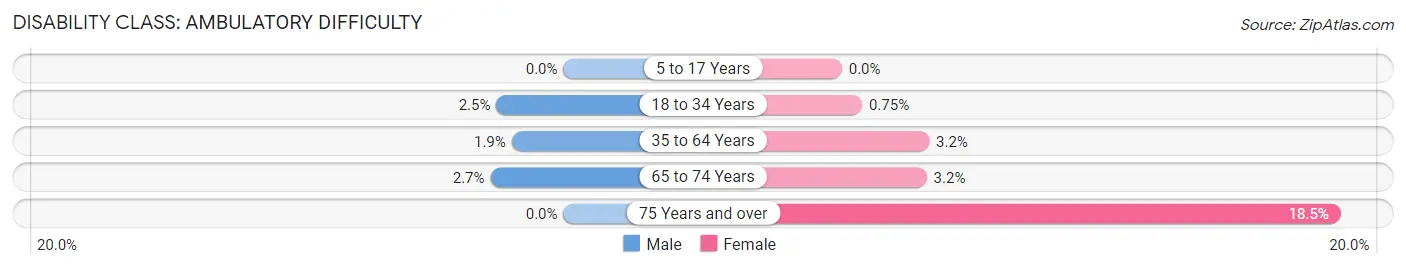
| Age Bracket | Male | Female |
| 5 to 17 Years | 0 (0.0%) | 0 (0.0%) |
| 18 to 34 Years | 31 (2.5%) | 7 (0.7%) |
| 35 to 64 Years | 58 (1.9%) | 94 (3.2%) |
| 65 to 74 Years | 15 (2.7%) | 14 (3.2%) |
| 75 Years and over | 0 (0.0%) | 30 (18.5%) |
Disability Class: Self-Care Difficulty
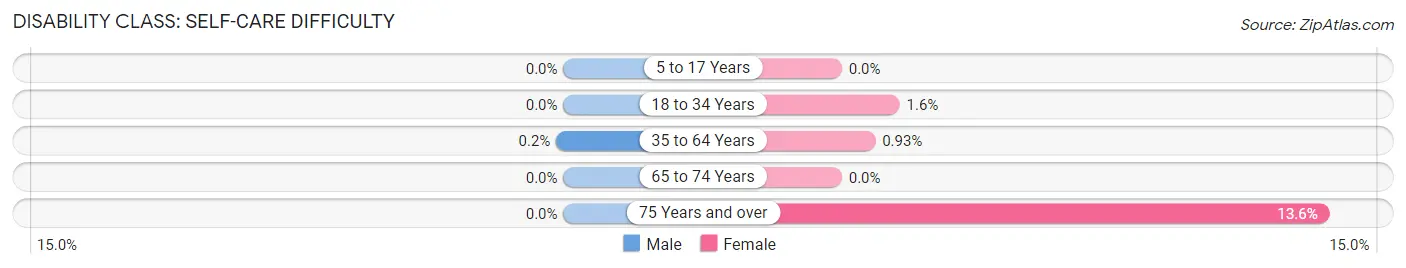
| Age Bracket | Male | Female |
| 5 to 17 Years | 0 (0.0%) | 0 (0.0%) |
| 18 to 34 Years | 0 (0.0%) | 15 (1.6%) |
| 35 to 64 Years | 6 (0.2%) | 27 (0.9%) |
| 65 to 74 Years | 0 (0.0%) | 0 (0.0%) |
| 75 Years and over | 0 (0.0%) | 22 (13.6%) |
Technology Access in El Sobrante CDP Riverside County
Computing Device Access in El Sobrante CDP Riverside County
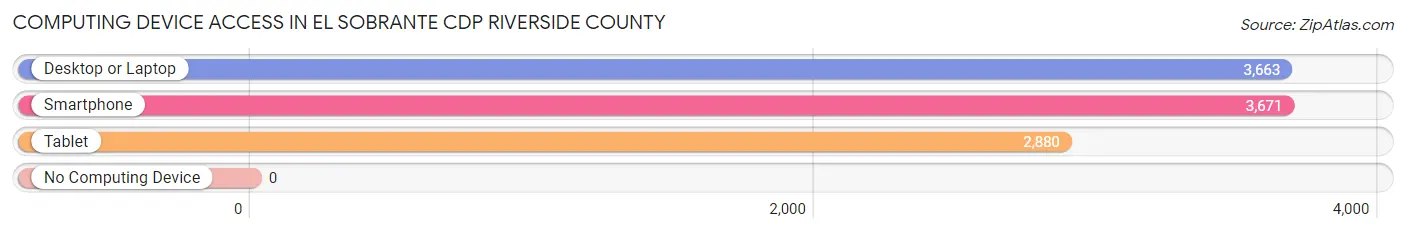
| Device Type | # Households | % Households |
| Desktop or Laptop | 3,663 | 96.8% |
| Smartphone | 3,671 | 97.0% |
| Tablet | 2,880 | 76.1% |
| No Computing Device | 0 | 0.0% |
| Total | 3,784 | 100.0% |
Internet Access in El Sobrante CDP Riverside County
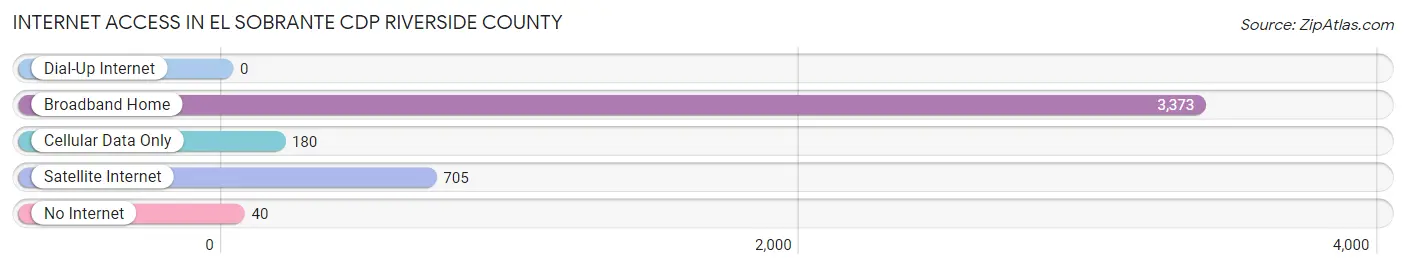
| Internet Type | # Households | % Households |
| Dial-Up Internet | 0 | 0.0% |
| Broadband Home | 3,373 | 89.1% |
| Cellular Data Only | 180 | 4.8% |
| Satellite Internet | 705 | 18.6% |
| No Internet | 40 | 1.1% |
| Total | 3,784 | 100.0% |
El Sobrante CDP Riverside County Summary
Sobrante Cdp is a census-designated place (CDP) located in Riverside County, California. It is situated in the San Jacinto Valley, approximately 10 miles east of the city of Riverside. The population of Sobrante Cdp was 2,845 at the 2010 census.
History
The area now known as Sobrante Cdp was originally inhabited by the Cahuilla Indians. The first Europeans to settle in the area were the Spanish, who established the Mission San Luis Rey de Francia in 1798. The mission was abandoned in 1834, and the land was divided into large ranchos. The Sobrante Cdp area was part of the Rancho San Jacinto Viejo, which was granted to Juan Bandini in 1842.
In the late 19th century, the area was settled by farmers and ranchers, and the town of Sobrante was established in 1891. The town was named after the Sobrante family, who were among the first settlers in the area. The town was a small agricultural community, and the main crops grown were citrus, grapes, and olives.
Geography
Sobrante Cdp is located at 33°48'25"N, 117°7'25"W (33.806944, -117.123611). It is situated in the San Jacinto Valley, approximately 10 miles east of the city of Riverside. The CDP has a total area of 1.3 square miles, all of which is land.
Economy
The economy of Sobrante Cdp is largely based on agriculture. The main crops grown in the area are citrus, grapes, and olives. The area is also home to several wineries, including the Sobrante Winery, which produces a variety of wines.
In addition to agriculture, Sobrante Cdp is home to several businesses, including a gas station, a grocery store, and a post office. The area is also home to several churches, including the Sobrante United Methodist Church.
Demographics
As of the 2010 census, there were 2,845 people, 945 households, and 745 families residing in Sobrante Cdp. The population density was 2,179.2 people per square mile. The racial makeup of the CDP was 68.2% White, 0.7% African American, 0.7% Native American, 0.7% Asian, 0.1% Pacific Islander, 25.7% from other races, and 4.0% from two or more races. Hispanic or Latino of any race were 44.2% of the population.
The median income for a household in the CDP was $45,938, and the median income for a family was $50,000. The per capita income for the CDP was $17,945. About 11.2% of families and 14.2% of the population were below the poverty line, including 18.2% of those under age 18 and 8.3% of those age 65 or over.
Common Questions
What is Per Capita Income in El Sobrante CDP Riverside County?
Per Capita income in El Sobrante CDP Riverside County is $62,417.
What is the Median Family Income in El Sobrante CDP Riverside County?
Median Family Income in El Sobrante CDP Riverside County is $194,056.
What is the Median Household income in El Sobrante CDP Riverside County?
Median Household Income in El Sobrante CDP Riverside County is $180,761.
What is Income or Wage Gap in El Sobrante CDP Riverside County?
Income or Wage Gap in El Sobrante CDP Riverside County is 13.6%.
Women in El Sobrante CDP Riverside County earn 86.4 cents for every dollar earned by a man.
What is Inequality or Gini Index in El Sobrante CDP Riverside County?
Inequality or Gini Index in El Sobrante CDP Riverside County is 0.35.
What is the Total Population of El Sobrante CDP Riverside County?
Total Population of El Sobrante CDP Riverside County is 12,127.
What is the Total Male Population of El Sobrante CDP Riverside County?
Total Male Population of El Sobrante CDP Riverside County is 6,052.
What is the Total Female Population of El Sobrante CDP Riverside County?
Total Female Population of El Sobrante CDP Riverside County is 6,075.
What is the Ratio of Males per 100 Females in El Sobrante CDP Riverside County?
There are 99.62 Males per 100 Females in El Sobrante CDP Riverside County.
What is the Ratio of Females per 100 Males in El Sobrante CDP Riverside County?
There are 100.38 Females per 100 Males in El Sobrante CDP Riverside County.
What is the Median Population Age in El Sobrante CDP Riverside County?
Median Population Age in El Sobrante CDP Riverside County is 39.2 Years.
What is the Average Family Size in El Sobrante CDP Riverside County
Average Family Size in El Sobrante CDP Riverside County is 3.4 People.
What is the Average Household Size in El Sobrante CDP Riverside County
Average Household Size in El Sobrante CDP Riverside County is 3.2 People.
How Large is the Labor Force in El Sobrante CDP Riverside County?
There are 6,938 People in the Labor Forcein in El Sobrante CDP Riverside County.
What is the Percentage of People in the Labor Force in El Sobrante CDP Riverside County?
71.9% of People are in the Labor Force in El Sobrante CDP Riverside County.
What is the Unemployment Rate in El Sobrante CDP Riverside County?
Unemployment Rate in El Sobrante CDP Riverside County is 4.0%.