Cities with the Lowest Poverty Level Among Seniors Over the Age of 75 in Vermont
RELATED REPORTS & OPTIONS
Lowest Poverty | Seniors 75+
Vermont
Compare Cities
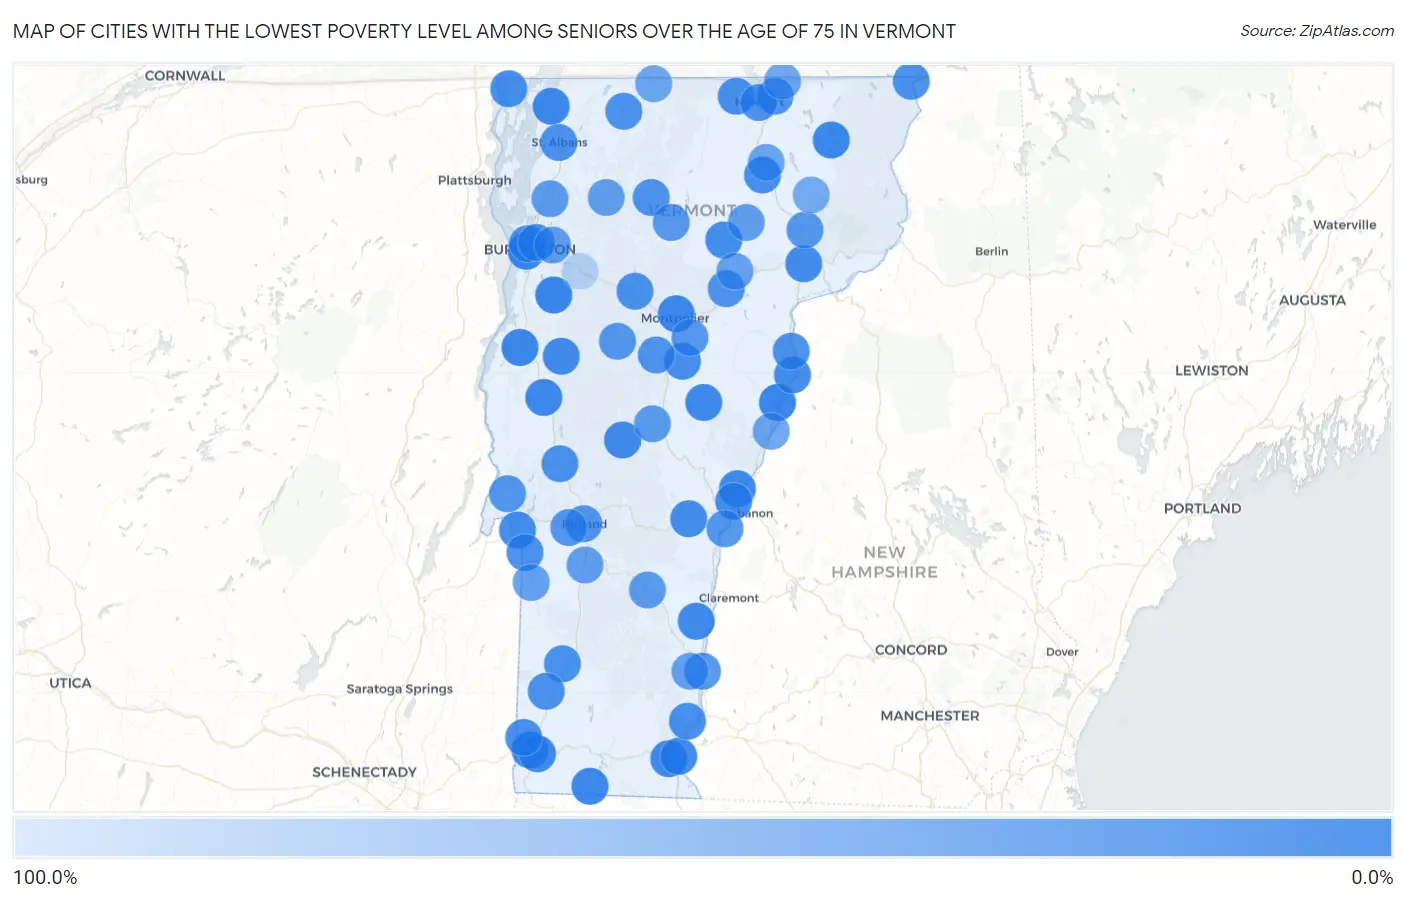
Map of Cities with the Lowest Poverty Level Among Seniors Over the Age of 75 in Vermont
100.0%
0.0%
Cities with the Lowest Poverty Level Among Seniors Over the Age of 75 in Vermont
| City | Senior Poverty | vs State | vs National | |
| 1. | Bradford | 1.8% | 9.5%(-7.69)#1 | 11.1%(-9.25)#427 |
| 2. | Hinesburg | 2.1% | 9.5%(-7.42)#2 | 11.1%(-8.98)#577 |
| 3. | South Burlington | 2.8% | 9.5%(-6.69)#3 | 11.1%(-8.26)#1,089 |
| 4. | Vergennes | 2.8% | 9.5%(-6.69)#4 | 11.1%(-8.25)#1,099 |
| 5. | Island Pond | 2.9% | 9.5%(-6.56)#5 | 11.1%(-8.13)#1,192 |
| 6. | Killington | 2.9% | 9.5%(-6.56)#6 | 11.1%(-8.13)#1,198 |
| 7. | Swanton | 4.3% | 9.5%(-5.23)#7 | 11.1%(-6.79)#2,454 |
| 8. | Readsboro | 4.5% | 9.5%(-4.96)#8 | 11.1%(-6.52)#2,755 |
| 9. | Middlebury | 5.1% | 9.5%(-4.38)#9 | 11.1%(-5.94)#3,328 |
| 10. | Montpelier | 5.6% | 9.5%(-3.93)#10 | 11.1%(-5.50)#3,810 |
| 11. | Chelsea | 6.2% | 9.5%(-3.25)#11 | 11.1%(-4.82)#4,546 |
| 12. | Norwich | 6.9% | 9.5%(-2.57)#12 | 11.1%(-4.14)#5,267 |
| 13. | West Brattleboro | 7.4% | 9.5%(-2.12)#13 | 11.1%(-3.68)#5,698 |
| 14. | Old Bennington | 7.7% | 9.5%(-1.81)#14 | 11.1%(-3.37)#6,030 |
| 15. | Springfield | 8.1% | 9.5%(-1.41)#15 | 11.1%(-2.97)#6,372 |
| 16. | Bennington | 8.2% | 9.5%(-1.35)#16 | 11.1%(-2.92)#6,426 |
| 17. | Bristol | 8.3% | 9.5%(-1.17)#17 | 11.1%(-2.73)#6,577 |
| 18. | Brattleboro | 8.9% | 9.5%(-0.645)#18 | 11.1%(-2.21)#7,122 |
| 19. | Rochester | 8.9% | 9.5%(-0.616)#19 | 11.1%(-2.18)#7,156 |
| 20. | St Johnsbury | 9.6% | 9.5%(+0.123)#20 | 11.1%(-1.44)#7,855 |
| 21. | Hardwick | 9.8% | 9.5%(+0.299)#21 | 11.1%(-1.26)#8,031 |
| 22. | Woodstock | 9.8% | 9.5%(+0.340)#22 | 11.1%(-1.22)#8,065 |
| 23. | Fair Haven | 10.5% | 9.5%(+1.02)#23 | 11.1%(-0.541)#8,683 |
| 24. | Newbury | 10.7% | 9.5%(+1.21)#24 | 11.1%(-0.353)#8,875 |
| 25. | Alburgh | 11.1% | 9.5%(+1.61)#25 | 11.1%(+0.044)#9,242 |
| 26. | Glover | 11.1% | 9.5%(+1.61)#26 | 11.1%(+0.044)#9,284 |
| 27. | North Bennington | 12.4% | 9.5%(+2.94)#27 | 11.1%(+1.38)#10,259 |
| 28. | Burlington | 12.8% | 9.5%(+3.26)#28 | 11.1%(+1.69)#10,584 |
| 29. | Wilder | 12.9% | 9.5%(+3.41)#29 | 11.1%(+1.85)#10,709 |
| 30. | Newport Center | 13.3% | 9.5%(+3.83)#30 | 11.1%(+2.27)#11,046 |
| 31. | Williamstown | 13.5% | 9.5%(+3.96)#31 | 11.1%(+2.39)#11,120 |
| 32. | Putney | 13.6% | 9.5%(+4.05)#32 | 11.1%(+2.49)#11,185 |
| 33. | Brandon | 14.3% | 9.5%(+4.78)#33 | 11.1%(+3.22)#11,623 |
| 34. | Wells River | 14.3% | 9.5%(+4.78)#34 | 11.1%(+3.22)#11,687 |
| 35. | Waterbury | 14.3% | 9.5%(+4.85)#35 | 11.1%(+3.28)#11,764 |
| 36. | Winooski | 14.5% | 9.5%(+4.97)#36 | 11.1%(+3.41)#11,820 |
| 37. | Manchester | 14.6% | 9.5%(+5.06)#37 | 11.1%(+3.50)#11,869 |
| 38. | Townshend | 14.6% | 9.5%(+5.13)#38 | 11.1%(+3.57)#11,926 |
| 39. | Poultney | 15.1% | 9.5%(+5.59)#39 | 11.1%(+4.03)#12,198 |
| 40. | Canaan | 15.2% | 9.5%(+5.65)#40 | 11.1%(+4.08)#12,232 |
| 41. | Arlington | 16.3% | 9.5%(+6.75)#41 | 11.1%(+5.18)#12,815 |
| 42. | Enosburg Falls | 16.9% | 9.5%(+7.36)#42 | 11.1%(+5.80)#13,185 |
| 43. | St Albans | 17.4% | 9.5%(+7.85)#43 | 11.1%(+6.29)#13,397 |
| 44. | Derby Center | 17.4% | 9.5%(+7.89)#44 | 11.1%(+6.32)#13,411 |
| 45. | Johnson | 17.6% | 9.5%(+8.14)#45 | 11.1%(+6.58)#13,511 |
| 46. | Newport | 18.1% | 9.5%(+8.59)#46 | 11.1%(+7.03)#13,727 |
| 47. | Rutland | 19.4% | 9.5%(+9.85)#47 | 11.1%(+8.29)#14,288 |
| 48. | Northfield | 19.4% | 9.5%(+9.86)#48 | 11.1%(+8.30)#14,303 |
| 49. | Marshfield | 20.0% | 9.5%(+10.5)#49 | 11.1%(+8.93)#14,559 |
| 50. | Stamford | 20.4% | 9.5%(+10.9)#50 | 11.1%(+9.30)#14,735 |
| 51. | Bellows Falls | 22.3% | 9.5%(+12.8)#51 | 11.1%(+11.2)#15,356 |
| 52. | Benson | 22.4% | 9.5%(+12.9)#52 | 11.1%(+11.4)#15,393 |
| 53. | Lyndonville | 22.6% | 9.5%(+13.1)#53 | 11.1%(+11.5)#15,427 |
| 54. | North Hartland | 22.8% | 9.5%(+13.3)#54 | 11.1%(+11.7)#15,494 |
| 55. | Waitsfield | 23.0% | 9.5%(+13.5)#55 | 11.1%(+11.9)#15,548 |
| 56. | West Rutland | 23.7% | 9.5%(+14.2)#56 | 11.1%(+12.7)#15,746 |
| 57. | Morrisville | 26.2% | 9.5%(+16.7)#57 | 11.1%(+15.2)#16,380 |
| 58. | Barre | 26.4% | 9.5%(+16.9)#58 | 11.1%(+15.4)#16,435 |
| 59. | Ludlow | 27.9% | 9.5%(+18.4)#59 | 11.1%(+16.9)#16,732 |
| 60. | Milton | 28.6% | 9.5%(+19.1)#60 | 11.1%(+17.5)#16,818 |
| 61. | Randolph | 28.8% | 9.5%(+19.3)#61 | 11.1%(+17.7)#16,889 |
| 62. | Essex Junction | 30.6% | 9.5%(+21.1)#62 | 11.1%(+19.6)#17,184 |
| 63. | Wallingford | 33.3% | 9.5%(+23.8)#63 | 11.1%(+22.3)#17,501 |
| 64. | Greensboro Bend | 33.3% | 9.5%(+23.8)#64 | 11.1%(+22.3)#17,548 |
| 65. | Cambridge | 33.3% | 9.5%(+23.8)#65 | 11.1%(+22.3)#17,577 |
| 66. | Saxtons River | 35.3% | 9.5%(+25.8)#66 | 11.1%(+24.2)#17,823 |
| 67. | Cabot | 36.4% | 9.5%(+26.9)#67 | 11.1%(+25.3)#17,924 |
| 68. | Wells | 36.8% | 9.5%(+27.3)#68 | 11.1%(+25.8)#17,972 |
| 69. | Derby Line | 39.8% | 9.5%(+30.3)#69 | 11.1%(+28.8)#18,235 |
| 70. | Fairlee | 40.0% | 9.5%(+30.5)#70 | 11.1%(+28.9)#18,287 |
| 71. | Barton | 40.3% | 9.5%(+30.8)#71 | 11.1%(+29.2)#18,321 |
| 72. | Richford | 40.8% | 9.5%(+31.3)#72 | 11.1%(+29.7)#18,356 |
| 73. | Castleton Four Corners | 42.0% | 9.5%(+32.5)#73 | 11.1%(+31.0)#18,444 |
| 74. | Chittenden | 42.1% | 9.5%(+32.6)#74 | 11.1%(+31.0)#18,457 |
| 75. | West Burke | 50.0% | 9.5%(+40.5)#75 | 11.1%(+38.9)#18,963 |
| 76. | Peacham | 59.0% | 9.5%(+49.5)#76 | 11.1%(+47.9)#19,319 |
| 77. | Pawlet | 62.5% | 9.5%(+53.0)#77 | 11.1%(+51.4)#19,430 |
| 78. | Pownal | 69.4% | 9.5%(+59.9)#78 | 11.1%(+58.4)#19,574 |
| 79. | Richmond | 100.0% | 9.5%(+90.5)#79 | 11.1%(+88.9)#19,857 |
| 80. | East Dorset | 100.0% | 9.5%(+90.5)#80 | 11.1%(+88.9)#19,955 |
| 81. | Wolcott | 100.0% | 9.5%(+90.5)#81 | 11.1%(+88.9)#20,000 |
1
2Common Questions
What are the Top 10 Cities with the Lowest Poverty Level Among Seniors Over the Age of 75 in Vermont?
Top 10 Cities with the Lowest Poverty Level Among Seniors Over the Age of 75 in Vermont are:
#1
0.0%
#2
0.0%
#3
0.0%
#4
0.0%
#5
0.0%
#6
0.0%
#7
0.0%
#8
0.0%
#9
0.0%
#10
0.0%
What city has the Lowest Poverty Level Among Seniors Over the Age of 75 in Vermont?
Bradford has the Lowest Poverty Level Among Seniors Over the Age of 75 in Vermont with 1.8%.
What is the Poverty Level Among Seniors Over the Age of 75 in the State of Vermont?
Poverty Level Among Seniors Over the Age of 75 in Vermont is 9.5%.
What is the Poverty Level Among Seniors Over the Age of 75 in the United States?
Poverty Level Among Seniors Over the Age of 75 in the United States is 11.1%.