Cities with the Lowest Poverty Level Among Seniors Over the Age of 75 in Montana
RELATED REPORTS & OPTIONS
Lowest Poverty | Seniors 75+
Montana
Compare Cities
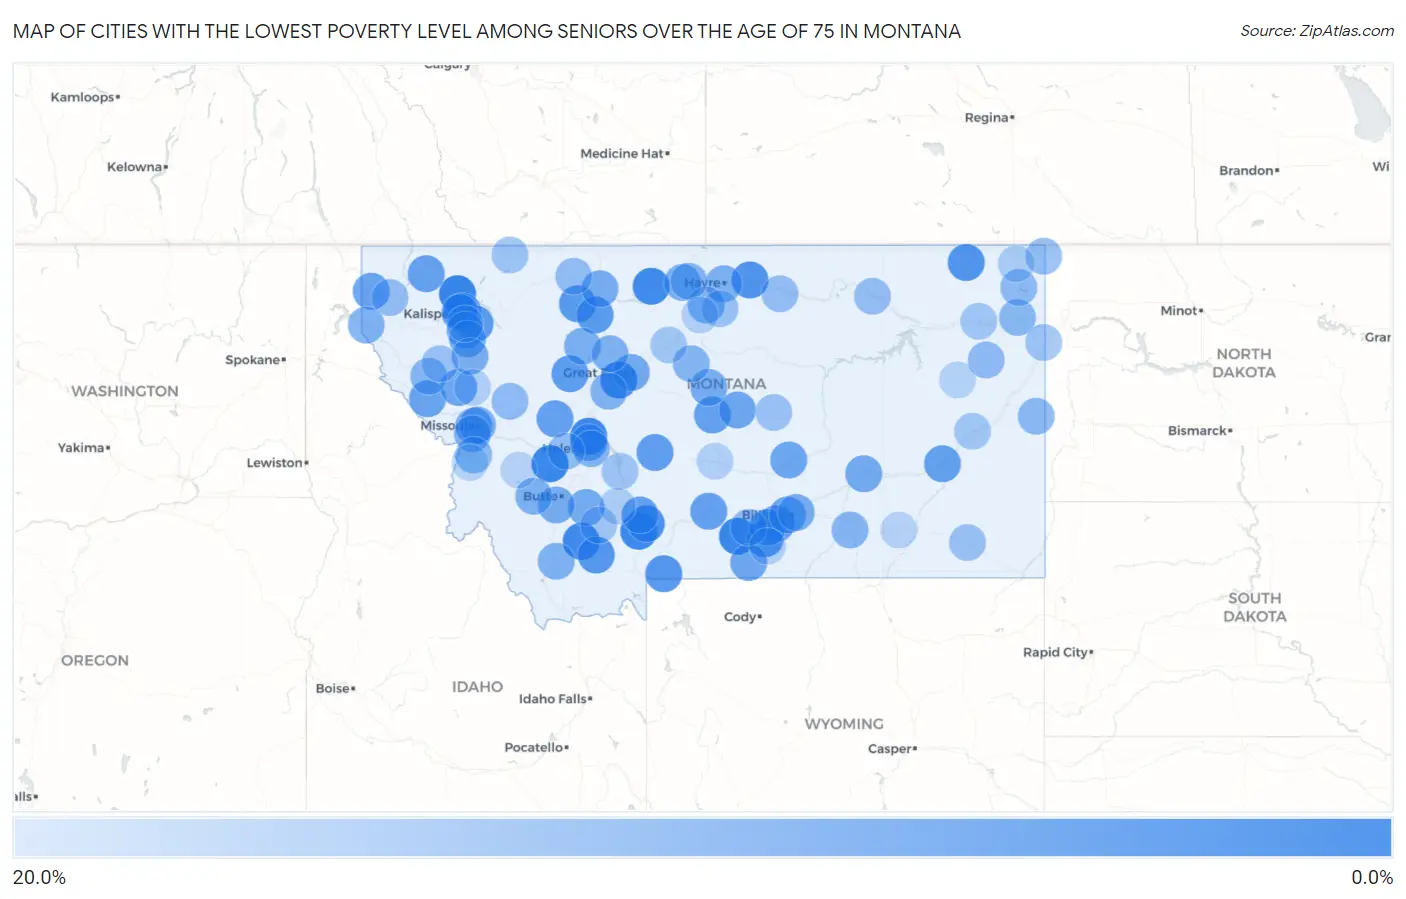
Map of Cities with the Lowest Poverty Level Among Seniors Over the Age of 75 in Montana
20.0%
0.0%
Cities with the Lowest Poverty Level Among Seniors Over the Age of 75 in Montana
| City | Senior Poverty | vs State | vs National | |
| 1. | Whitefish | 2.0% | 10.6%(-8.55)#1 | 11.1%(-9.05)#532 |
| 2. | Absarokee | 2.3% | 10.6%(-8.27)#2 | 11.1%(-8.77)#724 |
| 3. | Deer Lodge | 2.4% | 10.6%(-8.17)#3 | 11.1%(-8.66)#779 |
| 4. | Helena Valley Northwest | 2.7% | 10.6%(-7.92)#4 | 11.1%(-8.42)#967 |
| 5. | Gallatin Gateway | 2.9% | 10.6%(-7.71)#5 | 11.1%(-8.21)#1,132 |
| 6. | Chester | 3.0% | 10.6%(-7.53)#6 | 11.1%(-8.02)#1,283 |
| 7. | Ulm | 3.2% | 10.6%(-7.40)#7 | 11.1%(-7.89)#1,385 |
| 8. | Sheridan | 3.2% | 10.6%(-7.40)#8 | 11.1%(-7.89)#1,386 |
| 9. | Bozeman | 4.3% | 10.6%(-6.28)#9 | 11.1%(-6.78)#2,468 |
| 10. | Evergreen | 5.0% | 10.6%(-5.56)#10 | 11.1%(-6.05)#3,235 |
| 11. | Chinook | 5.2% | 10.6%(-5.34)#11 | 11.1%(-5.83)#3,427 |
| 12. | Scobey | 5.6% | 10.6%(-5.02)#12 | 11.1%(-5.51)#3,758 |
| 13. | Virginia City | 5.9% | 10.6%(-4.69)#13 | 11.1%(-5.18)#4,150 |
| 14. | Gardiner | 6.0% | 10.6%(-4.57)#14 | 11.1%(-5.07)#4,259 |
| 15. | Joliet | 6.0% | 10.6%(-4.57)#15 | 11.1%(-5.07)#4,262 |
| 16. | Valier | 6.5% | 10.6%(-4.08)#16 | 11.1%(-4.57)#4,817 |
| 17. | Conrad | 6.5% | 10.6%(-4.06)#17 | 11.1%(-4.56)#4,825 |
| 18. | Bigfork | 6.7% | 10.6%(-3.90)#18 | 11.1%(-4.40)#4,946 |
| 19. | Augusta | 6.8% | 10.6%(-3.75)#19 | 11.1%(-4.25)#5,140 |
| 20. | Laurel | 7.3% | 10.6%(-3.29)#20 | 11.1%(-3.79)#5,603 |
| 21. | White Sulphur Springs | 7.5% | 10.6%(-3.07)#21 | 11.1%(-3.57)#5,819 |
| 22. | Kalispell | 7.8% | 10.6%(-2.79)#22 | 11.1%(-3.29)#6,086 |
| 23. | Hobson | 7.9% | 10.6%(-2.68)#23 | 11.1%(-3.17)#6,189 |
| 24. | Big Timber | 8.0% | 10.6%(-2.61)#24 | 11.1%(-3.10)#6,236 |
| 25. | Park City | 8.1% | 10.6%(-2.51)#25 | 11.1%(-3.00)#6,345 |
| 26. | Lincoln | 8.1% | 10.6%(-2.51)#26 | 11.1%(-3.00)#6,346 |
| 27. | Miles City | 8.2% | 10.6%(-2.38)#27 | 11.1%(-2.87)#6,461 |
| 28. | Belgrade | 8.2% | 10.6%(-2.34)#28 | 11.1%(-2.84)#6,494 |
| 29. | Trego | 8.3% | 10.6%(-2.24)#29 | 11.1%(-2.73)#6,598 |
| 30. | Troy | 8.6% | 10.6%(-2.00)#30 | 11.1%(-2.50)#6,846 |
| 31. | Superior | 8.8% | 10.6%(-1.72)#31 | 11.1%(-2.22)#7,112 |
| 32. | Dixon | 9.1% | 10.6%(-1.48)#32 | 11.1%(-1.98)#7,361 |
| 33. | Roundup | 9.1% | 10.6%(-1.43)#33 | 11.1%(-1.92)#7,428 |
| 34. | Lakeside | 9.2% | 10.6%(-1.40)#34 | 11.1%(-1.89)#7,447 |
| 35. | Billings | 9.2% | 10.6%(-1.38)#35 | 11.1%(-1.88)#7,465 |
| 36. | Lewistown | 9.3% | 10.6%(-1.26)#36 | 11.1%(-1.76)#7,566 |
| 37. | Orchard Homes | 9.4% | 10.6%(-1.21)#37 | 11.1%(-1.70)#7,609 |
| 38. | Helena Valley West Central | 9.5% | 10.6%(-1.09)#38 | 11.1%(-1.59)#7,706 |
| 39. | Red Lodge | 9.5% | 10.6%(-1.09)#39 | 11.1%(-1.59)#7,707 |
| 40. | Great Falls | 9.8% | 10.6%(-0.741)#40 | 11.1%(-1.24)#8,050 |
| 41. | Hysham | 10.0% | 10.6%(-0.571)#41 | 11.1%(-1.07)#8,238 |
| 42. | Montaqua | 10.0% | 10.6%(-0.571)#42 | 11.1%(-1.07)#8,260 |
| 43. | Whitehall | 10.2% | 10.6%(-0.380)#43 | 11.1%(-0.876)#8,386 |
| 44. | Shelby | 10.5% | 10.6%(-0.044)#44 | 11.1%(-0.541)#8,681 |
| 45. | Denton | 10.5% | 10.6%(-0.044)#45 | 11.1%(-0.541)#8,723 |
| 46. | Rollins | 10.5% | 10.6%(-0.044)#46 | 11.1%(-0.541)#8,732 |
| 47. | Butte Silver Bow Balance | 10.6% | 10.6%(+0.005)#47 | 11.1%(-0.491)#8,762 |
| 48. | Polson | 10.8% | 10.6%(+0.235)#48 | 11.1%(-0.261)#8,937 |
| 49. | Lockwood | 10.9% | 10.6%(+0.363)#49 | 11.1%(-0.133)#9,052 |
| 50. | Choteau | 11.0% | 10.6%(+0.412)#50 | 11.1%(-0.084)#9,087 |
| 51. | Missoula | 11.1% | 10.6%(+0.534)#51 | 11.1%(+0.038)#9,165 |
| 52. | Hingham | 11.1% | 10.6%(+0.540)#52 | 11.1%(+0.044)#9,308 |
| 53. | Anaconda Deer Lodge County | 11.4% | 10.6%(+0.872)#53 | 11.1%(+0.375)#9,521 |
| 54. | Havre | 11.5% | 10.6%(+0.928)#54 | 11.1%(+0.431)#9,554 |
| 55. | Heron | 11.5% | 10.6%(+0.968)#55 | 11.1%(+0.472)#9,591 |
| 56. | Lolo | 11.6% | 10.6%(+0.987)#56 | 11.1%(+0.491)#9,605 |
| 57. | Dillon | 11.6% | 10.6%(+1.01)#57 | 11.1%(+0.512)#9,616 |
| 58. | Rocky Boy West | 11.8% | 10.6%(+1.19)#58 | 11.1%(+0.698)#9,756 |
| 59. | Power | 11.8% | 10.6%(+1.19)#59 | 11.1%(+0.698)#9,787 |
| 60. | Cascade | 11.8% | 10.6%(+1.26)#60 | 11.1%(+0.761)#9,832 |
| 61. | Helena | 12.4% | 10.6%(+1.86)#61 | 11.1%(+1.36)#10,244 |
| 62. | Crow Agency | 12.5% | 10.6%(+1.93)#62 | 11.1%(+1.43)#10,294 |
| 63. | Plains | 12.5% | 10.6%(+1.93)#63 | 11.1%(+1.43)#10,308 |
| 64. | Geraldine | 12.5% | 10.6%(+1.93)#64 | 11.1%(+1.43)#10,378 |
| 65. | Gildford | 12.5% | 10.6%(+1.93)#65 | 11.1%(+1.43)#10,397 |
| 66. | Culbertson | 13.2% | 10.6%(+2.59)#66 | 11.1%(+2.09)#10,879 |
| 67. | Wibaux | 13.2% | 10.6%(+2.59)#67 | 11.1%(+2.09)#10,880 |
| 68. | Stevensville | 13.2% | 10.6%(+2.64)#68 | 11.1%(+2.14)#10,914 |
| 69. | Medicine Lake | 13.6% | 10.6%(+3.07)#69 | 11.1%(+2.57)#11,255 |
| 70. | Richey | 13.8% | 10.6%(+3.22)#70 | 11.1%(+2.73)#11,361 |
| 71. | Seeley Lake | 13.8% | 10.6%(+3.28)#71 | 11.1%(+2.78)#11,379 |
| 72. | Columbus | 14.1% | 10.6%(+3.53)#72 | 11.1%(+3.04)#11,534 |
| 73. | Cut Bank | 14.1% | 10.6%(+3.55)#73 | 11.1%(+3.06)#11,541 |
| 74. | Elliston | 14.3% | 10.6%(+3.72)#74 | 11.1%(+3.22)#11,707 |
| 75. | Westby | 14.3% | 10.6%(+3.72)#75 | 11.1%(+3.22)#11,711 |
| 76. | Libby | 14.4% | 10.6%(+3.83)#76 | 11.1%(+3.34)#11,789 |
| 77. | Fort Belknap Agency | 14.6% | 10.6%(+4.06)#77 | 11.1%(+3.57)#11,910 |
| 78. | Hinsdale | 14.6% | 10.6%(+4.06)#78 | 11.1%(+3.57)#11,925 |
| 79. | Broadus | 15.2% | 10.6%(+4.58)#79 | 11.1%(+4.08)#12,231 |
| 80. | Hot Springs | 15.2% | 10.6%(+4.65)#80 | 11.1%(+4.15)#12,262 |
| 81. | Rocky Boy S Agency | 15.4% | 10.6%(+4.81)#81 | 11.1%(+4.32)#12,363 |
| 82. | Grass Range | 15.4% | 10.6%(+4.81)#82 | 11.1%(+4.32)#12,371 |
| 83. | Fairview | 15.5% | 10.6%(+4.95)#83 | 11.1%(+4.45)#12,432 |
| 84. | Babb | 15.7% | 10.6%(+5.12)#84 | 11.1%(+4.62)#12,521 |
| 85. | Townsend | 15.9% | 10.6%(+5.28)#85 | 11.1%(+4.79)#12,609 |
| 86. | Pony | 16.0% | 10.6%(+5.43)#86 | 11.1%(+4.93)#12,699 |
| 87. | Poplar | 16.2% | 10.6%(+5.65)#87 | 11.1%(+5.15)#12,800 |
| 88. | Terry | 16.3% | 10.6%(+5.76)#88 | 11.1%(+5.26)#12,853 |
| 89. | Fort Benton | 16.5% | 10.6%(+5.90)#89 | 11.1%(+5.40)#12,903 |
| 90. | Plentywood | 17.6% | 10.6%(+7.00)#90 | 11.1%(+6.50)#13,481 |
| 91. | Three Forks | 17.8% | 10.6%(+7.21)#91 | 11.1%(+6.71)#13,595 |
| 92. | St Ignatius | 18.1% | 10.6%(+7.48)#92 | 11.1%(+6.99)#13,705 |
| 93. | Fromberg | 18.2% | 10.6%(+7.61)#93 | 11.1%(+7.11)#13,780 |
| 94. | Big Sandy | 18.4% | 10.6%(+7.80)#94 | 11.1%(+7.30)#13,891 |
| 95. | Harlowton | 18.4% | 10.6%(+7.85)#95 | 11.1%(+7.35)#13,908 |
| 96. | Somers | 18.8% | 10.6%(+8.18)#96 | 11.1%(+7.68)#14,034 |
| 97. | Circle | 18.8% | 10.6%(+8.27)#97 | 11.1%(+7.77)#14,078 |
| 98. | Victor | 18.9% | 10.6%(+8.30)#98 | 11.1%(+7.80)#14,087 |
| 99. | Philipsburg | 18.9% | 10.6%(+8.38)#99 | 11.1%(+7.88)#14,118 |
| 100. | Lame Deer | 19.0% | 10.6%(+8.48)#100 | 11.1%(+7.98)#14,148 |
Common Questions
What are the Top 10 Cities with the Lowest Poverty Level Among Seniors Over the Age of 75 in Montana?
Top 10 Cities with the Lowest Poverty Level Among Seniors Over the Age of 75 in Montana are:
#1
2.0%
#2
2.3%
#3
2.4%
#4
2.7%
#5
2.9%
#6
3.0%
#7
3.2%
#8
3.2%
#9
4.3%
#10
5.0%
What city has the Lowest Poverty Level Among Seniors Over the Age of 75 in Montana?
Whitefish has the Lowest Poverty Level Among Seniors Over the Age of 75 in Montana with 2.0%.
What is the Poverty Level Among Seniors Over the Age of 75 in the State of Montana?
Poverty Level Among Seniors Over the Age of 75 in Montana is 10.6%.
What is the Poverty Level Among Seniors Over the Age of 75 in the United States?
Poverty Level Among Seniors Over the Age of 75 in the United States is 11.1%.