Rossmoor, CA Map & Demographics
Rossmoor Map
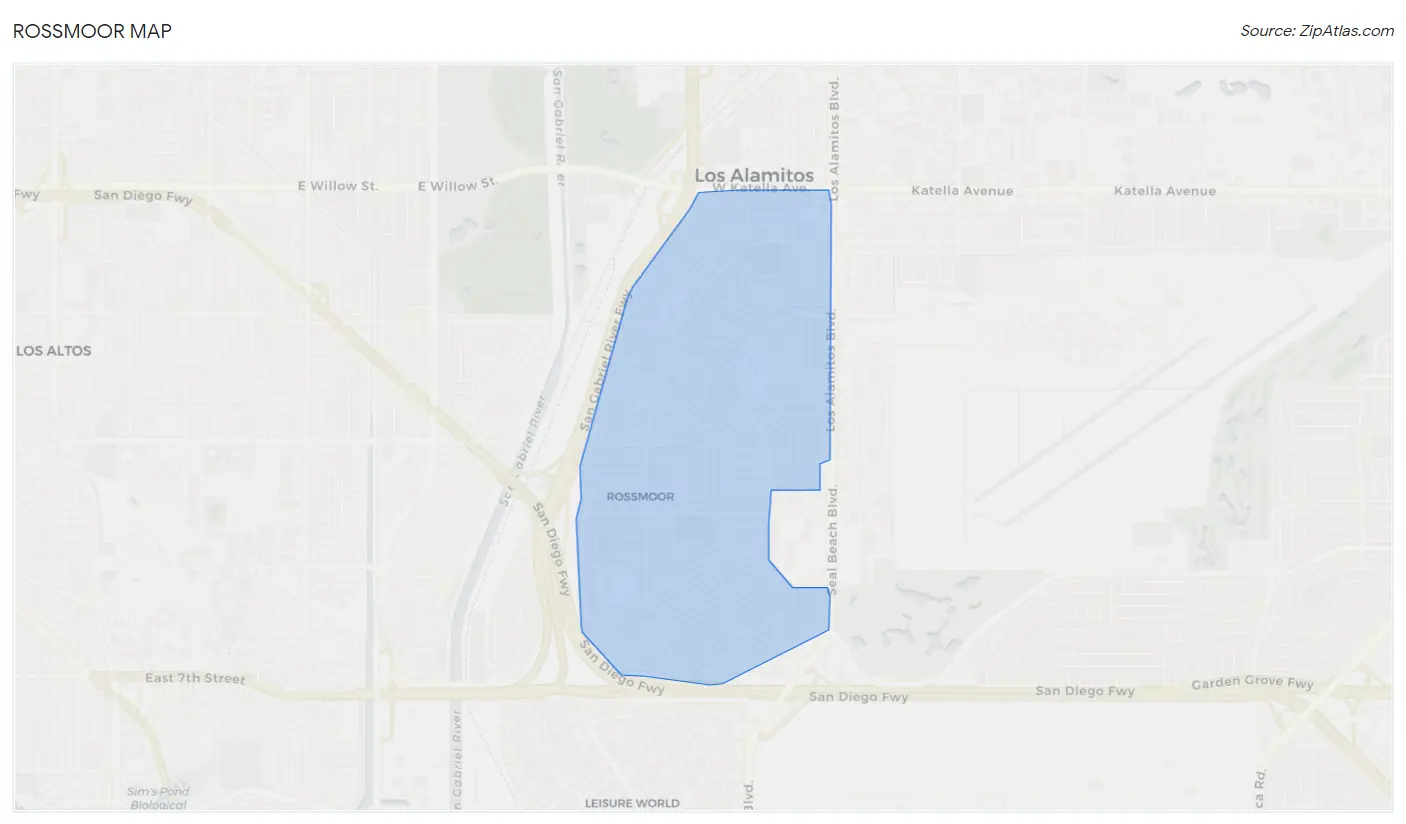
Rossmoor Overview
$83,148
PER CAPITA INCOME
$212,978
AVG FAMILY INCOME
$184,712
AVG HOUSEHOLD INCOME
51.1%
WAGE / INCOME GAP [ % ]
48.9¢/ $1
WAGE / INCOME GAP [ $ ]
0.45
INEQUALITY / GINI INDEX
11,742
TOTAL POPULATION
5,857
MALE POPULATION
5,885
FEMALE POPULATION
99.52
MALES / 100 FEMALES
100.48
FEMALES / 100 MALES
47.6
MEDIAN AGE
3.2
AVG FAMILY SIZE
3.0
AVG HOUSEHOLD SIZE
5,568
LABOR FORCE [ PEOPLE ]
60.4%
PERCENT IN LABOR FORCE
4.6%
UNEMPLOYMENT RATE
Income in Rossmoor
Income Overview in Rossmoor
Per Capita Income in Rossmoor is $83,148, while median incomes of families and households are $212,978 and $184,712 respectively.
| Characteristic | Number | Measure |
| Per Capita Income | 11,742 | $83,148 |
| Median Family Income | 3,317 | $212,978 |
| Mean Family Income | 3,317 | $271,710 |
| Median Household Income | 3,967 | $184,712 |
| Mean Household Income | 3,967 | $246,715 |
| Income Deficit | 3,317 | $0 |
| Wage / Income Gap (%) | 11,742 | 51.08% |
| Wage / Income Gap ($) | 11,742 | 48.92¢ per $1 |
| Gini / Inequality Index | 11,742 | 0.45 |
Earnings by Sex in Rossmoor
Average Earnings in Rossmoor are $95,189, $115,101 for men and $56,308 for women, a difference of 51.1%.
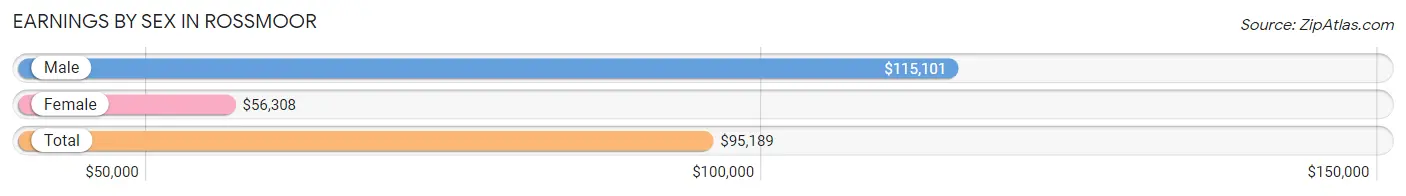
| Sex | Number | Average Earnings |
| Male | 3,059 (51.5%) | $115,101 |
| Female | 2,881 (48.5%) | $56,308 |
| Total | 5,940 (100.0%) | $95,189 |
Earnings by Sex by Income Bracket in Rossmoor
The most common earnings brackets in Rossmoor are $100,000+ for men (1,816 | 59.4%) and $100,000+ for women (1,013 | 35.2%).
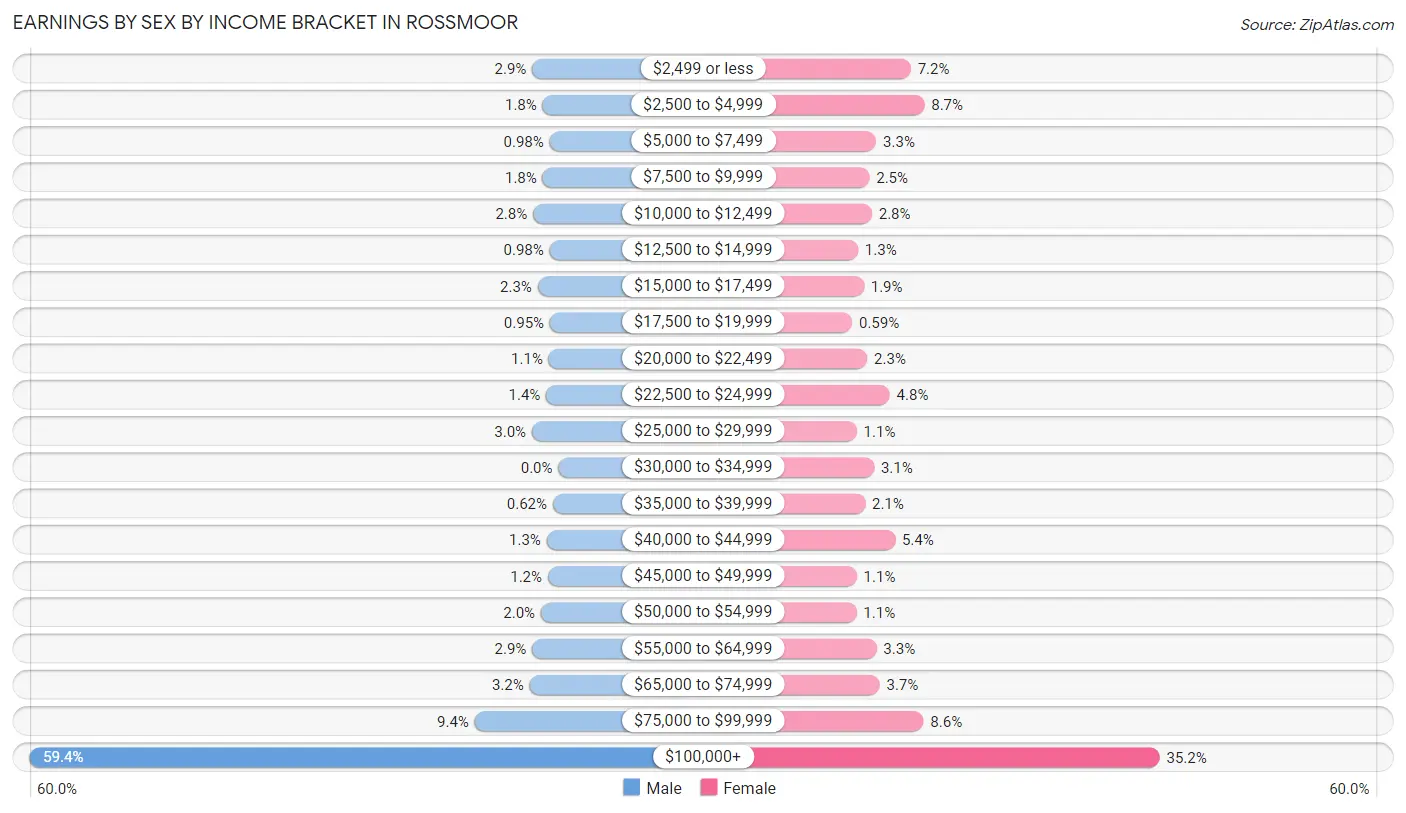
| Income | Male | Female |
| $2,499 or less | 90 (2.9%) | 207 (7.2%) |
| $2,500 to $4,999 | 54 (1.8%) | 251 (8.7%) |
| $5,000 to $7,499 | 30 (1.0%) | 95 (3.3%) |
| $7,500 to $9,999 | 54 (1.8%) | 73 (2.5%) |
| $10,000 to $12,499 | 87 (2.8%) | 81 (2.8%) |
| $12,500 to $14,999 | 30 (1.0%) | 36 (1.3%) |
| $15,000 to $17,499 | 71 (2.3%) | 55 (1.9%) |
| $17,500 to $19,999 | 29 (0.9%) | 17 (0.6%) |
| $20,000 to $22,499 | 33 (1.1%) | 66 (2.3%) |
| $22,500 to $24,999 | 42 (1.4%) | 139 (4.8%) |
| $25,000 to $29,999 | 91 (3.0%) | 32 (1.1%) |
| $30,000 to $34,999 | 0 (0.0%) | 88 (3.0%) |
| $35,000 to $39,999 | 19 (0.6%) | 59 (2.1%) |
| $40,000 to $44,999 | 40 (1.3%) | 156 (5.4%) |
| $45,000 to $49,999 | 36 (1.2%) | 32 (1.1%) |
| $50,000 to $54,999 | 60 (2.0%) | 31 (1.1%) |
| $55,000 to $64,999 | 90 (2.9%) | 96 (3.3%) |
| $65,000 to $74,999 | 99 (3.2%) | 106 (3.7%) |
| $75,000 to $99,999 | 288 (9.4%) | 248 (8.6%) |
| $100,000+ | 1,816 (59.4%) | 1,013 (35.2%) |
| Total | 3,059 (100.0%) | 2,881 (100.0%) |
Earnings by Sex by Educational Attainment in Rossmoor
Average earnings in Rossmoor are $133,750 for men and $77,188 for women, a difference of 42.3%. Men with an educational attainment of bachelor's degree enjoy the highest average annual earnings of $152,296, while those with less than high school education earn the least with $87,292. Women with an educational attainment of graduate degree earn the most with the average annual earnings of $114,500, while those with less than high school education have the smallest earnings of $23,333.
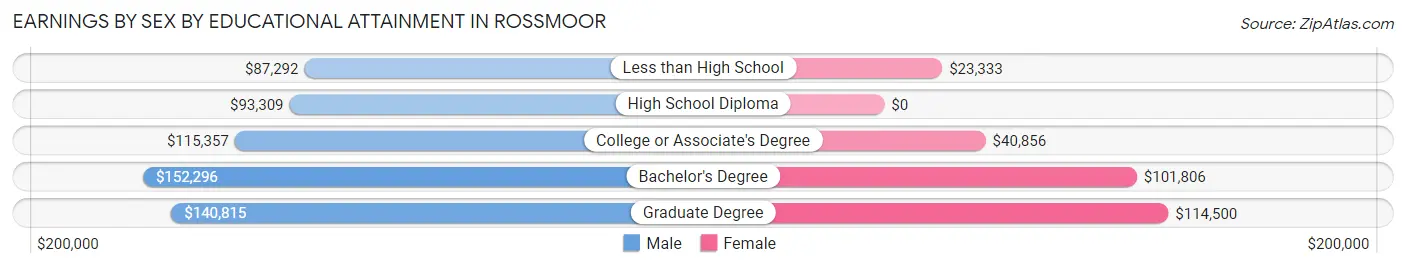
| Educational Attainment | Male Income | Female Income |
| Less than High School | $87,292 | $23,333 |
| High School Diploma | $93,309 | $0 |
| College or Associate's Degree | $115,357 | $40,856 |
| Bachelor's Degree | $152,296 | $101,806 |
| Graduate Degree | $140,815 | $114,500 |
| Total | $133,750 | $77,188 |
Family Income in Rossmoor
Family Income Brackets in Rossmoor
According to the Rossmoor family income data, there are 1,765 families falling into the $200,000+ income range, which is the most common income bracket and makes up 53.2% of all families.
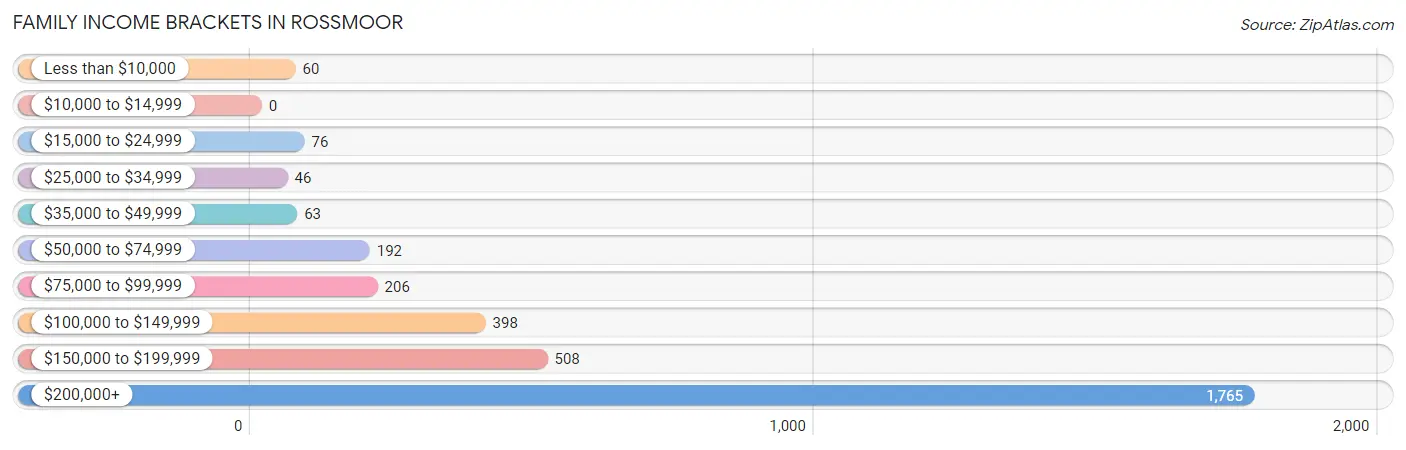
| Income Bracket | # Families | % Families |
| Less than $10,000 | 60 | 1.8% |
| $10,000 to $14,999 | 0 | 0.0% |
| $15,000 to $24,999 | 76 | 2.3% |
| $25,000 to $34,999 | 46 | 1.4% |
| $35,000 to $49,999 | 63 | 1.9% |
| $50,000 to $74,999 | 192 | 5.8% |
| $75,000 to $99,999 | 206 | 6.2% |
| $100,000 to $149,999 | 398 | 12.0% |
| $150,000 to $199,999 | 508 | 15.3% |
| $200,000+ | 1,765 | 53.2% |
Family Income by Famaliy Size in Rossmoor
4-person families (826 | 24.9%) account for the highest median family income in Rossmoor with $250,001 per family, while 2-person families (1,414 | 42.6%) have the highest median income of $81,090 per family member.
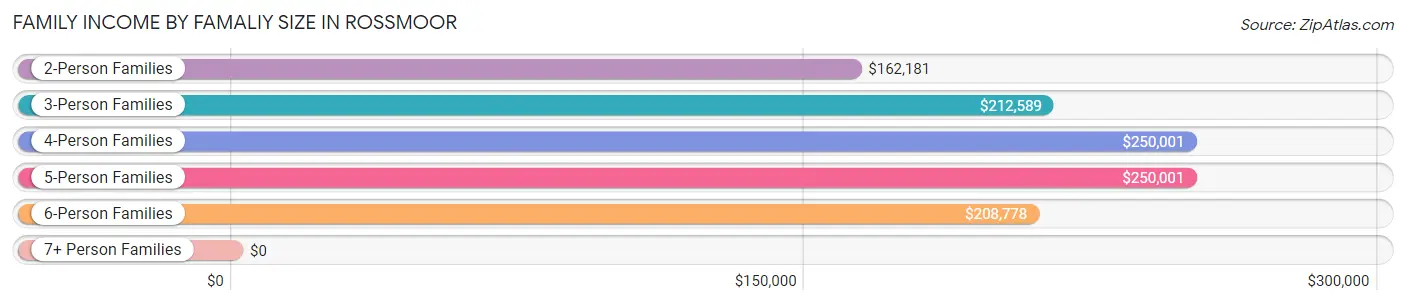
| Income Bracket | # Families | Median Income |
| 2-Person Families | 1,414 (42.6%) | $162,181 |
| 3-Person Families | 567 (17.1%) | $212,589 |
| 4-Person Families | 826 (24.9%) | $250,001 |
| 5-Person Families | 353 (10.6%) | $250,001 |
| 6-Person Families | 134 (4.0%) | $208,778 |
| 7+ Person Families | 23 (0.7%) | $0 |
| Total | 3,317 (100.0%) | $212,978 |
Family Income by Number of Earners in Rossmoor
The median family income in Rossmoor is $212,978, with families comprising 2 earners (1,598) having the highest median family income of $250,001, while families with no earners (524) have the lowest median family income of $99,310, accounting for 48.2% and 15.8% of families, respectively.
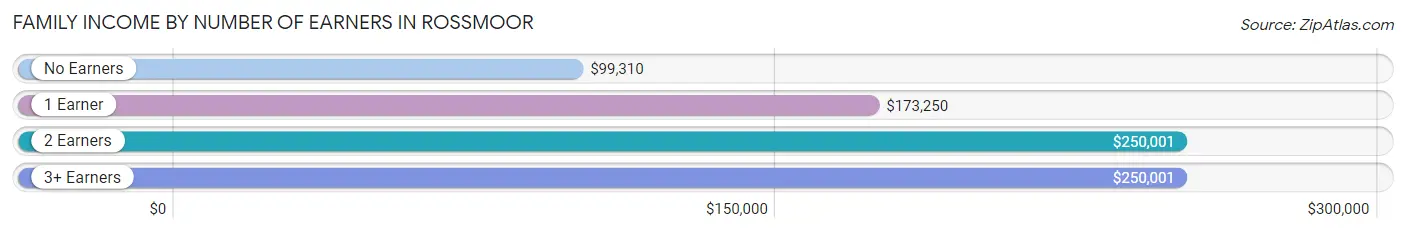
| Number of Earners | # Families | Median Income |
| No Earners | 524 (15.8%) | $99,310 |
| 1 Earner | 735 (22.2%) | $173,250 |
| 2 Earners | 1,598 (48.2%) | $250,001 |
| 3+ Earners | 460 (13.9%) | $250,001 |
| Total | 3,317 (100.0%) | $212,978 |
Household Income in Rossmoor
Household Income Brackets in Rossmoor
With 1,900 households falling in the category, the $200,000+ income range is the most frequent in Rossmoor, accounting for 47.9% of all households. In contrast, only 20 households (0.5%) fall into the $10,000 to $14,999 income bracket, making it the least populous group.
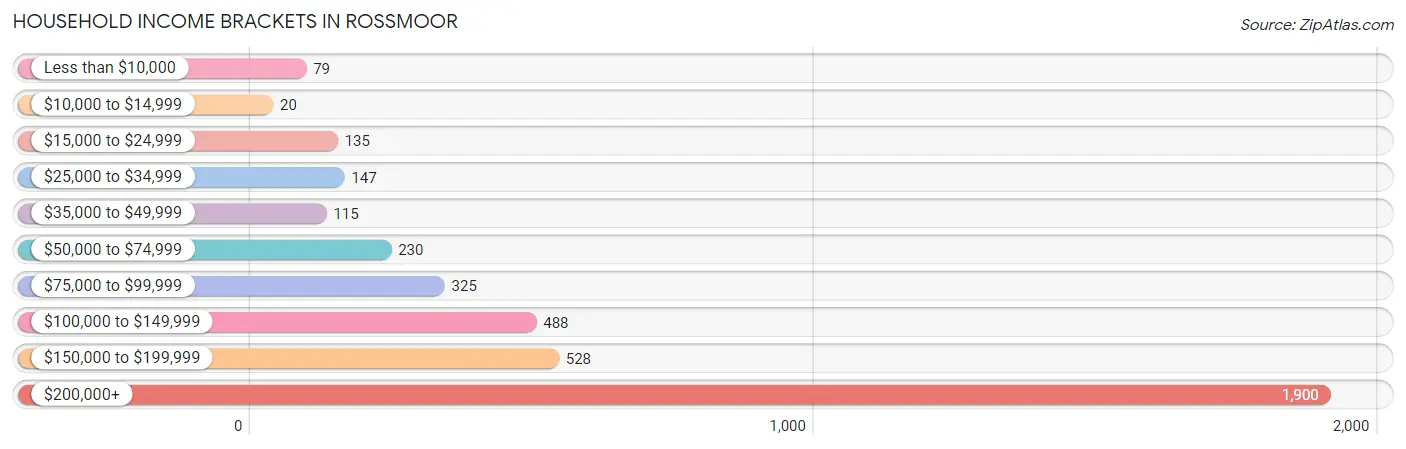
| Income Bracket | # Households | % Households |
| Less than $10,000 | 79 | 2.0% |
| $10,000 to $14,999 | 20 | 0.5% |
| $15,000 to $24,999 | 135 | 3.4% |
| $25,000 to $34,999 | 147 | 3.7% |
| $35,000 to $49,999 | 115 | 2.9% |
| $50,000 to $74,999 | 230 | 5.8% |
| $75,000 to $99,999 | 325 | 8.2% |
| $100,000 to $149,999 | 488 | 12.3% |
| $150,000 to $199,999 | 528 | 13.3% |
| $200,000+ | 1,900 | 47.9% |
Household Income by Householder Age in Rossmoor
The median household income in Rossmoor is $184,712, with the highest median household income of $250,001 found in the 45 to 64 years age bracket for the primary householder. A total of 2,013 households (50.7%) fall into this category. Meanwhile, the 15 to 24 years age bracket for the primary householder has the lowest median household income of $0, with 15 households (0.4%) in this group.
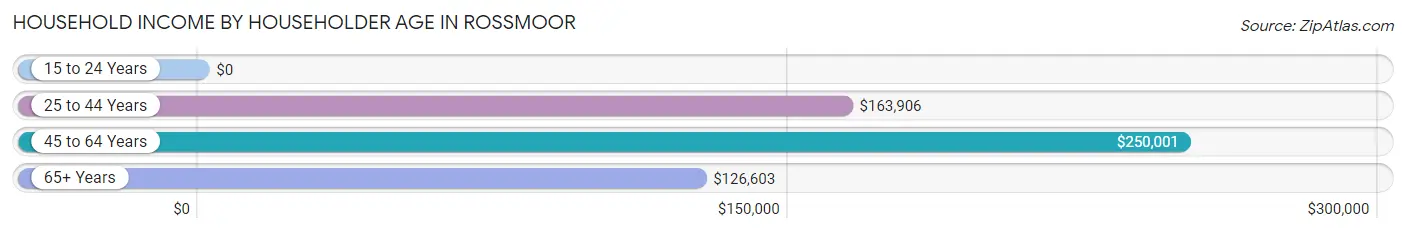
| Income Bracket | # Households | Median Income |
| 15 to 24 Years | 15 (0.4%) | $0 |
| 25 to 44 Years | 649 (16.4%) | $163,906 |
| 45 to 64 Years | 2,013 (50.7%) | $250,001 |
| 65+ Years | 1,290 (32.5%) | $126,603 |
| Total | 3,967 (100.0%) | $184,712 |
Poverty in Rossmoor
Income Below Poverty by Sex and Age in Rossmoor
With 3.2% poverty level for males and 3.5% for females among the residents of Rossmoor, under 5 year old males and 35 to 44 year old females are the most vulnerable to poverty, with 34 males (12.2%) and 58 females (9.0%) in their respective age groups living below the poverty level.
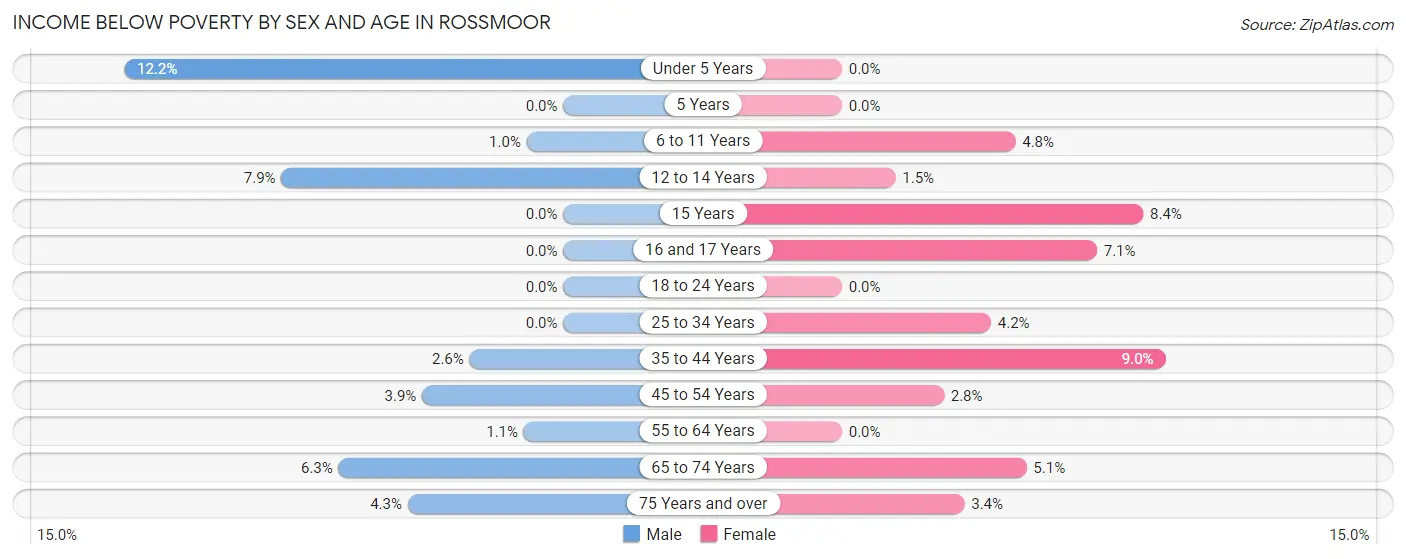
| Age Bracket | Male | Female |
| Under 5 Years | 34 (12.2%) | 0 (0.0%) |
| 5 Years | 0 (0.0%) | 0 (0.0%) |
| 6 to 11 Years | 6 (1.0%) | 21 (4.8%) |
| 12 to 14 Years | 34 (7.9%) | 5 (1.5%) |
| 15 Years | 0 (0.0%) | 12 (8.4%) |
| 16 and 17 Years | 0 (0.0%) | 12 (7.1%) |
| 18 to 24 Years | 0 (0.0%) | 0 (0.0%) |
| 25 to 34 Years | 0 (0.0%) | 9 (4.2%) |
| 35 to 44 Years | 12 (2.6%) | 58 (9.0%) |
| 45 to 54 Years | 33 (3.9%) | 26 (2.8%) |
| 55 to 64 Years | 12 (1.1%) | 0 (0.0%) |
| 65 to 74 Years | 38 (6.3%) | 40 (5.1%) |
| 75 Years and over | 20 (4.3%) | 20 (3.4%) |
| Total | 189 (3.2%) | 203 (3.5%) |
Income Above Poverty by Sex and Age in Rossmoor
According to the poverty statistics in Rossmoor, males aged 5 years and females aged under 5 years are the age groups that are most secure financially, with 100.0% of males and 100.0% of females in these age groups living above the poverty line.
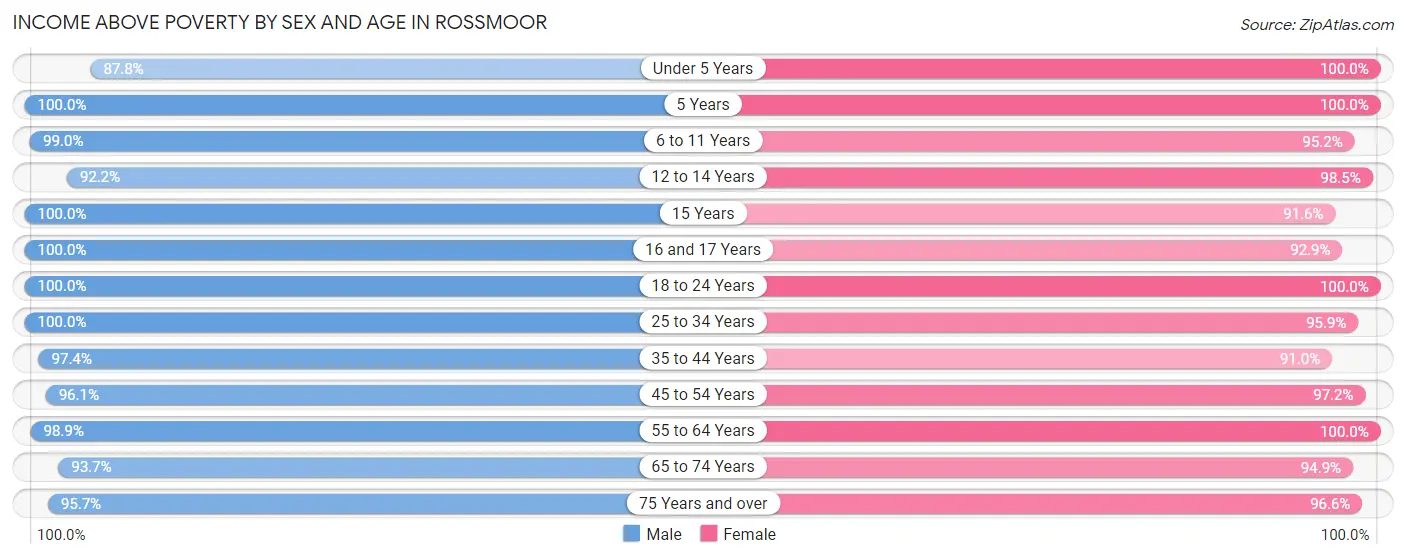
| Age Bracket | Male | Female |
| Under 5 Years | 244 (87.8%) | 80 (100.0%) |
| 5 Years | 57 (100.0%) | 72 (100.0%) |
| 6 to 11 Years | 582 (99.0%) | 414 (95.2%) |
| 12 to 14 Years | 399 (92.1%) | 330 (98.5%) |
| 15 Years | 101 (100.0%) | 131 (91.6%) |
| 16 and 17 Years | 280 (100.0%) | 157 (92.9%) |
| 18 to 24 Years | 319 (100.0%) | 473 (100.0%) |
| 25 to 34 Years | 343 (100.0%) | 208 (95.9%) |
| 35 to 44 Years | 448 (97.4%) | 586 (91.0%) |
| 45 to 54 Years | 806 (96.1%) | 891 (97.2%) |
| 55 to 64 Years | 1,078 (98.9%) | 1,034 (100.0%) |
| 65 to 74 Years | 569 (93.7%) | 738 (94.9%) |
| 75 Years and over | 442 (95.7%) | 566 (96.6%) |
| Total | 5,668 (96.8%) | 5,680 (96.6%) |
Income Below Poverty Among Married-Couple Families in Rossmoor
The poverty statistics for married-couple families in Rossmoor show that 2.2% or 63 of the total 2,901 families live below the poverty line. Families with no children have the highest poverty rate of 3.5%, comprising of 51 families. On the other hand, families with 3 or 4 children have the lowest poverty rate of 0.0%, which includes 0 families.
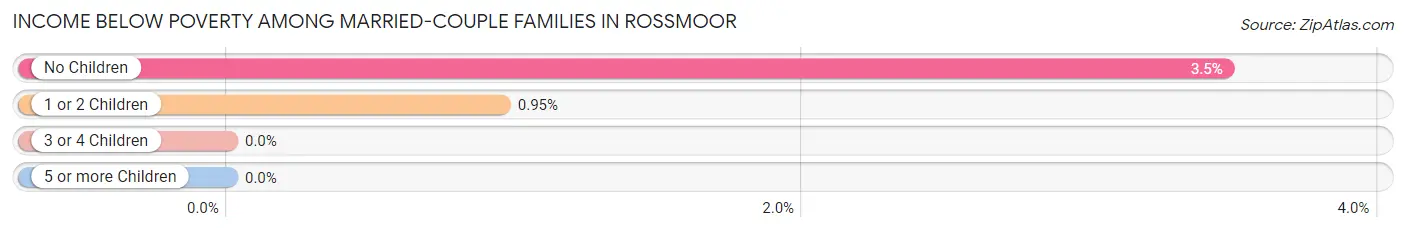
| Children | Above Poverty | Below Poverty |
| No Children | 1,418 (96.5%) | 51 (3.5%) |
| 1 or 2 Children | 1,256 (99.1%) | 12 (0.9%) |
| 3 or 4 Children | 164 (100.0%) | 0 (0.0%) |
| 5 or more Children | 0 (0.0%) | 0 (0.0%) |
| Total | 2,838 (97.8%) | 63 (2.2%) |
Income Below Poverty Among Single-Parent Households in Rossmoor
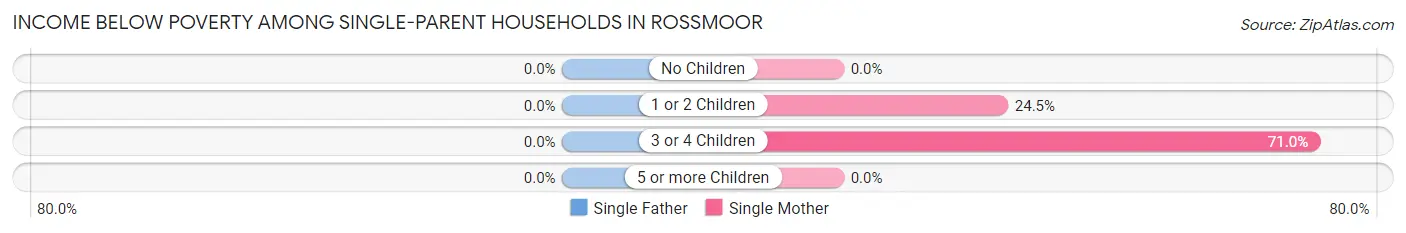
| Children | Single Father | Single Mother |
| No Children | 0 (0.0%) | 0 (0.0%) |
| 1 or 2 Children | 0 (0.0%) | 23 (24.5%) |
| 3 or 4 Children | 0 (0.0%) | 22 (71.0%) |
| 5 or more Children | 0 (0.0%) | 0 (0.0%) |
| Total | 0 (0.0%) | 45 (16.0%) |
Income Below Poverty Among Married-Couple vs Single-Parent Households in Rossmoor
The poverty data for Rossmoor shows that 63 of the married-couple family households (2.2%) and 45 of the single-parent households (10.8%) are living below the poverty level. Within the married-couple family households, those with no children have the highest poverty rate, with 51 households (3.5%) falling below the poverty line. Among the single-parent households, those with 3 or 4 children have the highest poverty rate, with 22 household (29.7%) living below poverty.
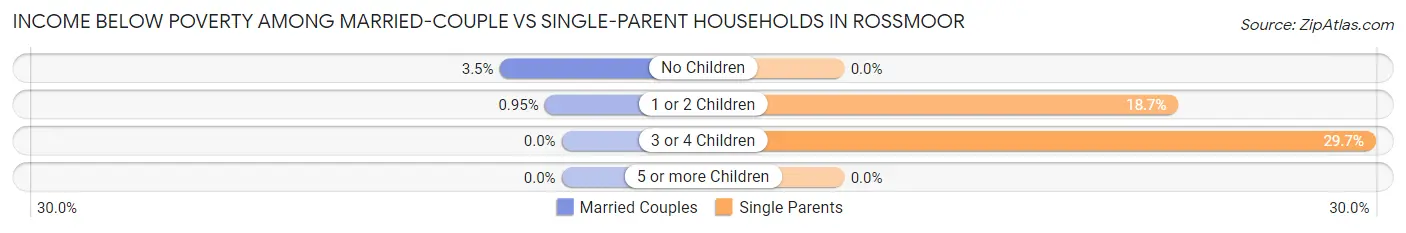
| Children | Married-Couple Families | Single-Parent Households |
| No Children | 51 (3.5%) | 0 (0.0%) |
| 1 or 2 Children | 12 (0.9%) | 23 (18.7%) |
| 3 or 4 Children | 0 (0.0%) | 22 (29.7%) |
| 5 or more Children | 0 (0.0%) | 0 (0.0%) |
| Total | 63 (2.2%) | 45 (10.8%) |
Race in Rossmoor
The most populous races in Rossmoor are White / Caucasian (8,285 | 70.6%), Hispanic or Latino (1,823 | 15.5%), and Asian (1,372 | 11.7%).
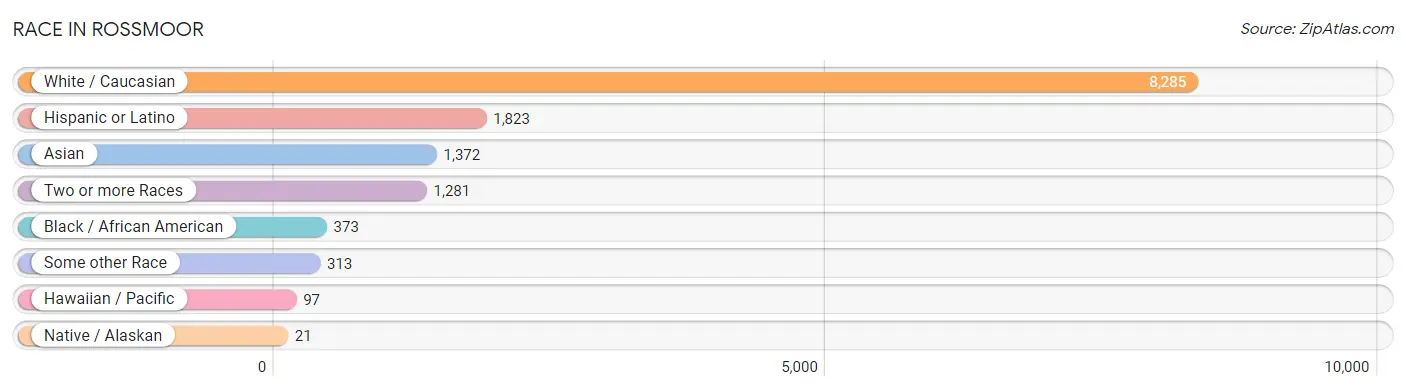
| Race | # Population | % Population |
| Asian | 1,372 | 11.7% |
| Black / African American | 373 | 3.2% |
| Hawaiian / Pacific | 97 | 0.8% |
| Hispanic or Latino | 1,823 | 15.5% |
| Native / Alaskan | 21 | 0.2% |
| White / Caucasian | 8,285 | 70.6% |
| Two or more Races | 1,281 | 10.9% |
| Some other Race | 313 | 2.7% |
| Total | 11,742 | 100.0% |
Ancestry in Rossmoor
The most populous ancestries reported in Rossmoor are English (1,700 | 14.5%), German (1,420 | 12.1%), Irish (1,162 | 9.9%), Mexican (935 | 8.0%), and Italian (572 | 4.9%), together accounting for 49.3% of all Rossmoor residents.
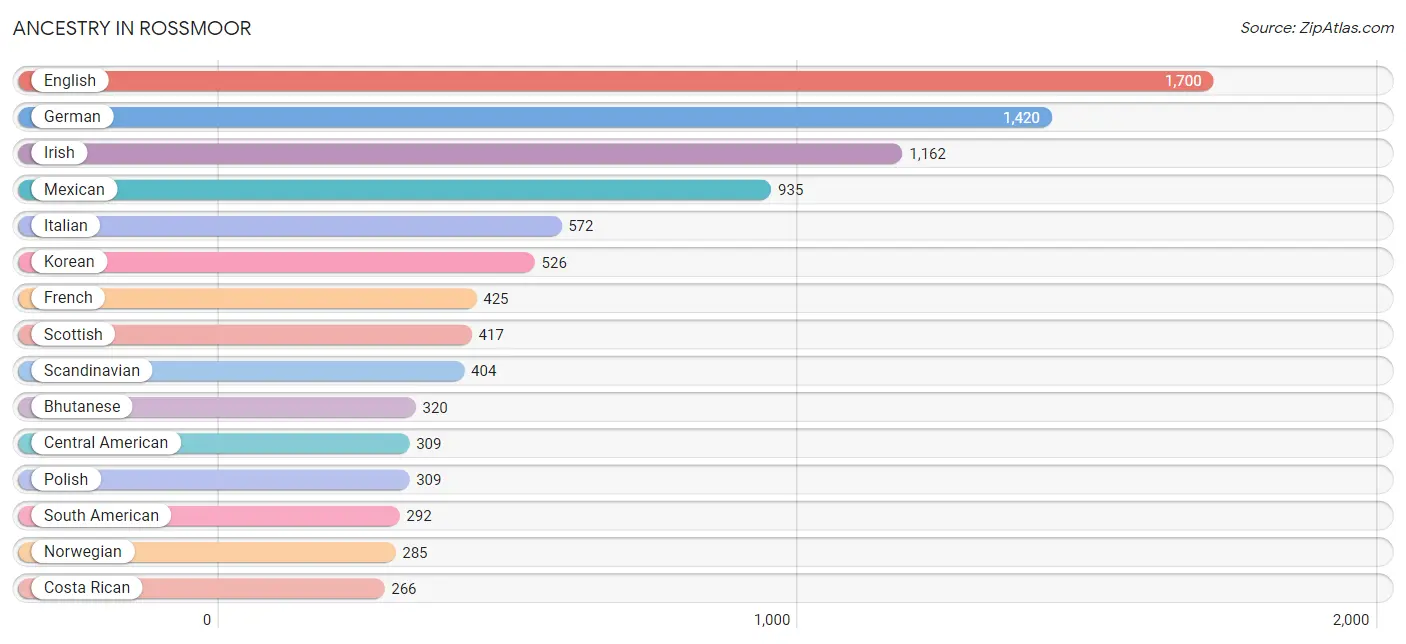
| Ancestry | # Population | % Population |
| American | 248 | 2.1% |
| Arab | 260 | 2.2% |
| Argentinean | 161 | 1.4% |
| Armenian | 155 | 1.3% |
| Austrian | 48 | 0.4% |
| Belgian | 41 | 0.4% |
| Bhutanese | 320 | 2.7% |
| Brazilian | 9 | 0.1% |
| British | 58 | 0.5% |
| Bulgarian | 73 | 0.6% |
| Burmese | 251 | 2.1% |
| Canadian | 11 | 0.1% |
| Central American | 309 | 2.6% |
| Colombian | 131 | 1.1% |
| Costa Rican | 266 | 2.3% |
| Croatian | 45 | 0.4% |
| Cuban | 9 | 0.1% |
| Czech | 94 | 0.8% |
| Danish | 15 | 0.1% |
| Dutch | 100 | 0.9% |
| Eastern European | 90 | 0.8% |
| Egyptian | 244 | 2.1% |
| English | 1,700 | 14.5% |
| Ethiopian | 14 | 0.1% |
| European | 217 | 1.8% |
| Filipino | 27 | 0.2% |
| French | 425 | 3.6% |
| French Canadian | 12 | 0.1% |
| German | 1,420 | 12.1% |
| Greek | 163 | 1.4% |
| Guatemalan | 8 | 0.1% |
| Haitian | 18 | 0.2% |
| Hungarian | 85 | 0.7% |
| Indian (Asian) | 166 | 1.4% |
| Iranian | 36 | 0.3% |
| Irish | 1,162 | 9.9% |
| Israeli | 29 | 0.3% |
| Italian | 572 | 4.9% |
| Korean | 526 | 4.5% |
| Laotian | 24 | 0.2% |
| Lebanese | 16 | 0.1% |
| Lithuanian | 8 | 0.1% |
| Macedonian | 8 | 0.1% |
| Mexican | 935 | 8.0% |
| Mexican American Indian | 57 | 0.5% |
| Native Hawaiian | 182 | 1.5% |
| New Zealander | 18 | 0.2% |
| Nicaraguan | 25 | 0.2% |
| Northern European | 108 | 0.9% |
| Norwegian | 285 | 2.4% |
| Pakistani | 88 | 0.7% |
| Panamanian | 10 | 0.1% |
| Polish | 309 | 2.6% |
| Portuguese | 67 | 0.6% |
| Puerto Rican | 22 | 0.2% |
| Romanian | 17 | 0.1% |
| Russian | 82 | 0.7% |
| Samoan | 43 | 0.4% |
| Scandinavian | 404 | 3.4% |
| Scotch-Irish | 57 | 0.5% |
| Scottish | 417 | 3.5% |
| Serbian | 17 | 0.1% |
| Sioux | 17 | 0.1% |
| Slavic | 9 | 0.1% |
| Slovak | 13 | 0.1% |
| Slovene | 8 | 0.1% |
| South American | 292 | 2.5% |
| Spaniard | 199 | 1.7% |
| Spanish | 37 | 0.3% |
| Sri Lankan | 246 | 2.1% |
| Subsaharan African | 14 | 0.1% |
| Swedish | 214 | 1.8% |
| Swiss | 70 | 0.6% |
| Thai | 147 | 1.3% |
| Tongan | 33 | 0.3% |
| Turkish | 13 | 0.1% |
| Ukrainian | 42 | 0.4% |
| Welsh | 259 | 2.2% |
| Yaqui | 4 | 0.0% |
| Yugoslavian | 8 | 0.1% | View All 80 Rows |
Immigrants in Rossmoor
The most numerous immigrant groups reported in Rossmoor came from Asia (682 | 5.8%), South Eastern Asia (311 | 2.6%), Europe (276 | 2.4%), Latin America (247 | 2.1%), and Eastern Asia (189 | 1.6%), together accounting for 14.5% of all Rossmoor residents.
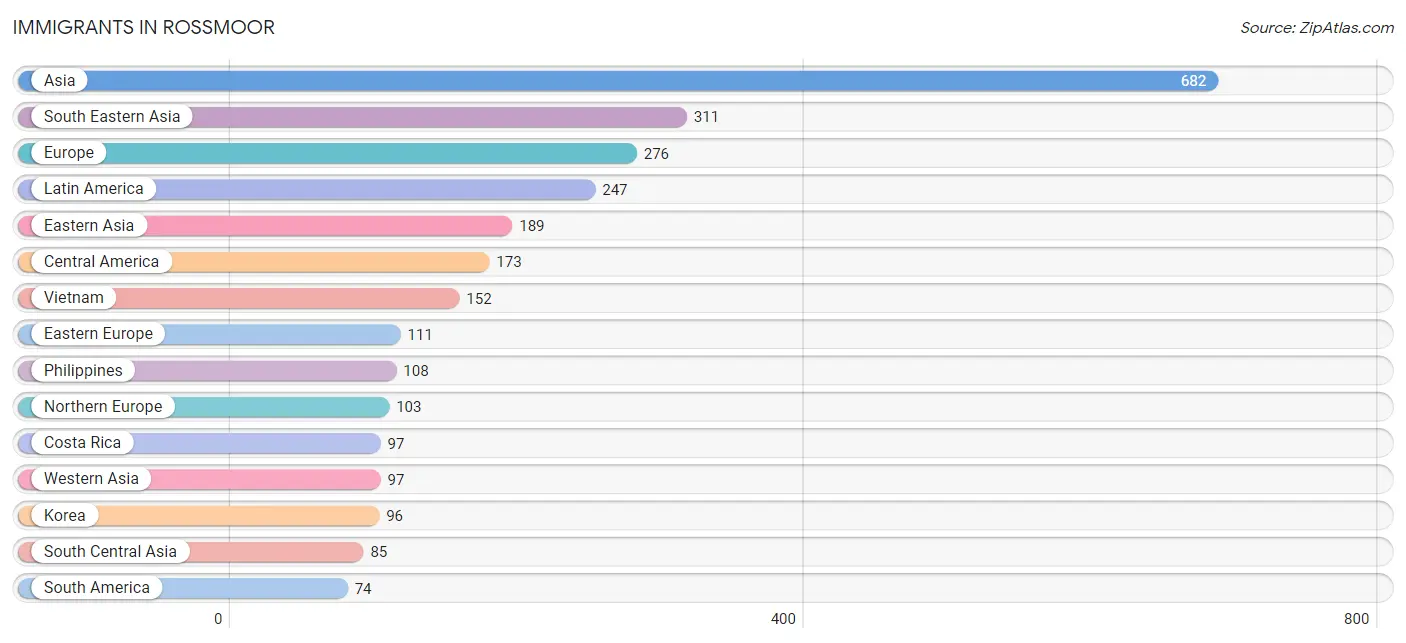
| Immigration Origin | # Population | % Population |
| Africa | 36 | 0.3% |
| Argentina | 5 | 0.0% |
| Asia | 682 | 5.8% |
| Australia | 25 | 0.2% |
| Belgium | 10 | 0.1% |
| Bulgaria | 40 | 0.3% |
| Cambodia | 20 | 0.2% |
| Central America | 173 | 1.5% |
| China | 52 | 0.4% |
| Colombia | 69 | 0.6% |
| Costa Rica | 97 | 0.8% |
| Croatia | 16 | 0.1% |
| Czechoslovakia | 11 | 0.1% |
| Eastern Africa | 14 | 0.1% |
| Eastern Asia | 189 | 1.6% |
| Eastern Europe | 111 | 0.9% |
| Egypt | 14 | 0.1% |
| England | 53 | 0.4% |
| Europe | 276 | 2.4% |
| Germany | 15 | 0.1% |
| Greece | 5 | 0.0% |
| Hong Kong | 10 | 0.1% |
| India | 36 | 0.3% |
| Indonesia | 12 | 0.1% |
| Iran | 18 | 0.2% |
| Ireland | 29 | 0.3% |
| Israel | 24 | 0.2% |
| Italy | 18 | 0.2% |
| Japan | 41 | 0.4% |
| Kenya | 14 | 0.1% |
| Korea | 96 | 0.8% |
| Latin America | 247 | 2.1% |
| Lebanon | 5 | 0.0% |
| Mexico | 59 | 0.5% |
| Morocco | 8 | 0.1% |
| Netherlands | 10 | 0.1% |
| Nicaragua | 17 | 0.1% |
| Northern Africa | 22 | 0.2% |
| Northern Europe | 103 | 0.9% |
| Oceania | 25 | 0.2% |
| Philippines | 108 | 0.9% |
| Romania | 13 | 0.1% |
| Russia | 10 | 0.1% |
| South America | 74 | 0.6% |
| South Central Asia | 85 | 0.7% |
| South Eastern Asia | 311 | 2.6% |
| Southern Europe | 23 | 0.2% |
| Sri Lanka | 21 | 0.2% |
| Switzerland | 4 | 0.0% |
| Thailand | 19 | 0.2% |
| Turkey | 68 | 0.6% |
| Uzbekistan | 10 | 0.1% |
| Vietnam | 152 | 1.3% |
| Western Asia | 97 | 0.8% |
| Western Europe | 39 | 0.3% | View All 55 Rows |
Sex and Age in Rossmoor
Sex and Age in Rossmoor
The most populous age groups in Rossmoor are 10 to 14 Years (700 | 11.9%) for men and 45 to 49 Years (652 | 11.1%) for women.
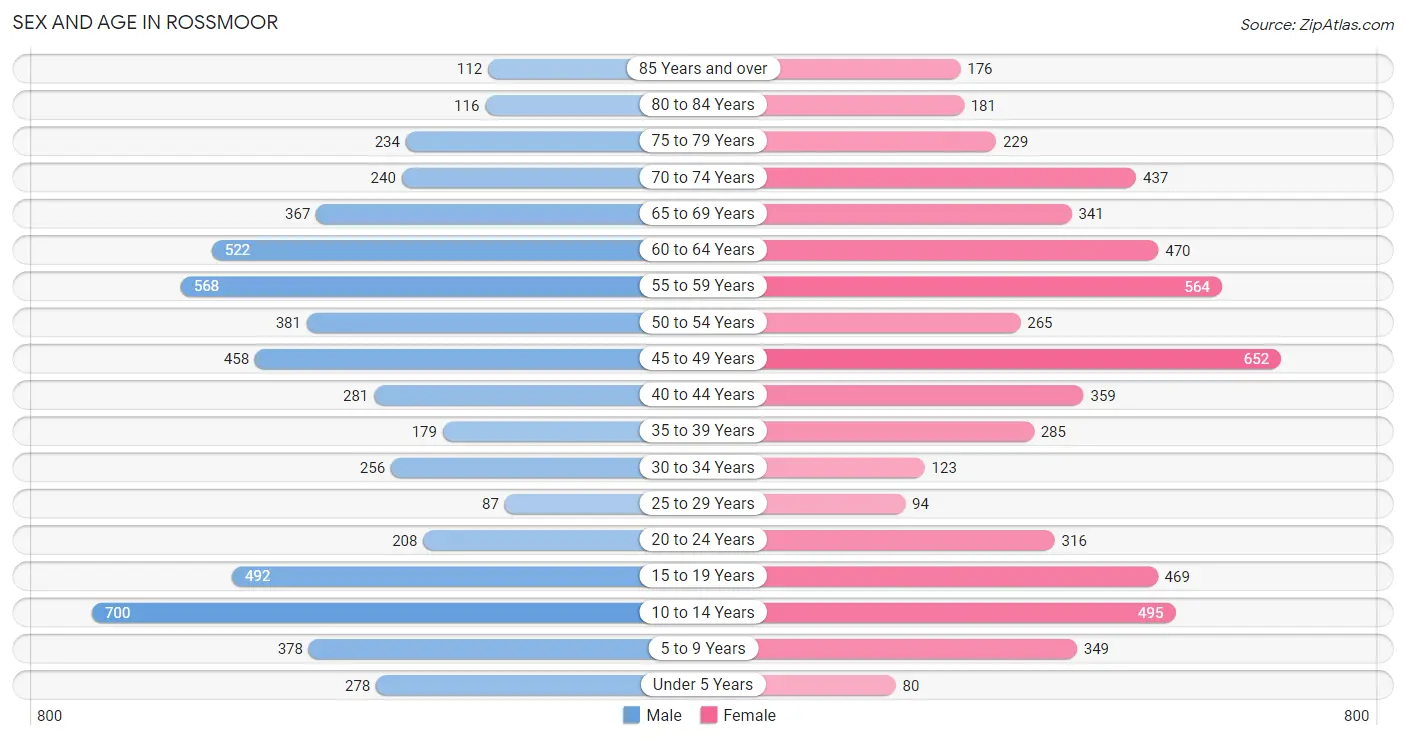
| Age Bracket | Male | Female |
| Under 5 Years | 278 (4.8%) | 80 (1.4%) |
| 5 to 9 Years | 378 (6.5%) | 349 (5.9%) |
| 10 to 14 Years | 700 (11.9%) | 495 (8.4%) |
| 15 to 19 Years | 492 (8.4%) | 469 (8.0%) |
| 20 to 24 Years | 208 (3.5%) | 316 (5.4%) |
| 25 to 29 Years | 87 (1.5%) | 94 (1.6%) |
| 30 to 34 Years | 256 (4.4%) | 123 (2.1%) |
| 35 to 39 Years | 179 (3.1%) | 285 (4.8%) |
| 40 to 44 Years | 281 (4.8%) | 359 (6.1%) |
| 45 to 49 Years | 458 (7.8%) | 652 (11.1%) |
| 50 to 54 Years | 381 (6.5%) | 265 (4.5%) |
| 55 to 59 Years | 568 (9.7%) | 564 (9.6%) |
| 60 to 64 Years | 522 (8.9%) | 470 (8.0%) |
| 65 to 69 Years | 367 (6.3%) | 341 (5.8%) |
| 70 to 74 Years | 240 (4.1%) | 437 (7.4%) |
| 75 to 79 Years | 234 (4.0%) | 229 (3.9%) |
| 80 to 84 Years | 116 (2.0%) | 181 (3.1%) |
| 85 Years and over | 112 (1.9%) | 176 (3.0%) |
| Total | 5,857 (100.0%) | 5,885 (100.0%) |
Families and Households in Rossmoor
Median Family Size in Rossmoor
The median family size in Rossmoor is 3.25 persons per family, with single male/father families (135 | 4.1%) accounting for the largest median family size of 3.47 persons per family. On the other hand, single female/mother families (281 | 8.5%) represent the smallest median family size with 3.05 persons per family.
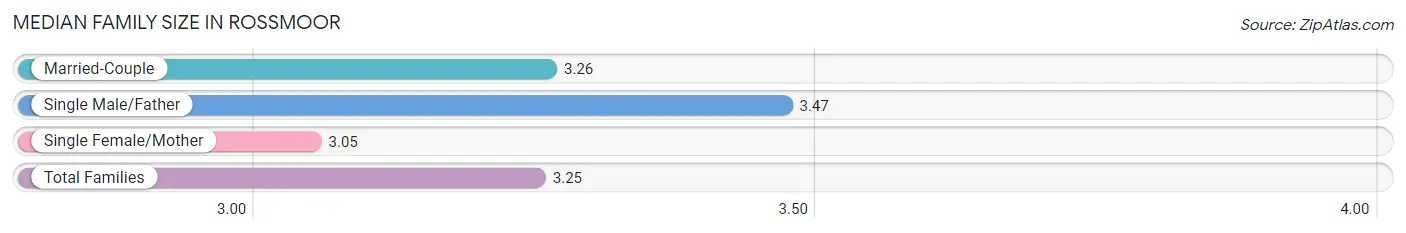
| Family Type | # Families | Family Size |
| Married-Couple | 2,901 (87.5%) | 3.26 |
| Single Male/Father | 135 (4.1%) | 3.47 |
| Single Female/Mother | 281 (8.5%) | 3.05 |
| Total Families | 3,317 (100.0%) | 3.25 |
Median Household Size in Rossmoor
The median household size in Rossmoor is 2.96 persons per household, with single male/father households (135 | 3.4%) accounting for the largest median household size of 3.71 persons per household. non-family households (650 | 16.4%) represent the smallest median household size with 1.26 persons per household.
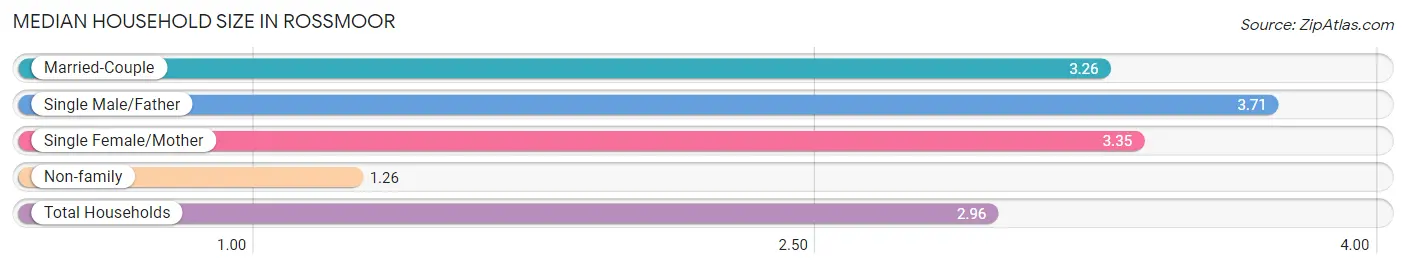
| Household Type | # Households | Household Size |
| Married-Couple | 2,901 (73.1%) | 3.26 |
| Single Male/Father | 135 (3.4%) | 3.71 |
| Single Female/Mother | 281 (7.1%) | 3.35 |
| Non-family | 650 (16.4%) | 1.26 |
| Total Households | 3,967 (100.0%) | 2.96 |
Household Size by Marriage Status in Rossmoor
Out of a total of 3,967 households in Rossmoor, 3,317 (83.6%) are family households, while 650 (16.4%) are nonfamily households. The most numerous type of family households are 2-person households, comprising 1,376, and the most common type of nonfamily households are 1-person households, comprising 510.
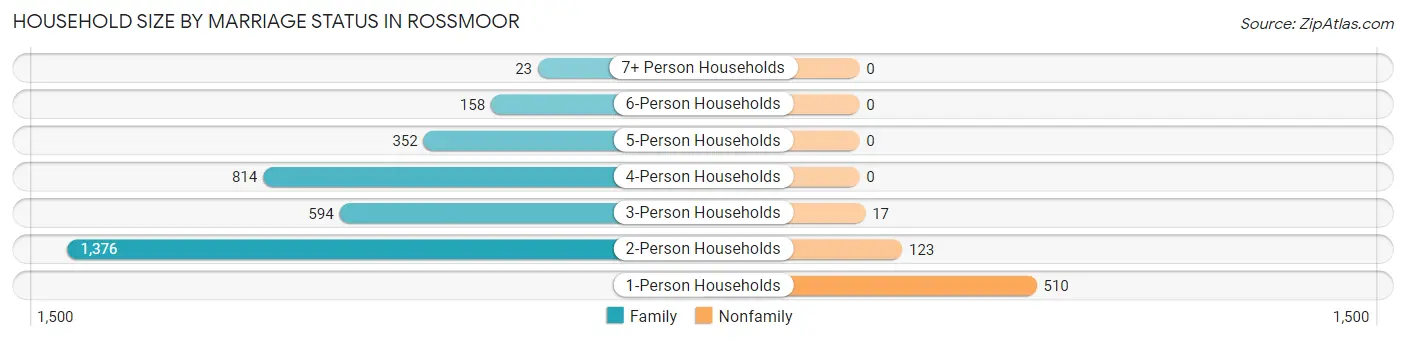
| Household Size | Family Households | Nonfamily Households |
| 1-Person Households | - | 510 (12.9%) |
| 2-Person Households | 1,376 (34.7%) | 123 (3.1%) |
| 3-Person Households | 594 (15.0%) | 17 (0.4%) |
| 4-Person Households | 814 (20.5%) | 0 (0.0%) |
| 5-Person Households | 352 (8.9%) | 0 (0.0%) |
| 6-Person Households | 158 (4.0%) | 0 (0.0%) |
| 7+ Person Households | 23 (0.6%) | 0 (0.0%) |
| Total | 3,317 (83.6%) | 650 (16.4%) |
Female Fertility in Rossmoor
Fertility by Age in Rossmoor
Average fertility rate in Rossmoor is 81.0 births per 1,000 women. Women in the age bracket of 35 to 50 years have the highest fertility rate with 110.0 births per 1,000 women. Women in the age bracket of 35 to 50 years acount for 76.7% of all women with births.
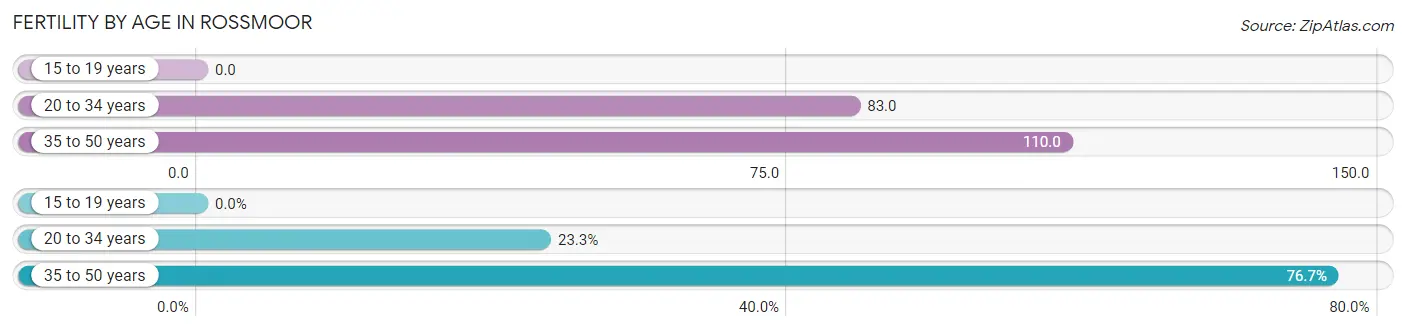
| Age Bracket | Women with Births | Births / 1,000 Women |
| 15 to 19 years | 0 (0.0%) | 0.0 |
| 20 to 34 years | 44 (23.3%) | 83.0 |
| 35 to 50 years | 145 (76.7%) | 110.0 |
| Total | 189 (100.0%) | 81.0 |
Fertility by Age by Marriage Status in Rossmoor
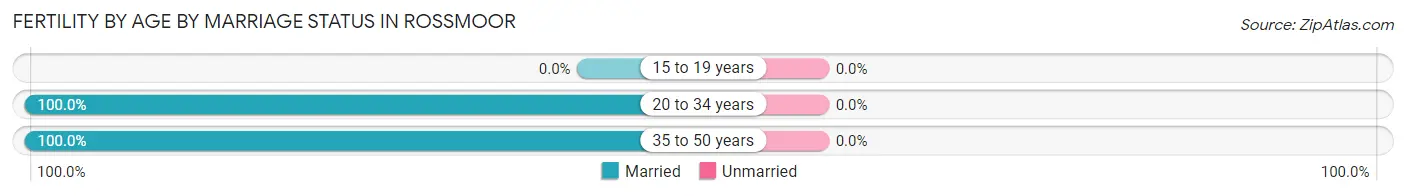
| Age Bracket | Married | Unmarried |
| 15 to 19 years | 0 (0.0%) | 0 (0.0%) |
| 20 to 34 years | 44 (100.0%) | 0 (0.0%) |
| 35 to 50 years | 145 (100.0%) | 0 (0.0%) |
| Total | 189 (100.0%) | 0 (0.0%) |
Fertility by Education in Rossmoor
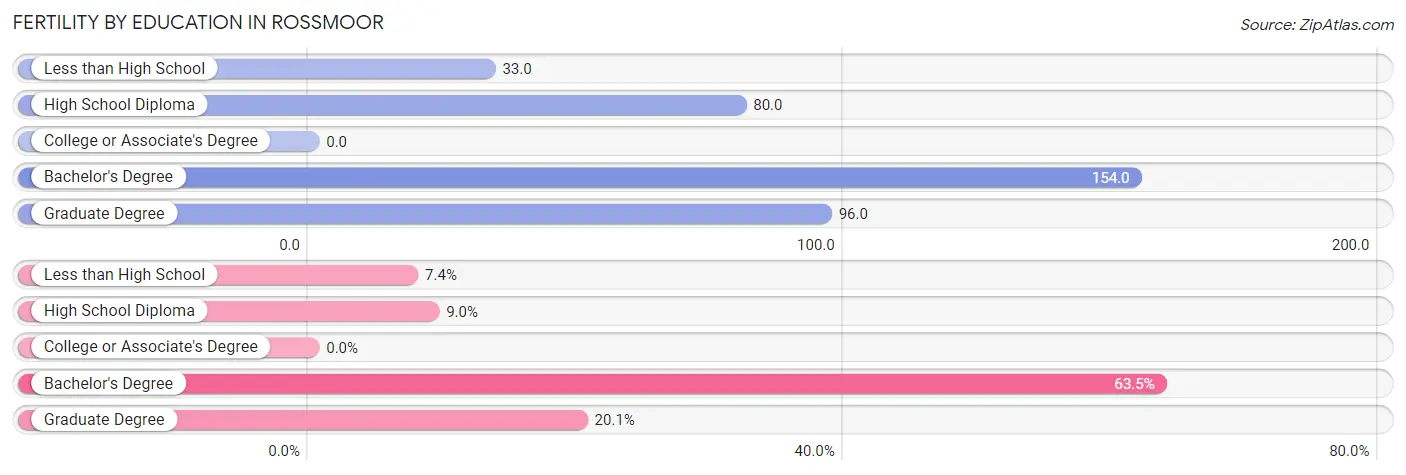
| Educational Attainment | Women with Births | Births / 1,000 Women |
| Less than High School | 14 (7.4%) | 33.0 |
| High School Diploma | 17 (9.0%) | 80.0 |
| College or Associate's Degree | 0 (0.0%) | 0.0 |
| Bachelor's Degree | 120 (63.5%) | 154.0 |
| Graduate Degree | 38 (20.1%) | 96.0 |
| Total | 189 (100.0%) | 81.0 |
Fertility by Education by Marriage Status in Rossmoor
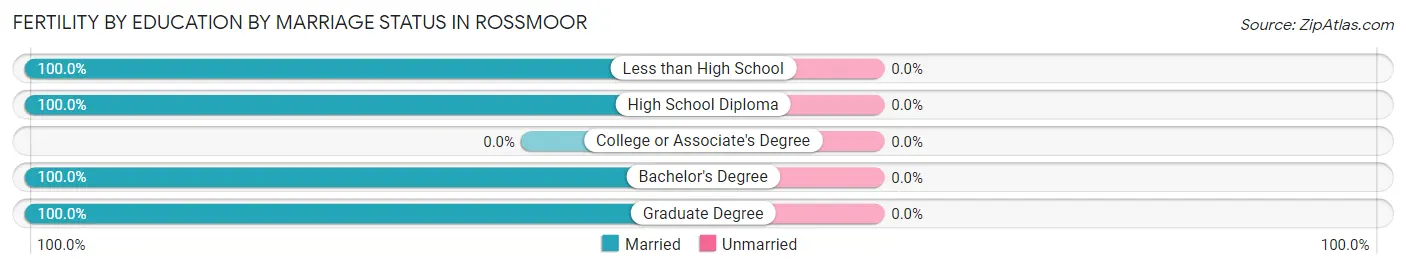
| Educational Attainment | Married | Unmarried |
| Less than High School | 14 (100.0%) | 0 (0.0%) |
| High School Diploma | 17 (100.0%) | 0 (0.0%) |
| College or Associate's Degree | 0 (0.0%) | 0 (0.0%) |
| Bachelor's Degree | 120 (100.0%) | 0 (0.0%) |
| Graduate Degree | 38 (100.0%) | 0 (0.0%) |
| Total | 189 (100.0%) | 0 (0.0%) |
Employment Characteristics in Rossmoor
Employment by Class of Employer in Rossmoor
Among the 5,245 employed individuals in Rossmoor, private company employees (3,002 | 57.2%), self-employed (not incorporated) (579 | 11.0%), and self-employed (incorporated) (449 | 8.6%) make up the most common classes of employment.
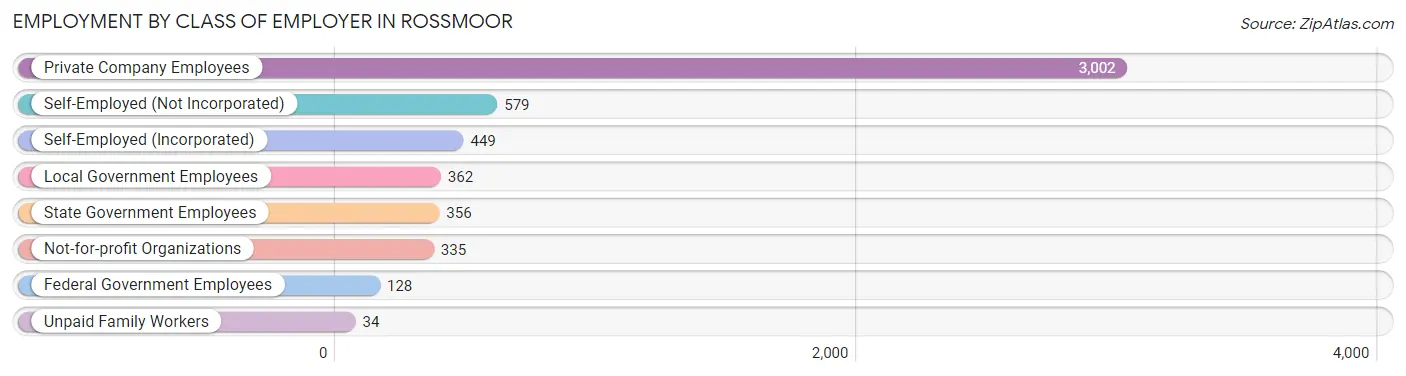
| Employer Class | # Employees | % Employees |
| Private Company Employees | 3,002 | 57.2% |
| Self-Employed (Incorporated) | 449 | 8.6% |
| Self-Employed (Not Incorporated) | 579 | 11.0% |
| Not-for-profit Organizations | 335 | 6.4% |
| Local Government Employees | 362 | 6.9% |
| State Government Employees | 356 | 6.8% |
| Federal Government Employees | 128 | 2.4% |
| Unpaid Family Workers | 34 | 0.6% |
| Total | 5,245 | 100.0% |
Employment Status by Age in Rossmoor
According to the labor force statistics for Rossmoor, out of the total population over 16 years of age (9,218), 60.4% or 5,568 individuals are in the labor force, with 4.6% or 256 of them unemployed. The age group with the highest labor force participation rate is 25 to 29 years, with 86.7% or 157 individuals in the labor force. Within the labor force, the 16 to 19 years age range has the highest percentage of unemployed individuals, with 21.5% or 58 of them being unemployed.
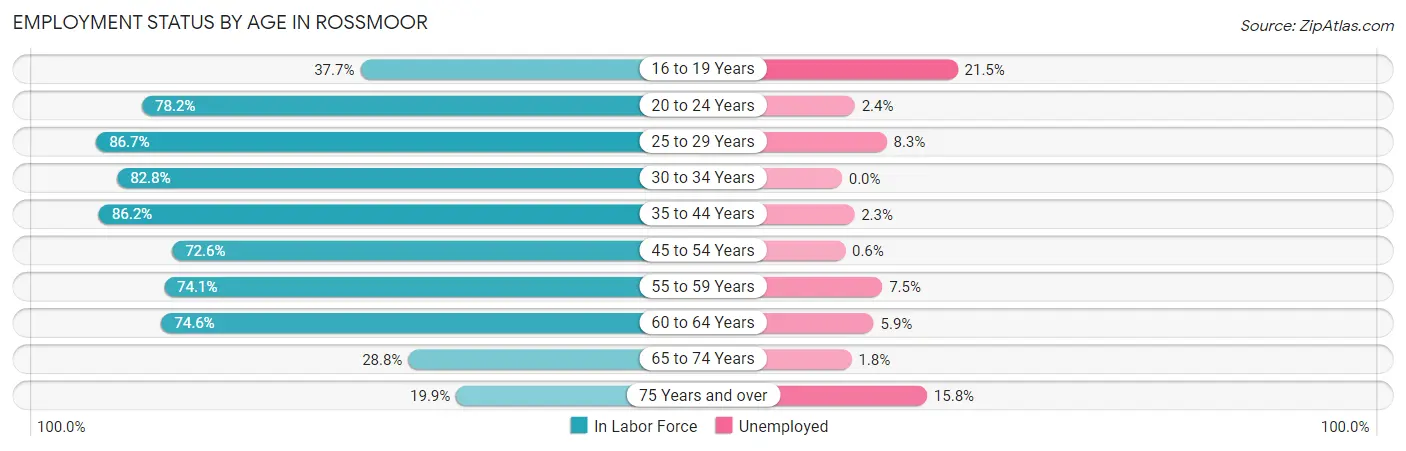
| Age Bracket | In Labor Force | Unemployed |
| 16 to 19 Years | 270 (37.7%) | 58 (21.5%) |
| 20 to 24 Years | 410 (78.2%) | 10 (2.4%) |
| 25 to 29 Years | 157 (86.7%) | 13 (8.3%) |
| 30 to 34 Years | 314 (82.8%) | 0 (0.0%) |
| 35 to 44 Years | 952 (86.2%) | 22 (2.3%) |
| 45 to 54 Years | 1,275 (72.6%) | 8 (0.6%) |
| 55 to 59 Years | 839 (74.1%) | 63 (7.5%) |
| 60 to 64 Years | 740 (74.6%) | 44 (5.9%) |
| 65 to 74 Years | 399 (28.8%) | 7 (1.8%) |
| 75 Years and over | 209 (19.9%) | 33 (15.8%) |
| Total | 5,568 (60.4%) | 256 (4.6%) |
Employment Status by Educational Attainment in Rossmoor
According to labor force statistics for Rossmoor, 77.1% of individuals (4,274) out of the total population between 25 and 64 years of age (5,544) are in the labor force, with 3.5% or 150 of them being unemployed. The group with the highest labor force participation rate are those with the educational attainment of college / associate degree, with 83.3% or 1,050 individuals in the labor force. Within the labor force, individuals with less than high school education have the highest percentage of unemployment, with 8.4% or 7 of them being unemployed.
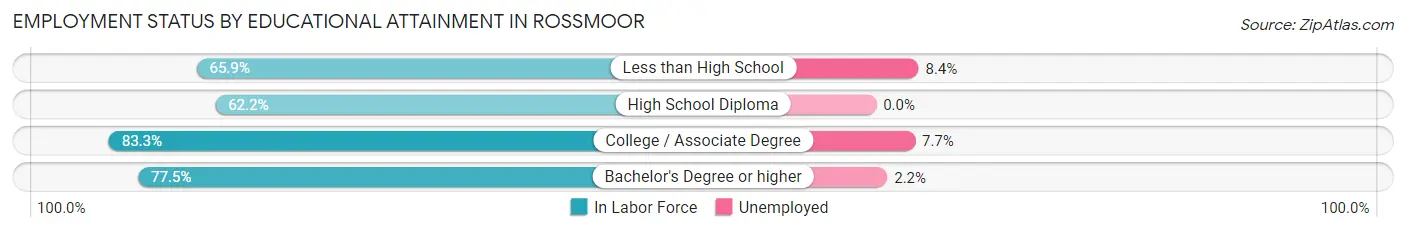
| Educational Attainment | In Labor Force | Unemployed |
| Less than High School | 83 (65.9%) | 11 (8.4%) |
| High School Diploma | 318 (62.2%) | 0 (0.0%) |
| College / Associate Degree | 1,050 (83.3%) | 97 (7.7%) |
| Bachelor's Degree or higher | 2,826 (77.5%) | 80 (2.2%) |
| Total | 4,274 (77.1%) | 194 (3.5%) |
Employment Occupations by Sex in Rossmoor
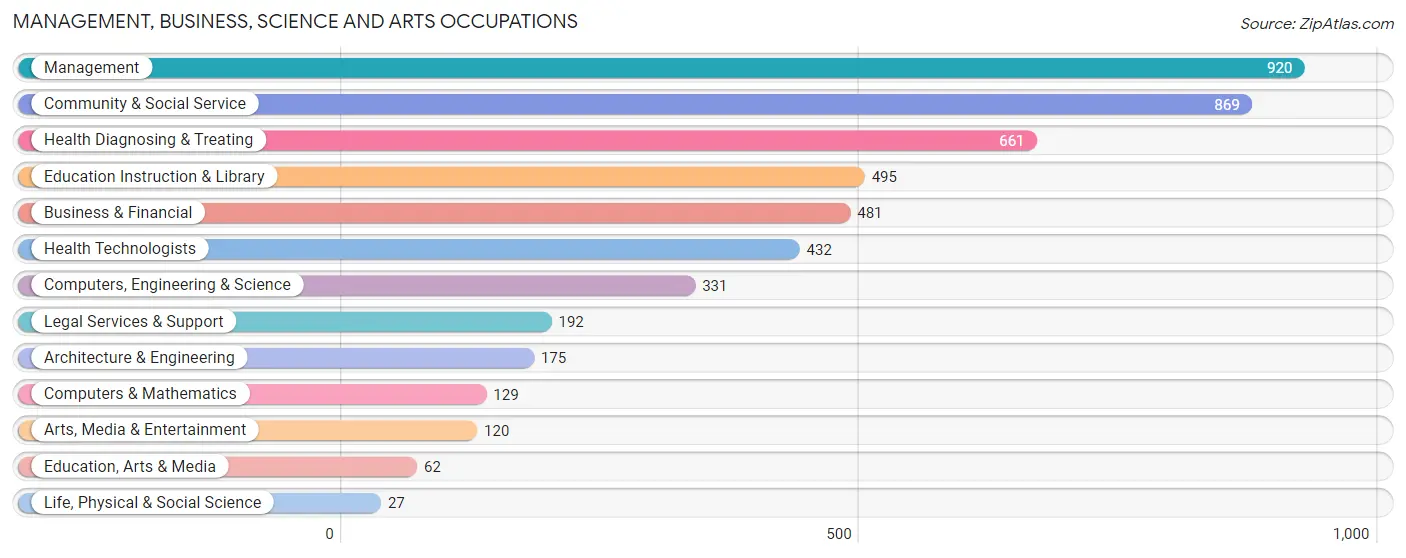
Management, Business, Science and Arts Occupations
The most common Management, Business, Science and Arts occupations in Rossmoor are Management (920 | 17.4%), Community & Social Service (869 | 16.4%), Health Diagnosing & Treating (661 | 12.5%), Education Instruction & Library (495 | 9.3%), and Business & Financial (481 | 9.1%).
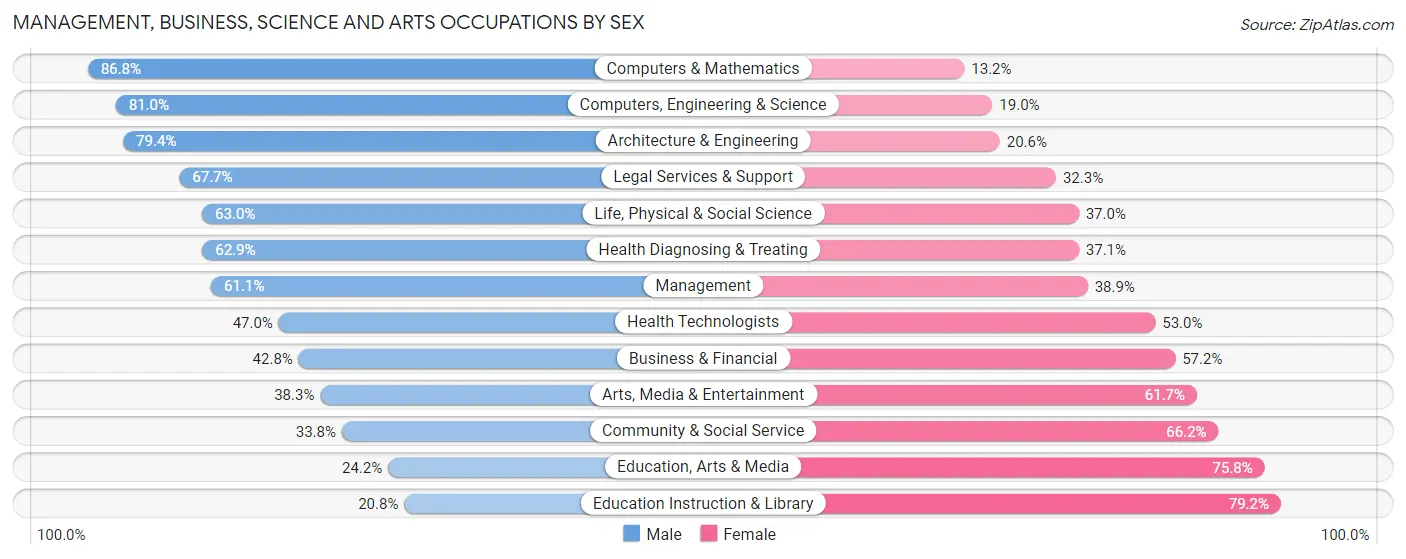
Management, Business, Science and Arts Occupations by Sex
Within the Management, Business, Science and Arts occupations in Rossmoor, the most male-oriented occupations are Computers & Mathematics (86.8%), Computers, Engineering & Science (81.0%), and Architecture & Engineering (79.4%), while the most female-oriented occupations are Education Instruction & Library (79.2%), Education, Arts & Media (75.8%), and Community & Social Service (66.2%).
| Occupation | Male | Female |
| Management | 562 (61.1%) | 358 (38.9%) |
| Business & Financial | 206 (42.8%) | 275 (57.2%) |
| Computers, Engineering & Science | 268 (81.0%) | 63 (19.0%) |
| Computers & Mathematics | 112 (86.8%) | 17 (13.2%) |
| Architecture & Engineering | 139 (79.4%) | 36 (20.6%) |
| Life, Physical & Social Science | 17 (63.0%) | 10 (37.0%) |
| Community & Social Service | 294 (33.8%) | 575 (66.2%) |
| Education, Arts & Media | 15 (24.2%) | 47 (75.8%) |
| Legal Services & Support | 130 (67.7%) | 62 (32.3%) |
| Education Instruction & Library | 103 (20.8%) | 392 (79.2%) |
| Arts, Media & Entertainment | 46 (38.3%) | 74 (61.7%) |
| Health Diagnosing & Treating | 416 (62.9%) | 245 (37.1%) |
| Health Technologists | 203 (47.0%) | 229 (53.0%) |
| Total (Category) | 1,746 (53.5%) | 1,516 (46.5%) |
| Total (Overall) | 2,818 (53.2%) | 2,480 (46.8%) |
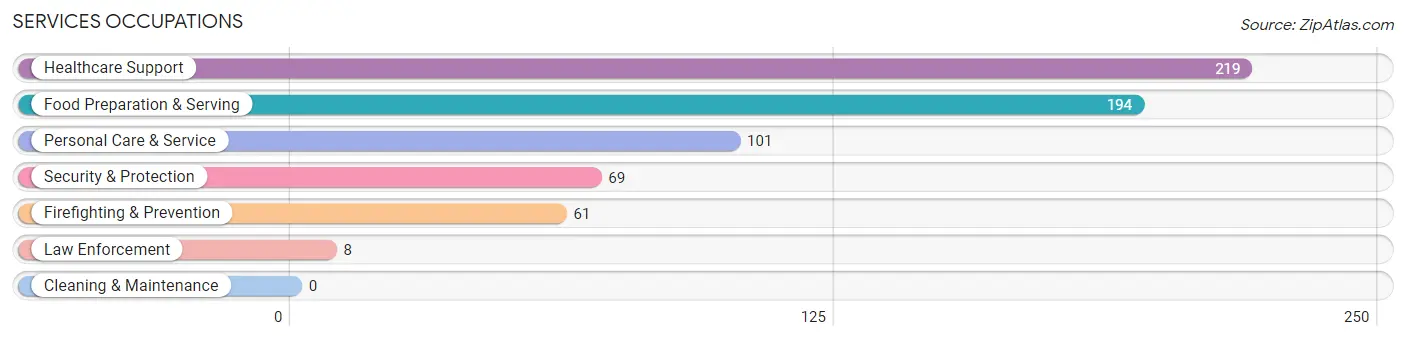
Services Occupations
The most common Services occupations in Rossmoor are Healthcare Support (219 | 4.1%), Food Preparation & Serving (194 | 3.7%), Personal Care & Service (101 | 1.9%), Security & Protection (69 | 1.3%), and Firefighting & Prevention (61 | 1.1%).
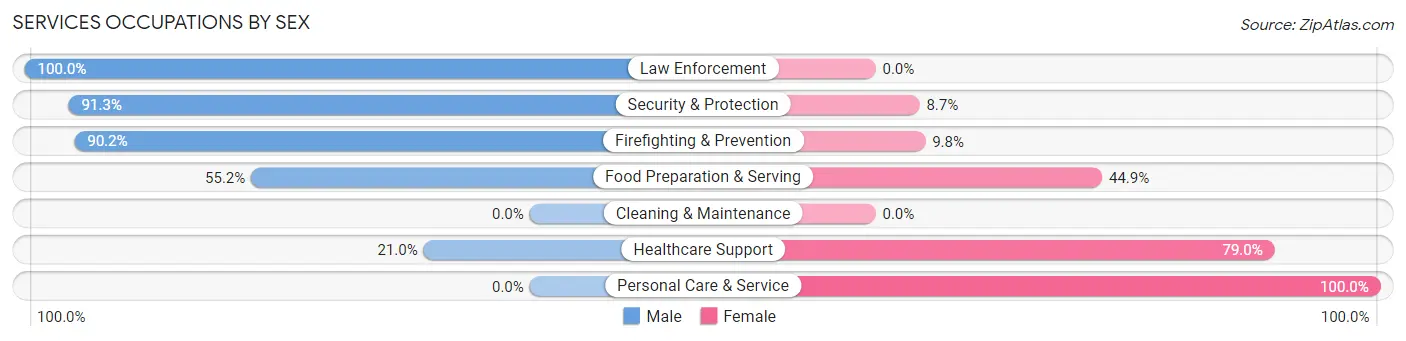
Services Occupations by Sex
Within the Services occupations in Rossmoor, the most male-oriented occupations are Law Enforcement (100.0%), Security & Protection (91.3%), and Firefighting & Prevention (90.2%), while the most female-oriented occupations are Personal Care & Service (100.0%), Healthcare Support (79.0%), and Food Preparation & Serving (44.9%).
| Occupation | Male | Female |
| Healthcare Support | 46 (21.0%) | 173 (79.0%) |
| Security & Protection | 63 (91.3%) | 6 (8.7%) |
| Firefighting & Prevention | 55 (90.2%) | 6 (9.8%) |
| Law Enforcement | 8 (100.0%) | 0 (0.0%) |
| Food Preparation & Serving | 107 (55.1%) | 87 (44.9%) |
| Cleaning & Maintenance | 0 (0.0%) | 0 (0.0%) |
| Personal Care & Service | 0 (0.0%) | 101 (100.0%) |
| Total (Category) | 216 (37.0%) | 367 (62.9%) |
| Total (Overall) | 2,818 (53.2%) | 2,480 (46.8%) |
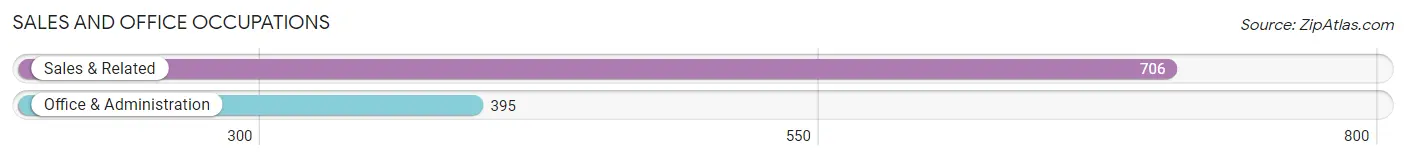
Sales and Office Occupations
The most common Sales and Office occupations in Rossmoor are Sales & Related (706 | 13.3%), and Office & Administration (395 | 7.5%).
Sales and Office Occupations by Sex
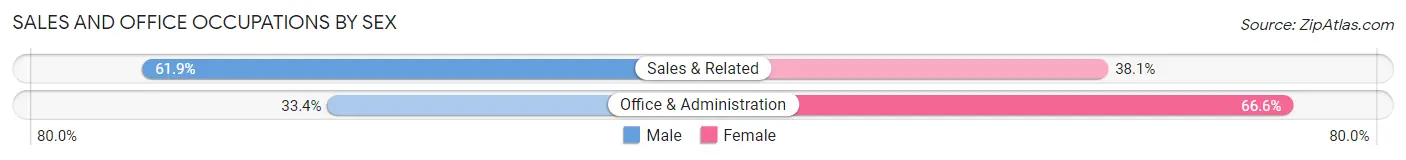
| Occupation | Male | Female |
| Sales & Related | 437 (61.9%) | 269 (38.1%) |
| Office & Administration | 132 (33.4%) | 263 (66.6%) |
| Total (Category) | 569 (51.7%) | 532 (48.3%) |
| Total (Overall) | 2,818 (53.2%) | 2,480 (46.8%) |
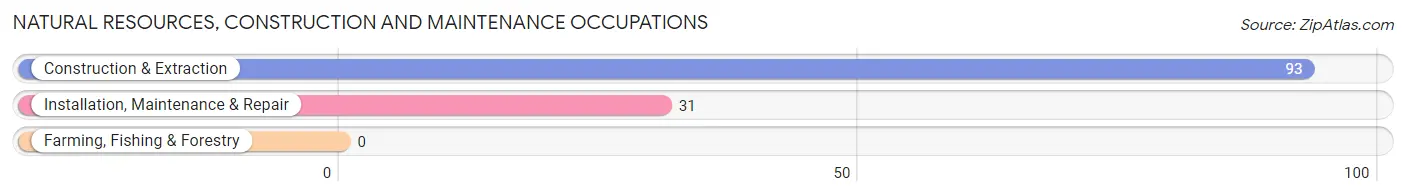
Natural Resources, Construction and Maintenance Occupations
The most common Natural Resources, Construction and Maintenance occupations in Rossmoor are Construction & Extraction (93 | 1.8%), and Installation, Maintenance & Repair (31 | 0.6%).
Natural Resources, Construction and Maintenance Occupations by Sex
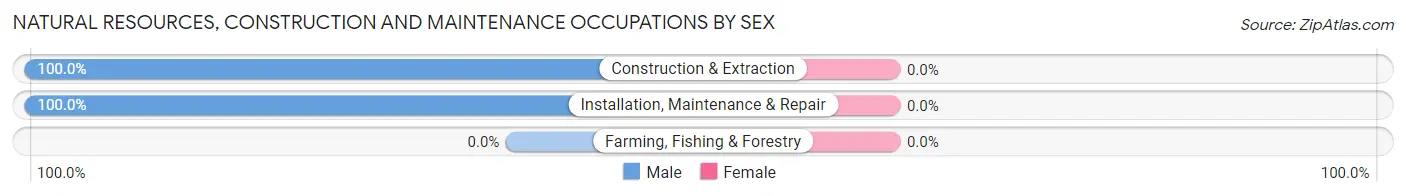
| Occupation | Male | Female |
| Farming, Fishing & Forestry | 0 (0.0%) | 0 (0.0%) |
| Construction & Extraction | 93 (100.0%) | 0 (0.0%) |
| Installation, Maintenance & Repair | 31 (100.0%) | 0 (0.0%) |
| Total (Category) | 124 (100.0%) | 0 (0.0%) |
| Total (Overall) | 2,818 (53.2%) | 2,480 (46.8%) |
Production, Transportation and Moving Occupations
The most common Production, Transportation and Moving occupations in Rossmoor are Production (89 | 1.7%), Material Moving (72 | 1.4%), and Transportation (67 | 1.3%).
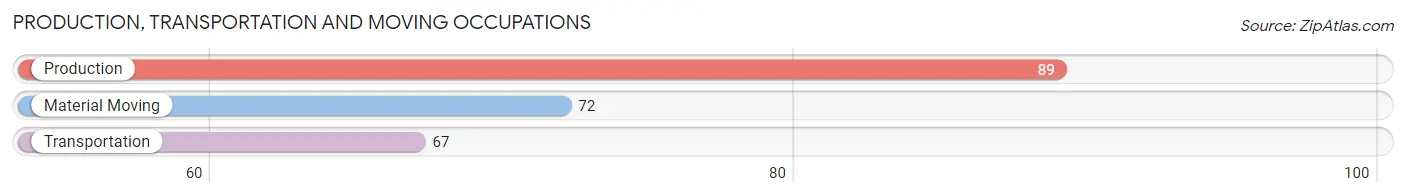
Production, Transportation and Moving Occupations by Sex
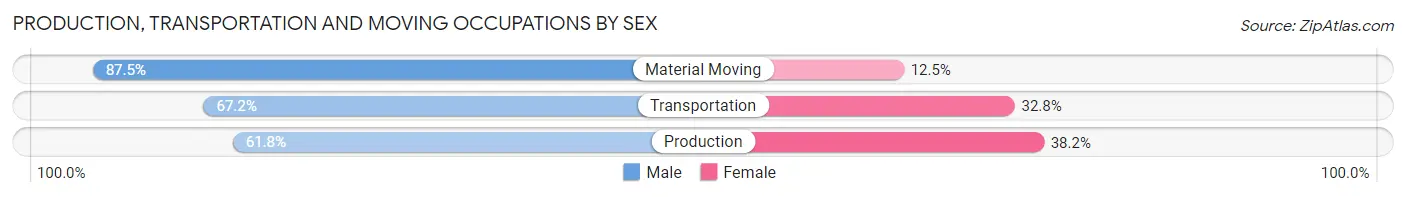
| Occupation | Male | Female |
| Production | 55 (61.8%) | 34 (38.2%) |
| Transportation | 45 (67.2%) | 22 (32.8%) |
| Material Moving | 63 (87.5%) | 9 (12.5%) |
| Total (Category) | 163 (71.5%) | 65 (28.5%) |
| Total (Overall) | 2,818 (53.2%) | 2,480 (46.8%) |
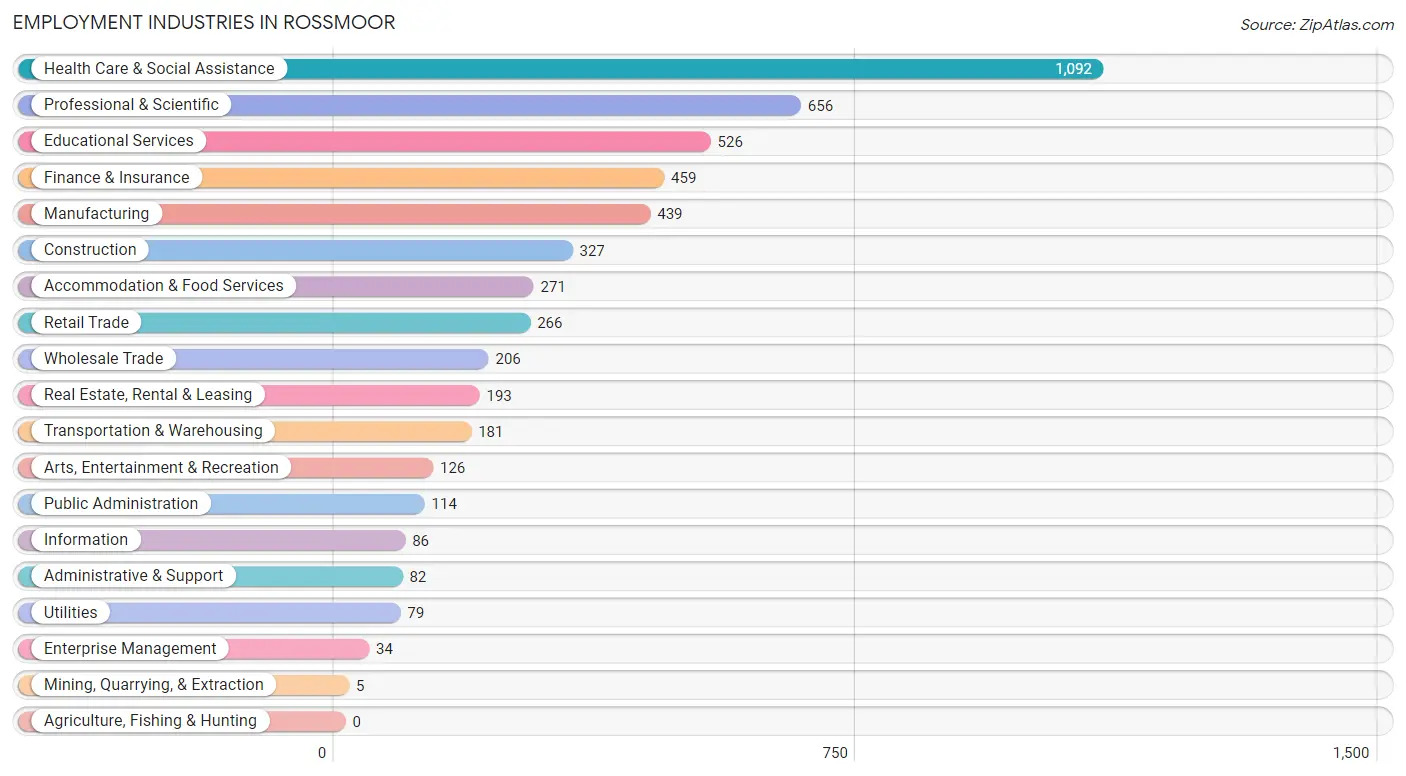
Employment Industries by Sex in Rossmoor
Employment Industries in Rossmoor
The major employment industries in Rossmoor include Health Care & Social Assistance (1,092 | 20.6%), Professional & Scientific (656 | 12.4%), Educational Services (526 | 9.9%), Finance & Insurance (459 | 8.7%), and Manufacturing (439 | 8.3%).
Employment Industries by Sex in Rossmoor
The Rossmoor industries that see more men than women are Mining, Quarrying, & Extraction (100.0%), Utilities (100.0%), and Information (80.2%), whereas the industries that tend to have a higher number of women are Educational Services (80.0%), Administrative & Support (59.8%), and Enterprise Management (58.8%).
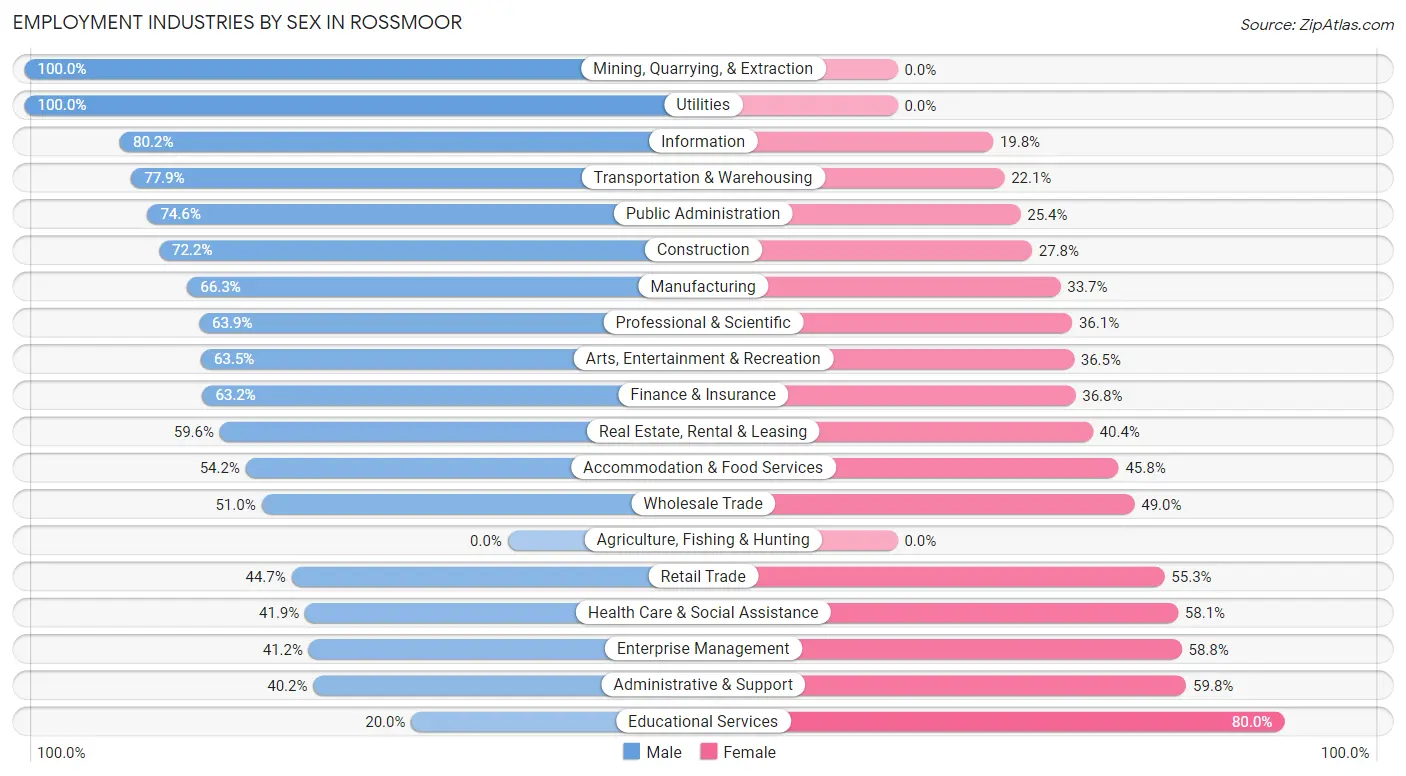
| Industry | Male | Female |
| Agriculture, Fishing & Hunting | 0 (0.0%) | 0 (0.0%) |
| Mining, Quarrying, & Extraction | 5 (100.0%) | 0 (0.0%) |
| Construction | 236 (72.2%) | 91 (27.8%) |
| Manufacturing | 291 (66.3%) | 148 (33.7%) |
| Wholesale Trade | 105 (51.0%) | 101 (49.0%) |
| Retail Trade | 119 (44.7%) | 147 (55.3%) |
| Transportation & Warehousing | 141 (77.9%) | 40 (22.1%) |
| Utilities | 79 (100.0%) | 0 (0.0%) |
| Information | 69 (80.2%) | 17 (19.8%) |
| Finance & Insurance | 290 (63.2%) | 169 (36.8%) |
| Real Estate, Rental & Leasing | 115 (59.6%) | 78 (40.4%) |
| Professional & Scientific | 419 (63.9%) | 237 (36.1%) |
| Enterprise Management | 14 (41.2%) | 20 (58.8%) |
| Administrative & Support | 33 (40.2%) | 49 (59.8%) |
| Educational Services | 105 (20.0%) | 421 (80.0%) |
| Health Care & Social Assistance | 458 (41.9%) | 634 (58.1%) |
| Arts, Entertainment & Recreation | 80 (63.5%) | 46 (36.5%) |
| Accommodation & Food Services | 147 (54.2%) | 124 (45.8%) |
| Public Administration | 85 (74.6%) | 29 (25.4%) |
| Total | 2,818 (53.2%) | 2,480 (46.8%) |
Education in Rossmoor
School Enrollment in Rossmoor
The most common levels of schooling among the 3,668 students in Rossmoor are middle school (943 | 25.7%), high school (911 | 24.8%), and elementary school (680 | 18.5%).
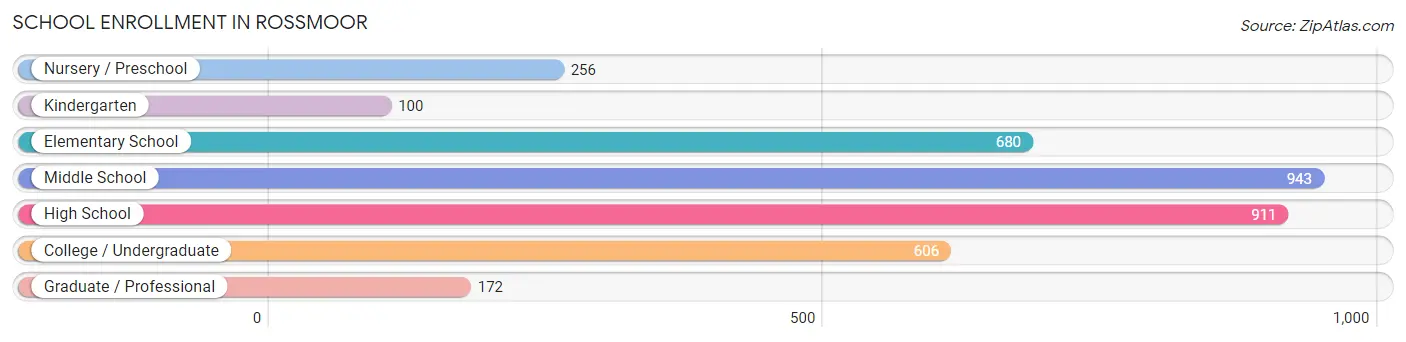
| School Level | # Students | % Students |
| Nursery / Preschool | 256 | 7.0% |
| Kindergarten | 100 | 2.7% |
| Elementary School | 680 | 18.5% |
| Middle School | 943 | 25.7% |
| High School | 911 | 24.8% |
| College / Undergraduate | 606 | 16.5% |
| Graduate / Professional | 172 | 4.7% |
| Total | 3,668 | 100.0% |
School Enrollment by Age by Funding Source in Rossmoor
Out of a total of 3,668 students who are enrolled in schools in Rossmoor, 572 (15.6%) attend a private institution, while the remaining 3,096 (84.4%) are enrolled in public schools. The age group of 35 years and over has the highest likelihood of being enrolled in private schools, with 65 (40.1% in the age bracket) enrolled. Conversely, the age group of 15 to 17 year olds has the lowest likelihood of being enrolled in a private school, with 670 (100.0% in the age bracket) attending a public institution.
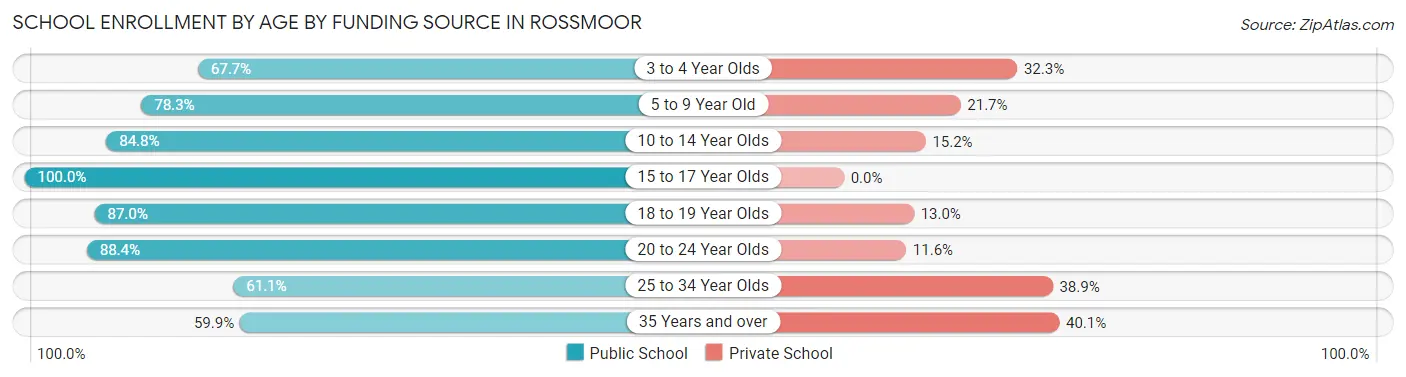
| Age Bracket | Public School | Private School |
| 3 to 4 Year Olds | 128 (67.7%) | 61 (32.3%) |
| 5 to 9 Year Old | 558 (78.3%) | 155 (21.7%) |
| 10 to 14 Year Olds | 1,013 (84.8%) | 182 (15.2%) |
| 15 to 17 Year Olds | 670 (100.0%) | 0 (0.0%) |
| 18 to 19 Year Olds | 220 (87.0%) | 33 (13.0%) |
| 20 to 24 Year Olds | 366 (88.4%) | 48 (11.6%) |
| 25 to 34 Year Olds | 44 (61.1%) | 28 (38.9%) |
| 35 Years and over | 97 (59.9%) | 65 (40.1%) |
| Total | 3,096 (84.4%) | 572 (15.6%) |
Educational Attainment by Field of Study in Rossmoor
Business (987 | 19.0%), social sciences (697 | 13.4%), engineering (455 | 8.7%), science & technology (437 | 8.4%), and bio, nature & agricultural (386 | 7.4%) are the most common fields of study among 5,206 individuals in Rossmoor who have obtained a bachelor's degree or higher.
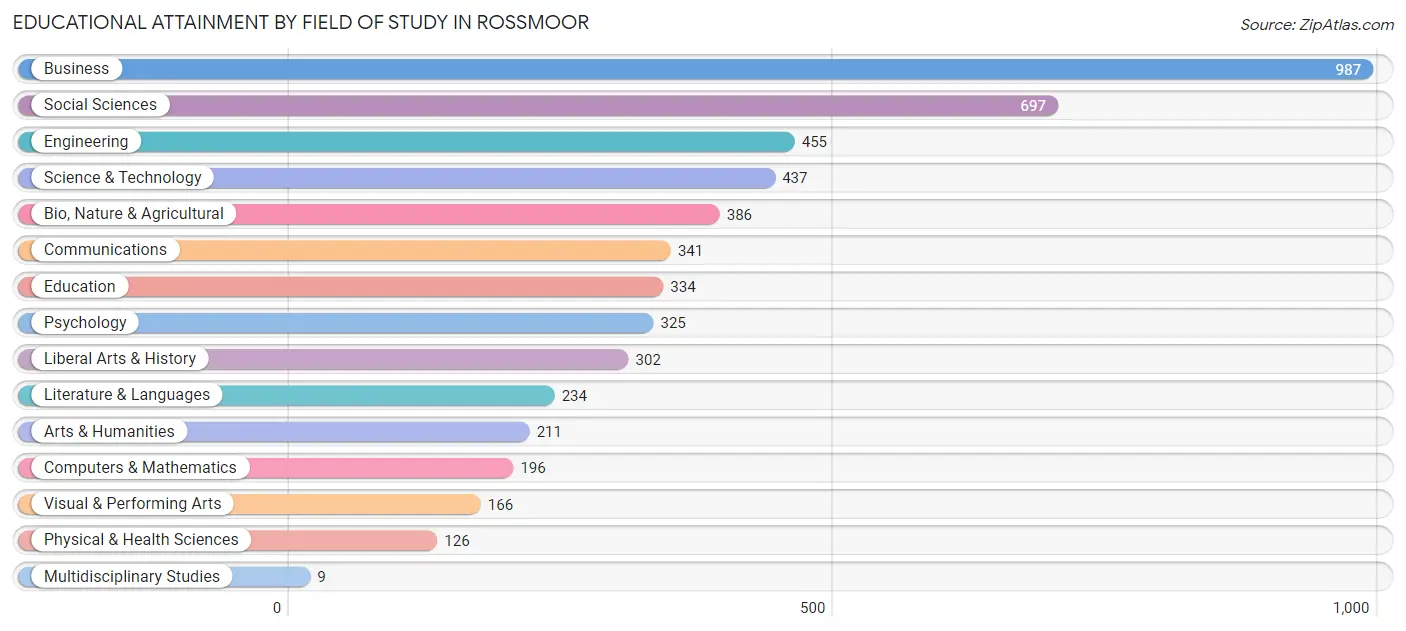
| Field of Study | # Graduates | % Graduates |
| Computers & Mathematics | 196 | 3.8% |
| Bio, Nature & Agricultural | 386 | 7.4% |
| Physical & Health Sciences | 126 | 2.4% |
| Psychology | 325 | 6.2% |
| Social Sciences | 697 | 13.4% |
| Engineering | 455 | 8.7% |
| Multidisciplinary Studies | 9 | 0.2% |
| Science & Technology | 437 | 8.4% |
| Business | 987 | 19.0% |
| Education | 334 | 6.4% |
| Literature & Languages | 234 | 4.5% |
| Liberal Arts & History | 302 | 5.8% |
| Visual & Performing Arts | 166 | 3.2% |
| Communications | 341 | 6.6% |
| Arts & Humanities | 211 | 4.1% |
| Total | 5,206 | 100.0% |
Transportation & Commute in Rossmoor
Vehicle Availability by Sex in Rossmoor
The most prevalent vehicle ownership categories in Rossmoor are males with 2 vehicles (1,291, accounting for 46.1%) and females with 2 vehicles (1,116, making up 52.8%).
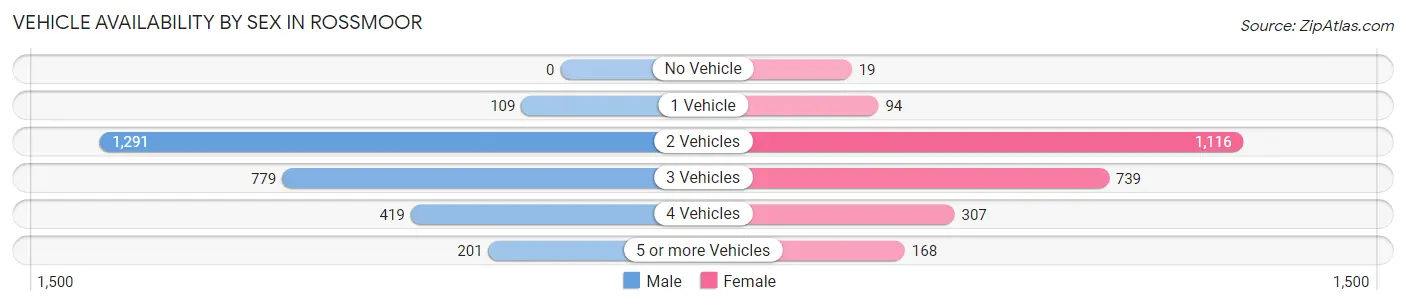
| Vehicles Available | Male | Female |
| No Vehicle | 0 (0.0%) | 19 (0.8%) |
| 1 Vehicle | 109 (3.9%) | 94 (3.8%) |
| 2 Vehicles | 1,291 (46.1%) | 1,116 (45.7%) |
| 3 Vehicles | 779 (27.8%) | 739 (30.2%) |
| 4 Vehicles | 419 (15.0%) | 307 (12.6%) |
| 5 or more Vehicles | 201 (7.2%) | 168 (6.9%) |
| Total | 2,799 (100.0%) | 2,443 (100.0%) |
Commute Time in Rossmoor
The most frequently occuring commute durations in Rossmoor are 20 to 24 minutes (608 commuters, 15.0%), 45 to 59 minutes (570 commuters, 14.0%), and 30 to 34 minutes (540 commuters, 13.3%).
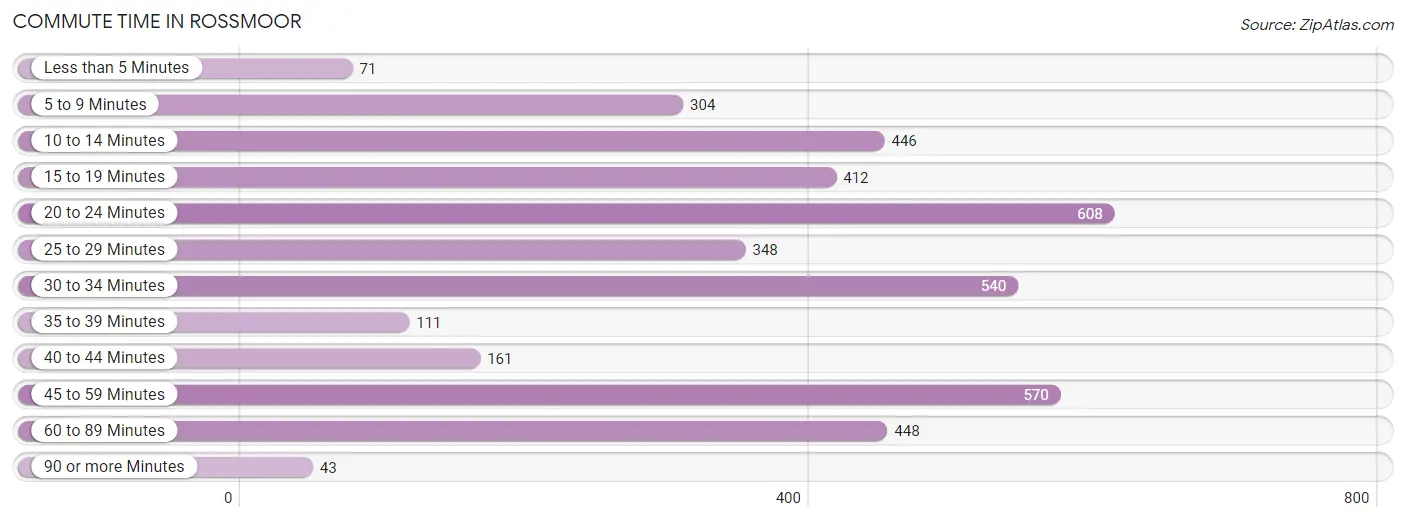
| Commute Time | # Commuters | % Commuters |
| Less than 5 Minutes | 71 | 1.8% |
| 5 to 9 Minutes | 304 | 7.5% |
| 10 to 14 Minutes | 446 | 11.0% |
| 15 to 19 Minutes | 412 | 10.1% |
| 20 to 24 Minutes | 608 | 15.0% |
| 25 to 29 Minutes | 348 | 8.6% |
| 30 to 34 Minutes | 540 | 13.3% |
| 35 to 39 Minutes | 111 | 2.7% |
| 40 to 44 Minutes | 161 | 4.0% |
| 45 to 59 Minutes | 570 | 14.0% |
| 60 to 89 Minutes | 448 | 11.0% |
| 90 or more Minutes | 43 | 1.1% |
Commute Time by Sex in Rossmoor
The most common commute times in Rossmoor are 45 to 59 minutes (428 commuters, 17.9%) for males and 20 to 24 minutes (251 commuters, 15.0%) for females.
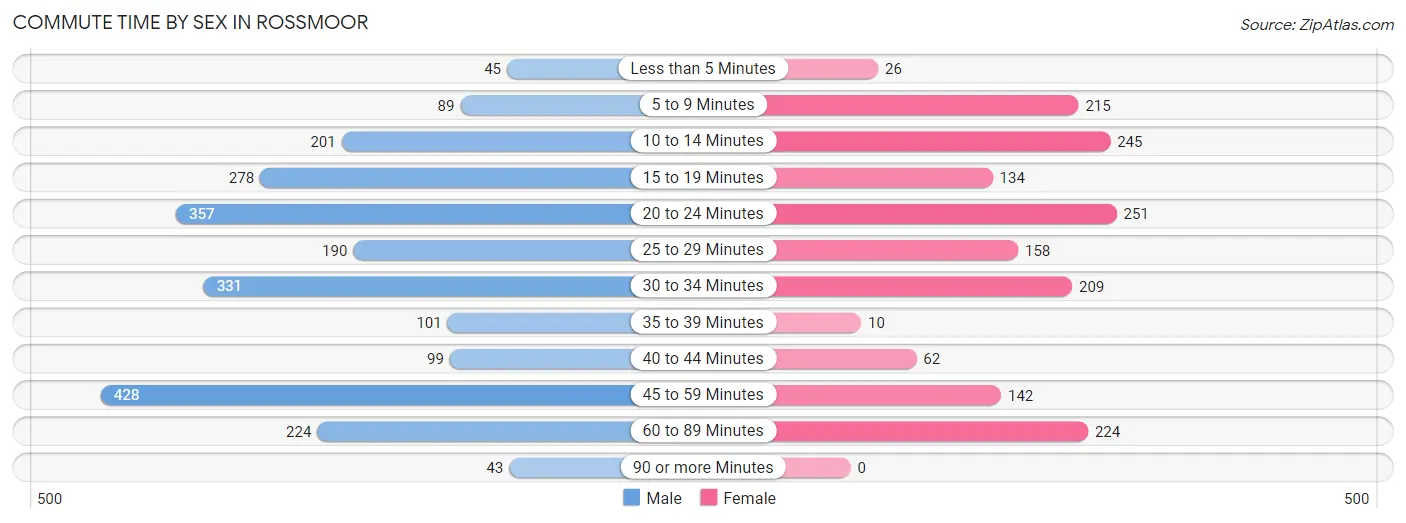
| Commute Time | Male | Female |
| Less than 5 Minutes | 45 (1.9%) | 26 (1.5%) |
| 5 to 9 Minutes | 89 (3.7%) | 215 (12.8%) |
| 10 to 14 Minutes | 201 (8.4%) | 245 (14.6%) |
| 15 to 19 Minutes | 278 (11.7%) | 134 (8.0%) |
| 20 to 24 Minutes | 357 (15.0%) | 251 (15.0%) |
| 25 to 29 Minutes | 190 (8.0%) | 158 (9.4%) |
| 30 to 34 Minutes | 331 (13.9%) | 209 (12.5%) |
| 35 to 39 Minutes | 101 (4.2%) | 10 (0.6%) |
| 40 to 44 Minutes | 99 (4.2%) | 62 (3.7%) |
| 45 to 59 Minutes | 428 (17.9%) | 142 (8.5%) |
| 60 to 89 Minutes | 224 (9.4%) | 224 (13.4%) |
| 90 or more Minutes | 43 (1.8%) | 0 (0.0%) |
Time of Departure to Work by Sex in Rossmoor
The most frequent times of departure to work in Rossmoor are 6:00 AM to 6:29 AM (397, 16.6%) for males and 7:00 AM to 7:29 AM (393, 23.4%) for females.
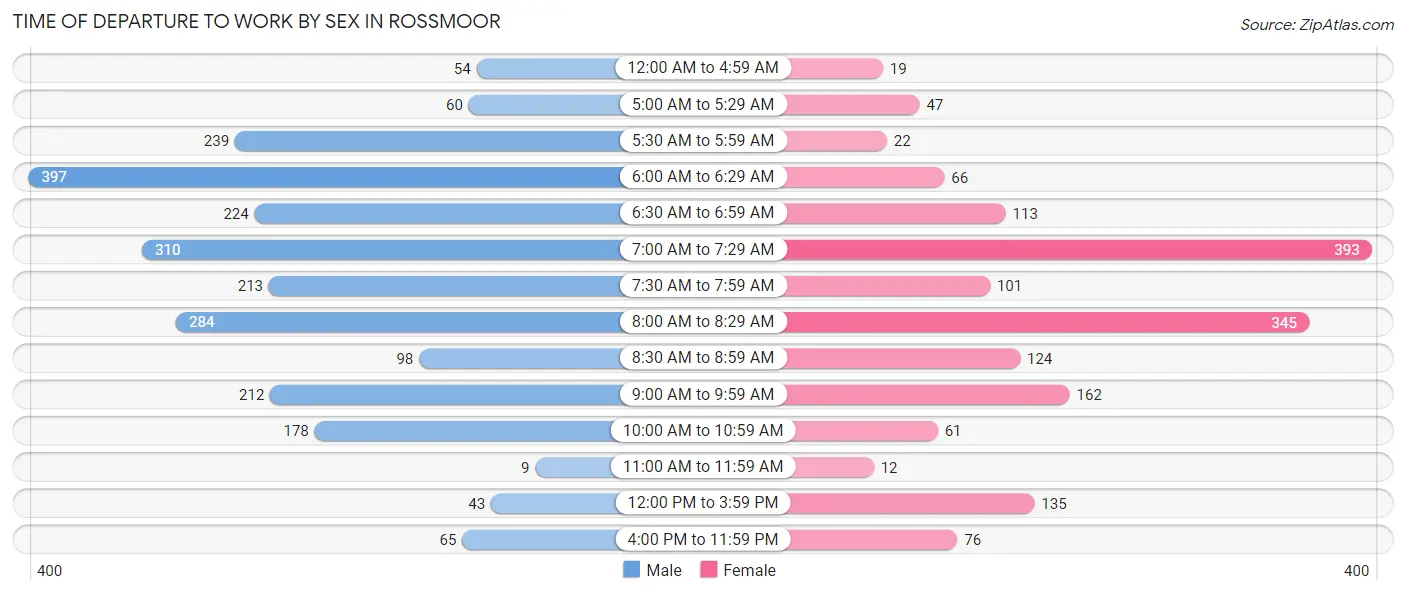
| Time of Departure | Male | Female |
| 12:00 AM to 4:59 AM | 54 (2.3%) | 19 (1.1%) |
| 5:00 AM to 5:29 AM | 60 (2.5%) | 47 (2.8%) |
| 5:30 AM to 5:59 AM | 239 (10.0%) | 22 (1.3%) |
| 6:00 AM to 6:29 AM | 397 (16.6%) | 66 (3.9%) |
| 6:30 AM to 6:59 AM | 224 (9.4%) | 113 (6.7%) |
| 7:00 AM to 7:29 AM | 310 (13.0%) | 393 (23.4%) |
| 7:30 AM to 7:59 AM | 213 (8.9%) | 101 (6.0%) |
| 8:00 AM to 8:29 AM | 284 (11.9%) | 345 (20.6%) |
| 8:30 AM to 8:59 AM | 98 (4.1%) | 124 (7.4%) |
| 9:00 AM to 9:59 AM | 212 (8.9%) | 162 (9.7%) |
| 10:00 AM to 10:59 AM | 178 (7.5%) | 61 (3.6%) |
| 11:00 AM to 11:59 AM | 9 (0.4%) | 12 (0.7%) |
| 12:00 PM to 3:59 PM | 43 (1.8%) | 135 (8.1%) |
| 4:00 PM to 11:59 PM | 65 (2.7%) | 76 (4.5%) |
| Total | 2,386 (100.0%) | 1,676 (100.0%) |
Housing Occupancy in Rossmoor
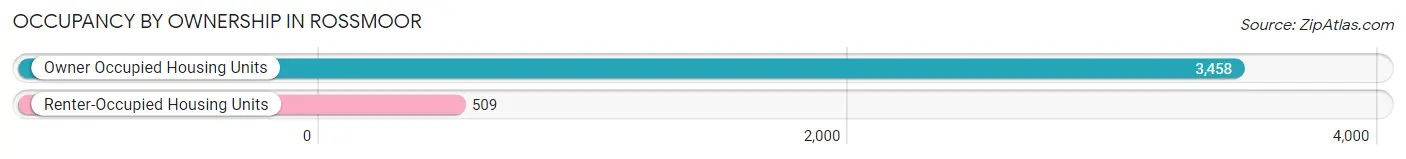
Occupancy by Ownership in Rossmoor
Of the total 3,967 dwellings in Rossmoor, owner-occupied units account for 3,458 (87.2%), while renter-occupied units make up 509 (12.8%).
| Occupancy | # Housing Units | % Housing Units |
| Owner Occupied Housing Units | 3,458 | 87.2% |
| Renter-Occupied Housing Units | 509 | 12.8% |
| Total Occupied Housing Units | 3,967 | 100.0% |
Occupancy by Household Size in Rossmoor
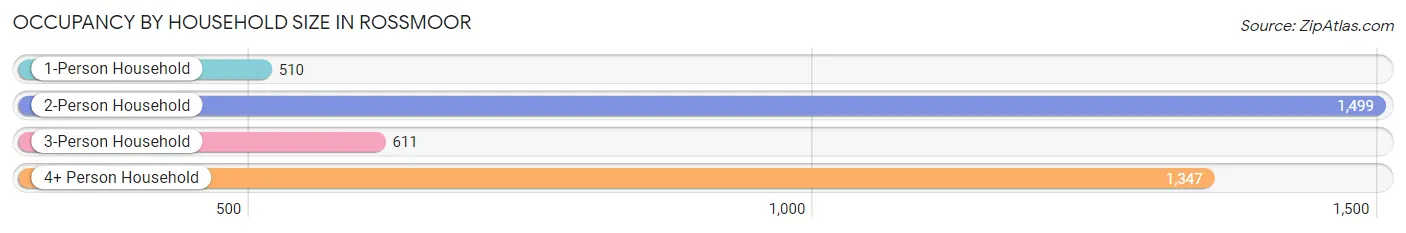
| Household Size | # Housing Units | % Housing Units |
| 1-Person Household | 510 | 12.9% |
| 2-Person Household | 1,499 | 37.8% |
| 3-Person Household | 611 | 15.4% |
| 4+ Person Household | 1,347 | 34.0% |
| Total Housing Units | 3,967 | 100.0% |
Occupancy by Ownership by Household Size in Rossmoor
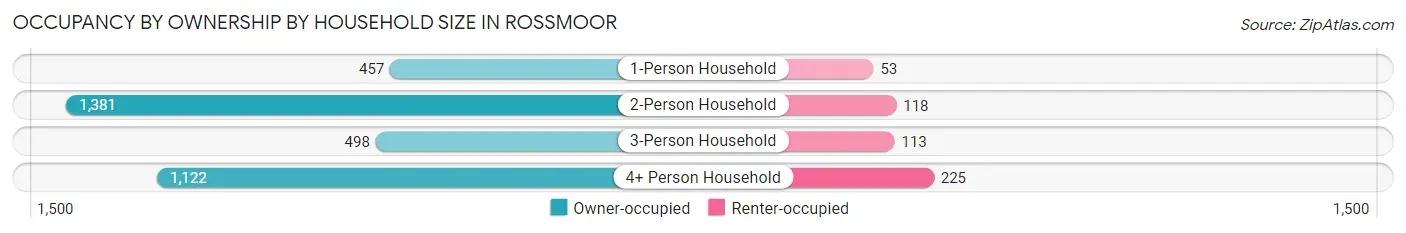
| Household Size | Owner-occupied | Renter-occupied |
| 1-Person Household | 457 (89.6%) | 53 (10.4%) |
| 2-Person Household | 1,381 (92.1%) | 118 (7.9%) |
| 3-Person Household | 498 (81.5%) | 113 (18.5%) |
| 4+ Person Household | 1,122 (83.3%) | 225 (16.7%) |
| Total Housing Units | 3,458 (87.2%) | 509 (12.8%) |
Occupancy by Educational Attainment in Rossmoor
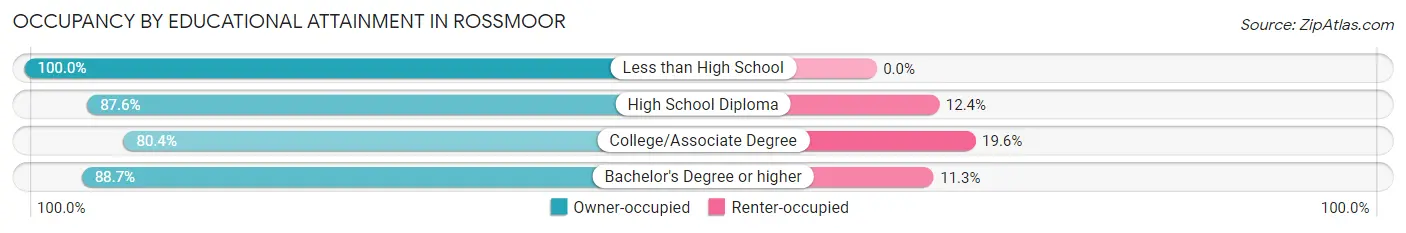
| Household Size | Owner-occupied | Renter-occupied |
| Less than High School | 68 (100.0%) | 0 (0.0%) |
| High School Diploma | 317 (87.6%) | 45 (12.4%) |
| College/Associate Degree | 615 (80.4%) | 150 (19.6%) |
| Bachelor's Degree or higher | 2,458 (88.7%) | 314 (11.3%) |
Occupancy by Age of Householder in Rossmoor
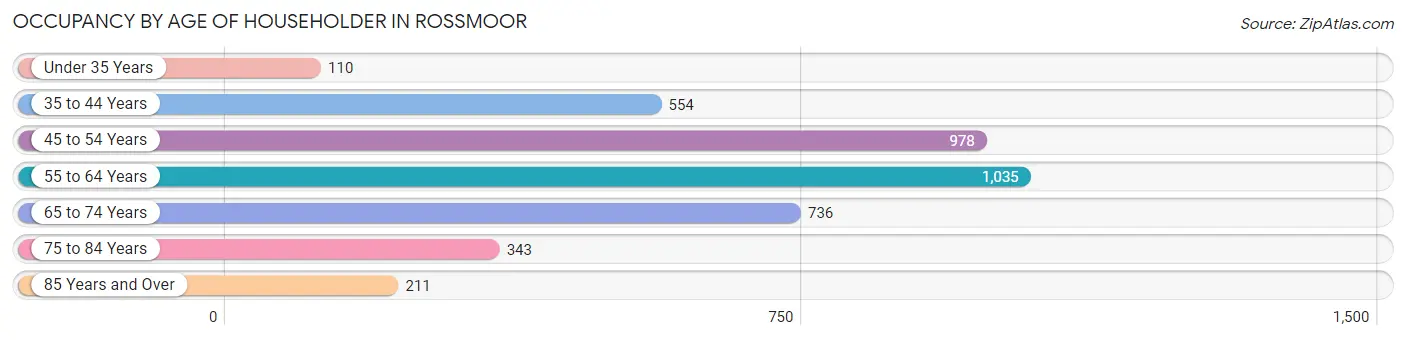
| Age Bracket | # Households | % Households |
| Under 35 Years | 110 | 2.8% |
| 35 to 44 Years | 554 | 14.0% |
| 45 to 54 Years | 978 | 24.6% |
| 55 to 64 Years | 1,035 | 26.1% |
| 65 to 74 Years | 736 | 18.5% |
| 75 to 84 Years | 343 | 8.6% |
| 85 Years and Over | 211 | 5.3% |
| Total | 3,967 | 100.0% |
Housing Finances in Rossmoor
Median Income by Occupancy in Rossmoor
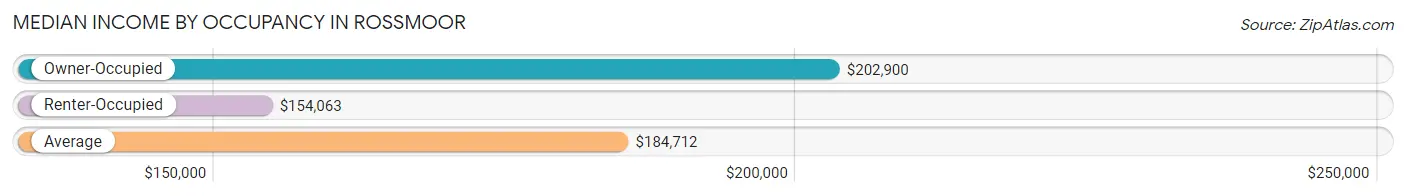
| Occupancy Type | # Households | Median Income |
| Owner-Occupied | 3,458 (87.2%) | $202,900 |
| Renter-Occupied | 509 (12.8%) | $154,063 |
| Average | 3,967 (100.0%) | $184,712 |
Occupancy by Householder Income Bracket in Rossmoor
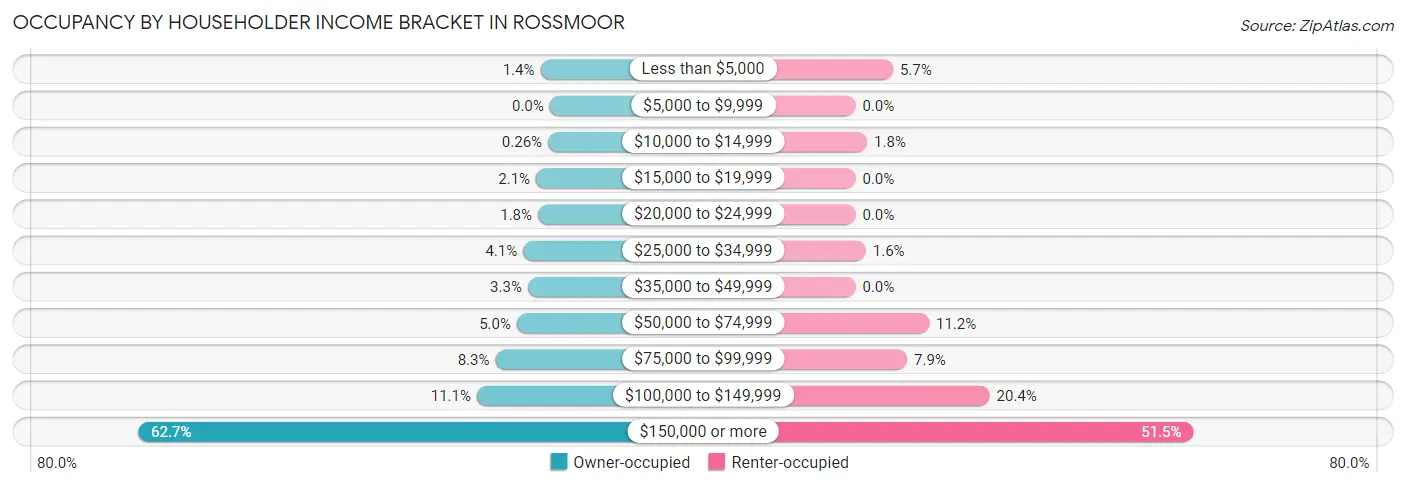
| Income Bracket | Owner-occupied | Renter-occupied |
| Less than $5,000 | 49 (1.4%) | 29 (5.7%) |
| $5,000 to $9,999 | 0 (0.0%) | 0 (0.0%) |
| $10,000 to $14,999 | 9 (0.3%) | 9 (1.8%) |
| $15,000 to $19,999 | 72 (2.1%) | 0 (0.0%) |
| $20,000 to $24,999 | 62 (1.8%) | 0 (0.0%) |
| $25,000 to $34,999 | 140 (4.1%) | 8 (1.6%) |
| $35,000 to $49,999 | 115 (3.3%) | 0 (0.0%) |
| $50,000 to $74,999 | 173 (5.0%) | 57 (11.2%) |
| $75,000 to $99,999 | 286 (8.3%) | 40 (7.9%) |
| $100,000 to $149,999 | 384 (11.1%) | 104 (20.4%) |
| $150,000 or more | 2,168 (62.7%) | 262 (51.5%) |
| Total | 3,458 (100.0%) | 509 (100.0%) |
Monthly Housing Cost Tiers in Rossmoor
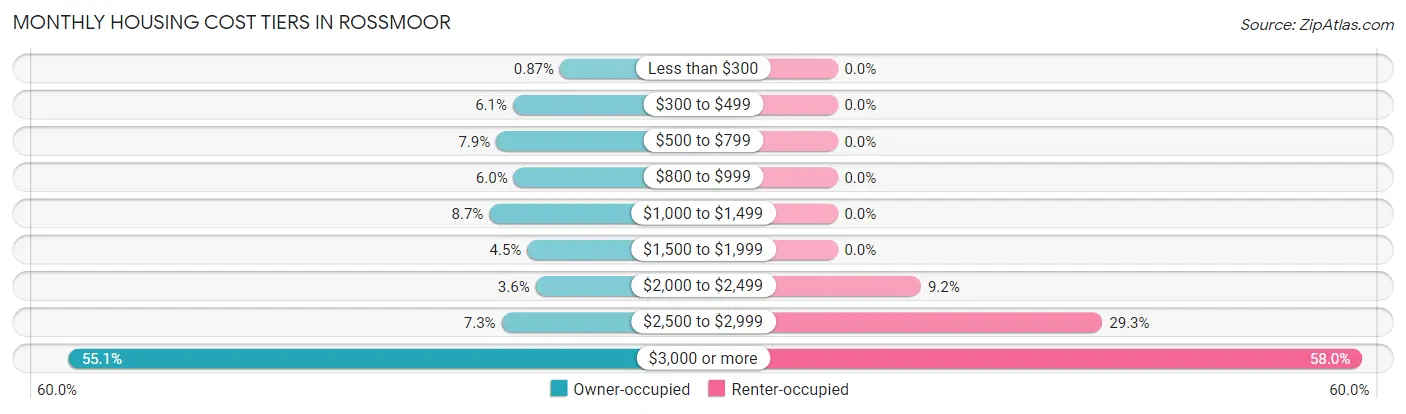
| Monthly Cost | Owner-occupied | Renter-occupied |
| Less than $300 | 30 (0.9%) | 0 (0.0%) |
| $300 to $499 | 210 (6.1%) | 0 (0.0%) |
| $500 to $799 | 274 (7.9%) | 0 (0.0%) |
| $800 to $999 | 207 (6.0%) | 0 (0.0%) |
| $1,000 to $1,499 | 300 (8.7%) | 0 (0.0%) |
| $1,500 to $1,999 | 155 (4.5%) | 0 (0.0%) |
| $2,000 to $2,499 | 123 (3.6%) | 47 (9.2%) |
| $2,500 to $2,999 | 253 (7.3%) | 149 (29.3%) |
| $3,000 or more | 1,906 (55.1%) | 295 (58.0%) |
| Total | 3,458 (100.0%) | 509 (100.0%) |
Physical Housing Characteristics in Rossmoor
Housing Structures in Rossmoor
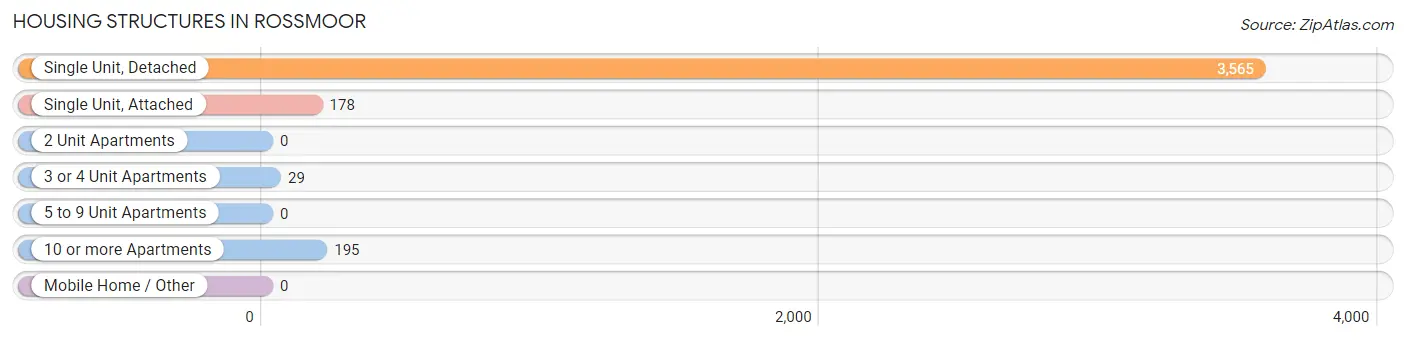
| Structure Type | # Housing Units | % Housing Units |
| Single Unit, Detached | 3,565 | 89.9% |
| Single Unit, Attached | 178 | 4.5% |
| 2 Unit Apartments | 0 | 0.0% |
| 3 or 4 Unit Apartments | 29 | 0.7% |
| 5 to 9 Unit Apartments | 0 | 0.0% |
| 10 or more Apartments | 195 | 4.9% |
| Mobile Home / Other | 0 | 0.0% |
| Total | 3,967 | 100.0% |
Housing Structures by Occupancy in Rossmoor
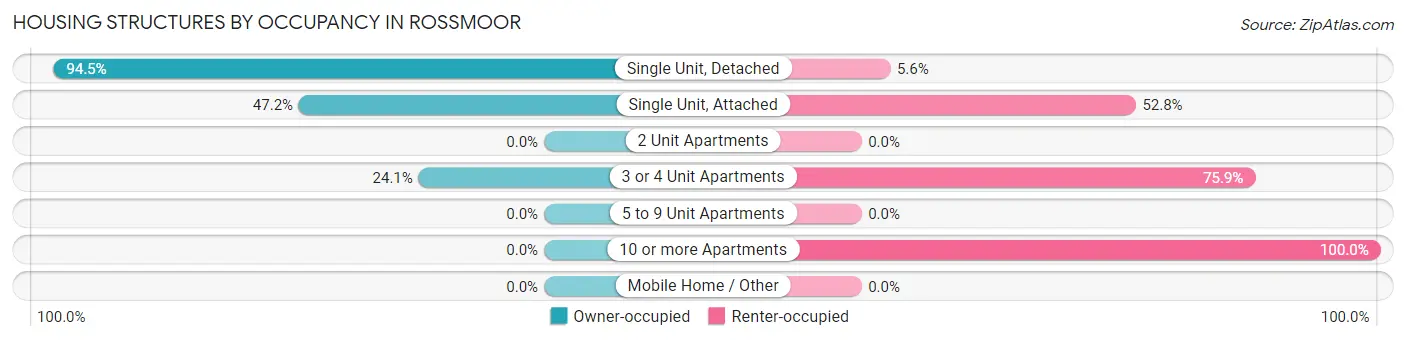
| Structure Type | Owner-occupied | Renter-occupied |
| Single Unit, Detached | 3,367 (94.5%) | 198 (5.6%) |
| Single Unit, Attached | 84 (47.2%) | 94 (52.8%) |
| 2 Unit Apartments | 0 (0.0%) | 0 (0.0%) |
| 3 or 4 Unit Apartments | 7 (24.1%) | 22 (75.9%) |
| 5 to 9 Unit Apartments | 0 (0.0%) | 0 (0.0%) |
| 10 or more Apartments | 0 (0.0%) | 195 (100.0%) |
| Mobile Home / Other | 0 (0.0%) | 0 (0.0%) |
| Total | 3,458 (87.2%) | 509 (12.8%) |
Housing Structures by Number of Rooms in Rossmoor
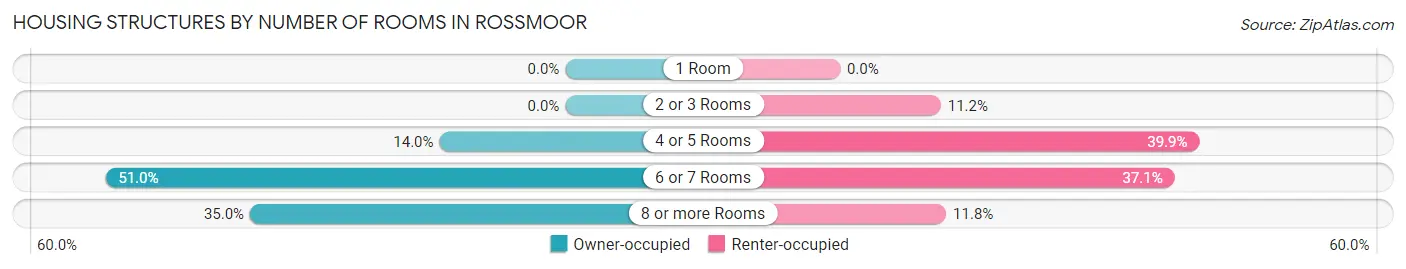
| Number of Rooms | Owner-occupied | Renter-occupied |
| 1 Room | 0 (0.0%) | 0 (0.0%) |
| 2 or 3 Rooms | 0 (0.0%) | 57 (11.2%) |
| 4 or 5 Rooms | 483 (14.0%) | 203 (39.9%) |
| 6 or 7 Rooms | 1,765 (51.0%) | 189 (37.1%) |
| 8 or more Rooms | 1,210 (35.0%) | 60 (11.8%) |
| Total | 3,458 (100.0%) | 509 (100.0%) |
Housing Structure by Heating Type in Rossmoor
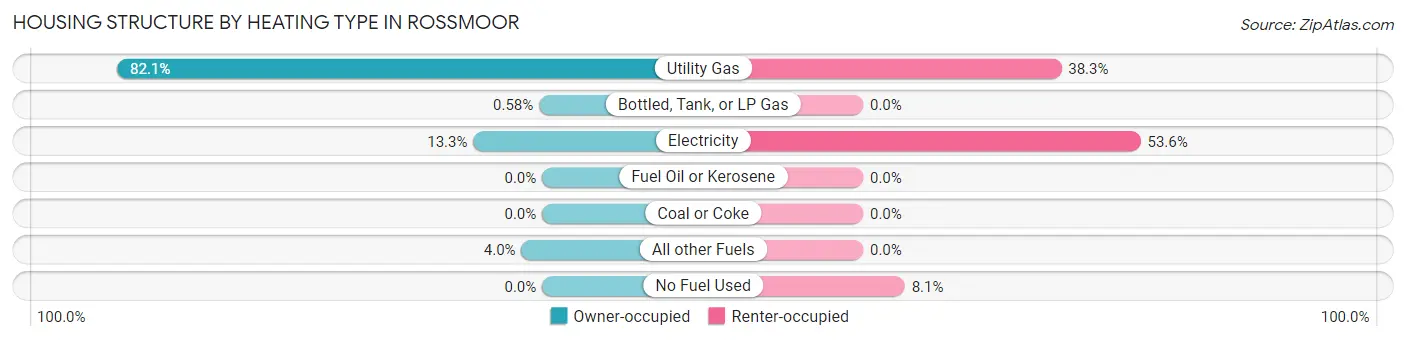
| Heating Type | Owner-occupied | Renter-occupied |
| Utility Gas | 2,840 (82.1%) | 195 (38.3%) |
| Bottled, Tank, or LP Gas | 20 (0.6%) | 0 (0.0%) |
| Electricity | 460 (13.3%) | 273 (53.6%) |
| Fuel Oil or Kerosene | 0 (0.0%) | 0 (0.0%) |
| Coal or Coke | 0 (0.0%) | 0 (0.0%) |
| All other Fuels | 138 (4.0%) | 0 (0.0%) |
| No Fuel Used | 0 (0.0%) | 41 (8.1%) |
| Total | 3,458 (100.0%) | 509 (100.0%) |
Household Vehicle Usage in Rossmoor
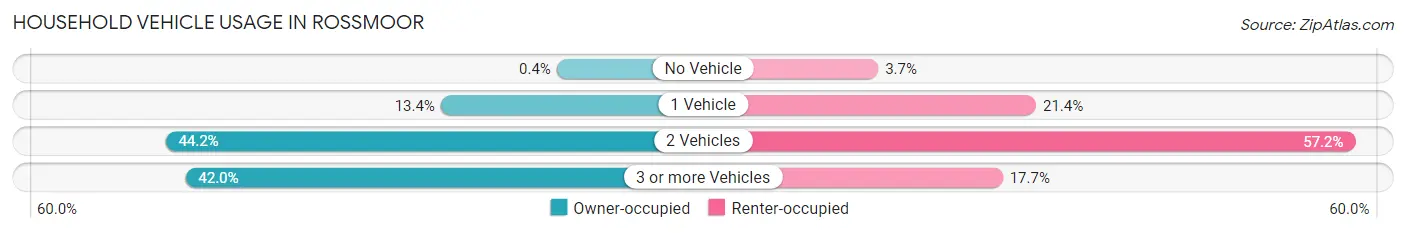
| Vehicles per Household | Owner-occupied | Renter-occupied |
| No Vehicle | 14 (0.4%) | 19 (3.7%) |
| 1 Vehicle | 463 (13.4%) | 109 (21.4%) |
| 2 Vehicles | 1,529 (44.2%) | 291 (57.2%) |
| 3 or more Vehicles | 1,452 (42.0%) | 90 (17.7%) |
| Total | 3,458 (100.0%) | 509 (100.0%) |
Real Estate & Mortgages in Rossmoor
Real Estate and Mortgage Overview in Rossmoor
| Characteristic | Without Mortgage | With Mortgage |
| Housing Units | 955 | 2,503 |
| Median Property Value | $1,125,000 | $1,231,800 |
| Median Household Income | $135,156 | $1,729 |
| Monthly Housing Costs | $833 | $1,906 |
| Real Estate Taxes | $4,382 | $5 |
Property Value by Mortgage Status in Rossmoor
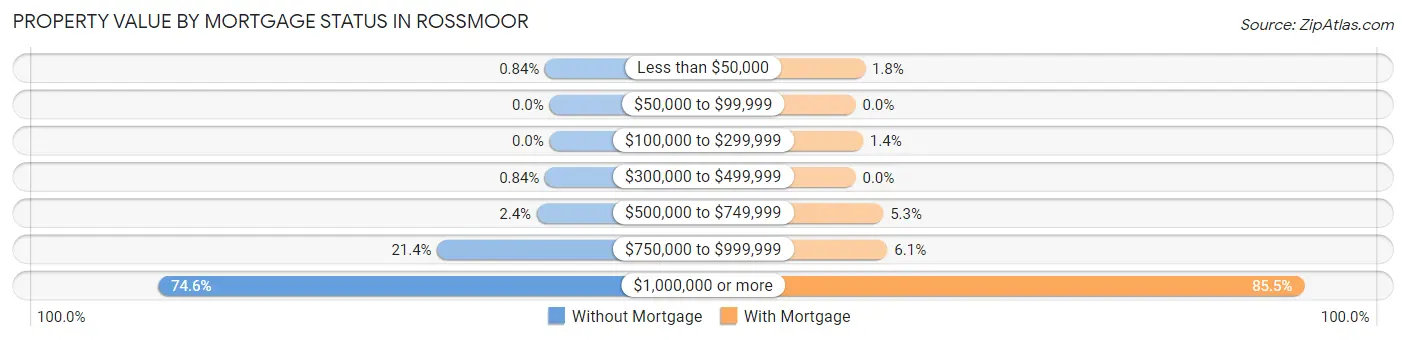
| Property Value | Without Mortgage | With Mortgage |
| Less than $50,000 | 8 (0.8%) | 45 (1.8%) |
| $50,000 to $99,999 | 0 (0.0%) | 0 (0.0%) |
| $100,000 to $299,999 | 0 (0.0%) | 35 (1.4%) |
| $300,000 to $499,999 | 8 (0.8%) | 0 (0.0%) |
| $500,000 to $749,999 | 23 (2.4%) | 132 (5.3%) |
| $750,000 to $999,999 | 204 (21.4%) | 152 (6.1%) |
| $1,000,000 or more | 712 (74.6%) | 2,139 (85.5%) |
| Total | 955 (100.0%) | 2,503 (100.0%) |
Household Income by Mortgage Status in Rossmoor
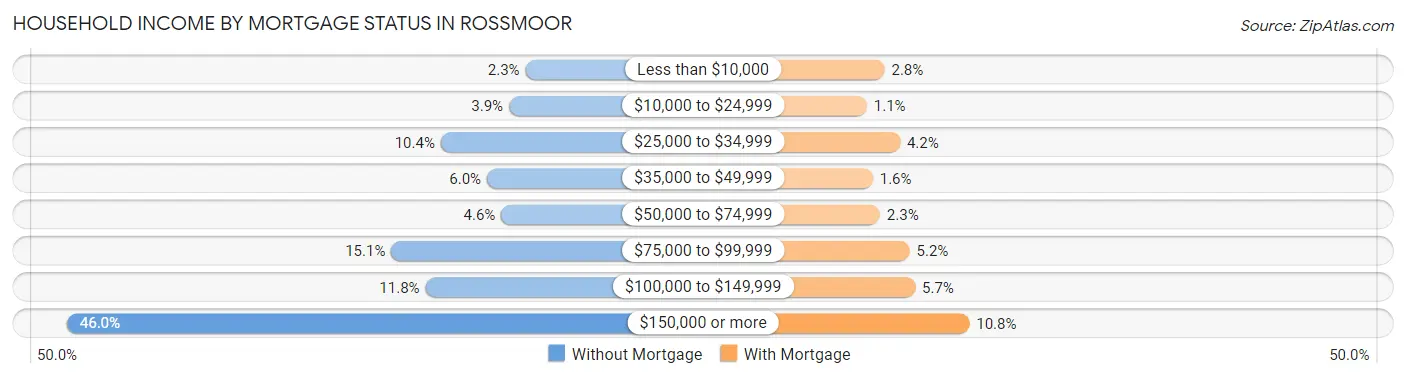
| Household Income | Without Mortgage | With Mortgage |
| Less than $10,000 | 22 (2.3%) | 69 (2.8%) |
| $10,000 to $24,999 | 37 (3.9%) | 27 (1.1%) |
| $25,000 to $34,999 | 99 (10.4%) | 106 (4.2%) |
| $35,000 to $49,999 | 57 (6.0%) | 41 (1.6%) |
| $50,000 to $74,999 | 44 (4.6%) | 58 (2.3%) |
| $75,000 to $99,999 | 144 (15.1%) | 129 (5.1%) |
| $100,000 to $149,999 | 113 (11.8%) | 142 (5.7%) |
| $150,000 or more | 439 (46.0%) | 271 (10.8%) |
| Total | 955 (100.0%) | 2,503 (100.0%) |
Property Value to Household Income Ratio in Rossmoor
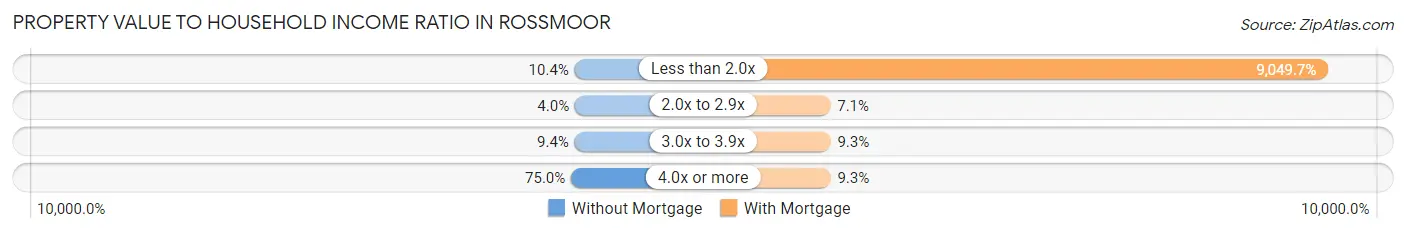
| Value-to-Income Ratio | Without Mortgage | With Mortgage |
| Less than 2.0x | 99 (10.4%) | 226,513 (9,049.7%) |
| 2.0x to 2.9x | 38 (4.0%) | 177 (7.1%) |
| 3.0x to 3.9x | 90 (9.4%) | 232 (9.3%) |
| 4.0x or more | 716 (75.0%) | 233 (9.3%) |
| Total | 955 (100.0%) | 2,503 (100.0%) |
Real Estate Taxes by Mortgage Status in Rossmoor
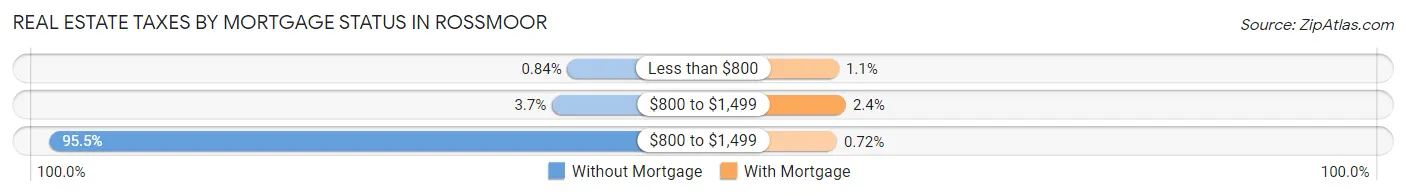
| Property Taxes | Without Mortgage | With Mortgage |
| Less than $800 | 8 (0.8%) | 27 (1.1%) |
| $800 to $1,499 | 35 (3.7%) | 59 (2.4%) |
| $800 to $1,499 | 912 (95.5%) | 18 (0.7%) |
| Total | 955 (100.0%) | 2,503 (100.0%) |
Health & Disability in Rossmoor
Health Insurance Coverage by Age in Rossmoor
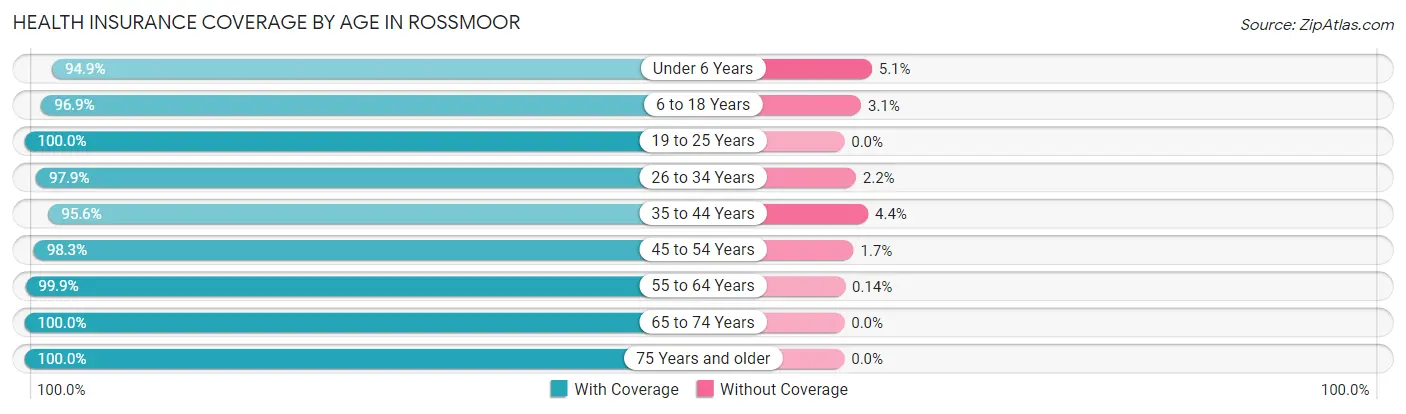
| Age Bracket | With Coverage | Without Coverage |
| Under 6 Years | 462 (94.9%) | 25 (5.1%) |
| 6 to 18 Years | 2,542 (96.9%) | 82 (3.1%) |
| 19 to 25 Years | 703 (100.0%) | 0 (0.0%) |
| 26 to 34 Years | 500 (97.9%) | 11 (2.1%) |
| 35 to 44 Years | 1,055 (95.6%) | 49 (4.4%) |
| 45 to 54 Years | 1,717 (98.3%) | 30 (1.7%) |
| 55 to 64 Years | 2,121 (99.9%) | 3 (0.1%) |
| 65 to 74 Years | 1,385 (100.0%) | 0 (0.0%) |
| 75 Years and older | 1,048 (100.0%) | 0 (0.0%) |
| Total | 11,533 (98.3%) | 200 (1.7%) |
Health Insurance Coverage by Citizenship Status in Rossmoor
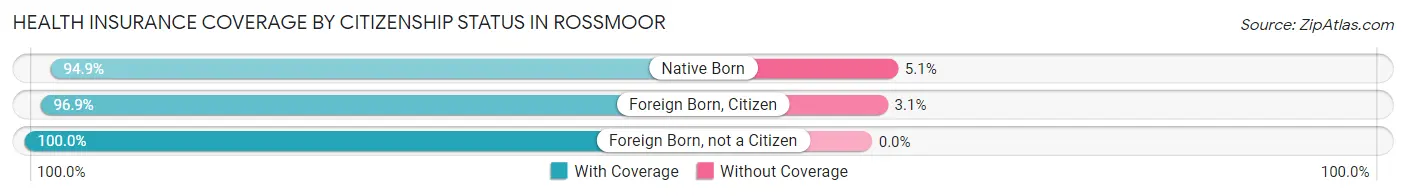
| Citizenship Status | With Coverage | Without Coverage |
| Native Born | 462 (94.9%) | 25 (5.1%) |
| Foreign Born, Citizen | 2,542 (96.9%) | 82 (3.1%) |
| Foreign Born, not a Citizen | 703 (100.0%) | 0 (0.0%) |
Health Insurance Coverage by Household Income in Rossmoor
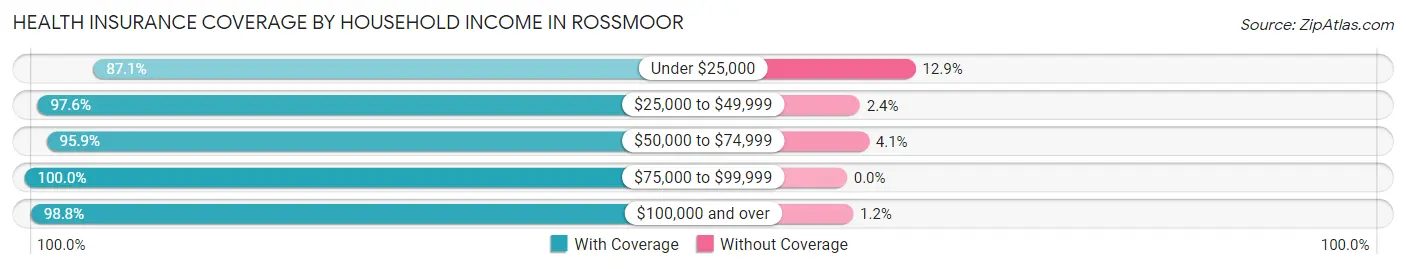
| Household Income | With Coverage | Without Coverage |
| Under $25,000 | 325 (87.1%) | 48 (12.9%) |
| $25,000 to $49,999 | 442 (97.6%) | 11 (2.4%) |
| $50,000 to $74,999 | 697 (95.9%) | 30 (4.1%) |
| $75,000 to $99,999 | 792 (100.0%) | 0 (0.0%) |
| $100,000 and over | 9,260 (98.8%) | 111 (1.2%) |
Public vs Private Health Insurance Coverage by Age in Rossmoor
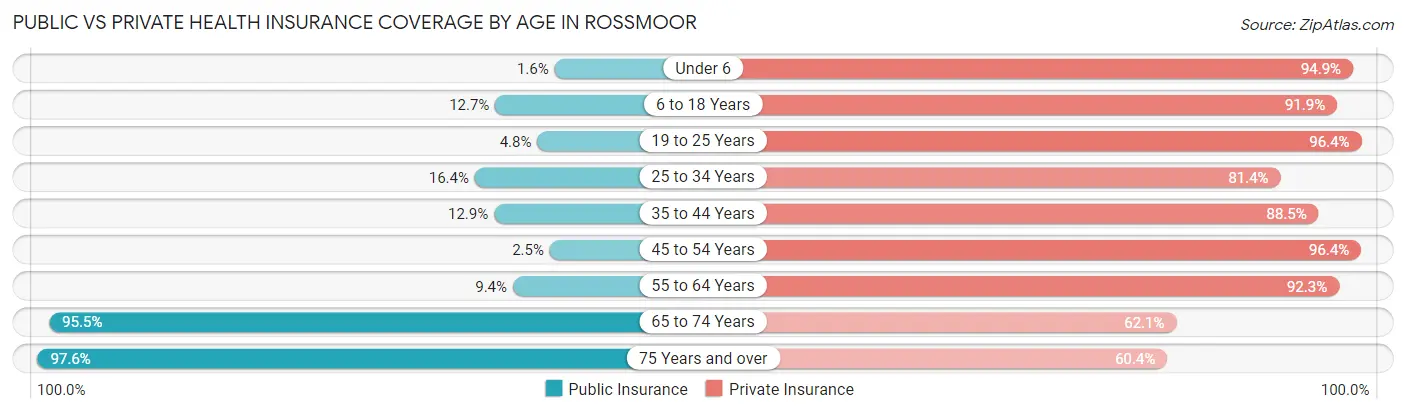
| Age Bracket | Public Insurance | Private Insurance |
| Under 6 | 8 (1.6%) | 462 (94.9%) |
| 6 to 18 Years | 332 (12.7%) | 2,412 (91.9%) |
| 19 to 25 Years | 34 (4.8%) | 678 (96.4%) |
| 25 to 34 Years | 84 (16.4%) | 416 (81.4%) |
| 35 to 44 Years | 142 (12.9%) | 977 (88.5%) |
| 45 to 54 Years | 44 (2.5%) | 1,684 (96.4%) |
| 55 to 64 Years | 199 (9.4%) | 1,960 (92.3%) |
| 65 to 74 Years | 1,322 (95.5%) | 860 (62.1%) |
| 75 Years and over | 1,023 (97.6%) | 633 (60.4%) |
| Total | 3,188 (27.2%) | 10,082 (85.9%) |
Disability Status by Sex by Age in Rossmoor
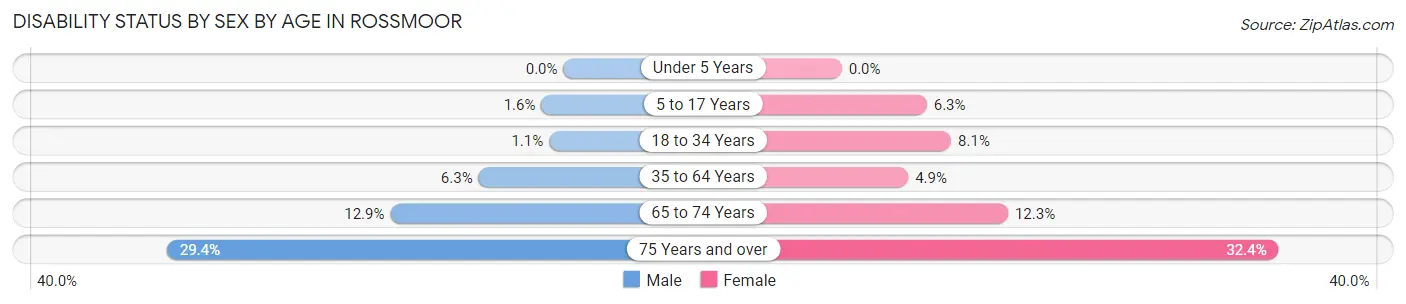
| Age Bracket | Male | Female |
| Under 5 Years | 0 (0.0%) | 0 (0.0%) |
| 5 to 17 Years | 24 (1.6%) | 73 (6.3%) |
| 18 to 34 Years | 7 (1.1%) | 56 (8.1%) |
| 35 to 64 Years | 150 (6.3%) | 128 (4.9%) |
| 65 to 74 Years | 78 (12.9%) | 96 (12.3%) |
| 75 Years and over | 136 (29.4%) | 190 (32.4%) |
Disability Class by Sex by Age in Rossmoor
Disability Class: Hearing Difficulty
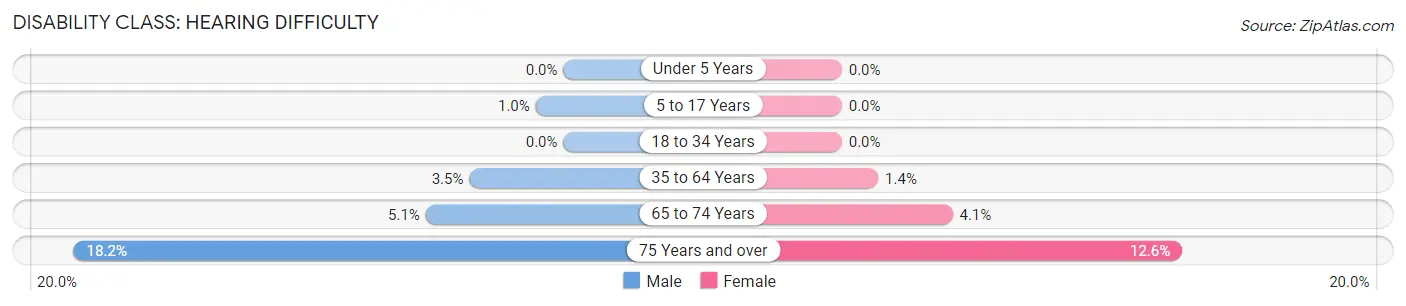
| Age Bracket | Male | Female |
| Under 5 Years | 0 (0.0%) | 0 (0.0%) |
| 5 to 17 Years | 15 (1.0%) | 0 (0.0%) |
| 18 to 34 Years | 0 (0.0%) | 0 (0.0%) |
| 35 to 64 Years | 83 (3.5%) | 35 (1.3%) |
| 65 to 74 Years | 31 (5.1%) | 32 (4.1%) |
| 75 Years and over | 84 (18.2%) | 74 (12.6%) |
Disability Class: Vision Difficulty
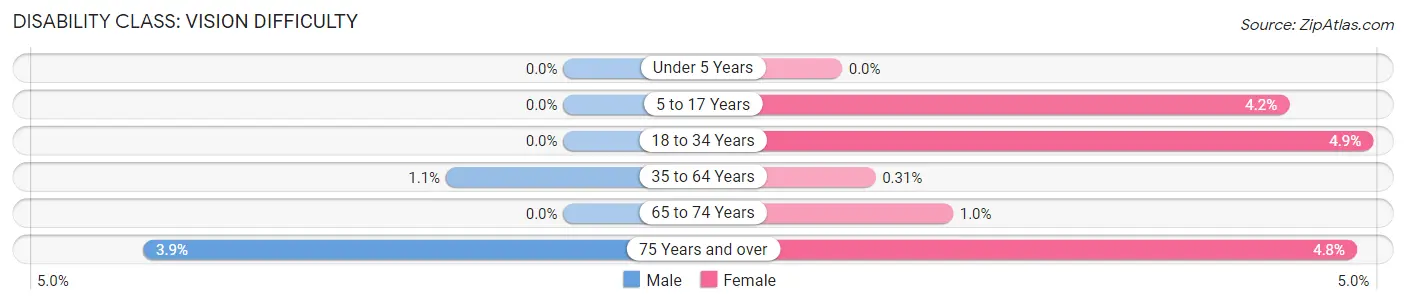
| Age Bracket | Male | Female |
| Under 5 Years | 0 (0.0%) | 0 (0.0%) |
| 5 to 17 Years | 0 (0.0%) | 48 (4.2%) |
| 18 to 34 Years | 0 (0.0%) | 34 (4.9%) |
| 35 to 64 Years | 26 (1.1%) | 8 (0.3%) |
| 65 to 74 Years | 0 (0.0%) | 8 (1.0%) |
| 75 Years and over | 18 (3.9%) | 28 (4.8%) |
Disability Class: Cognitive Difficulty
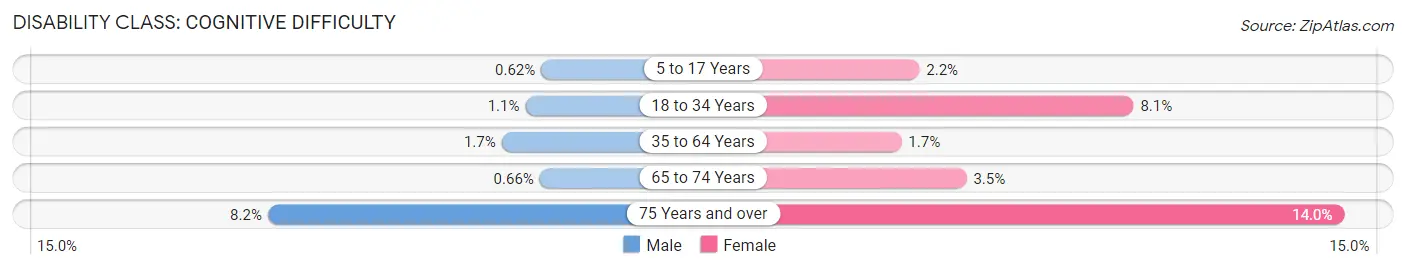
| Age Bracket | Male | Female |
| 5 to 17 Years | 9 (0.6%) | 25 (2.2%) |
| 18 to 34 Years | 7 (1.1%) | 56 (8.1%) |
| 35 to 64 Years | 41 (1.7%) | 43 (1.7%) |
| 65 to 74 Years | 4 (0.7%) | 27 (3.5%) |
| 75 Years and over | 38 (8.2%) | 82 (14.0%) |
Disability Class: Ambulatory Difficulty
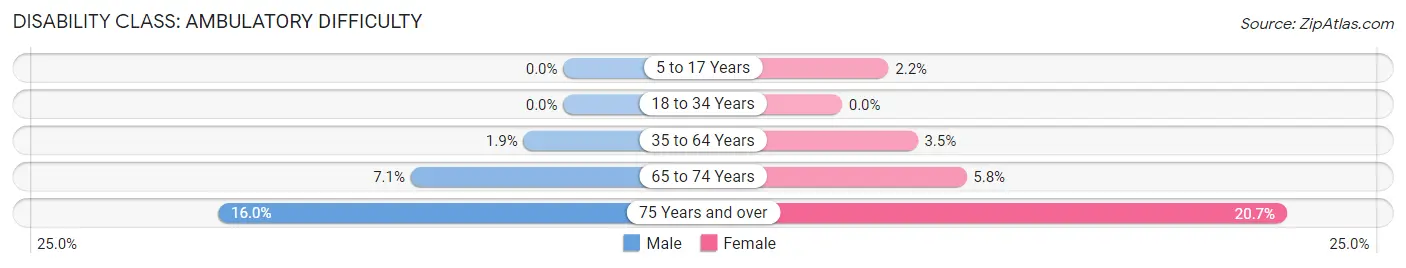
| Age Bracket | Male | Female |
| 5 to 17 Years | 0 (0.0%) | 25 (2.2%) |
| 18 to 34 Years | 0 (0.0%) | 0 (0.0%) |
| 35 to 64 Years | 44 (1.8%) | 91 (3.5%) |
| 65 to 74 Years | 43 (7.1%) | 45 (5.8%) |
| 75 Years and over | 74 (16.0%) | 121 (20.6%) |
Disability Class: Self-Care Difficulty
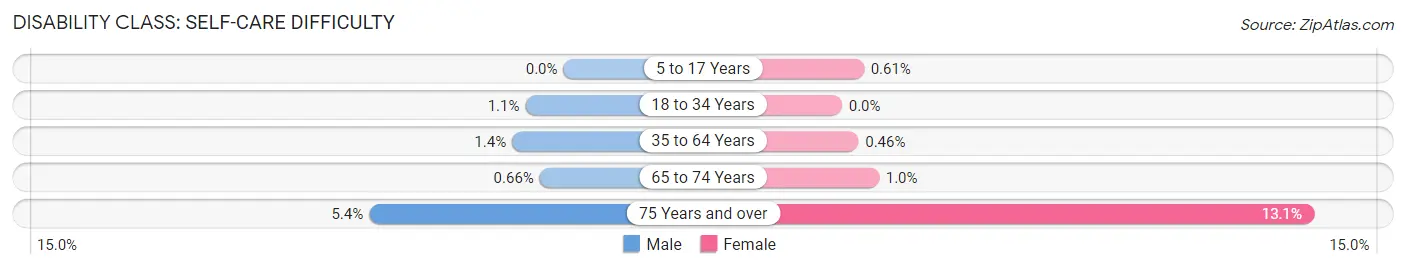
| Age Bracket | Male | Female |
| 5 to 17 Years | 0 (0.0%) | 7 (0.6%) |
| 18 to 34 Years | 7 (1.1%) | 0 (0.0%) |
| 35 to 64 Years | 34 (1.4%) | 12 (0.5%) |
| 65 to 74 Years | 4 (0.7%) | 8 (1.0%) |
| 75 Years and over | 25 (5.4%) | 77 (13.1%) |
Technology Access in Rossmoor
Computing Device Access in Rossmoor
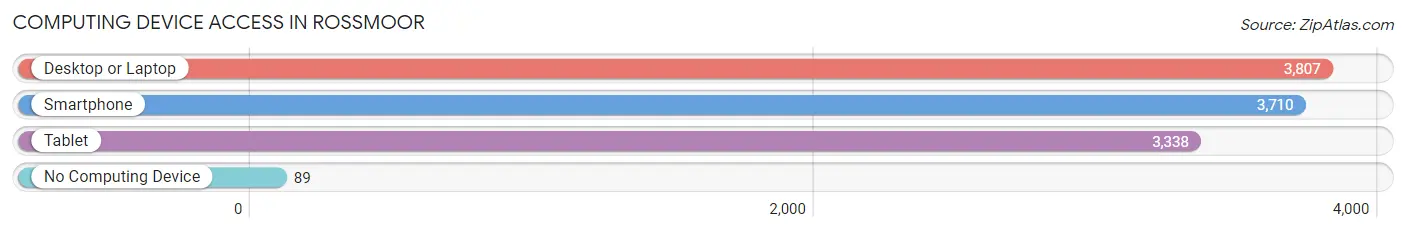
| Device Type | # Households | % Households |
| Desktop or Laptop | 3,807 | 96.0% |
| Smartphone | 3,710 | 93.5% |
| Tablet | 3,338 | 84.1% |
| No Computing Device | 89 | 2.2% |
| Total | 3,967 | 100.0% |
Internet Access in Rossmoor
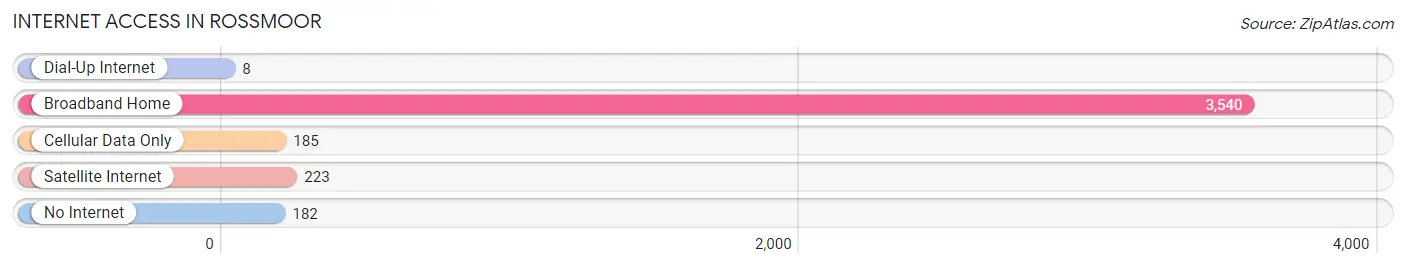
| Internet Type | # Households | % Households |
| Dial-Up Internet | 8 | 0.2% |
| Broadband Home | 3,540 | 89.2% |
| Cellular Data Only | 185 | 4.7% |
| Satellite Internet | 223 | 5.6% |
| No Internet | 182 | 4.6% |
| Total | 3,967 | 100.0% |
Rossmoor Summary
Rossmoor, California is a census-designated place located in Orange County, California. It is an unincorporated area located between the cities of Los Alamitos and Seal Beach. The population was 10,244 at the 2010 census, up from 8,261 at the 2000 census.
History
Rossmoor was originally developed in the 1950s by Ross Cortese, a real estate developer. The area was originally planned as a retirement community for senior citizens, and was named after Cortese's wife, Rose. The first homes were built in 1956, and the community was officially incorporated in 1960.
Geography
Rossmoor is located at 33°47'25"N 118°3'25"W (33.790278, -118.056944). According to the United States Census Bureau, the CDP has a total area of 1.3 square miles (3.4 km2), all of it land.
Economy
Rossmoor is primarily a residential community, with no major employers located within the CDP. The median household income in Rossmoor was $103,845 in 2000, compared to the median income for Orange County of $63,902.
Demographics
As of the census of 2000, there were 8,261 people, 3,845 households, and 2,541 families residing in the CDP. The population density was 6,541.3 people per square mile (2,521.2/km2). There were 3,945 housing units at an average density of 3,093.3 per square mile (1,192.2/km2). The racial makeup of the CDP was 87.2% White, 0.7% African American, 0.2% Native American, 8.3% Asian, 0.1% Pacific Islander, 1.3% from other races, and 2.3% from two or more races. Hispanic or Latino of any race were 5.2% of the population.
There were 3,845 households, out of which 22.2% had children under the age of 18 living with them, 56.2% were married couples living together, 7.2% had a female householder with no husband present, and 34.3% were non-families. 28.7% of all households were made up of individuals, and 14.2% had someone living alone who was 65 years of age or older. The average household size was 2.14 and the average family size was 2.60.
In the CDP, the population was spread out, with 17.7% under the age of 18, 4.2% from 18 to 24, 22.2% from 25 to 44, 28.2% from 45 to 64, and 27.7% who were 65 years of age or older. The median age was 49 years. For every 100 females, there were 87.2 males. For every 100 females age 18 and over, there were 83.2 males.
The median income for a household in the CDP was $90,945, and the median income for a family was $106,813. Males had a median income of $71,964 versus $45,821 for females. The per capita income for the CDP was $50,945. About 1.7% of families and 3.2% of the population were below the poverty line, including 2.2% of those under age 18 and 2.2% of those age 65 or over.
Common Questions
What is Per Capita Income in Rossmoor?
Per Capita income in Rossmoor is $83,148.
What is the Median Family Income in Rossmoor?
Median Family Income in Rossmoor is $212,978.
What is the Median Household income in Rossmoor?
Median Household Income in Rossmoor is $184,712.
What is Income or Wage Gap in Rossmoor?
Income or Wage Gap in Rossmoor is 51.1%.
Women in Rossmoor earn 48.9 cents for every dollar earned by a man.
What is Inequality or Gini Index in Rossmoor?
Inequality or Gini Index in Rossmoor is 0.45.
What is the Total Population of Rossmoor?
Total Population of Rossmoor is 11,742.
What is the Total Male Population of Rossmoor?
Total Male Population of Rossmoor is 5,857.
What is the Total Female Population of Rossmoor?
Total Female Population of Rossmoor is 5,885.
What is the Ratio of Males per 100 Females in Rossmoor?
There are 99.52 Males per 100 Females in Rossmoor.
What is the Ratio of Females per 100 Males in Rossmoor?
There are 100.48 Females per 100 Males in Rossmoor.
What is the Median Population Age in Rossmoor?
Median Population Age in Rossmoor is 47.6 Years.
What is the Average Family Size in Rossmoor
Average Family Size in Rossmoor is 3.2 People.
What is the Average Household Size in Rossmoor
Average Household Size in Rossmoor is 3.0 People.
How Large is the Labor Force in Rossmoor?
There are 5,568 People in the Labor Forcein in Rossmoor.
What is the Percentage of People in the Labor Force in Rossmoor?
60.4% of People are in the Labor Force in Rossmoor.
What is the Unemployment Rate in Rossmoor?
Unemployment Rate in Rossmoor is 4.6%.