Cities with the Lowest Poverty Level Among Seniors Over the Age of 75 in Kentucky
RELATED REPORTS & OPTIONS
Lowest Poverty | Seniors 75+
Kentucky
Compare Cities
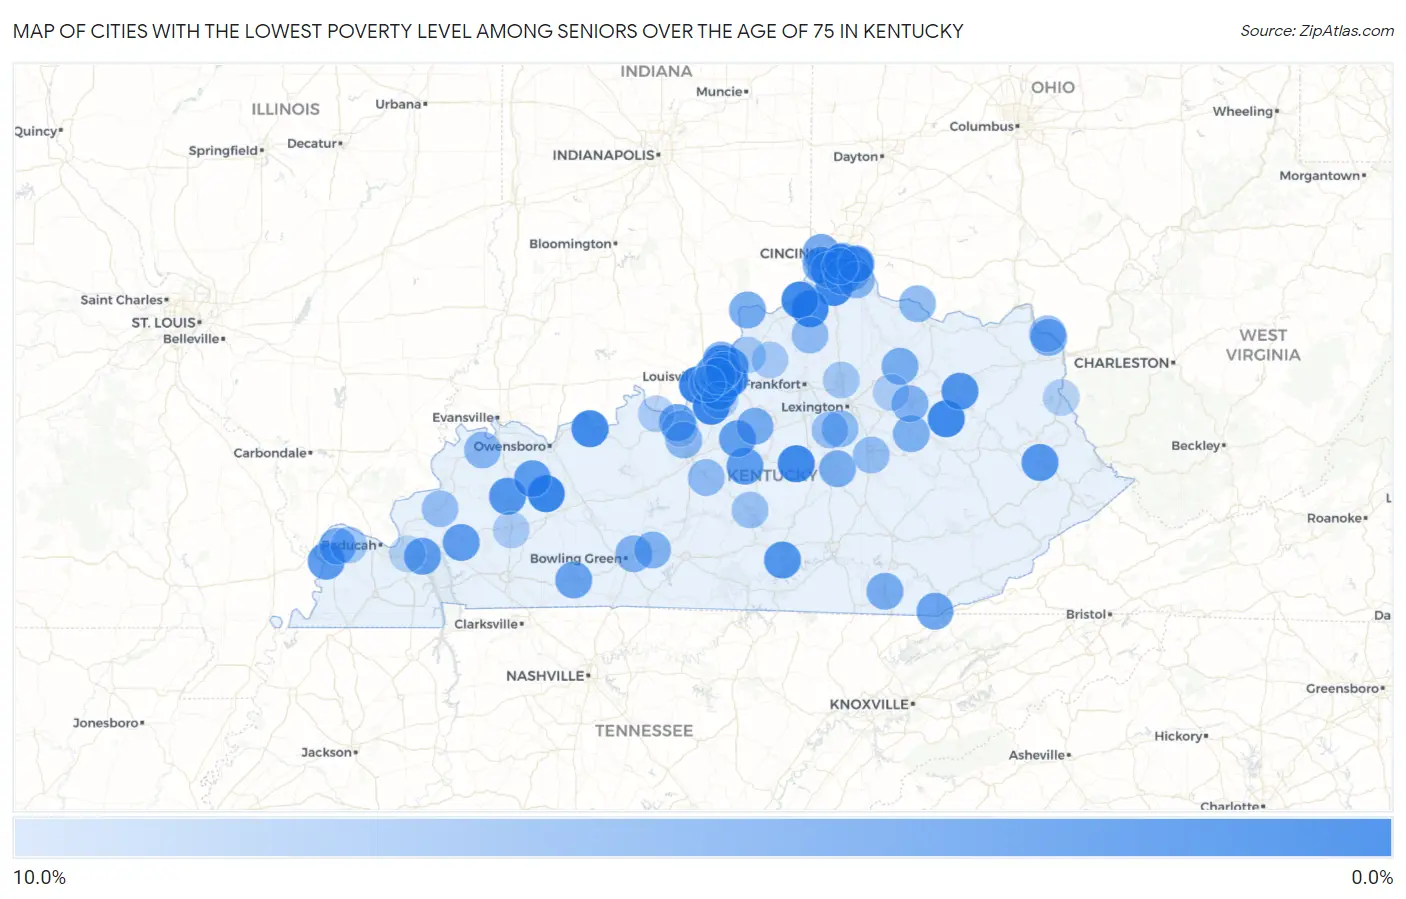
Map of Cities with the Lowest Poverty Level Among Seniors Over the Age of 75 in Kentucky
10.0%
0.0%
Cities with the Lowest Poverty Level Among Seniors Over the Age of 75 in Kentucky
| City | Senior Poverty | vs State | vs National | |
| 1. | Shively | 1.5% | 13.2%(-11.7)#1 | 11.1%(-9.61)#276 |
| 2. | Fox Chase | 1.5% | 13.2%(-11.7)#2 | 11.1%(-9.60)#284 |
| 3. | Island | 1.6% | 13.2%(-11.6)#3 | 11.1%(-9.43)#355 |
| 4. | Walton | 1.7% | 13.2%(-11.5)#4 | 11.1%(-9.40)#367 |
| 5. | Rolling Fields | 1.7% | 13.2%(-11.5)#5 | 11.1%(-9.37)#384 |
| 6. | Glencoe | 1.7% | 13.2%(-11.5)#6 | 11.1%(-9.34)#396 |
| 7. | Warsaw | 1.8% | 13.2%(-11.4)#7 | 11.1%(-9.25)#426 |
| 8. | St Regis Park | 1.9% | 13.2%(-11.3)#8 | 11.1%(-9.13)#484 |
| 9. | Frenchburg | 2.0% | 13.2%(-11.2)#9 | 11.1%(-9.11)#499 |
| 10. | Perryville | 2.0% | 13.2%(-11.2)#10 | 11.1%(-9.07)#519 |
| 11. | Brownsboro Farm | 2.1% | 13.2%(-11.1)#11 | 11.1%(-8.98)#578 |
| 12. | Cold Spring | 2.1% | 13.2%(-11.1)#12 | 11.1%(-8.97)#588 |
| 13. | Crestview Hills | 2.1% | 13.2%(-11.1)#13 | 11.1%(-8.97)#589 |
| 14. | Hawesville | 2.1% | 13.2%(-11.1)#14 | 11.1%(-8.94)#603 |
| 15. | Prospect | 2.4% | 13.2%(-10.8)#15 | 11.1%(-8.71)#749 |
| 16. | Forest Hills | 2.4% | 13.2%(-10.8)#16 | 11.1%(-8.69)#768 |
| 17. | Glenview Hills | 2.4% | 13.2%(-10.8)#17 | 11.1%(-8.63)#812 |
| 18. | Brownsboro Village | 2.8% | 13.2%(-10.4)#18 | 11.1%(-8.29)#1,068 |
| 19. | Meadow Vale | 2.9% | 13.2%(-10.3)#19 | 11.1%(-8.21)#1,131 |
| 20. | Riverwood | 2.9% | 13.2%(-10.3)#20 | 11.1%(-8.21)#1,136 |
| 21. | Meadowview Estates | 2.9% | 13.2%(-10.3)#21 | 11.1%(-8.21)#1,142 |
| 22. | Lakeview Heights | 2.9% | 13.2%(-10.3)#22 | 11.1%(-8.18)#1,153 |
| 23. | Hanson | 3.0% | 13.2%(-10.2)#23 | 11.1%(-8.08)#1,224 |
| 24. | Jamestown | 3.1% | 13.2%(-10.1)#24 | 11.1%(-8.00)#1,296 |
| 25. | Oakbrook | 3.2% | 13.2%(-10.0)#25 | 11.1%(-7.91)#1,376 |
| 26. | Prestonsburg | 3.2% | 13.2%(-10.00)#26 | 11.1%(-7.87)#1,403 |
| 27. | Orchard Grass Hills | 3.2% | 13.2%(-9.97)#27 | 11.1%(-7.84)#1,423 |
| 28. | Windy Hills | 3.3% | 13.2%(-9.94)#28 | 11.1%(-7.81)#1,469 |
| 29. | Wickliffe | 3.4% | 13.2%(-9.81)#29 | 11.1%(-7.68)#1,589 |
| 30. | Strathmoor Village | 3.5% | 13.2%(-9.69)#30 | 11.1%(-7.56)#1,682 |
| 31. | Calhoun | 3.6% | 13.2%(-9.63)#31 | 11.1%(-7.50)#1,745 |
| 32. | Loretto | 3.6% | 13.2%(-9.58)#32 | 11.1%(-7.45)#1,792 |
| 33. | Spring Valley | 3.7% | 13.2%(-9.50)#33 | 11.1%(-7.36)#1,871 |
| 34. | Princeton | 3.8% | 13.2%(-9.44)#34 | 11.1%(-7.30)#1,926 |
| 35. | Green Spring | 3.8% | 13.2%(-9.43)#35 | 11.1%(-7.29)#1,950 |
| 36. | Grand Rivers | 3.8% | 13.2%(-9.35)#36 | 11.1%(-7.22)#2,018 |
| 37. | Spring Mill | 3.8% | 13.2%(-9.35)#37 | 11.1%(-7.22)#2,021 |
| 38. | Bardstown | 3.9% | 13.2%(-9.27)#38 | 11.1%(-7.13)#2,110 |
| 39. | Douglass Hills | 4.0% | 13.2%(-9.17)#39 | 11.1%(-7.04)#2,201 |
| 40. | Lakeside Park | 4.1% | 13.2%(-9.05)#40 | 11.1%(-6.92)#2,312 |
| 41. | Muldraugh | 4.2% | 13.2%(-9.03)#41 | 11.1%(-6.90)#2,335 |
| 42. | Moorland | 4.2% | 13.2%(-9.03)#42 | 11.1%(-6.90)#2,347 |
| 43. | Russellville | 4.3% | 13.2%(-8.88)#43 | 11.1%(-6.75)#2,484 |
| 44. | St Matthews | 4.4% | 13.2%(-8.84)#44 | 11.1%(-6.71)#2,554 |
| 45. | Middlesborough | 4.4% | 13.2%(-8.82)#45 | 11.1%(-6.69)#2,565 |
| 46. | Hollow Creek | 4.6% | 13.2%(-8.61)#46 | 11.1%(-6.48)#2,790 |
| 47. | Erlanger | 4.6% | 13.2%(-8.55)#47 | 11.1%(-6.42)#2,849 |
| 48. | Seneca Gardens | 4.8% | 13.2%(-8.44)#48 | 11.1%(-6.31)#2,947 |
| 49. | Francisville | 4.8% | 13.2%(-8.37)#49 | 11.1%(-6.23)#3,031 |
| 50. | La Center | 5.0% | 13.2%(-8.20)#50 | 11.1%(-6.07)#3,199 |
| 51. | Milton | 5.0% | 13.2%(-8.20)#51 | 11.1%(-6.07)#3,202 |
| 52. | Bellewood | 5.0% | 13.2%(-8.20)#52 | 11.1%(-6.07)#3,224 |
| 53. | Bloomfield | 5.1% | 13.2%(-8.07)#53 | 11.1%(-5.94)#3,334 |
| 54. | Flatwoods | 5.2% | 13.2%(-8.04)#54 | 11.1%(-5.91)#3,369 |
| 55. | Williamsburg | 5.2% | 13.2%(-8.03)#55 | 11.1%(-5.89)#3,375 |
| 56. | Lancaster | 5.3% | 13.2%(-7.94)#56 | 11.1%(-5.80)#3,447 |
| 57. | Norwood | 5.3% | 13.2%(-7.94)#57 | 11.1%(-5.80)#3,489 |
| 58. | Burlington | 5.3% | 13.2%(-7.92)#58 | 11.1%(-5.79)#3,510 |
| 59. | Carlisle | 5.3% | 13.2%(-7.91)#59 | 11.1%(-5.78)#3,520 |
| 60. | Florence | 5.4% | 13.2%(-7.81)#60 | 11.1%(-5.68)#3,588 |
| 61. | Barbourmeade | 5.5% | 13.2%(-7.74)#61 | 11.1%(-5.61)#3,655 |
| 62. | Clay City | 5.5% | 13.2%(-7.70)#62 | 11.1%(-5.57)#3,691 |
| 63. | River Bluff | 5.7% | 13.2%(-7.48)#63 | 11.1%(-5.35)#3,939 |
| 64. | Plum Springs | 5.7% | 13.2%(-7.48)#64 | 11.1%(-5.35)#3,940 |
| 65. | Smiths Grove | 5.8% | 13.2%(-7.43)#65 | 11.1%(-5.30)#3,998 |
| 66. | Ryland Heights | 5.8% | 13.2%(-7.39)#66 | 11.1%(-5.25)#4,036 |
| 67. | Mount Sterling | 5.8% | 13.2%(-7.37)#67 | 11.1%(-5.23)#4,054 |
| 68. | Independence | 5.9% | 13.2%(-7.35)#68 | 11.1%(-5.22)#4,072 |
| 69. | Woodland Hills | 5.9% | 13.2%(-7.32)#69 | 11.1%(-5.18)#4,121 |
| 70. | Fort Wright | 6.1% | 13.2%(-7.09)#70 | 11.1%(-4.96)#4,373 |
| 71. | Corydon | 6.1% | 13.2%(-7.08)#71 | 11.1%(-4.94)#4,395 |
| 72. | Radcliff | 6.2% | 13.2%(-7.01)#72 | 11.1%(-4.87)#4,460 |
| 73. | Claryville | 6.2% | 13.2%(-6.98)#73 | 11.1%(-4.85)#4,480 |
| 74. | Dover | 6.2% | 13.2%(-6.95)#74 | 11.1%(-4.82)#4,561 |
| 75. | Jeffersontown | 6.3% | 13.2%(-6.94)#75 | 11.1%(-4.81)#4,578 |
| 76. | Nicholasville | 6.4% | 13.2%(-6.77)#76 | 11.1%(-4.64)#4,732 |
| 77. | Briarwood | 6.5% | 13.2%(-6.75)#77 | 11.1%(-4.62)#4,766 |
| 78. | Owenton | 6.6% | 13.2%(-6.63)#78 | 11.1%(-4.50)#4,880 |
| 79. | Crestview | 6.7% | 13.2%(-6.53)#79 | 11.1%(-4.40)#4,986 |
| 80. | Ten Broeck | 6.7% | 13.2%(-6.53)#80 | 11.1%(-4.40)#5,023 |
| 81. | Hodgenville | 6.7% | 13.2%(-6.50)#81 | 11.1%(-4.37)#5,036 |
| 82. | Richmond | 6.8% | 13.2%(-6.42)#82 | 11.1%(-4.28)#5,103 |
| 83. | Marion | 6.9% | 13.2%(-6.28)#83 | 11.1%(-4.15)#5,256 |
| 84. | Worthington | 7.0% | 13.2%(-6.24)#84 | 11.1%(-4.11)#5,289 |
| 85. | Wilmore | 7.1% | 13.2%(-6.12)#85 | 11.1%(-3.98)#5,401 |
| 86. | Campbellsville | 7.3% | 13.2%(-5.93)#86 | 11.1%(-3.79)#5,591 |
| 87. | Georgetown | 7.7% | 13.2%(-5.52)#87 | 11.1%(-3.39)#5,949 |
| 88. | La Grange | 7.8% | 13.2%(-5.38)#88 | 11.1%(-3.25)#6,111 |
| 89. | Kevil | 7.8% | 13.2%(-5.36)#89 | 11.1%(-3.22)#6,137 |
| 90. | Edgewood | 7.9% | 13.2%(-5.30)#90 | 11.1%(-3.17)#6,172 |
| 91. | Eminence | 7.9% | 13.2%(-5.29)#91 | 11.1%(-3.15)#6,200 |
| 92. | North Middletown | 8.1% | 13.2%(-5.09)#92 | 11.1%(-2.96)#6,384 |
| 93. | Brandenburg | 8.1% | 13.2%(-5.08)#93 | 11.1%(-2.95)#6,391 |
| 94. | Nortonville | 8.2% | 13.2%(-5.00)#94 | 11.1%(-2.87)#6,468 |
| 95. | Heritage Creek | 8.3% | 13.2%(-4.87)#95 | 11.1%(-2.73)#6,585 |
| 96. | Richlawn | 8.3% | 13.2%(-4.87)#96 | 11.1%(-2.73)#6,627 |
| 97. | Louisa | 8.4% | 13.2%(-4.80)#97 | 11.1%(-2.67)#6,702 |
| 98. | Calvert City | 8.8% | 13.2%(-4.38)#98 | 11.1%(-2.24)#7,083 |
| 99. | Fort Knox | 8.9% | 13.2%(-4.31)#99 | 11.1%(-2.18)#7,149 |
| 100. | Audubon Park | 8.9% | 13.2%(-4.29)#100 | 11.1%(-2.16)#7,172 |
Common Questions
What are the Top 10 Cities with the Lowest Poverty Level Among Seniors Over the Age of 75 in Kentucky?
Top 10 Cities with the Lowest Poverty Level Among Seniors Over the Age of 75 in Kentucky are:
#1
1.5%
#2
1.5%
#3
1.6%
#4
1.7%
#5
1.7%
#6
1.7%
#7
1.8%
#8
1.9%
#9
2.0%
#10
2.0%
What city has the Lowest Poverty Level Among Seniors Over the Age of 75 in Kentucky?
Shively has the Lowest Poverty Level Among Seniors Over the Age of 75 in Kentucky with 1.5%.
What is the Poverty Level Among Seniors Over the Age of 75 in the State of Kentucky?
Poverty Level Among Seniors Over the Age of 75 in Kentucky is 13.2%.
What is the Poverty Level Among Seniors Over the Age of 75 in the United States?
Poverty Level Among Seniors Over the Age of 75 in the United States is 11.1%.