Cities with the Lowest Poverty Level Among Seniors Over the Age of 75 in West Virginia
RELATED REPORTS & OPTIONS
Lowest Poverty | Seniors 75+
West Virginia
Compare Cities
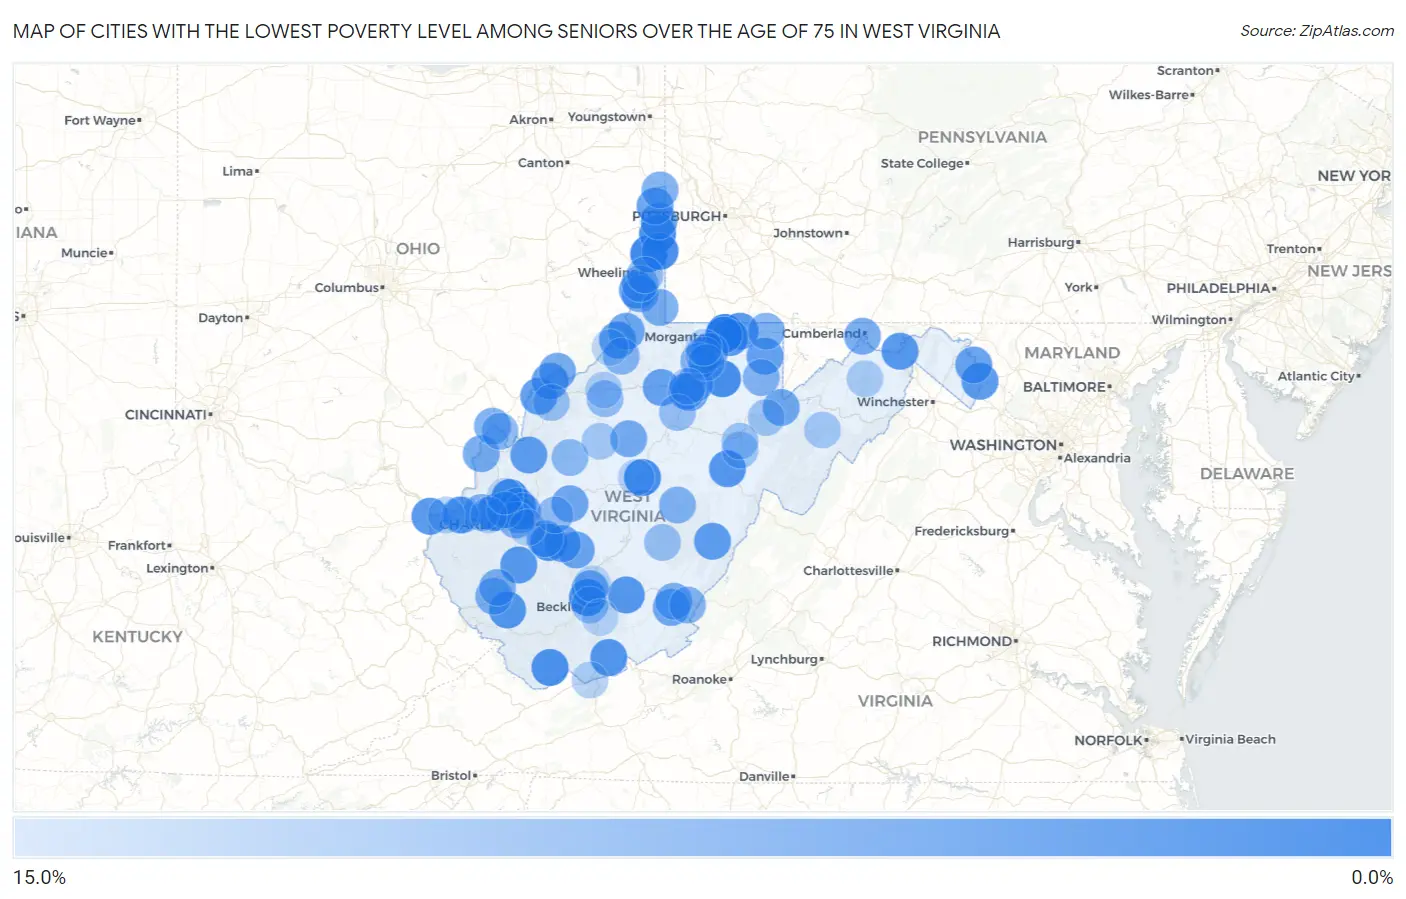
Map of Cities with the Lowest Poverty Level Among Seniors Over the Age of 75 in West Virginia
15.0%
0.0%
Cities with the Lowest Poverty Level Among Seniors Over the Age of 75 in West Virginia
| City | Senior Poverty | vs State | vs National | |
| 1. | Star City | 0.80% | 11.4%(-10.6)#1 | 11.1%(-10.3)#105 |
| 2. | Windsor Heights | 1.2% | 11.4%(-10.2)#2 | 11.1%(-9.86)#185 |
| 3. | Hurricane | 1.8% | 11.4%(-9.61)#3 | 11.1%(-9.30)#411 |
| 4. | Winfield | 1.8% | 11.4%(-9.60)#4 | 11.1%(-9.28)#415 |
| 5. | Sutton | 1.8% | 11.4%(-9.56)#5 | 11.1%(-9.25)#429 |
| 6. | Hooverson Heights | 1.8% | 11.4%(-9.54)#6 | 11.1%(-9.22)#442 |
| 7. | Prosperity | 2.0% | 11.4%(-9.39)#7 | 11.1%(-9.08)#510 |
| 8. | Grafton | 2.0% | 11.4%(-9.35)#8 | 11.1%(-9.04)#539 |
| 9. | Bethany | 2.0% | 11.4%(-9.34)#9 | 11.1%(-9.03)#546 |
| 10. | Chesapeake | 2.4% | 11.4%(-8.96)#10 | 11.1%(-8.65)#793 |
| 11. | Gary | 2.5% | 11.4%(-8.91)#11 | 11.1%(-8.60)#832 |
| 12. | Poca | 2.8% | 11.4%(-8.63)#12 | 11.1%(-8.31)#1,051 |
| 13. | Man | 2.9% | 11.4%(-8.48)#13 | 11.1%(-8.17)#1,162 |
| 14. | Athens | 3.0% | 11.4%(-8.35)#14 | 11.1%(-8.04)#1,263 |
| 15. | Cheat Lake | 3.1% | 11.4%(-8.28)#15 | 11.1%(-7.96)#1,326 |
| 16. | Mill Creek | 3.1% | 11.4%(-8.26)#16 | 11.1%(-7.94)#1,345 |
| 17. | Kenova | 3.2% | 11.4%(-8.17)#17 | 11.1%(-7.86)#1,410 |
| 18. | Meadow Bridge | 3.2% | 11.4%(-8.16)#18 | 11.1%(-7.84)#1,435 |
| 19. | Paw Paw | 3.3% | 11.4%(-8.05)#19 | 11.1%(-7.73)#1,529 |
| 20. | Morgantown | 3.4% | 11.4%(-8.01)#20 | 11.1%(-7.70)#1,559 |
| 21. | Madison | 3.4% | 11.4%(-8.01)#21 | 11.1%(-7.70)#1,561 |
| 22. | Westover | 3.4% | 11.4%(-7.98)#22 | 11.1%(-7.66)#1,602 |
| 23. | Bolivar | 3.6% | 11.4%(-7.81)#23 | 11.1%(-7.50)#1,738 |
| 24. | Ripley | 3.7% | 11.4%(-7.63)#24 | 11.1%(-7.32)#1,914 |
| 25. | Marlinton | 3.8% | 11.4%(-7.61)#25 | 11.1%(-7.29)#1,941 |
| 26. | Paden City | 3.8% | 11.4%(-7.57)#26 | 11.1%(-7.26)#1,981 |
| 27. | Lubeck | 3.9% | 11.4%(-7.52)#27 | 11.1%(-7.21)#2,035 |
| 28. | Glen Dale | 3.9% | 11.4%(-7.48)#28 | 11.1%(-7.16)#2,083 |
| 29. | Salem | 4.3% | 11.4%(-7.03)#29 | 11.1%(-6.72)#2,517 |
| 30. | Albright | 4.3% | 11.4%(-7.03)#30 | 11.1%(-6.72)#2,540 |
| 31. | Shepherdstown | 4.5% | 11.4%(-6.90)#31 | 11.1%(-6.59)#2,658 |
| 32. | Vienna | 4.5% | 11.4%(-6.89)#32 | 11.1%(-6.57)#2,674 |
| 33. | Weirton | 4.6% | 11.4%(-6.79)#33 | 11.1%(-6.48)#2,791 |
| 34. | New Cumberland | 4.6% | 11.4%(-6.77)#34 | 11.1%(-6.45)#2,817 |
| 35. | Smithers | 4.8% | 11.4%(-6.62)#35 | 11.1%(-6.31)#2,940 |
| 36. | Glasgow | 4.8% | 11.4%(-6.62)#36 | 11.1%(-6.31)#2,941 |
| 37. | Rivesville | 4.9% | 11.4%(-6.50)#37 | 11.1%(-6.19)#3,066 |
| 38. | Stonewood | 4.9% | 11.4%(-6.47)#38 | 11.1%(-6.16)#3,099 |
| 39. | Fairlea | 5.0% | 11.4%(-6.35)#39 | 11.1%(-6.03)#3,252 |
| 40. | New Martinsville | 5.1% | 11.4%(-6.24)#40 | 11.1%(-5.92)#3,355 |
| 41. | Thomas | 5.2% | 11.4%(-6.21)#41 | 11.1%(-5.89)#3,382 |
| 42. | Williamstown | 5.2% | 11.4%(-6.15)#42 | 11.1%(-5.84)#3,424 |
| 43. | Mount Hope | 5.3% | 11.4%(-6.12)#43 | 11.1%(-5.80)#3,462 |
| 44. | Clendenin | 5.3% | 11.4%(-6.12)#44 | 11.1%(-5.80)#3,464 |
| 45. | Moundsville | 5.6% | 11.4%(-5.83)#45 | 11.1%(-5.51)#3,741 |
| 46. | Henderson | 5.6% | 11.4%(-5.83)#46 | 11.1%(-5.51)#3,796 |
| 47. | Nitro | 5.6% | 11.4%(-5.82)#47 | 11.1%(-5.50)#3,805 |
| 48. | Carpendale | 5.6% | 11.4%(-5.76)#48 | 11.1%(-5.45)#3,842 |
| 49. | Cross Lanes | 5.7% | 11.4%(-5.72)#49 | 11.1%(-5.40)#3,895 |
| 50. | Marmet | 5.7% | 11.4%(-5.67)#50 | 11.1%(-5.35)#3,929 |
| 51. | Glenville | 5.7% | 11.4%(-5.67)#51 | 11.1%(-5.35)#3,931 |
| 52. | Bridgeport | 5.9% | 11.4%(-5.45)#52 | 11.1%(-5.13)#4,183 |
| 53. | Cameron | 6.0% | 11.4%(-5.38)#53 | 11.1%(-5.07)#4,266 |
| 54. | Mason | 6.0% | 11.4%(-5.35)#54 | 11.1%(-5.03)#4,294 |
| 55. | Lewisburg | 6.1% | 11.4%(-5.27)#55 | 11.1%(-4.96)#4,372 |
| 56. | Mount Gay Shamrock | 6.2% | 11.4%(-5.23)#56 | 11.1%(-4.91)#4,427 |
| 57. | Mitchell Heights | 6.2% | 11.4%(-5.23)#57 | 11.1%(-4.91)#4,432 |
| 58. | Chester | 6.3% | 11.4%(-5.06)#58 | 11.1%(-4.75)#4,616 |
| 59. | Barboursville | 6.4% | 11.4%(-5.03)#59 | 11.1%(-4.71)#4,656 |
| 60. | Monongah | 6.4% | 11.4%(-4.97)#60 | 11.1%(-4.66)#4,714 |
| 61. | Addison Webster Springs | 6.6% | 11.4%(-4.82)#61 | 11.1%(-4.51)#4,868 |
| 62. | St Albans | 6.6% | 11.4%(-4.79)#62 | 11.1%(-4.47)#4,901 |
| 63. | Brandonville | 6.7% | 11.4%(-4.71)#63 | 11.1%(-4.40)#5,010 |
| 64. | Milton | 6.7% | 11.4%(-4.67)#64 | 11.1%(-4.36)#5,048 |
| 65. | Rowlesburg | 6.8% | 11.4%(-4.62)#65 | 11.1%(-4.31)#5,082 |
| 66. | White Sulphur Springs | 6.8% | 11.4%(-4.61)#66 | 11.1%(-4.30)#5,089 |
| 67. | Nutter Fort | 6.8% | 11.4%(-4.53)#67 | 11.1%(-4.22)#5,164 |
| 68. | Pea Ridge | 6.9% | 11.4%(-4.50)#68 | 11.1%(-4.19)#5,187 |
| 69. | Teays Valley | 7.0% | 11.4%(-4.40)#69 | 11.1%(-4.09)#5,315 |
| 70. | Middlebourne | 7.0% | 11.4%(-4.38)#70 | 11.1%(-4.07)#5,329 |
| 71. | Barrackville | 7.0% | 11.4%(-4.36)#71 | 11.1%(-4.05)#5,346 |
| 72. | Mcmechen | 7.1% | 11.4%(-4.30)#72 | 11.1%(-3.99)#5,396 |
| 73. | New Haven | 7.4% | 11.4%(-4.01)#73 | 11.1%(-3.70)#5,684 |
| 74. | Spencer | 7.5% | 11.4%(-3.85)#74 | 11.1%(-3.54)#5,848 |
| 75. | Harrisville | 8.0% | 11.4%(-3.42)#75 | 11.1%(-3.11)#6,231 |
| 76. | Pinch | 8.0% | 11.4%(-3.35)#76 | 11.1%(-3.03)#6,322 |
| 77. | Pleasant Valley | 8.2% | 11.4%(-3.20)#77 | 11.1%(-2.88)#6,456 |
| 78. | Jane Lew | 8.3% | 11.4%(-3.05)#78 | 11.1%(-2.73)#6,608 |
| 79. | Beckley | 8.4% | 11.4%(-3.02)#79 | 11.1%(-2.70)#6,679 |
| 80. | Richwood | 8.4% | 11.4%(-2.97)#80 | 11.1%(-2.66)#6,708 |
| 81. | Bethlehem | 8.4% | 11.4%(-2.94)#81 | 11.1%(-2.63)#6,737 |
| 82. | Mineralwells | 8.5% | 11.4%(-2.85)#82 | 11.1%(-2.53)#6,820 |
| 83. | Beverly | 8.9% | 11.4%(-2.45)#83 | 11.1%(-2.14)#7,188 |
| 84. | Hendricks | 9.0% | 11.4%(-2.43)#84 | 11.1%(-2.11)#7,215 |
| 85. | Elkins | 9.2% | 11.4%(-2.17)#85 | 11.1%(-1.85)#7,487 |
| 86. | Petersburg | 9.3% | 11.4%(-2.11)#86 | 11.1%(-1.80)#7,531 |
| 87. | Grantsville | 9.5% | 11.4%(-1.86)#87 | 11.1%(-1.54)#7,768 |
| 88. | Romney | 9.9% | 11.4%(-1.46)#88 | 11.1%(-1.14)#8,108 |
| 89. | Clarksburg | 10.0% | 11.4%(-1.38)#89 | 11.1%(-1.07)#8,141 |
| 90. | Ellenboro | 10.0% | 11.4%(-1.38)#90 | 11.1%(-1.07)#8,240 |
| 91. | Bluefield | 10.1% | 11.4%(-1.25)#91 | 11.1%(-0.938)#8,343 |
| 92. | Huntington | 10.3% | 11.4%(-1.11)#92 | 11.1%(-0.800)#8,463 |
| 93. | Culloden | 10.3% | 11.4%(-1.04)#93 | 11.1%(-0.722)#8,512 |
| 94. | Grant Town | 10.3% | 11.4%(-1.04)#94 | 11.1%(-0.722)#8,533 |
| 95. | Gassaway | 10.7% | 11.4%(-0.667)#95 | 11.1%(-0.353)#8,870 |
| 96. | South Charleston | 10.7% | 11.4%(-0.639)#96 | 11.1%(-0.325)#8,898 |
| 97. | Hilltop | 10.8% | 11.4%(-0.571)#97 | 11.1%(-0.256)#8,954 |
| 98. | Shady Spring | 10.9% | 11.4%(-0.512)#98 | 11.1%(-0.197)#9,007 |
| 99. | Sistersville | 10.9% | 11.4%(-0.484)#99 | 11.1%(-0.169)#9,027 |
| 100. | Eleanor | 11.1% | 11.4%(-0.326)#100 | 11.1%(-0.012)#9,144 |
Common Questions
What are the Top 10 Cities with the Lowest Poverty Level Among Seniors Over the Age of 75 in West Virginia?
Top 10 Cities with the Lowest Poverty Level Among Seniors Over the Age of 75 in West Virginia are:
#1
0.80%
#2
1.2%
#3
1.8%
#4
1.8%
#5
1.8%
#6
1.8%
#7
2.0%
#8
2.0%
#9
2.0%
#10
2.4%
What city has the Lowest Poverty Level Among Seniors Over the Age of 75 in West Virginia?
Star City has the Lowest Poverty Level Among Seniors Over the Age of 75 in West Virginia with 0.80%.
What is the Poverty Level Among Seniors Over the Age of 75 in the State of West Virginia?
Poverty Level Among Seniors Over the Age of 75 in West Virginia is 11.4%.
What is the Poverty Level Among Seniors Over the Age of 75 in the United States?
Poverty Level Among Seniors Over the Age of 75 in the United States is 11.1%.