Cities with the Lowest Poverty Level Among Seniors Over the Age of 75 in Idaho
RELATED REPORTS & OPTIONS
Lowest Poverty | Seniors 75+
Idaho
Compare Cities
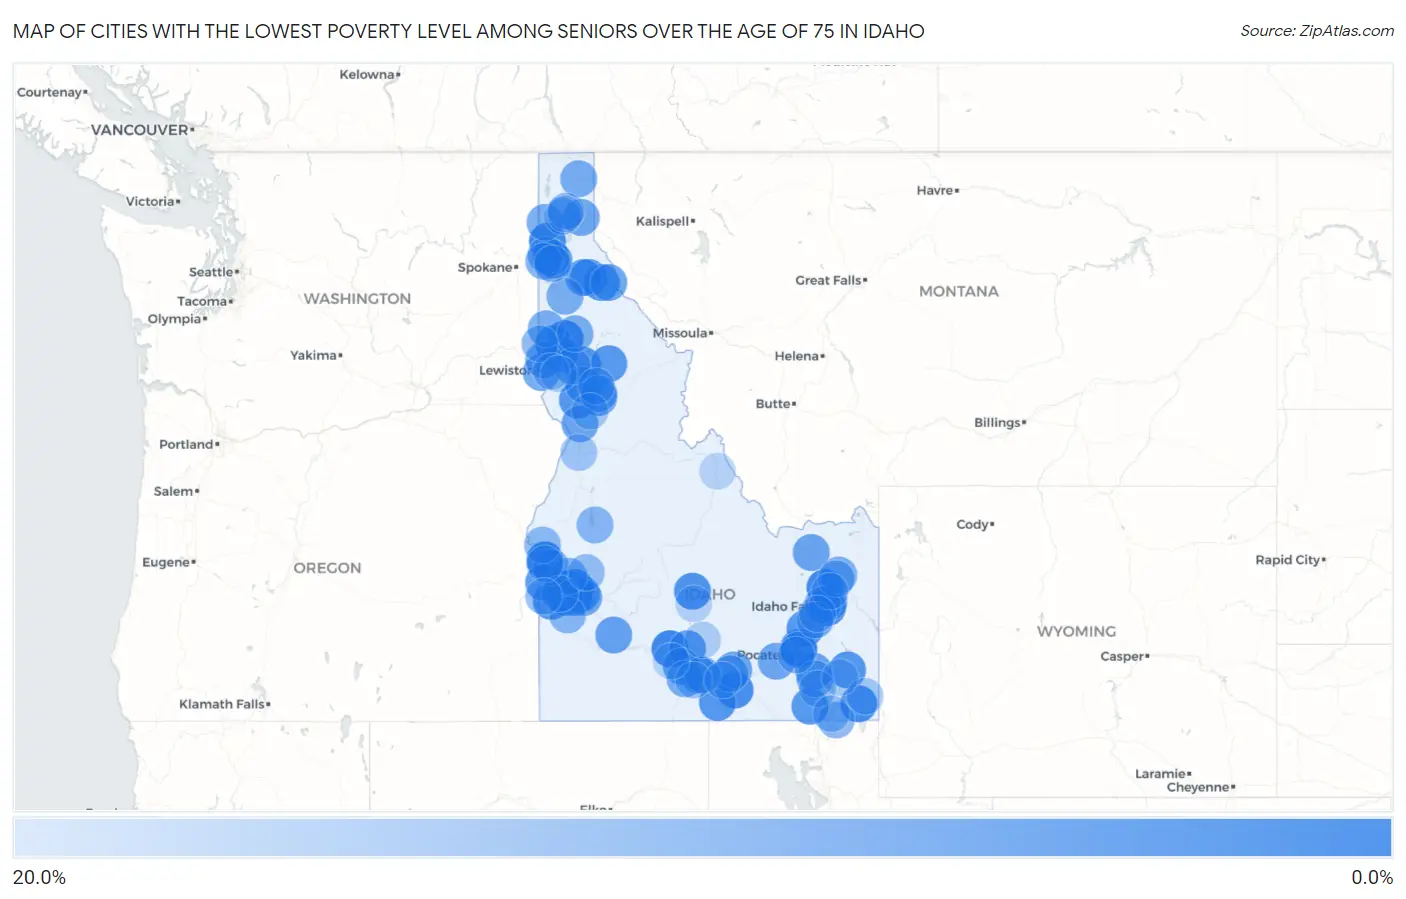
Map of Cities with the Lowest Poverty Level Among Seniors Over the Age of 75 in Idaho
20.0%
0.0%
Cities with the Lowest Poverty Level Among Seniors Over the Age of 75 in Idaho
| City | Senior Poverty | vs State | vs National | |
| 1. | Payette | 1.6% | 9.3%(-7.70)#1 | 11.1%(-9.47)#337 |
| 2. | Gooding | 2.7% | 9.3%(-6.58)#2 | 11.1%(-8.36)#1,014 |
| 3. | Menan | 2.8% | 9.3%(-6.52)#3 | 11.1%(-8.29)#1,063 |
| 4. | Deary | 2.8% | 9.3%(-6.52)#4 | 11.1%(-8.29)#1,065 |
| 5. | Spirit Lake | 2.8% | 9.3%(-6.49)#5 | 11.1%(-8.26)#1,084 |
| 6. | Eagle | 2.8% | 9.3%(-6.49)#6 | 11.1%(-8.26)#1,088 |
| 7. | Albion | 3.6% | 9.3%(-5.66)#7 | 11.1%(-7.43)#1,810 |
| 8. | Middleton | 4.2% | 9.3%(-5.05)#8 | 11.1%(-6.82)#2,420 |
| 9. | Dalton Gardens | 4.3% | 9.3%(-5.04)#9 | 11.1%(-6.81)#2,435 |
| 10. | Ammon | 4.3% | 9.3%(-5.03)#10 | 11.1%(-6.80)#2,450 |
| 11. | Paris | 4.3% | 9.3%(-4.95)#11 | 11.1%(-6.72)#2,529 |
| 12. | Star | 4.6% | 9.3%(-4.65)#12 | 11.1%(-6.42)#2,850 |
| 13. | Sun Valley | 4.7% | 9.3%(-4.64)#13 | 11.1%(-6.42)#2,856 |
| 14. | Orofino | 4.9% | 9.3%(-4.43)#14 | 11.1%(-6.20)#3,060 |
| 15. | Eden | 5.0% | 9.3%(-4.29)#15 | 11.1%(-6.07)#3,211 |
| 16. | Kellogg | 5.3% | 9.3%(-3.98)#16 | 11.1%(-5.76)#3,533 |
| 17. | Soda Springs | 5.6% | 9.3%(-3.64)#17 | 11.1%(-5.42)#3,871 |
| 18. | Oakley | 5.8% | 9.3%(-3.50)#18 | 11.1%(-5.27)#4,024 |
| 19. | Tyhee | 5.9% | 9.3%(-3.41)#19 | 11.1%(-5.18)#4,106 |
| 20. | Cottonwood | 5.9% | 9.3%(-3.41)#20 | 11.1%(-5.18)#4,108 |
| 21. | Meridian | 5.9% | 9.3%(-3.37)#21 | 11.1%(-5.14)#4,171 |
| 22. | Marsing | 5.9% | 9.3%(-3.37)#22 | 11.1%(-5.14)#4,176 |
| 23. | Troy | 6.1% | 9.3%(-3.23)#23 | 11.1%(-5.01)#4,315 |
| 24. | Pierce | 6.1% | 9.3%(-3.20)#24 | 11.1%(-4.97)#4,369 |
| 25. | Parma | 6.2% | 9.3%(-3.09)#25 | 11.1%(-4.87)#4,467 |
| 26. | Malad City | 6.2% | 9.3%(-3.07)#26 | 11.1%(-4.84)#4,487 |
| 27. | Blackfoot | 6.3% | 9.3%(-2.95)#27 | 11.1%(-4.72)#4,637 |
| 28. | Wallace | 6.5% | 9.3%(-2.77)#28 | 11.1%(-4.55)#4,840 |
| 29. | Hayden | 6.5% | 9.3%(-2.75)#29 | 11.1%(-4.52)#4,858 |
| 30. | Shoshone | 6.9% | 9.3%(-2.40)#30 | 11.1%(-4.17)#5,205 |
| 31. | Kendrick | 6.9% | 9.3%(-2.40)#31 | 11.1%(-4.17)#5,240 |
| 32. | Nezperce | 7.0% | 9.3%(-2.28)#32 | 11.1%(-4.05)#5,350 |
| 33. | Mountain Home | 7.9% | 9.3%(-1.39)#33 | 11.1%(-3.16)#6,193 |
| 34. | Garden City | 8.0% | 9.3%(-1.29)#34 | 11.1%(-3.06)#6,301 |
| 35. | Jerome | 8.1% | 9.3%(-1.21)#35 | 11.1%(-2.99)#6,358 |
| 36. | Mccammon | 8.3% | 9.3%(-0.961)#36 | 11.1%(-2.73)#6,586 |
| 37. | Stites | 8.3% | 9.3%(-0.961)#37 | 11.1%(-2.73)#6,654 |
| 38. | Pinehurst | 8.6% | 9.3%(-0.705)#38 | 11.1%(-2.48)#6,876 |
| 39. | Dubois | 8.7% | 9.3%(-0.599)#39 | 11.1%(-2.37)#6,967 |
| 40. | Nampa | 8.8% | 9.3%(-0.492)#40 | 11.1%(-2.27)#7,072 |
| 41. | Mullan | 8.9% | 9.3%(-0.433)#41 | 11.1%(-2.21)#7,127 |
| 42. | Acequia | 9.1% | 9.3%(-0.203)#42 | 11.1%(-1.98)#7,382 |
| 43. | White Bird | 9.1% | 9.3%(-0.203)#43 | 11.1%(-1.98)#7,404 |
| 44. | Boise City | 9.2% | 9.3%(-0.107)#44 | 11.1%(-1.88)#7,462 |
| 45. | Iona | 9.3% | 9.3%(+0.008)#45 | 11.1%(-1.76)#7,553 |
| 46. | Lewiston | 9.5% | 9.3%(+0.196)#46 | 11.1%(-1.58)#7,716 |
| 47. | Rupert | 9.5% | 9.3%(+0.212)#47 | 11.1%(-1.56)#7,725 |
| 48. | East Hope | 9.5% | 9.3%(+0.230)#48 | 11.1%(-1.54)#7,779 |
| 49. | American Falls | 9.6% | 9.3%(+0.349)#49 | 11.1%(-1.42)#7,868 |
| 50. | Chubbuck | 9.8% | 9.3%(+0.479)#50 | 11.1%(-1.29)#8,009 |
| 51. | Idaho Falls | 9.8% | 9.3%(+0.529)#51 | 11.1%(-1.24)#8,047 |
| 52. | Basalt | 10.0% | 9.3%(+0.706)#52 | 11.1%(-1.07)#8,200 |
| 53. | Peck | 10.0% | 9.3%(+0.706)#53 | 11.1%(-1.07)#8,248 |
| 54. | Rathdrum | 10.1% | 9.3%(+0.825)#54 | 11.1%(-0.948)#8,330 |
| 55. | Kooskia | 10.2% | 9.3%(+0.910)#55 | 11.1%(-0.863)#8,399 |
| 56. | Priest River | 10.4% | 9.3%(+1.14)#56 | 11.1%(-0.637)#8,604 |
| 57. | Genesee | 10.5% | 9.3%(+1.23)#57 | 11.1%(-0.541)#8,694 |
| 58. | Bonners Ferry | 10.7% | 9.3%(+1.36)#58 | 11.1%(-0.411)#8,823 |
| 59. | Twin Falls | 10.8% | 9.3%(+1.47)#59 | 11.1%(-0.307)#8,915 |
| 60. | Potlatch | 10.9% | 9.3%(+1.61)#60 | 11.1%(-0.158)#9,039 |
| 61. | St Maries | 11.1% | 9.3%(+1.82)#61 | 11.1%(+0.044)#9,178 |
| 62. | Arimo | 11.1% | 9.3%(+1.82)#62 | 11.1%(+0.044)#9,260 |
| 63. | Bovill | 11.1% | 9.3%(+1.82)#63 | 11.1%(+0.044)#9,289 |
| 64. | Sugar City | 11.5% | 9.3%(+2.24)#64 | 11.1%(+0.472)#9,579 |
| 65. | Rexburg | 11.6% | 9.3%(+2.28)#65 | 11.1%(+0.511)#9,614 |
| 66. | Post Falls | 11.9% | 9.3%(+2.61)#66 | 11.1%(+0.838)#9,879 |
| 67. | Hazelton | 12.0% | 9.3%(+2.71)#67 | 11.1%(+0.933)#9,948 |
| 68. | Emmett | 12.0% | 9.3%(+2.73)#68 | 11.1%(+0.958)#9,976 |
| 69. | Coeur D Alene | 12.3% | 9.3%(+3.02)#69 | 11.1%(+1.25)#10,174 |
| 70. | New Plymouth | 12.8% | 9.3%(+3.47)#70 | 11.1%(+1.70)#10,591 |
| 71. | Franklin | 12.8% | 9.3%(+3.53)#71 | 11.1%(+1.75)#10,639 |
| 72. | Dover | 12.8% | 9.3%(+3.53)#72 | 11.1%(+1.75)#10,641 |
| 73. | Ponderay | 12.9% | 9.3%(+3.61)#73 | 11.1%(+1.84)#10,692 |
| 74. | Melba | 13.0% | 9.3%(+3.75)#74 | 11.1%(+1.98)#10,800 |
| 75. | Moscow | 13.3% | 9.3%(+4.03)#75 | 11.1%(+2.26)#10,985 |
| 76. | Cascade | 13.3% | 9.3%(+4.04)#76 | 11.1%(+2.27)#10,997 |
| 77. | Pocatello | 13.3% | 9.3%(+4.05)#77 | 11.1%(+2.28)#11,061 |
| 78. | Caldwell | 13.4% | 9.3%(+4.07)#78 | 11.1%(+2.30)#11,069 |
| 79. | Kamiah | 13.4% | 9.3%(+4.12)#79 | 11.1%(+2.35)#11,097 |
| 80. | Weiser | 13.6% | 9.3%(+4.27)#80 | 11.1%(+2.50)#11,186 |
| 81. | Fruitland | 14.3% | 9.3%(+5.04)#81 | 11.1%(+3.26)#11,757 |
| 82. | Homedale | 14.4% | 9.3%(+5.13)#82 | 11.1%(+3.36)#11,794 |
| 83. | Downey | 14.8% | 9.3%(+5.52)#83 | 11.1%(+3.75)#12,042 |
| 84. | Horseshoe Bend | 14.9% | 9.3%(+5.56)#84 | 11.1%(+3.78)#12,067 |
| 85. | Preston | 15.1% | 9.3%(+5.80)#85 | 11.1%(+4.02)#12,196 |
| 86. | Hansen | 16.0% | 9.3%(+6.74)#86 | 11.1%(+4.97)#12,711 |
| 87. | Rigby | 16.2% | 9.3%(+6.94)#87 | 11.1%(+5.16)#12,806 |
| 88. | Riggins | 16.3% | 9.3%(+6.98)#88 | 11.1%(+5.21)#12,833 |
| 89. | Lapwai | 16.3% | 9.3%(+7.03)#89 | 11.1%(+5.26)#12,848 |
| 90. | Grangeville | 17.1% | 9.3%(+7.81)#90 | 11.1%(+6.04)#13,282 |
| 91. | Montpelier | 17.2% | 9.3%(+7.91)#91 | 11.1%(+6.14)#13,329 |
| 92. | Burley | 17.6% | 9.3%(+8.31)#92 | 11.1%(+6.53)#13,492 |
| 93. | Shelley | 17.7% | 9.3%(+8.44)#93 | 11.1%(+6.67)#13,580 |
| 94. | Culdesac | 17.9% | 9.3%(+8.56)#94 | 11.1%(+6.79)#13,643 |
| 95. | Richfield | 18.5% | 9.3%(+9.22)#95 | 11.1%(+7.45)#13,949 |
| 96. | Grace | 18.8% | 9.3%(+9.46)#96 | 11.1%(+7.68)#14,028 |
| 97. | Sandpoint | 19.0% | 9.3%(+9.66)#97 | 11.1%(+7.88)#14,119 |
| 98. | Hailey | 19.3% | 9.3%(+10.0)#98 | 11.1%(+8.25)#14,275 |
| 99. | Wendell | 19.6% | 9.3%(+10.3)#99 | 11.1%(+8.53)#14,382 |
| 100. | Salmon | 20.0% | 9.3%(+10.7)#100 | 11.1%(+8.93)#14,494 |
Common Questions
What are the Top 10 Cities with the Lowest Poverty Level Among Seniors Over the Age of 75 in Idaho?
Top 10 Cities with the Lowest Poverty Level Among Seniors Over the Age of 75 in Idaho are:
#1
1.6%
#2
2.7%
#3
2.8%
#4
2.8%
#5
2.8%
#6
2.8%
#7
3.6%
#8
4.2%
#9
4.3%
#10
4.3%
What city has the Lowest Poverty Level Among Seniors Over the Age of 75 in Idaho?
Payette has the Lowest Poverty Level Among Seniors Over the Age of 75 in Idaho with 1.6%.
What is the Poverty Level Among Seniors Over the Age of 75 in the State of Idaho?
Poverty Level Among Seniors Over the Age of 75 in Idaho is 9.3%.
What is the Poverty Level Among Seniors Over the Age of 75 in the United States?
Poverty Level Among Seniors Over the Age of 75 in the United States is 11.1%.