East Foothills, CA Map & Demographics
East Foothills Map
East Foothills Overview
$65,823
PER CAPITA INCOME
$180,969
AVG FAMILY INCOME
$179,891
AVG HOUSEHOLD INCOME
9.7%
WAGE / INCOME GAP [ % ]
90.3¢/ $1
WAGE / INCOME GAP [ $ ]
0.41
INEQUALITY / GINI INDEX
8,270
TOTAL POPULATION
4,522
MALE POPULATION
3,748
FEMALE POPULATION
120.65
MALES / 100 FEMALES
82.88
FEMALES / 100 MALES
44.3
MEDIAN AGE
3.6
AVG FAMILY SIZE
3.4
AVG HOUSEHOLD SIZE
4,606
LABOR FORCE [ PEOPLE ]
65.6%
PERCENT IN LABOR FORCE
3.2%
UNEMPLOYMENT RATE
Income in East Foothills
Income Overview in East Foothills
Per Capita Income in East Foothills is $65,823, while median incomes of families and households are $180,969 and $179,891 respectively.
| Characteristic | Number | Measure |
| Per Capita Income | 8,270 | $65,823 |
| Median Family Income | 2,000 | $180,969 |
| Mean Family Income | 2,000 | $223,919 |
| Median Household Income | 2,372 | $179,891 |
| Mean Household Income | 2,372 | $223,234 |
| Income Deficit | 2,000 | $0 |
| Wage / Income Gap (%) | 8,270 | 9.71% |
| Wage / Income Gap ($) | 8,270 | 90.29¢ per $1 |
| Gini / Inequality Index | 8,270 | 0.41 |
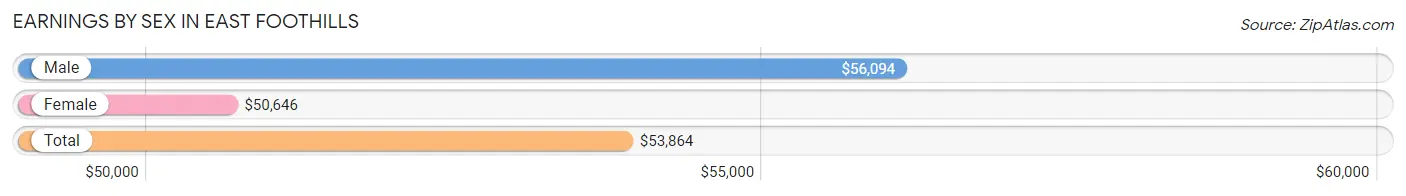
Earnings by Sex in East Foothills
Average Earnings in East Foothills are $53,864, $56,094 for men and $50,646 for women, a difference of 9.7%.
| Sex | Number | Average Earnings |
| Male | 2,609 (55.6%) | $56,094 |
| Female | 2,081 (44.4%) | $50,646 |
| Total | 4,690 (100.0%) | $53,864 |
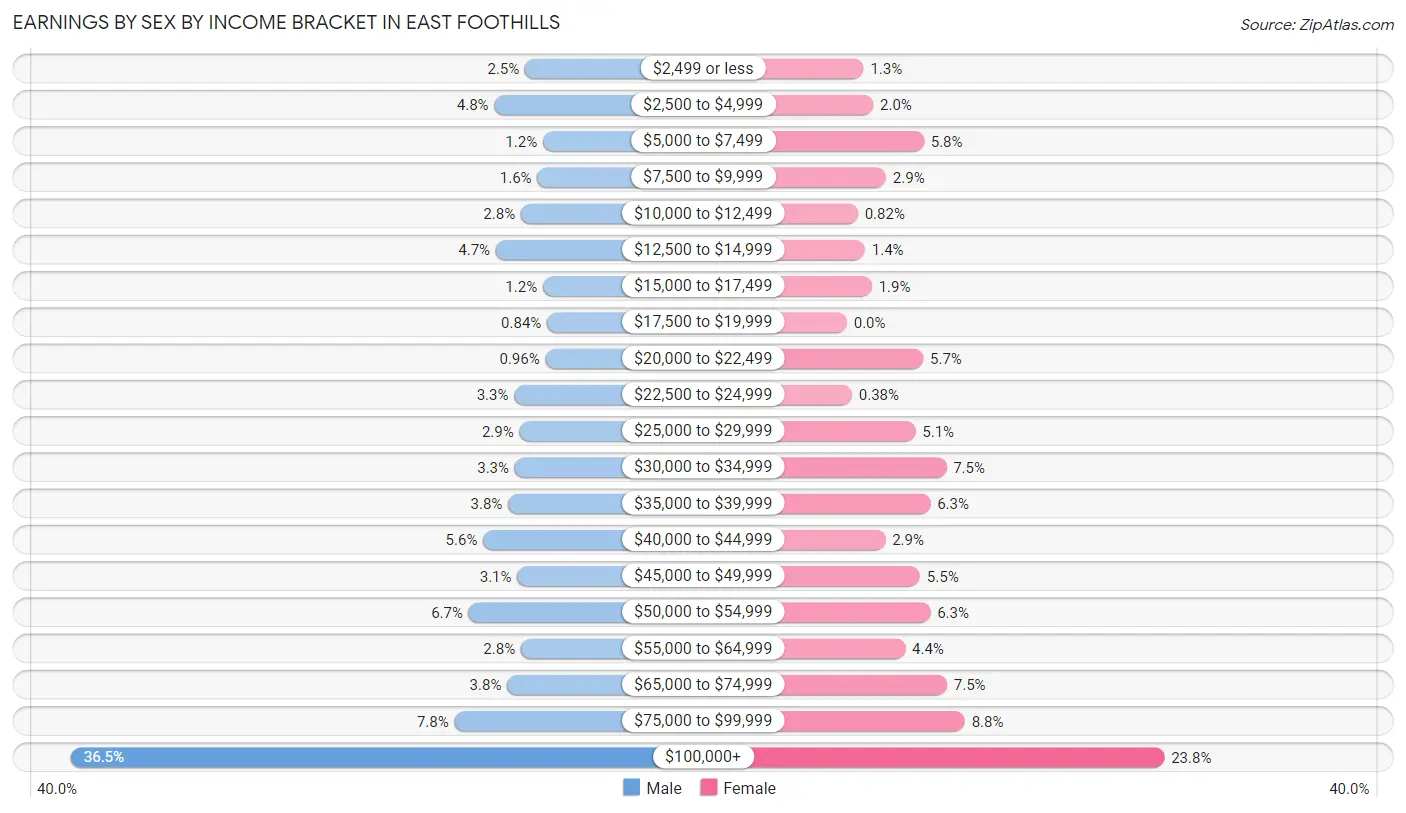
Earnings by Sex by Income Bracket in East Foothills
The most common earnings brackets in East Foothills are $100,000+ for men (953 | 36.5%) and $100,000+ for women (495 | 23.8%).
| Income | Male | Female |
| $2,499 or less | 65 (2.5%) | 26 (1.3%) |
| $2,500 to $4,999 | 125 (4.8%) | 41 (2.0%) |
| $5,000 to $7,499 | 30 (1.1%) | 120 (5.8%) |
| $7,500 to $9,999 | 41 (1.6%) | 61 (2.9%) |
| $10,000 to $12,499 | 73 (2.8%) | 17 (0.8%) |
| $12,500 to $14,999 | 122 (4.7%) | 28 (1.3%) |
| $15,000 to $17,499 | 30 (1.1%) | 39 (1.9%) |
| $17,500 to $19,999 | 22 (0.8%) | 0 (0.0%) |
| $20,000 to $22,499 | 25 (1.0%) | 119 (5.7%) |
| $22,500 to $24,999 | 86 (3.3%) | 8 (0.4%) |
| $25,000 to $29,999 | 76 (2.9%) | 107 (5.1%) |
| $30,000 to $34,999 | 85 (3.3%) | 155 (7.4%) |
| $35,000 to $39,999 | 98 (3.8%) | 130 (6.2%) |
| $40,000 to $44,999 | 147 (5.6%) | 60 (2.9%) |
| $45,000 to $49,999 | 80 (3.1%) | 114 (5.5%) |
| $50,000 to $54,999 | 175 (6.7%) | 130 (6.2%) |
| $55,000 to $64,999 | 73 (2.8%) | 91 (4.4%) |
| $65,000 to $74,999 | 100 (3.8%) | 156 (7.5%) |
| $75,000 to $99,999 | 203 (7.8%) | 184 (8.8%) |
| $100,000+ | 953 (36.5%) | 495 (23.8%) |
| Total | 2,609 (100.0%) | 2,081 (100.0%) |
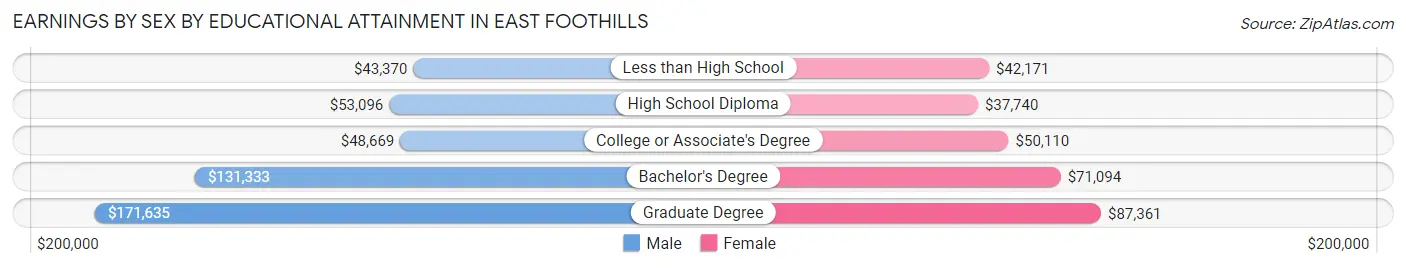
Earnings by Sex by Educational Attainment in East Foothills
Average earnings in East Foothills are $78,693 for men and $54,093 for women, a difference of 31.3%. Men with an educational attainment of graduate degree enjoy the highest average annual earnings of $171,635, while those with less than high school education earn the least with $43,370. Women with an educational attainment of graduate degree earn the most with the average annual earnings of $87,361, while those with high school diploma education have the smallest earnings of $37,740.
| Educational Attainment | Male Income | Female Income |
| Less than High School | $43,370 | $42,171 |
| High School Diploma | $53,096 | $37,740 |
| College or Associate's Degree | $48,669 | $50,110 |
| Bachelor's Degree | $131,333 | $71,094 |
| Graduate Degree | $171,635 | $87,361 |
| Total | $78,693 | $54,093 |
Family Income in East Foothills
Family Income Brackets in East Foothills
According to the East Foothills family income data, there are 836 families falling into the $200,000+ income range, which is the most common income bracket and makes up 41.8% of all families.
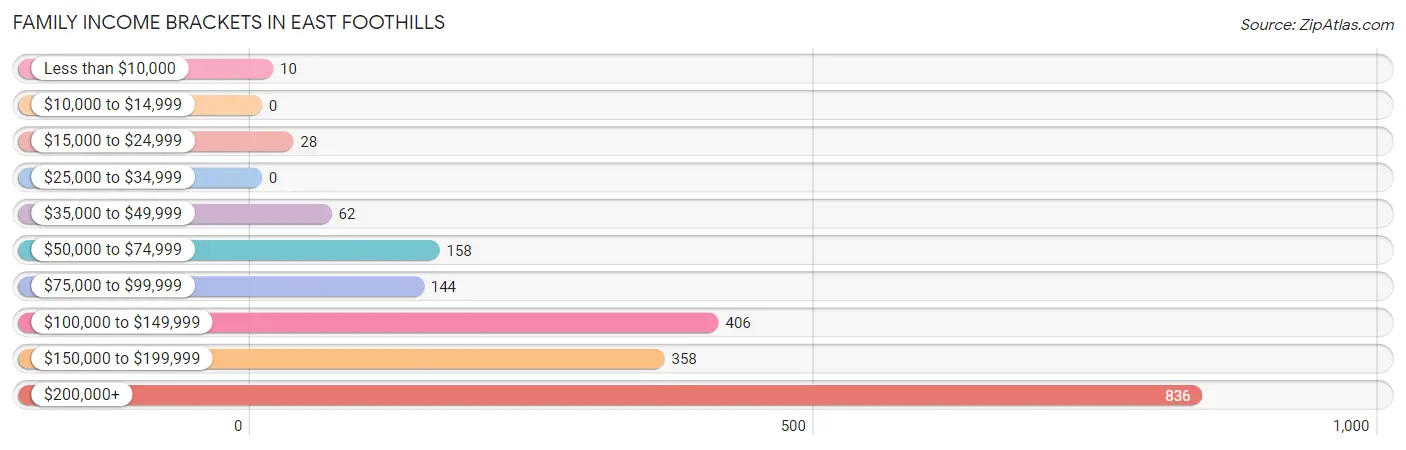
| Income Bracket | # Families | % Families |
| Less than $10,000 | 10 | 0.5% |
| $10,000 to $14,999 | 0 | 0.0% |
| $15,000 to $24,999 | 28 | 1.4% |
| $25,000 to $34,999 | 0 | 0.0% |
| $35,000 to $49,999 | 62 | 3.1% |
| $50,000 to $74,999 | 158 | 7.9% |
| $75,000 to $99,999 | 144 | 7.2% |
| $100,000 to $149,999 | 406 | 20.3% |
| $150,000 to $199,999 | 358 | 17.9% |
| $200,000+ | 836 | 41.8% |
Family Income by Famaliy Size in East Foothills
6-person families (169 | 8.5%) account for the highest median family income in East Foothills with $250,001 per family, while 2-person families (576 | 28.8%) have the highest median income of $82,500 per family member.
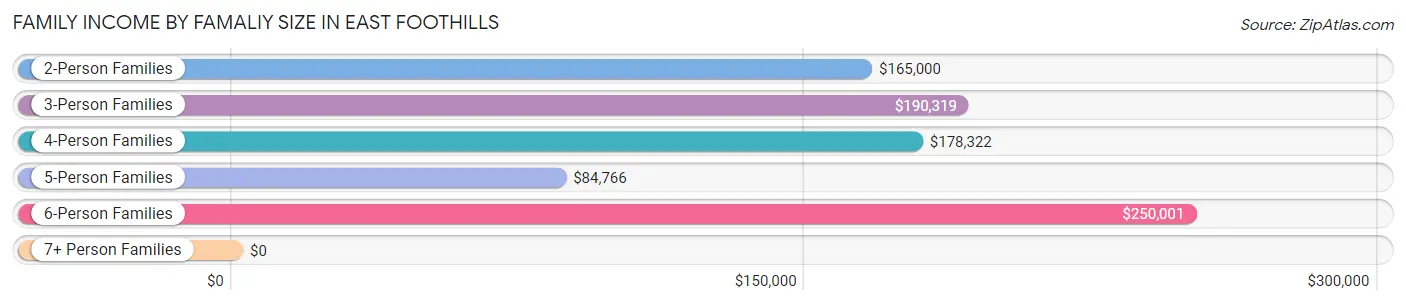
| Income Bracket | # Families | Median Income |
| 2-Person Families | 576 (28.8%) | $165,000 |
| 3-Person Families | 584 (29.2%) | $190,319 |
| 4-Person Families | 471 (23.5%) | $178,322 |
| 5-Person Families | 185 (9.2%) | $84,766 |
| 6-Person Families | 169 (8.5%) | $250,001 |
| 7+ Person Families | 15 (0.7%) | $0 |
| Total | 2,000 (100.0%) | $180,969 |
Family Income by Number of Earners in East Foothills
The median family income in East Foothills is $180,969, with families comprising 2 earners (897) having the highest median family income of $204,125, while families with no earners (219) have the lowest median family income of $67,019, accounting for 44.9% and 11.0% of families, respectively.
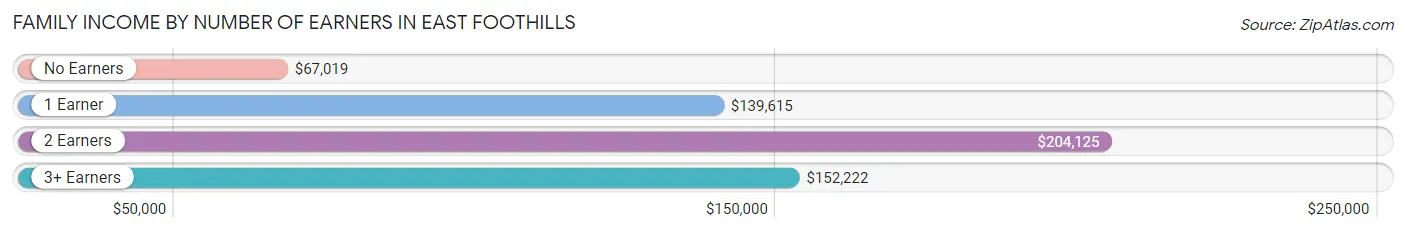
| Number of Earners | # Families | Median Income |
| No Earners | 219 (11.0%) | $67,019 |
| 1 Earner | 400 (20.0%) | $139,615 |
| 2 Earners | 897 (44.9%) | $204,125 |
| 3+ Earners | 484 (24.2%) | $152,222 |
| Total | 2,000 (100.0%) | $180,969 |
Household Income in East Foothills
Household Income Brackets in East Foothills
With 968 households falling in the category, the $200,000+ income range is the most frequent in East Foothills, accounting for 40.8% of all households.
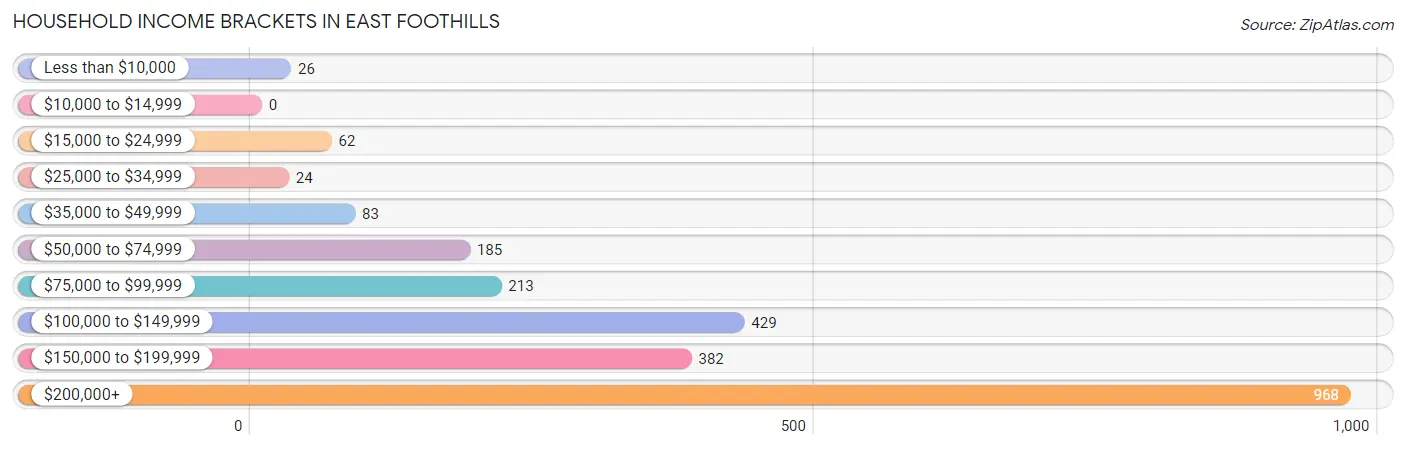
| Income Bracket | # Households | % Households |
| Less than $10,000 | 26 | 1.1% |
| $10,000 to $14,999 | 0 | 0.0% |
| $15,000 to $24,999 | 62 | 2.6% |
| $25,000 to $34,999 | 24 | 1.0% |
| $35,000 to $49,999 | 83 | 3.5% |
| $50,000 to $74,999 | 185 | 7.8% |
| $75,000 to $99,999 | 213 | 9.0% |
| $100,000 to $149,999 | 429 | 18.1% |
| $150,000 to $199,999 | 382 | 16.1% |
| $200,000+ | 968 | 40.8% |
Household Income by Householder Age in East Foothills
The median household income in East Foothills is $179,891, with the highest median household income of $224,125 found in the 25 to 44 years age bracket for the primary householder. A total of 421 households (17.7%) fall into this category.
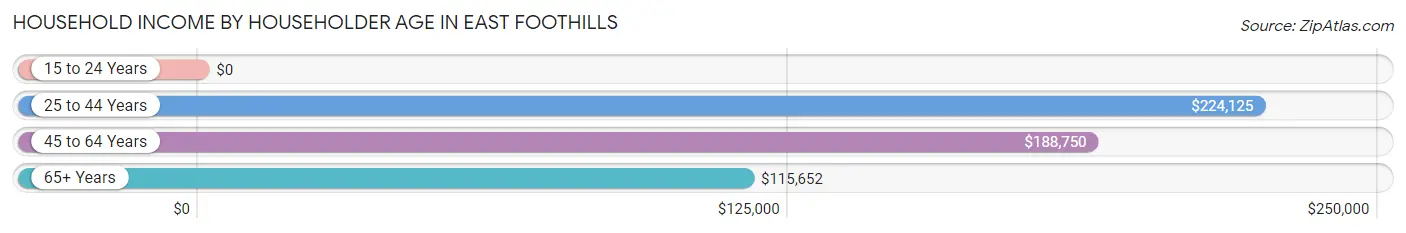
| Income Bracket | # Households | Median Income |
| 15 to 24 Years | 0 (0.0%) | $0 |
| 25 to 44 Years | 421 (17.7%) | $224,125 |
| 45 to 64 Years | 1,375 (58.0%) | $188,750 |
| 65+ Years | 576 (24.3%) | $115,652 |
| Total | 2,372 (100.0%) | $179,891 |
Poverty in East Foothills
Income Below Poverty by Sex and Age in East Foothills
With 6.6% poverty level for males and 2.0% for females among the residents of East Foothills, 35 to 44 year old males and 18 to 24 year old females are the most vulnerable to poverty, with 63 males (15.0%) and 22 females (10.4%) in their respective age groups living below the poverty level.
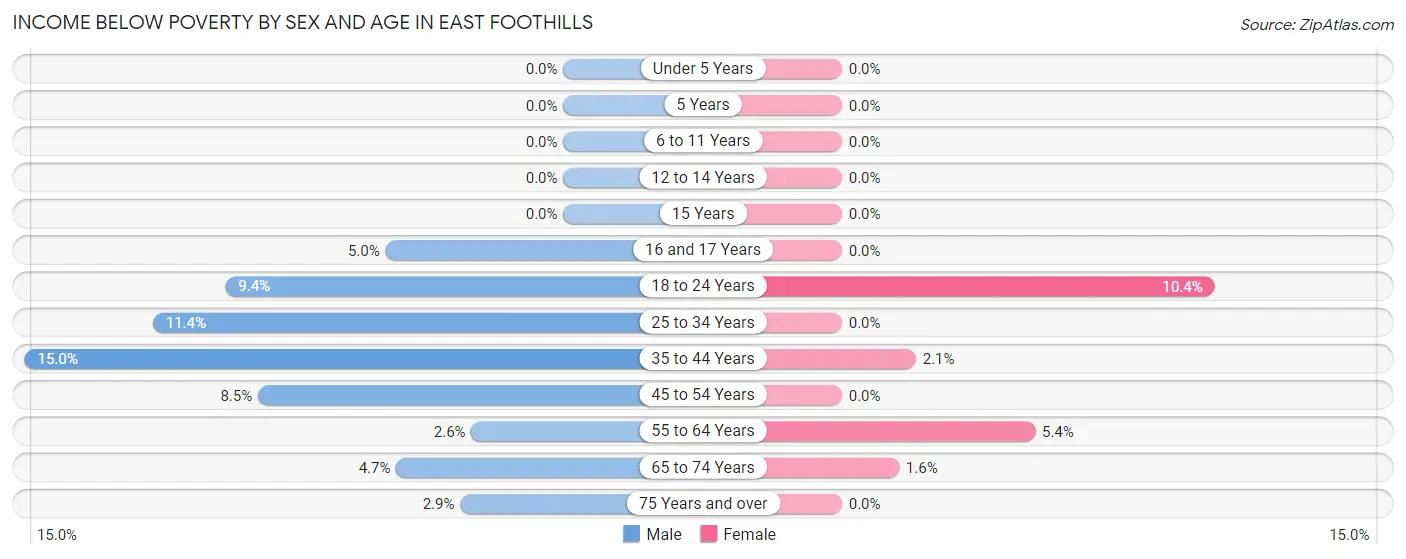
| Age Bracket | Male | Female |
| Under 5 Years | 0 (0.0%) | 0 (0.0%) |
| 5 Years | 0 (0.0%) | 0 (0.0%) |
| 6 to 11 Years | 0 (0.0%) | 0 (0.0%) |
| 12 to 14 Years | 0 (0.0%) | 0 (0.0%) |
| 15 Years | 0 (0.0%) | 0 (0.0%) |
| 16 and 17 Years | 10 (5.0%) | 0 (0.0%) |
| 18 to 24 Years | 40 (9.4%) | 22 (10.4%) |
| 25 to 34 Years | 76 (11.4%) | 0 (0.0%) |
| 35 to 44 Years | 63 (15.0%) | 10 (2.1%) |
| 45 to 54 Years | 62 (8.5%) | 0 (0.0%) |
| 55 to 64 Years | 19 (2.6%) | 37 (5.4%) |
| 65 to 74 Years | 21 (4.6%) | 7 (1.6%) |
| 75 Years and over | 6 (2.9%) | 0 (0.0%) |
| Total | 297 (6.6%) | 76 (2.0%) |
Income Above Poverty by Sex and Age in East Foothills
According to the poverty statistics in East Foothills, males aged under 5 years and females aged under 5 years are the age groups that are most secure financially, with 100.0% of males and 100.0% of females in these age groups living above the poverty line.
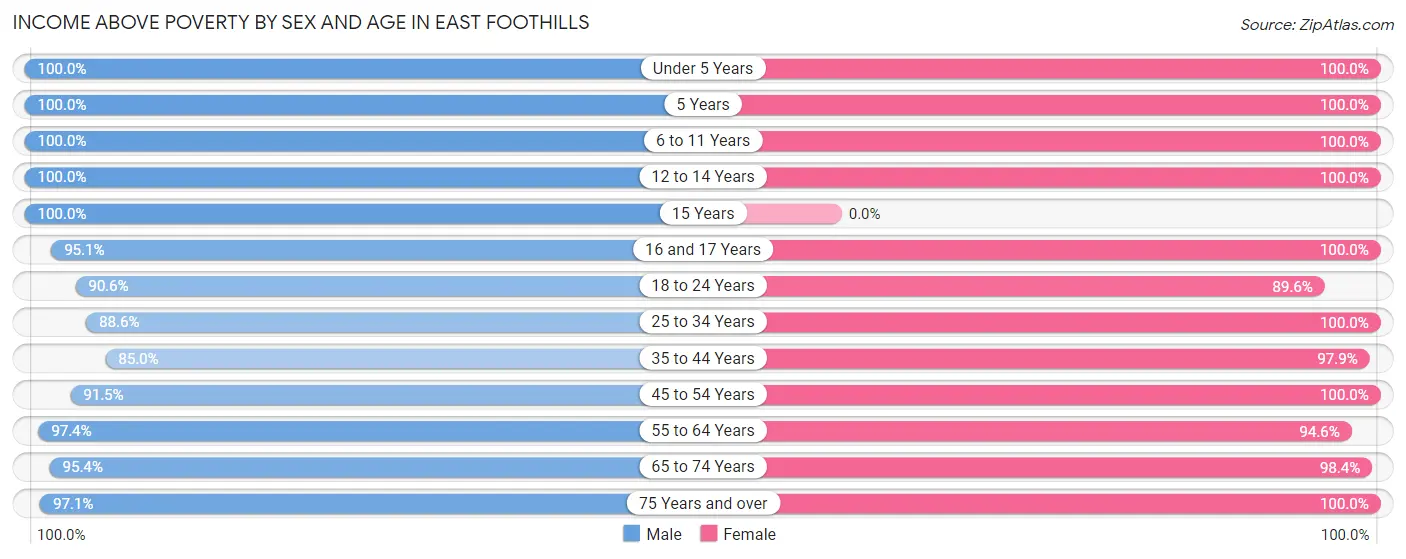
| Age Bracket | Male | Female |
| Under 5 Years | 160 (100.0%) | 135 (100.0%) |
| 5 Years | 53 (100.0%) | 20 (100.0%) |
| 6 to 11 Years | 281 (100.0%) | 213 (100.0%) |
| 12 to 14 Years | 108 (100.0%) | 204 (100.0%) |
| 15 Years | 59 (100.0%) | 0 (0.0%) |
| 16 and 17 Years | 192 (95.1%) | 111 (100.0%) |
| 18 to 24 Years | 385 (90.6%) | 190 (89.6%) |
| 25 to 34 Years | 589 (88.6%) | 442 (100.0%) |
| 35 to 44 Years | 357 (85.0%) | 476 (97.9%) |
| 45 to 54 Years | 667 (91.5%) | 568 (100.0%) |
| 55 to 64 Years | 722 (97.4%) | 651 (94.6%) |
| 65 to 74 Years | 431 (95.4%) | 432 (98.4%) |
| 75 Years and over | 203 (97.1%) | 230 (100.0%) |
| Total | 4,207 (93.4%) | 3,672 (98.0%) |
Income Below Poverty Among Married-Couple Families in East Foothills
The poverty statistics for married-couple families in East Foothills show that 0.4% or 7 of the total 1,606 families live below the poverty line. Families with no children have the highest poverty rate of 0.9%, comprising of 7 families. On the other hand, families with 1 or 2 children have the lowest poverty rate of 0.0%, which includes 0 families.
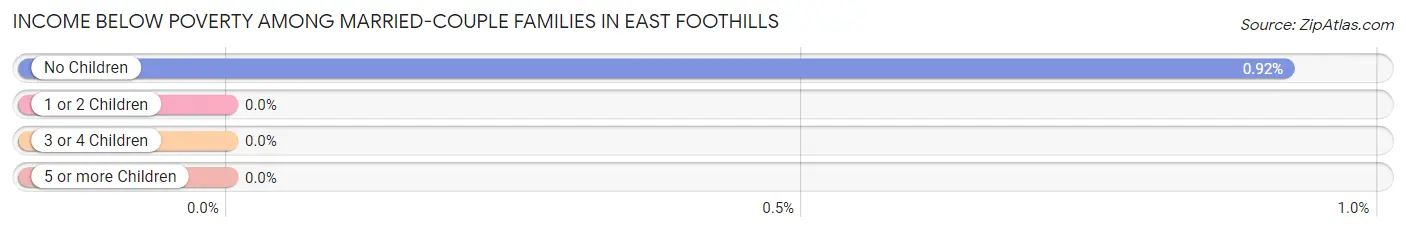
| Children | Above Poverty | Below Poverty |
| No Children | 751 (99.1%) | 7 (0.9%) |
| 1 or 2 Children | 732 (100.0%) | 0 (0.0%) |
| 3 or 4 Children | 116 (100.0%) | 0 (0.0%) |
| 5 or more Children | 0 (0.0%) | 0 (0.0%) |
| Total | 1,599 (99.6%) | 7 (0.4%) |
Income Below Poverty Among Single-Parent Households in East Foothills
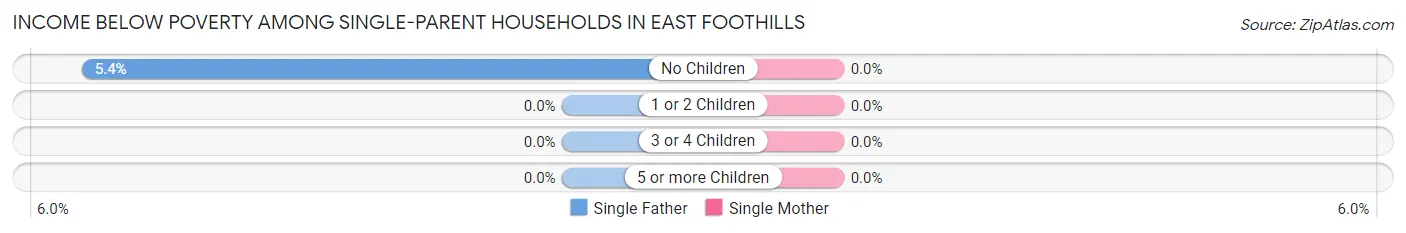
| Children | Single Father | Single Mother |
| No Children | 3 (5.4%) | 0 (0.0%) |
| 1 or 2 Children | 0 (0.0%) | 0 (0.0%) |
| 3 or 4 Children | 0 (0.0%) | 0 (0.0%) |
| 5 or more Children | 0 (0.0%) | 0 (0.0%) |
| Total | 3 (1.8%) | 0 (0.0%) |
Income Below Poverty Among Married-Couple vs Single-Parent Households in East Foothills
The poverty data for East Foothills shows that 7 of the married-couple family households (0.4%) and 3 of the single-parent households (0.8%) are living below the poverty level. Within the married-couple family households, those with no children have the highest poverty rate, with 7 households (0.9%) falling below the poverty line. Among the single-parent households, those with no children have the highest poverty rate, with 3 household (1.1%) living below poverty.
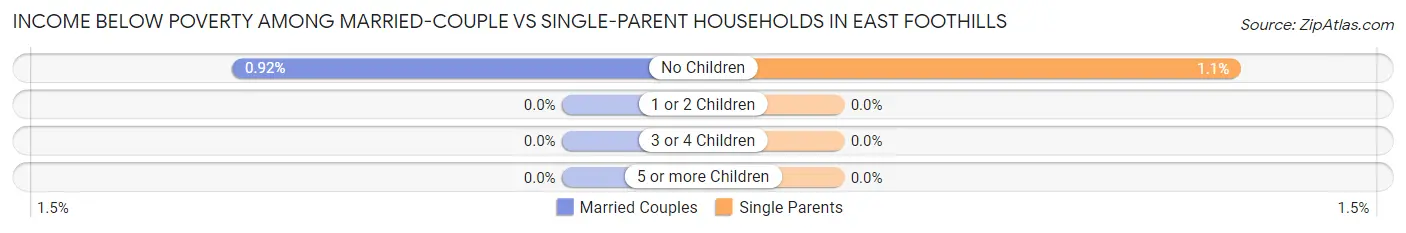
| Children | Married-Couple Families | Single-Parent Households |
| No Children | 7 (0.9%) | 3 (1.1%) |
| 1 or 2 Children | 0 (0.0%) | 0 (0.0%) |
| 3 or 4 Children | 0 (0.0%) | 0 (0.0%) |
| 5 or more Children | 0 (0.0%) | 0 (0.0%) |
| Total | 7 (0.4%) | 3 (0.8%) |
Race in East Foothills
The most populous races in East Foothills are White / Caucasian (3,417 | 41.3%), Hispanic or Latino (2,821 | 34.1%), and Asian (2,299 | 27.8%).
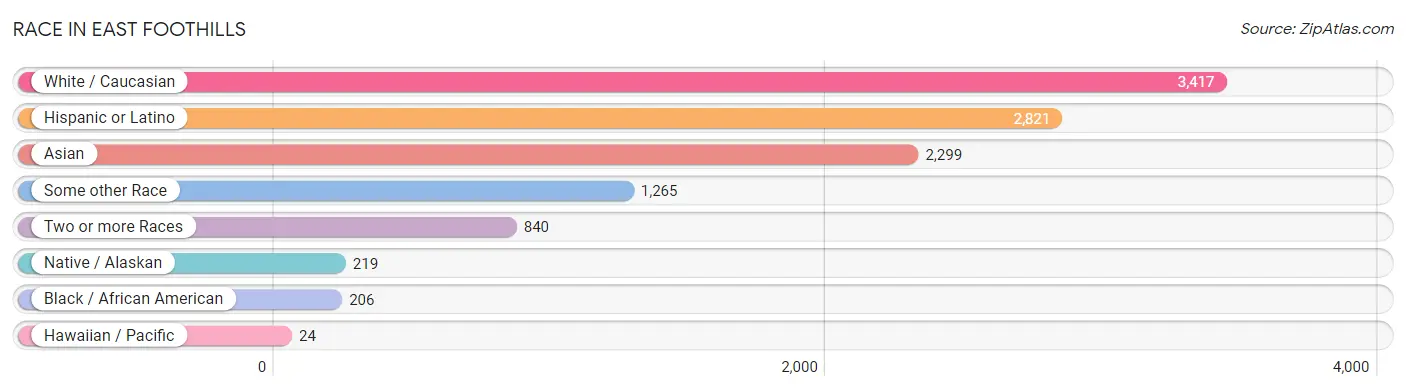
| Race | # Population | % Population |
| Asian | 2,299 | 27.8% |
| Black / African American | 206 | 2.5% |
| Hawaiian / Pacific | 24 | 0.3% |
| Hispanic or Latino | 2,821 | 34.1% |
| Native / Alaskan | 219 | 2.6% |
| White / Caucasian | 3,417 | 41.3% |
| Two or more Races | 840 | 10.2% |
| Some other Race | 1,265 | 15.3% |
| Total | 8,270 | 100.0% |
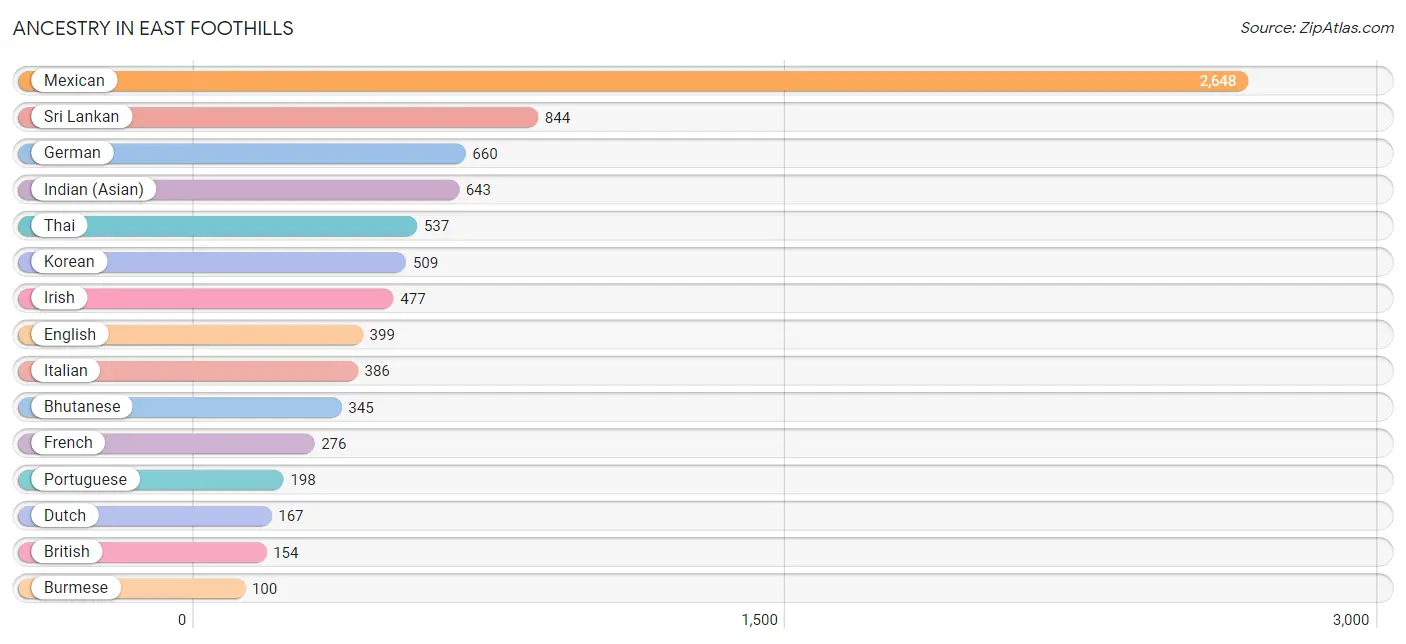
Ancestry in East Foothills
The most populous ancestries reported in East Foothills are Mexican (2,648 | 32.0%), Sri Lankan (844 | 10.2%), German (660 | 8.0%), Indian (Asian) (643 | 7.8%), and Thai (537 | 6.5%), together accounting for 64.5% of all East Foothills residents.
| Ancestry | # Population | % Population |
| African | 47 | 0.6% |
| Alaska Native | 6 | 0.1% |
| American | 83 | 1.0% |
| Apache | 6 | 0.1% |
| Austrian | 6 | 0.1% |
| Belgian | 8 | 0.1% |
| Bhutanese | 345 | 4.2% |
| Brazilian | 24 | 0.3% |
| British | 154 | 1.9% |
| Burmese | 100 | 1.2% |
| Central American | 28 | 0.3% |
| Choctaw | 7 | 0.1% |
| Colombian | 8 | 0.1% |
| Czechoslovakian | 5 | 0.1% |
| Danish | 43 | 0.5% |
| Dutch | 167 | 2.0% |
| Eastern European | 29 | 0.4% |
| Ecuadorian | 71 | 0.9% |
| English | 399 | 4.8% |
| European | 99 | 1.2% |
| Filipino | 7 | 0.1% |
| Finnish | 23 | 0.3% |
| French | 276 | 3.3% |
| German | 660 | 8.0% |
| Greek | 16 | 0.2% |
| Guamanian / Chamorro | 6 | 0.1% |
| Honduran | 7 | 0.1% |
| Indian (Asian) | 643 | 7.8% |
| Iranian | 38 | 0.5% |
| Irish | 477 | 5.8% |
| Italian | 386 | 4.7% |
| Jamaican | 21 | 0.3% |
| Japanese | 5 | 0.1% |
| Korean | 509 | 6.1% |
| Malaysian | 32 | 0.4% |
| Mexican | 2,648 | 32.0% |
| Mexican American Indian | 47 | 0.6% |
| Mongolian | 7 | 0.1% |
| Native Hawaiian | 23 | 0.3% |
| Norwegian | 52 | 0.6% |
| Polish | 68 | 0.8% |
| Portuguese | 198 | 2.4% |
| Puerto Rican | 11 | 0.1% |
| Russian | 73 | 0.9% |
| Salvadoran | 21 | 0.3% |
| Samoan | 6 | 0.1% |
| Scandinavian | 38 | 0.5% |
| Scotch-Irish | 41 | 0.5% |
| Scottish | 51 | 0.6% |
| South American | 85 | 1.0% |
| Spaniard | 16 | 0.2% |
| Sri Lankan | 844 | 10.2% |
| Subsaharan African | 47 | 0.6% |
| Swedish | 50 | 0.6% |
| Thai | 537 | 6.5% |
| Tongan | 12 | 0.2% | View All 56 Rows |
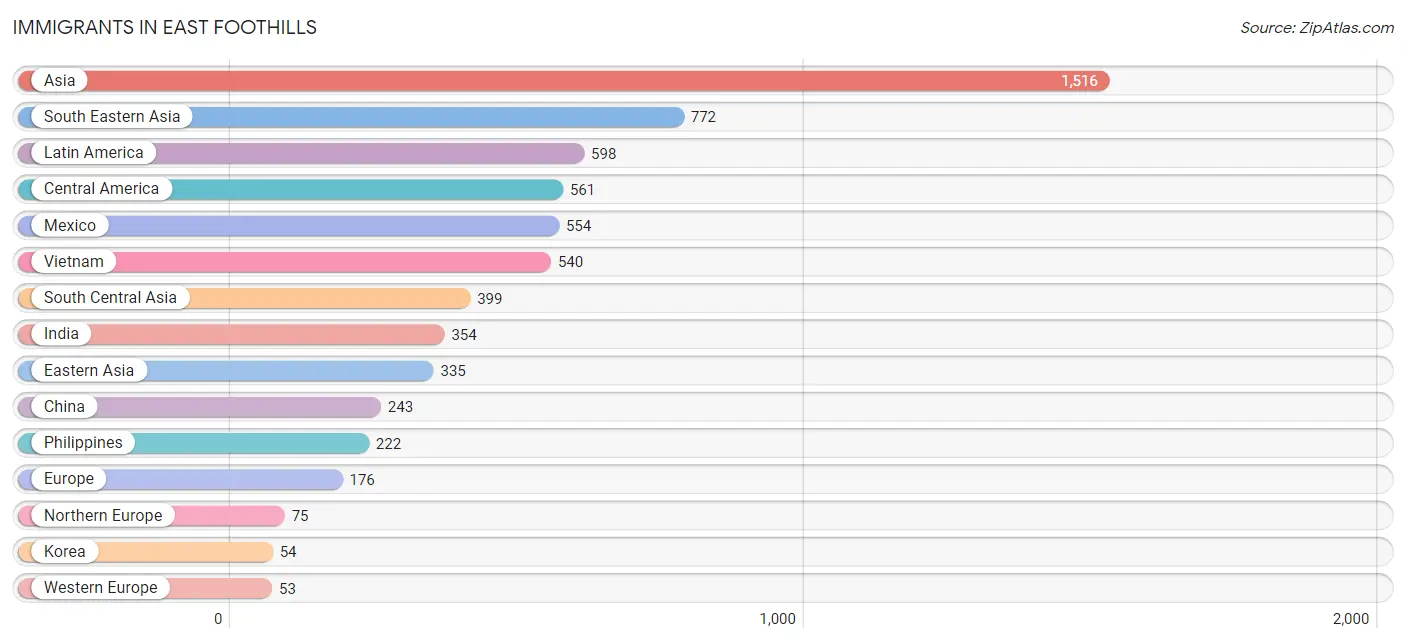
Immigrants in East Foothills
The most numerous immigrant groups reported in East Foothills came from Asia (1,516 | 18.3%), South Eastern Asia (772 | 9.3%), Latin America (598 | 7.2%), Central America (561 | 6.8%), and Mexico (554 | 6.7%), together accounting for 48.4% of all East Foothills residents.
| Immigration Origin | # Population | % Population |
| Asia | 1,516 | 18.3% |
| Australia | 12 | 0.2% |
| Azores | 8 | 0.1% |
| Belgium | 8 | 0.1% |
| Brazil | 17 | 0.2% |
| Canada | 13 | 0.2% |
| Central America | 561 | 6.8% |
| China | 243 | 2.9% |
| Colombia | 8 | 0.1% |
| Denmark | 8 | 0.1% |
| Eastern Asia | 335 | 4.1% |
| Ecuador | 12 | 0.2% |
| Europe | 176 | 2.1% |
| France | 5 | 0.1% |
| Germany | 40 | 0.5% |
| Honduras | 7 | 0.1% |
| Hong Kong | 25 | 0.3% |
| India | 354 | 4.3% |
| Iran | 6 | 0.1% |
| Italy | 13 | 0.2% |
| Japan | 38 | 0.5% |
| Korea | 54 | 0.6% |
| Laos | 5 | 0.1% |
| Latin America | 598 | 7.2% |
| Mexico | 554 | 6.7% |
| Northern Europe | 75 | 0.9% |
| Oceania | 24 | 0.3% |
| Pakistan | 39 | 0.5% |
| Philippines | 222 | 2.7% |
| Portugal | 35 | 0.4% |
| South America | 37 | 0.4% |
| South Central Asia | 399 | 4.8% |
| South Eastern Asia | 772 | 9.3% |
| Southern Europe | 48 | 0.6% |
| Taiwan | 13 | 0.2% |
| Thailand | 5 | 0.1% |
| Vietnam | 540 | 6.5% |
| Western Asia | 10 | 0.1% |
| Western Europe | 53 | 0.6% | View All 39 Rows |
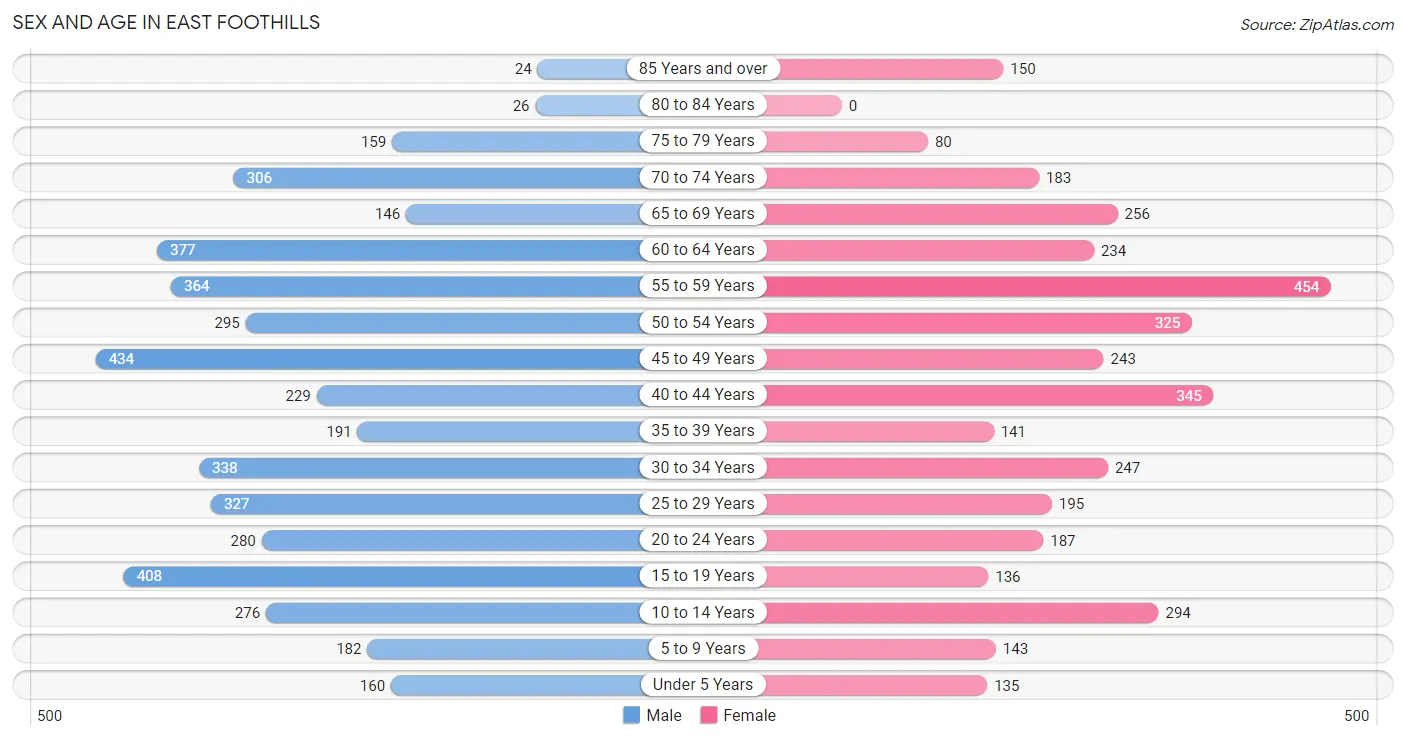
Sex and Age in East Foothills
Sex and Age in East Foothills
The most populous age groups in East Foothills are 45 to 49 Years (434 | 9.6%) for men and 55 to 59 Years (454 | 12.1%) for women.
| Age Bracket | Male | Female |
| Under 5 Years | 160 (3.5%) | 135 (3.6%) |
| 5 to 9 Years | 182 (4.0%) | 143 (3.8%) |
| 10 to 14 Years | 276 (6.1%) | 294 (7.8%) |
| 15 to 19 Years | 408 (9.0%) | 136 (3.6%) |
| 20 to 24 Years | 280 (6.2%) | 187 (5.0%) |
| 25 to 29 Years | 327 (7.2%) | 195 (5.2%) |
| 30 to 34 Years | 338 (7.5%) | 247 (6.6%) |
| 35 to 39 Years | 191 (4.2%) | 141 (3.8%) |
| 40 to 44 Years | 229 (5.1%) | 345 (9.2%) |
| 45 to 49 Years | 434 (9.6%) | 243 (6.5%) |
| 50 to 54 Years | 295 (6.5%) | 325 (8.7%) |
| 55 to 59 Years | 364 (8.1%) | 454 (12.1%) |
| 60 to 64 Years | 377 (8.3%) | 234 (6.2%) |
| 65 to 69 Years | 146 (3.2%) | 256 (6.8%) |
| 70 to 74 Years | 306 (6.8%) | 183 (4.9%) |
| 75 to 79 Years | 159 (3.5%) | 80 (2.1%) |
| 80 to 84 Years | 26 (0.6%) | 0 (0.0%) |
| 85 Years and over | 24 (0.5%) | 150 (4.0%) |
| Total | 4,522 (100.0%) | 3,748 (100.0%) |
Families and Households in East Foothills
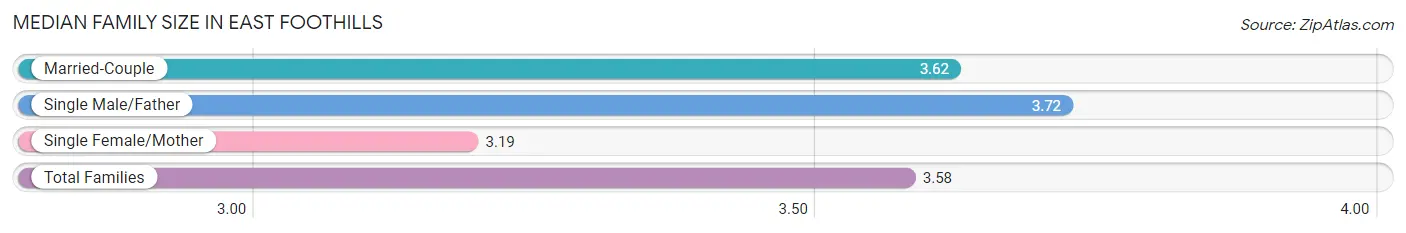
Median Family Size in East Foothills
The median family size in East Foothills is 3.58 persons per family, with single male/father families (162 | 8.1%) accounting for the largest median family size of 3.72 persons per family. On the other hand, single female/mother families (232 | 11.6%) represent the smallest median family size with 3.19 persons per family.
| Family Type | # Families | Family Size |
| Married-Couple | 1,606 (80.3%) | 3.62 |
| Single Male/Father | 162 (8.1%) | 3.72 |
| Single Female/Mother | 232 (11.6%) | 3.19 |
| Total Families | 2,000 (100.0%) | 3.58 |
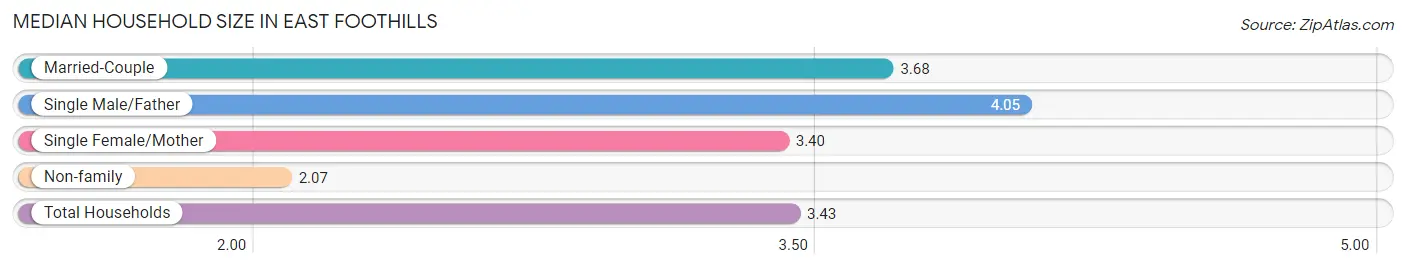
Median Household Size in East Foothills
The median household size in East Foothills is 3.43 persons per household, with single male/father households (162 | 6.8%) accounting for the largest median household size of 4.05 persons per household. non-family households (372 | 15.7%) represent the smallest median household size with 2.07 persons per household.
| Household Type | # Households | Household Size |
| Married-Couple | 1,606 (67.7%) | 3.68 |
| Single Male/Father | 162 (6.8%) | 4.05 |
| Single Female/Mother | 232 (9.8%) | 3.40 |
| Non-family | 372 (15.7%) | 2.07 |
| Total Households | 2,372 (100.0%) | 3.43 |
Household Size by Marriage Status in East Foothills
Out of a total of 2,372 households in East Foothills, 2,000 (84.3%) are family households, while 372 (15.7%) are nonfamily households. The most numerous type of family households are 3-person households, comprising 610, and the most common type of nonfamily households are 1-person households, comprising 268.
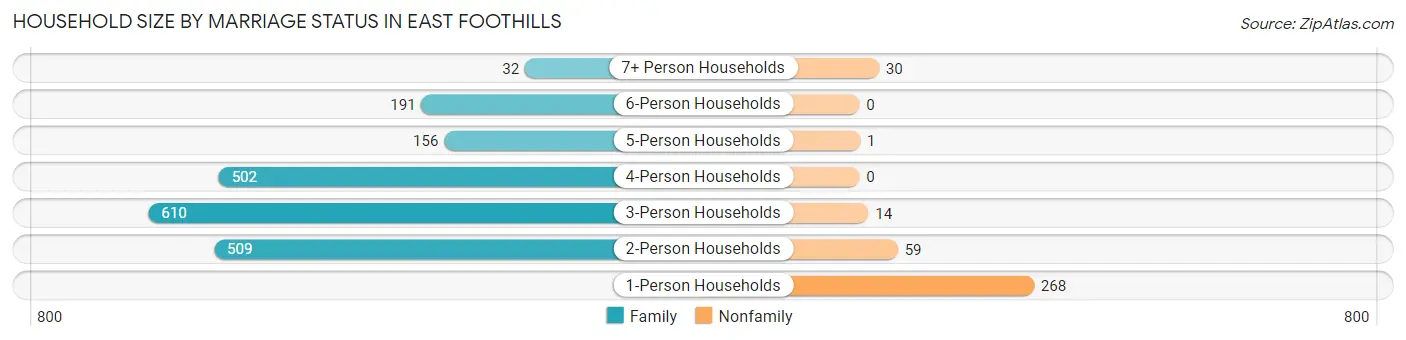
| Household Size | Family Households | Nonfamily Households |
| 1-Person Households | - | 268 (11.3%) |
| 2-Person Households | 509 (21.5%) | 59 (2.5%) |
| 3-Person Households | 610 (25.7%) | 14 (0.6%) |
| 4-Person Households | 502 (21.2%) | 0 (0.0%) |
| 5-Person Households | 156 (6.6%) | 1 (0.0%) |
| 6-Person Households | 191 (8.1%) | 0 (0.0%) |
| 7+ Person Households | 32 (1.3%) | 30 (1.3%) |
| Total | 2,000 (84.3%) | 372 (15.7%) |
Female Fertility in East Foothills
Fertility by Age in East Foothills
Average fertility rate in East Foothills is 84.0 births per 1,000 women. Women in the age bracket of 20 to 34 years have the highest fertility rate with 165.0 births per 1,000 women. Women in the age bracket of 20 to 34 years acount for 78.8% of all women with births.
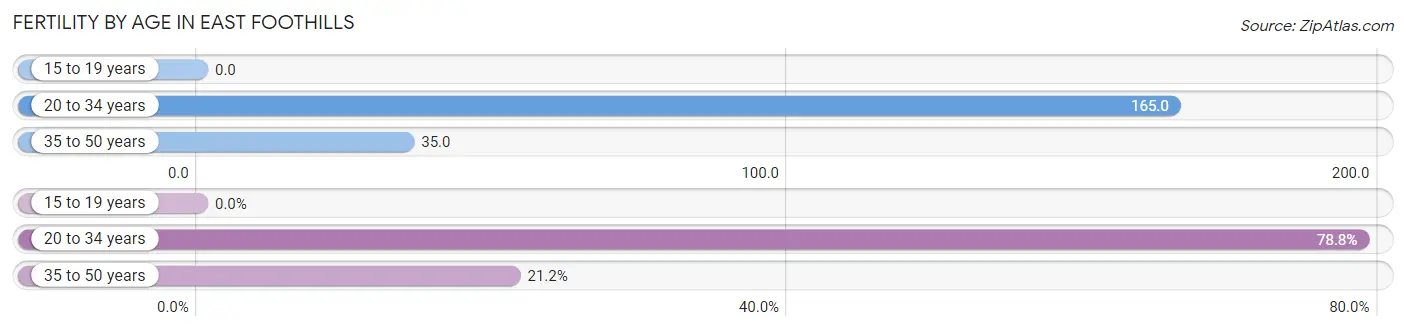
| Age Bracket | Women with Births | Births / 1,000 Women |
| 15 to 19 years | 0 (0.0%) | 0.0 |
| 20 to 34 years | 104 (78.8%) | 165.0 |
| 35 to 50 years | 28 (21.2%) | 35.0 |
| Total | 132 (100.0%) | 84.0 |
Fertility by Age by Marriage Status in East Foothills
91.7% of women with births (132) in East Foothills are married. The highest percentage of unmarried women with births falls into 35 to 50 years age bracket with 17.9% of them unmarried at the time of birth, while the lowest percentage of unmarried women with births belong to 20 to 34 years age bracket with 5.8% of them unmarried.
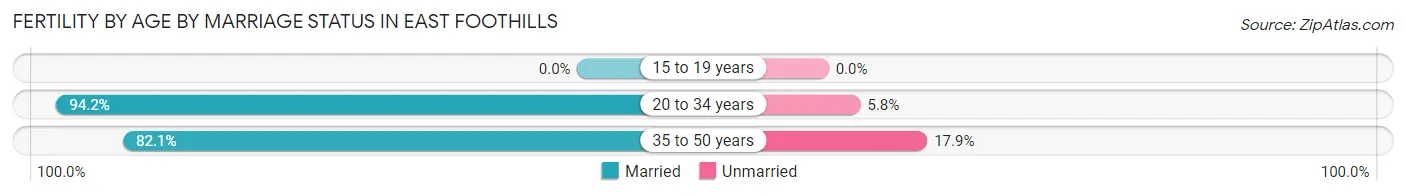
| Age Bracket | Married | Unmarried |
| 15 to 19 years | 0 (0.0%) | 0 (0.0%) |
| 20 to 34 years | 98 (94.2%) | 6 (5.8%) |
| 35 to 50 years | 23 (82.1%) | 5 (17.9%) |
| Total | 121 (91.7%) | 11 (8.3%) |
Fertility by Education in East Foothills
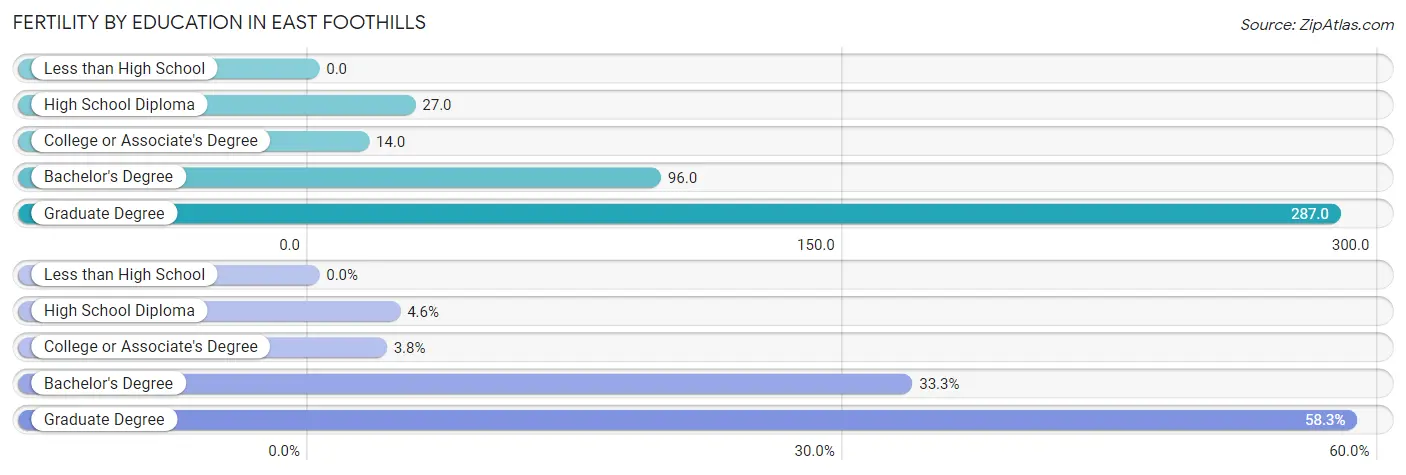
| Educational Attainment | Women with Births | Births / 1,000 Women |
| Less than High School | 0 (0.0%) | 0.0 |
| High School Diploma | 6 (4.5%) | 27.0 |
| College or Associate's Degree | 5 (3.8%) | 14.0 |
| Bachelor's Degree | 44 (33.3%) | 96.0 |
| Graduate Degree | 77 (58.3%) | 287.0 |
| Total | 132 (100.0%) | 84.0 |
Fertility by Education by Marriage Status in East Foothills
8.3% of women with births in East Foothills are unmarried. Women with the educational attainment of bachelor's degree are most likely to be married with 100.0% of them married at childbirth, while women with the educational attainment of high school diploma are least likely to be married with 100.0% of them unmarried at childbirth.
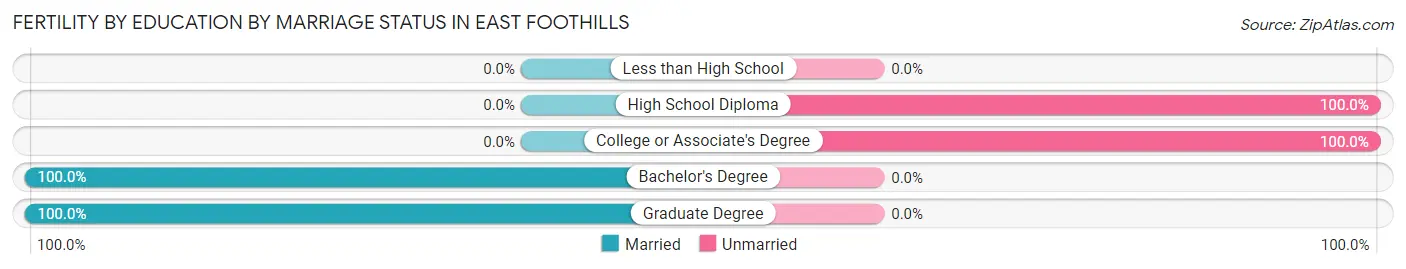
| Educational Attainment | Married | Unmarried |
| Less than High School | 0 (0.0%) | 0 (0.0%) |
| High School Diploma | 0 (0.0%) | 6 (100.0%) |
| College or Associate's Degree | 0 (0.0%) | 5 (100.0%) |
| Bachelor's Degree | 44 (100.0%) | 0 (0.0%) |
| Graduate Degree | 77 (100.0%) | 0 (0.0%) |
| Total | 121 (91.7%) | 11 (8.3%) |
Employment Characteristics in East Foothills
Employment by Class of Employer in East Foothills
Among the 4,325 employed individuals in East Foothills, private company employees (2,752 | 63.6%), local government employees (532 | 12.3%), and self-employed (not incorporated) (422 | 9.8%) make up the most common classes of employment.
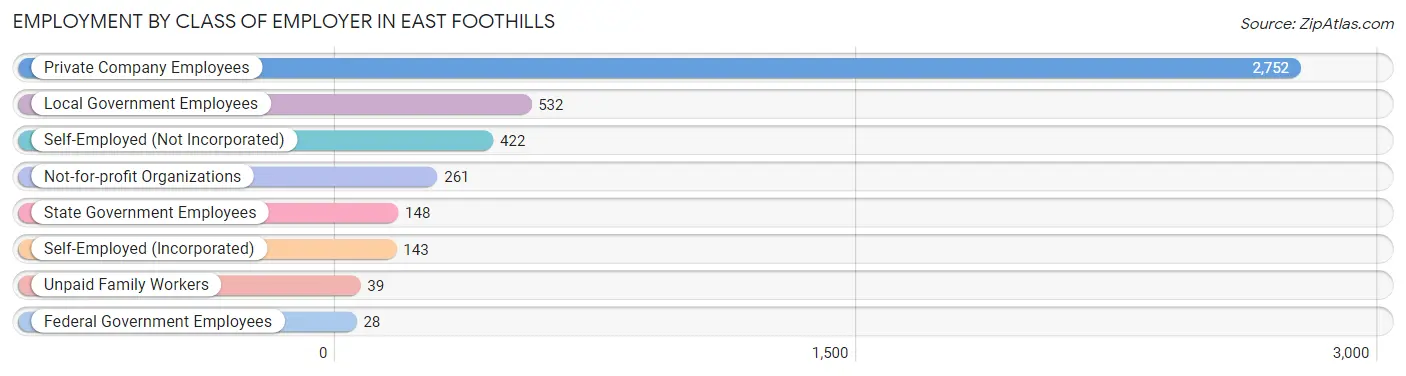
| Employer Class | # Employees | % Employees |
| Private Company Employees | 2,752 | 63.6% |
| Self-Employed (Incorporated) | 143 | 3.3% |
| Self-Employed (Not Incorporated) | 422 | 9.8% |
| Not-for-profit Organizations | 261 | 6.0% |
| Local Government Employees | 532 | 12.3% |
| State Government Employees | 148 | 3.4% |
| Federal Government Employees | 28 | 0.6% |
| Unpaid Family Workers | 39 | 0.9% |
| Total | 4,325 | 100.0% |
Employment Status by Age in East Foothills
According to the labor force statistics for East Foothills, out of the total population over 16 years of age (7,021), 65.6% or 4,606 individuals are in the labor force, with 3.2% or 147 of them unemployed. The age group with the highest labor force participation rate is 35 to 44 years, with 86.4% or 783 individuals in the labor force. Within the labor force, the 30 to 34 years age range has the highest percentage of unemployed individuals, with 9.1% or 45 of them being unemployed.
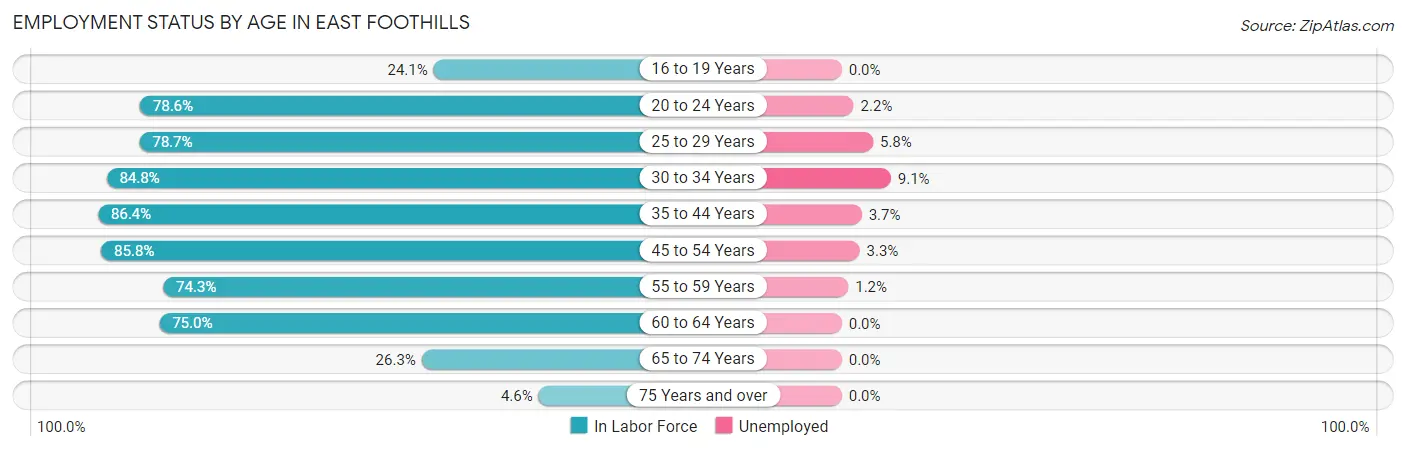
| Age Bracket | In Labor Force | Unemployed |
| 16 to 19 Years | 117 (24.1%) | 0 (0.0%) |
| 20 to 24 Years | 367 (78.6%) | 8 (2.2%) |
| 25 to 29 Years | 411 (78.7%) | 24 (5.8%) |
| 30 to 34 Years | 496 (84.8%) | 45 (9.1%) |
| 35 to 44 Years | 783 (86.4%) | 29 (3.7%) |
| 45 to 54 Years | 1,113 (85.8%) | 37 (3.3%) |
| 55 to 59 Years | 608 (74.3%) | 7 (1.2%) |
| 60 to 64 Years | 458 (75.0%) | 0 (0.0%) |
| 65 to 74 Years | 234 (26.3%) | 0 (0.0%) |
| 75 Years and over | 20 (4.6%) | 0 (0.0%) |
| Total | 4,606 (65.6%) | 147 (3.2%) |
Employment Status by Educational Attainment in East Foothills
According to labor force statistics for East Foothills, 81.6% of individuals (3,867) out of the total population between 25 and 64 years of age (4,739) are in the labor force, with 3.7% or 143 of them being unemployed. The group with the highest labor force participation rate are those with the educational attainment of bachelor's degree or higher, with 85.9% or 1,921 individuals in the labor force. Within the labor force, individuals with high school diploma education have the highest percentage of unemployment, with 13.3% or 86 of them being unemployed.
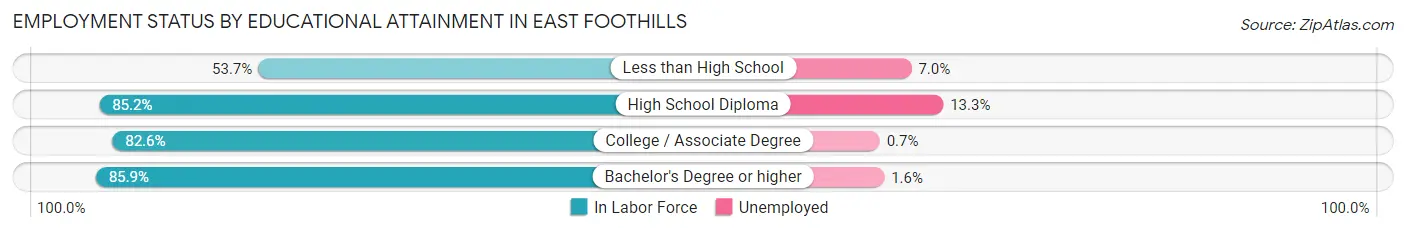
| Educational Attainment | In Labor Force | Unemployed |
| Less than High School | 257 (53.7%) | 34 (7.0%) |
| High School Diploma | 645 (85.2%) | 101 (13.3%) |
| College / Associate Degree | 1,047 (82.6%) | 9 (0.7%) |
| Bachelor's Degree or higher | 1,921 (85.9%) | 36 (1.6%) |
| Total | 3,867 (81.6%) | 175 (3.7%) |
Employment Occupations by Sex in East Foothills
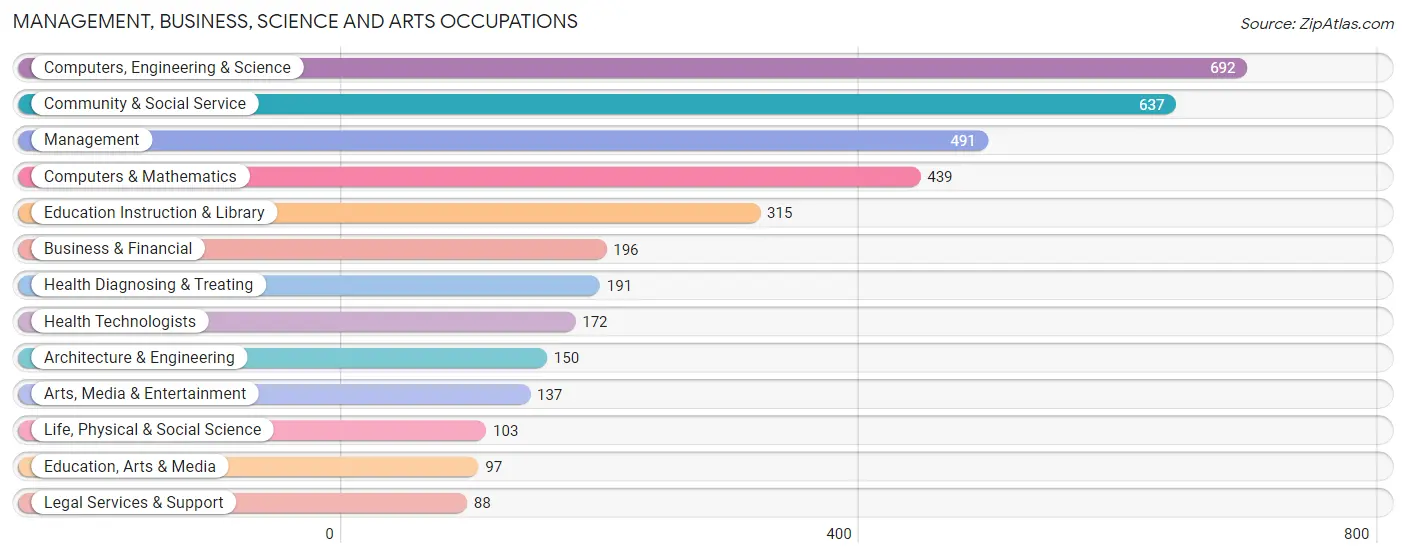
Management, Business, Science and Arts Occupations
The most common Management, Business, Science and Arts occupations in East Foothills are Computers, Engineering & Science (692 | 15.6%), Community & Social Service (637 | 14.3%), Management (491 | 11.1%), Computers & Mathematics (439 | 9.9%), and Education Instruction & Library (315 | 7.1%).
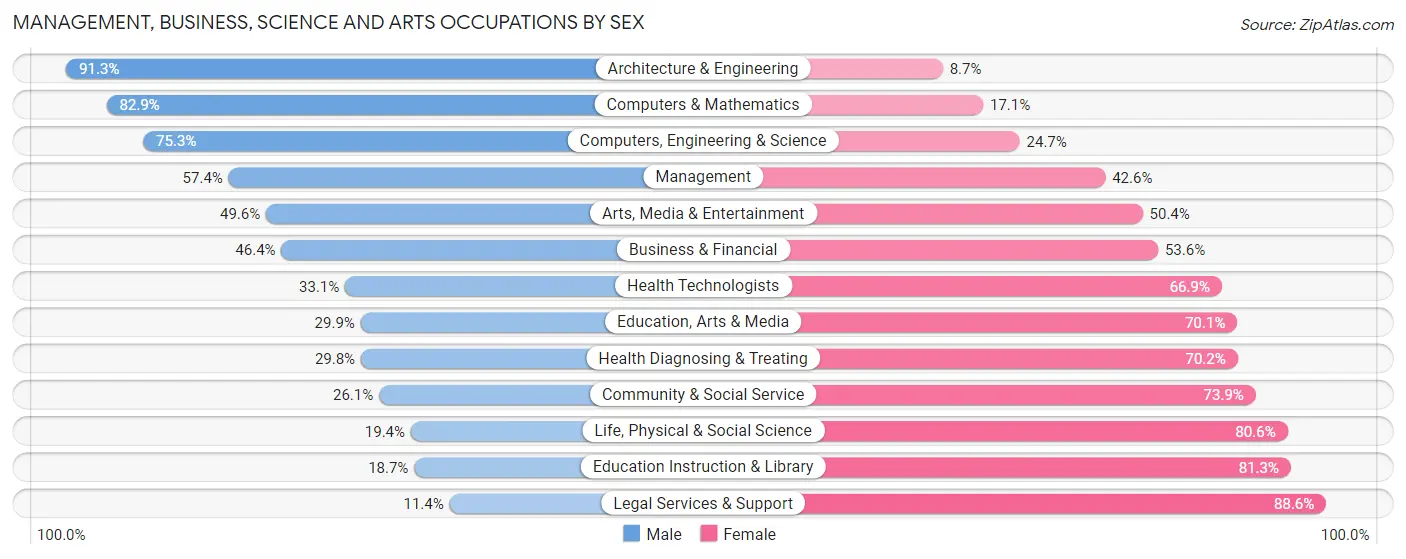
Management, Business, Science and Arts Occupations by Sex
Within the Management, Business, Science and Arts occupations in East Foothills, the most male-oriented occupations are Architecture & Engineering (91.3%), Computers & Mathematics (82.9%), and Computers, Engineering & Science (75.3%), while the most female-oriented occupations are Legal Services & Support (88.6%), Education Instruction & Library (81.3%), and Life, Physical & Social Science (80.6%).
| Occupation | Male | Female |
| Management | 282 (57.4%) | 209 (42.6%) |
| Business & Financial | 91 (46.4%) | 105 (53.6%) |
| Computers, Engineering & Science | 521 (75.3%) | 171 (24.7%) |
| Computers & Mathematics | 364 (82.9%) | 75 (17.1%) |
| Architecture & Engineering | 137 (91.3%) | 13 (8.7%) |
| Life, Physical & Social Science | 20 (19.4%) | 83 (80.6%) |
| Community & Social Service | 166 (26.1%) | 471 (73.9%) |
| Education, Arts & Media | 29 (29.9%) | 68 (70.1%) |
| Legal Services & Support | 10 (11.4%) | 78 (88.6%) |
| Education Instruction & Library | 59 (18.7%) | 256 (81.3%) |
| Arts, Media & Entertainment | 68 (49.6%) | 69 (50.4%) |
| Health Diagnosing & Treating | 57 (29.8%) | 134 (70.2%) |
| Health Technologists | 57 (33.1%) | 115 (66.9%) |
| Total (Category) | 1,117 (50.6%) | 1,090 (49.4%) |
| Total (Overall) | 2,442 (55.0%) | 2,000 (45.0%) |
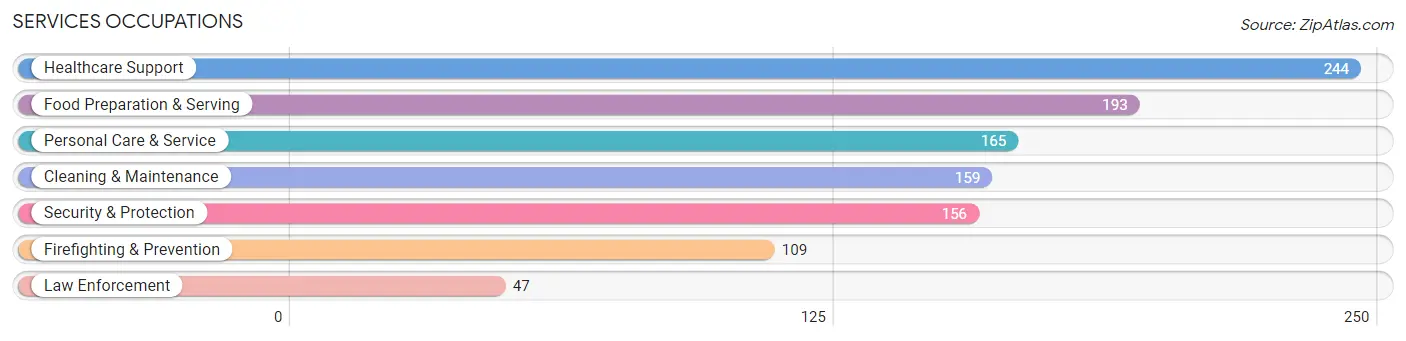
Services Occupations
The most common Services occupations in East Foothills are Healthcare Support (244 | 5.5%), Food Preparation & Serving (193 | 4.3%), Personal Care & Service (165 | 3.7%), Cleaning & Maintenance (159 | 3.6%), and Security & Protection (156 | 3.5%).
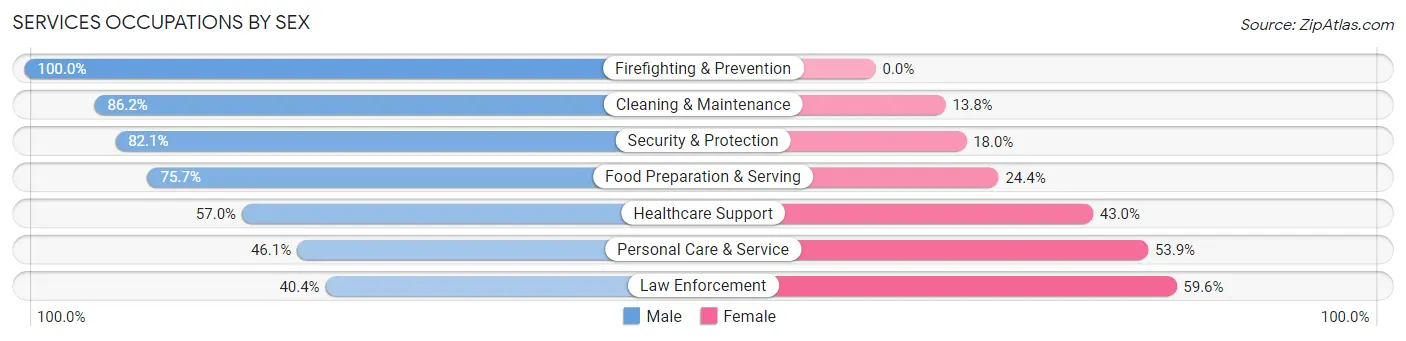
Services Occupations by Sex
Within the Services occupations in East Foothills, the most male-oriented occupations are Firefighting & Prevention (100.0%), Cleaning & Maintenance (86.2%), and Security & Protection (82.1%), while the most female-oriented occupations are Law Enforcement (59.6%), Personal Care & Service (53.9%), and Healthcare Support (43.0%).
| Occupation | Male | Female |
| Healthcare Support | 139 (57.0%) | 105 (43.0%) |
| Security & Protection | 128 (82.1%) | 28 (17.9%) |
| Firefighting & Prevention | 109 (100.0%) | 0 (0.0%) |
| Law Enforcement | 19 (40.4%) | 28 (59.6%) |
| Food Preparation & Serving | 146 (75.6%) | 47 (24.3%) |
| Cleaning & Maintenance | 137 (86.2%) | 22 (13.8%) |
| Personal Care & Service | 76 (46.1%) | 89 (53.9%) |
| Total (Category) | 626 (68.3%) | 291 (31.7%) |
| Total (Overall) | 2,442 (55.0%) | 2,000 (45.0%) |
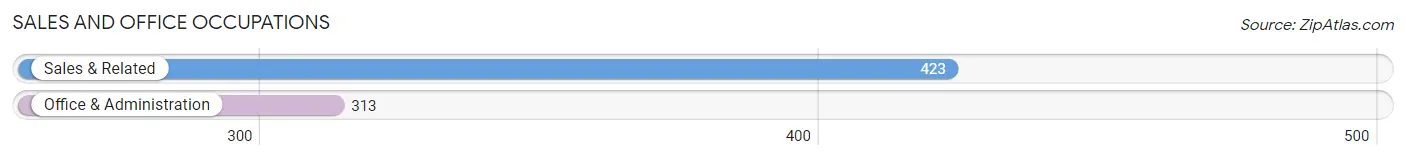
Sales and Office Occupations
The most common Sales and Office occupations in East Foothills are Sales & Related (423 | 9.5%), and Office & Administration (313 | 7.0%).
Sales and Office Occupations by Sex
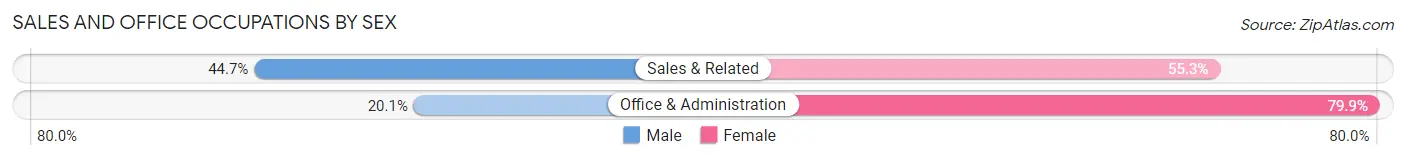
| Occupation | Male | Female |
| Sales & Related | 189 (44.7%) | 234 (55.3%) |
| Office & Administration | 63 (20.1%) | 250 (79.9%) |
| Total (Category) | 252 (34.2%) | 484 (65.8%) |
| Total (Overall) | 2,442 (55.0%) | 2,000 (45.0%) |
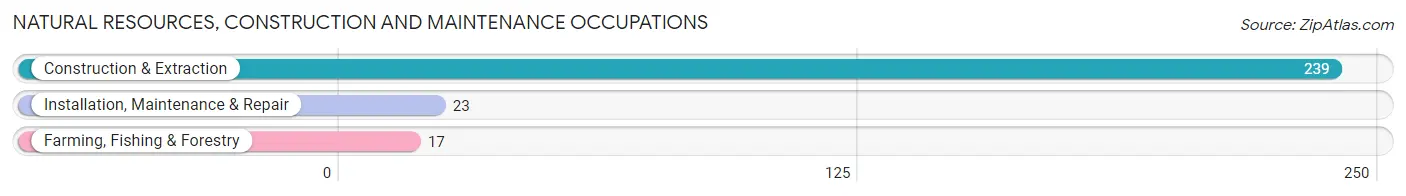
Natural Resources, Construction and Maintenance Occupations
The most common Natural Resources, Construction and Maintenance occupations in East Foothills are Construction & Extraction (239 | 5.4%), Installation, Maintenance & Repair (23 | 0.5%), and Farming, Fishing & Forestry (17 | 0.4%).
Natural Resources, Construction and Maintenance Occupations by Sex
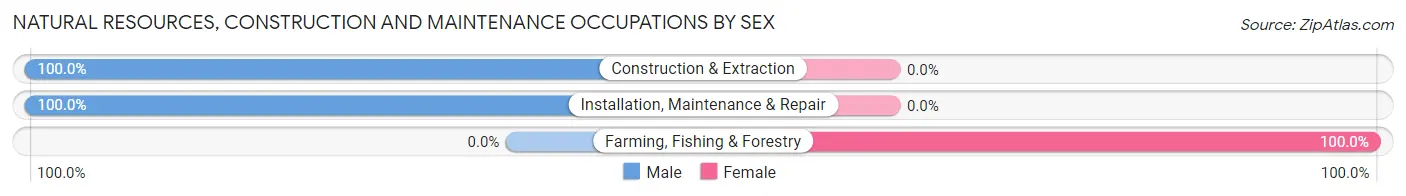
| Occupation | Male | Female |
| Farming, Fishing & Forestry | 0 (0.0%) | 17 (100.0%) |
| Construction & Extraction | 239 (100.0%) | 0 (0.0%) |
| Installation, Maintenance & Repair | 23 (100.0%) | 0 (0.0%) |
| Total (Category) | 262 (93.9%) | 17 (6.1%) |
| Total (Overall) | 2,442 (55.0%) | 2,000 (45.0%) |
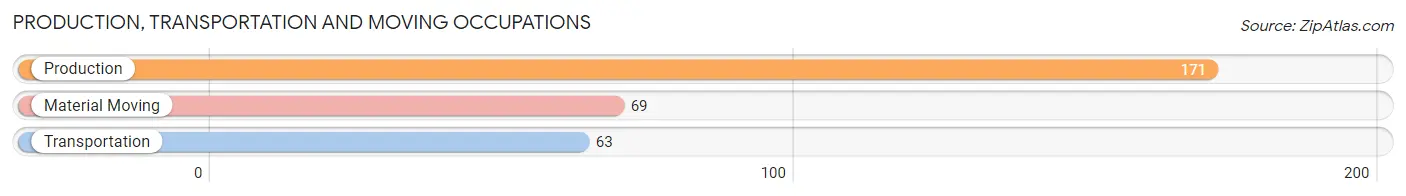
Production, Transportation and Moving Occupations
The most common Production, Transportation and Moving occupations in East Foothills are Production (171 | 3.8%), Material Moving (69 | 1.5%), and Transportation (63 | 1.4%).
Production, Transportation and Moving Occupations by Sex

| Occupation | Male | Female |
| Production | 61 (35.7%) | 110 (64.3%) |
| Transportation | 63 (100.0%) | 0 (0.0%) |
| Material Moving | 61 (88.4%) | 8 (11.6%) |
| Total (Category) | 185 (61.1%) | 118 (38.9%) |
| Total (Overall) | 2,442 (55.0%) | 2,000 (45.0%) |
Employment Industries by Sex in East Foothills
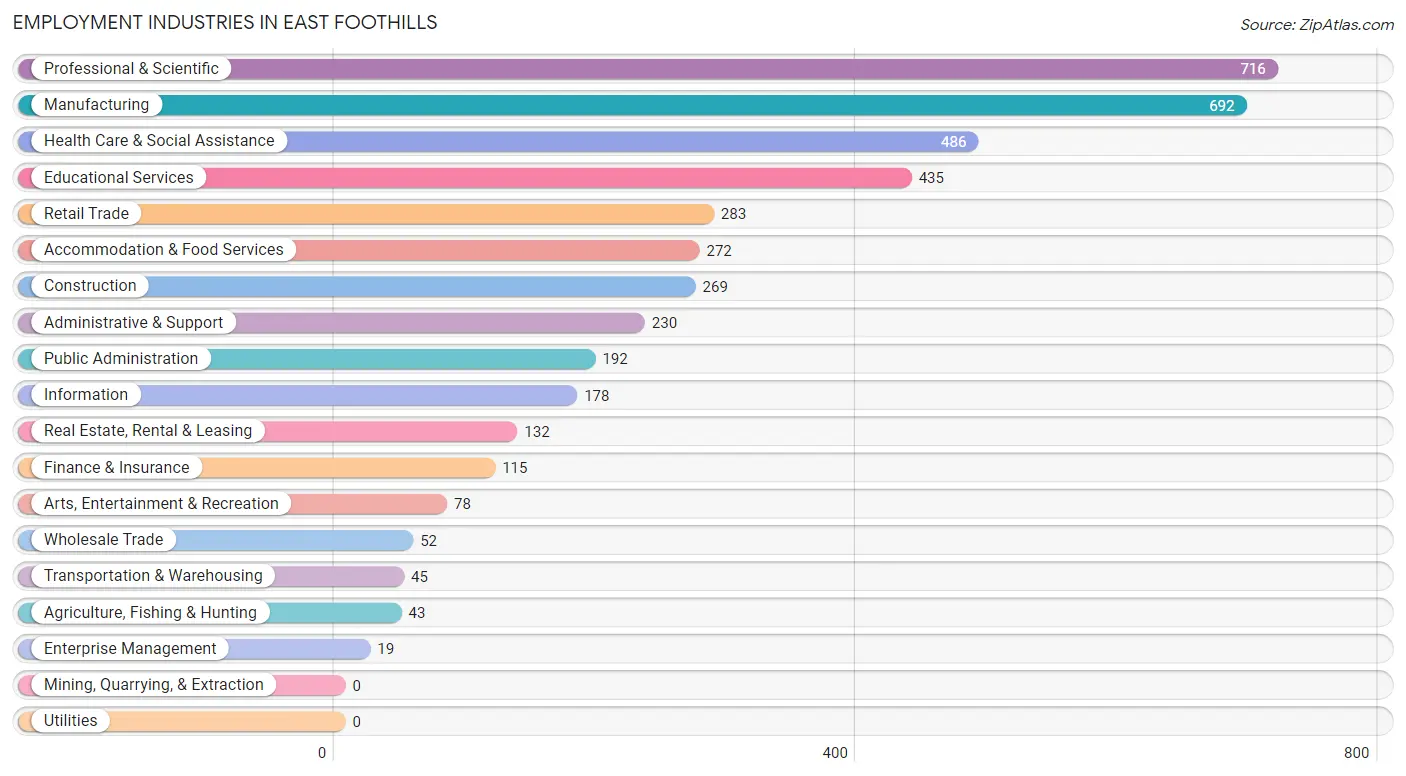
Employment Industries in East Foothills
The major employment industries in East Foothills include Professional & Scientific (716 | 16.1%), Manufacturing (692 | 15.6%), Health Care & Social Assistance (486 | 10.9%), Educational Services (435 | 9.8%), and Retail Trade (283 | 6.4%).
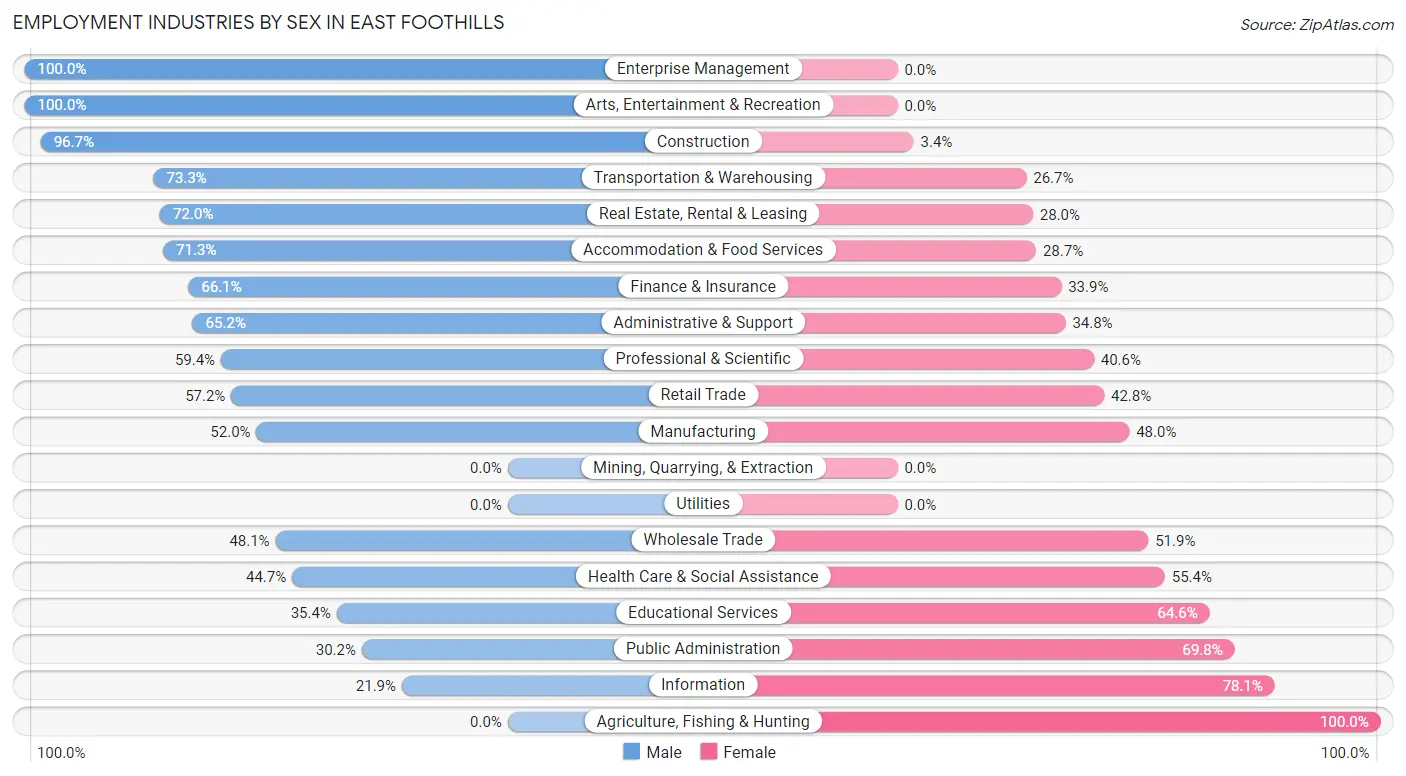
Employment Industries by Sex in East Foothills
The East Foothills industries that see more men than women are Enterprise Management (100.0%), Arts, Entertainment & Recreation (100.0%), and Construction (96.7%), whereas the industries that tend to have a higher number of women are Agriculture, Fishing & Hunting (100.0%), Information (78.1%), and Public Administration (69.8%).
| Industry | Male | Female |
| Agriculture, Fishing & Hunting | 0 (0.0%) | 43 (100.0%) |
| Mining, Quarrying, & Extraction | 0 (0.0%) | 0 (0.0%) |
| Construction | 260 (96.7%) | 9 (3.4%) |
| Manufacturing | 360 (52.0%) | 332 (48.0%) |
| Wholesale Trade | 25 (48.1%) | 27 (51.9%) |
| Retail Trade | 162 (57.2%) | 121 (42.8%) |
| Transportation & Warehousing | 33 (73.3%) | 12 (26.7%) |
| Utilities | 0 (0.0%) | 0 (0.0%) |
| Information | 39 (21.9%) | 139 (78.1%) |
| Finance & Insurance | 76 (66.1%) | 39 (33.9%) |
| Real Estate, Rental & Leasing | 95 (72.0%) | 37 (28.0%) |
| Professional & Scientific | 425 (59.4%) | 291 (40.6%) |
| Enterprise Management | 19 (100.0%) | 0 (0.0%) |
| Administrative & Support | 150 (65.2%) | 80 (34.8%) |
| Educational Services | 154 (35.4%) | 281 (64.6%) |
| Health Care & Social Assistance | 217 (44.7%) | 269 (55.3%) |
| Arts, Entertainment & Recreation | 78 (100.0%) | 0 (0.0%) |
| Accommodation & Food Services | 194 (71.3%) | 78 (28.7%) |
| Public Administration | 58 (30.2%) | 134 (69.8%) |
| Total | 2,442 (55.0%) | 2,000 (45.0%) |
Education in East Foothills
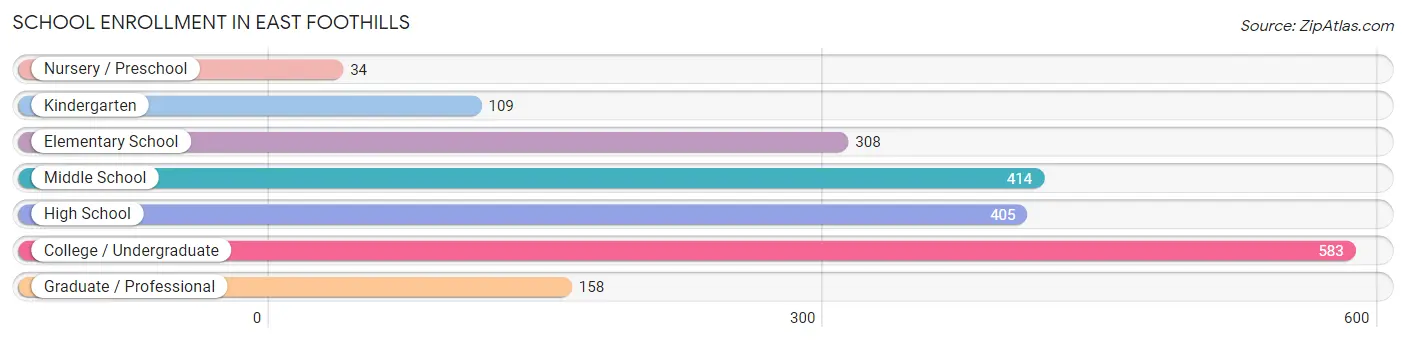
School Enrollment in East Foothills
The most common levels of schooling among the 2,011 students in East Foothills are college / undergraduate (583 | 29.0%), middle school (414 | 20.6%), and high school (405 | 20.1%).
| School Level | # Students | % Students |
| Nursery / Preschool | 34 | 1.7% |
| Kindergarten | 109 | 5.4% |
| Elementary School | 308 | 15.3% |
| Middle School | 414 | 20.6% |
| High School | 405 | 20.1% |
| College / Undergraduate | 583 | 29.0% |
| Graduate / Professional | 158 | 7.9% |
| Total | 2,011 | 100.0% |
School Enrollment by Age by Funding Source in East Foothills
Out of a total of 2,011 students who are enrolled in schools in East Foothills, 497 (24.7%) attend a private institution, while the remaining 1,514 (75.3%) are enrolled in public schools. The age group of 3 to 4 year olds has the highest likelihood of being enrolled in private schools, with 34 (100.0% in the age bracket) enrolled. Conversely, the age group of 18 to 19 year olds has the lowest likelihood of being enrolled in a private school, with 102 (100.0% in the age bracket) attending a public institution.
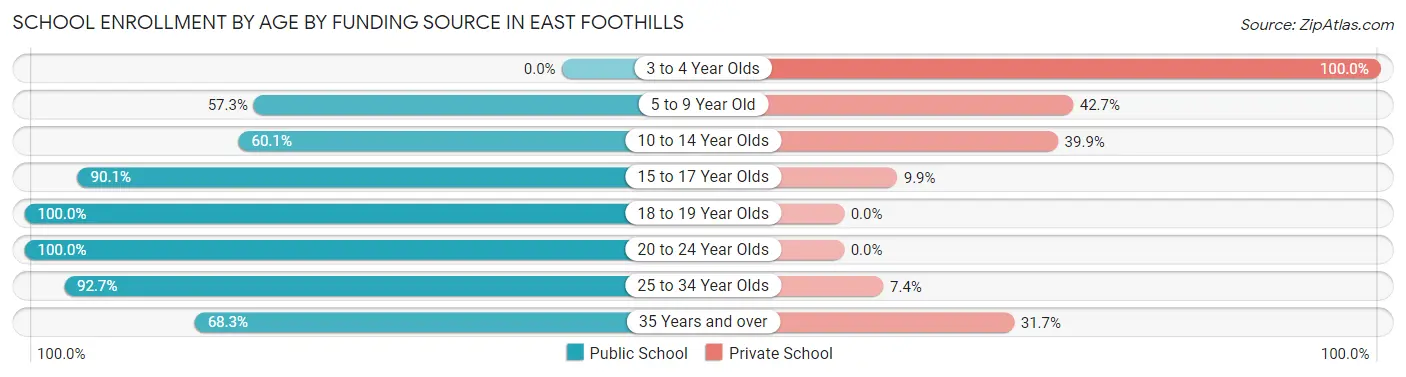
| Age Bracket | Public School | Private School |
| 3 to 4 Year Olds | 0 (0.0%) | 34 (100.0%) |
| 5 to 9 Year Old | 180 (57.3%) | 134 (42.7%) |
| 10 to 14 Year Olds | 338 (60.1%) | 224 (39.9%) |
| 15 to 17 Year Olds | 337 (90.1%) | 37 (9.9%) |
| 18 to 19 Year Olds | 102 (100.0%) | 0 (0.0%) |
| 20 to 24 Year Olds | 306 (100.0%) | 0 (0.0%) |
| 25 to 34 Year Olds | 126 (92.6%) | 10 (7.3%) |
| 35 Years and over | 125 (68.3%) | 58 (31.7%) |
| Total | 1,514 (75.3%) | 497 (24.7%) |
Educational Attainment by Field of Study in East Foothills
Social sciences (471 | 15.2%), engineering (386 | 12.5%), business (352 | 11.4%), literature & languages (230 | 7.4%), and science & technology (213 | 6.9%) are the most common fields of study among 3,090 individuals in East Foothills who have obtained a bachelor's degree or higher.
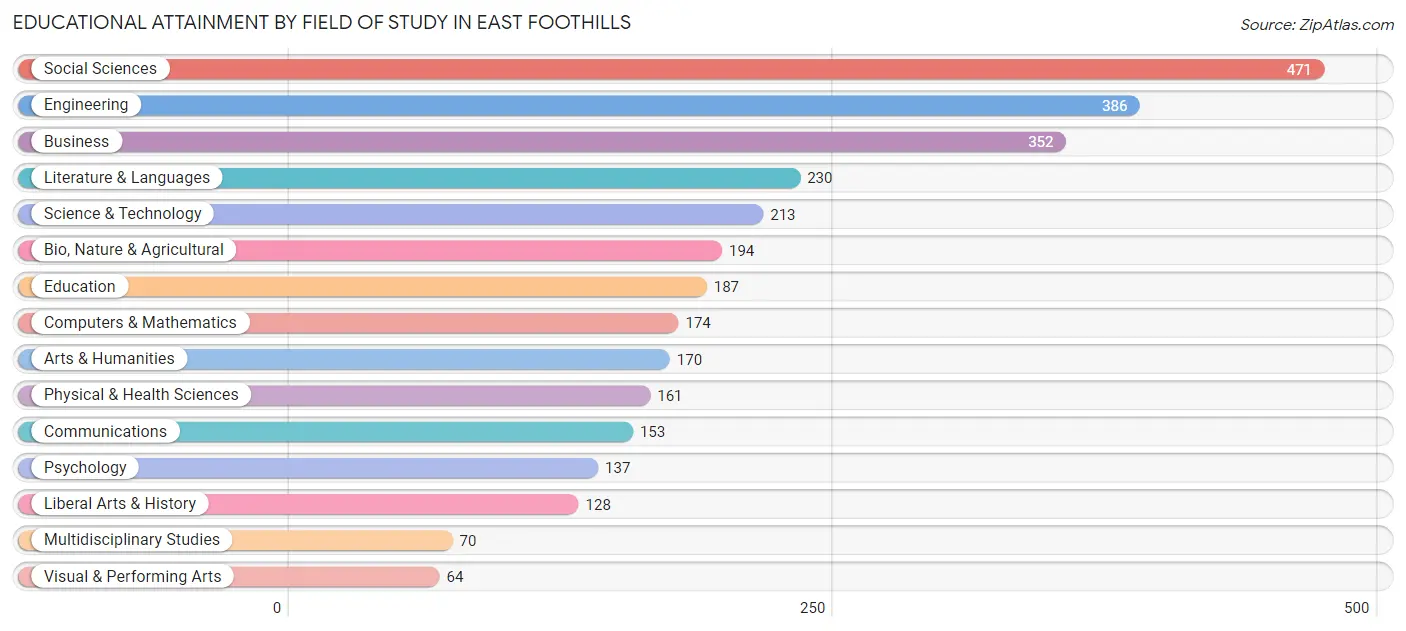
| Field of Study | # Graduates | % Graduates |
| Computers & Mathematics | 174 | 5.6% |
| Bio, Nature & Agricultural | 194 | 6.3% |
| Physical & Health Sciences | 161 | 5.2% |
| Psychology | 137 | 4.4% |
| Social Sciences | 471 | 15.2% |
| Engineering | 386 | 12.5% |
| Multidisciplinary Studies | 70 | 2.3% |
| Science & Technology | 213 | 6.9% |
| Business | 352 | 11.4% |
| Education | 187 | 6.0% |
| Literature & Languages | 230 | 7.4% |
| Liberal Arts & History | 128 | 4.1% |
| Visual & Performing Arts | 64 | 2.1% |
| Communications | 153 | 5.0% |
| Arts & Humanities | 170 | 5.5% |
| Total | 3,090 | 100.0% |
Transportation & Commute in East Foothills
Vehicle Availability by Sex in East Foothills
The most prevalent vehicle ownership categories in East Foothills are males with 4 vehicles (807, accounting for 33.6%) and females with 4 vehicles (711, making up 42.3%).
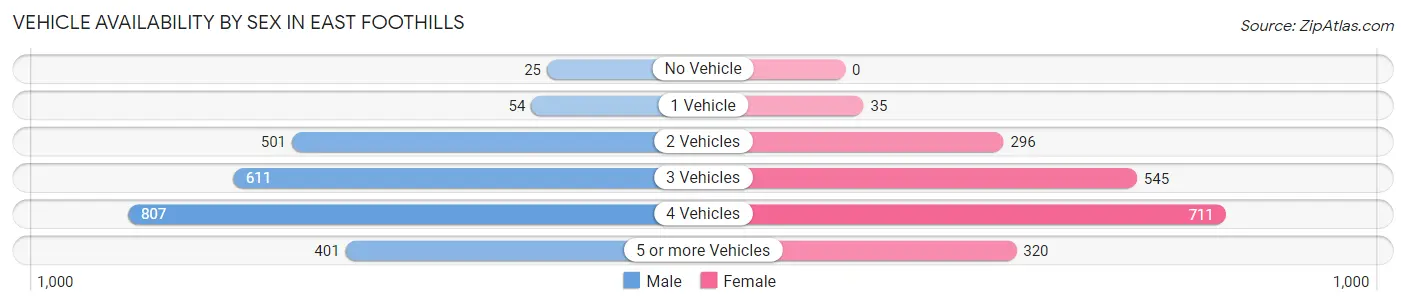
| Vehicles Available | Male | Female |
| No Vehicle | 25 (1.0%) | 0 (0.0%) |
| 1 Vehicle | 54 (2.2%) | 35 (1.8%) |
| 2 Vehicles | 501 (20.9%) | 296 (15.5%) |
| 3 Vehicles | 611 (25.5%) | 545 (28.6%) |
| 4 Vehicles | 807 (33.6%) | 711 (37.3%) |
| 5 or more Vehicles | 401 (16.7%) | 320 (16.8%) |
| Total | 2,399 (100.0%) | 1,907 (100.0%) |
Commute Time in East Foothills
The most frequently occuring commute durations in East Foothills are 45 to 59 minutes (530 commuters, 15.0%), 20 to 24 minutes (517 commuters, 14.6%), and 25 to 29 minutes (497 commuters, 14.1%).
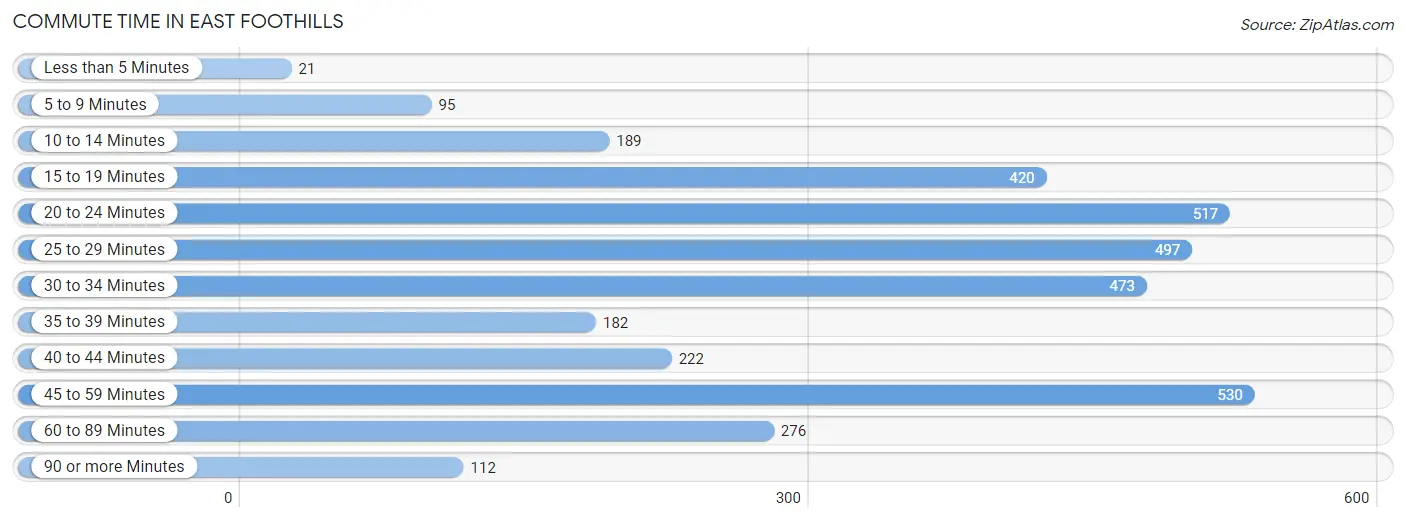
| Commute Time | # Commuters | % Commuters |
| Less than 5 Minutes | 21 | 0.6% |
| 5 to 9 Minutes | 95 | 2.7% |
| 10 to 14 Minutes | 189 | 5.3% |
| 15 to 19 Minutes | 420 | 11.9% |
| 20 to 24 Minutes | 517 | 14.6% |
| 25 to 29 Minutes | 497 | 14.1% |
| 30 to 34 Minutes | 473 | 13.4% |
| 35 to 39 Minutes | 182 | 5.1% |
| 40 to 44 Minutes | 222 | 6.3% |
| 45 to 59 Minutes | 530 | 15.0% |
| 60 to 89 Minutes | 276 | 7.8% |
| 90 or more Minutes | 112 | 3.2% |
Commute Time by Sex in East Foothills
The most common commute times in East Foothills are 45 to 59 minutes (387 commuters, 19.9%) for males and 15 to 19 minutes (256 commuters, 16.1%) for females.
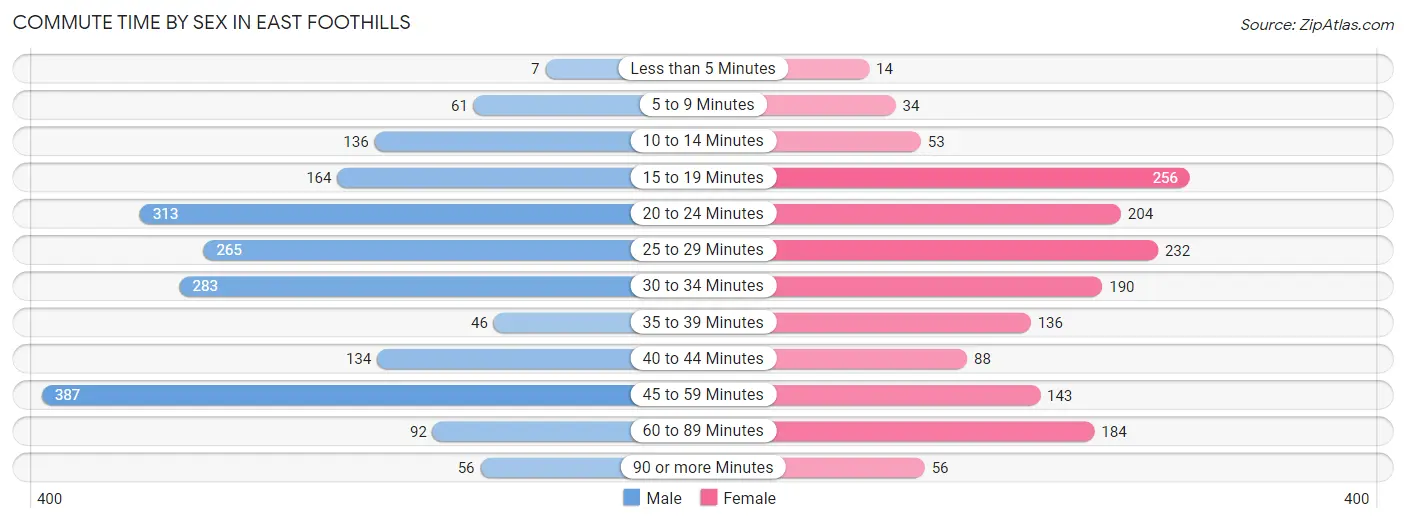
| Commute Time | Male | Female |
| Less than 5 Minutes | 7 (0.4%) | 14 (0.9%) |
| 5 to 9 Minutes | 61 (3.1%) | 34 (2.1%) |
| 10 to 14 Minutes | 136 (7.0%) | 53 (3.3%) |
| 15 to 19 Minutes | 164 (8.4%) | 256 (16.1%) |
| 20 to 24 Minutes | 313 (16.1%) | 204 (12.8%) |
| 25 to 29 Minutes | 265 (13.6%) | 232 (14.6%) |
| 30 to 34 Minutes | 283 (14.6%) | 190 (11.9%) |
| 35 to 39 Minutes | 46 (2.4%) | 136 (8.6%) |
| 40 to 44 Minutes | 134 (6.9%) | 88 (5.5%) |
| 45 to 59 Minutes | 387 (19.9%) | 143 (9.0%) |
| 60 to 89 Minutes | 92 (4.7%) | 184 (11.6%) |
| 90 or more Minutes | 56 (2.9%) | 56 (3.5%) |
Time of Departure to Work by Sex in East Foothills
The most frequent times of departure to work in East Foothills are 7:00 AM to 7:29 AM (402, 20.7%) for males and 8:00 AM to 8:29 AM (265, 16.7%) for females.
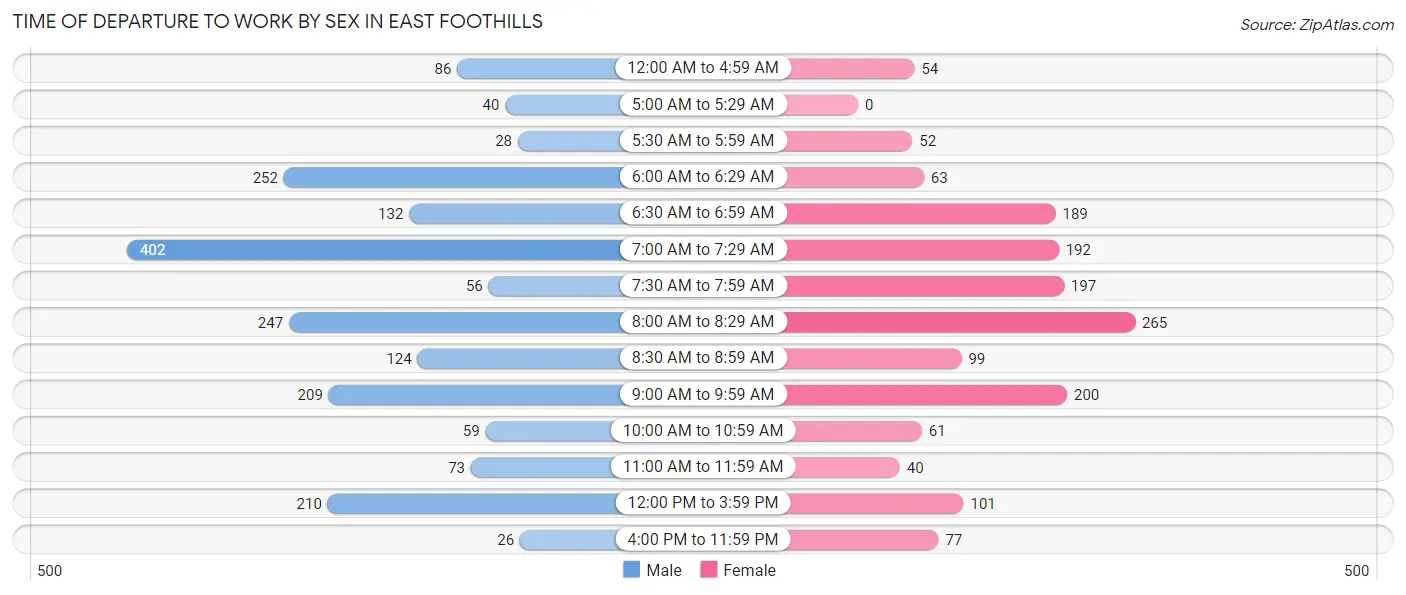
| Time of Departure | Male | Female |
| 12:00 AM to 4:59 AM | 86 (4.4%) | 54 (3.4%) |
| 5:00 AM to 5:29 AM | 40 (2.1%) | 0 (0.0%) |
| 5:30 AM to 5:59 AM | 28 (1.4%) | 52 (3.3%) |
| 6:00 AM to 6:29 AM | 252 (13.0%) | 63 (4.0%) |
| 6:30 AM to 6:59 AM | 132 (6.8%) | 189 (11.9%) |
| 7:00 AM to 7:29 AM | 402 (20.7%) | 192 (12.1%) |
| 7:30 AM to 7:59 AM | 56 (2.9%) | 197 (12.4%) |
| 8:00 AM to 8:29 AM | 247 (12.7%) | 265 (16.7%) |
| 8:30 AM to 8:59 AM | 124 (6.4%) | 99 (6.2%) |
| 9:00 AM to 9:59 AM | 209 (10.7%) | 200 (12.6%) |
| 10:00 AM to 10:59 AM | 59 (3.0%) | 61 (3.8%) |
| 11:00 AM to 11:59 AM | 73 (3.8%) | 40 (2.5%) |
| 12:00 PM to 3:59 PM | 210 (10.8%) | 101 (6.4%) |
| 4:00 PM to 11:59 PM | 26 (1.3%) | 77 (4.8%) |
| Total | 1,944 (100.0%) | 1,590 (100.0%) |
Housing Occupancy in East Foothills
Occupancy by Ownership in East Foothills
Of the total 2,372 dwellings in East Foothills, owner-occupied units account for 2,076 (87.5%), while renter-occupied units make up 296 (12.5%).
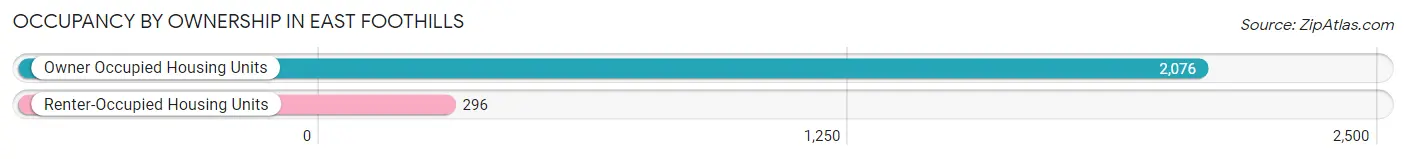
| Occupancy | # Housing Units | % Housing Units |
| Owner Occupied Housing Units | 2,076 | 87.5% |
| Renter-Occupied Housing Units | 296 | 12.5% |
| Total Occupied Housing Units | 2,372 | 100.0% |
Occupancy by Household Size in East Foothills
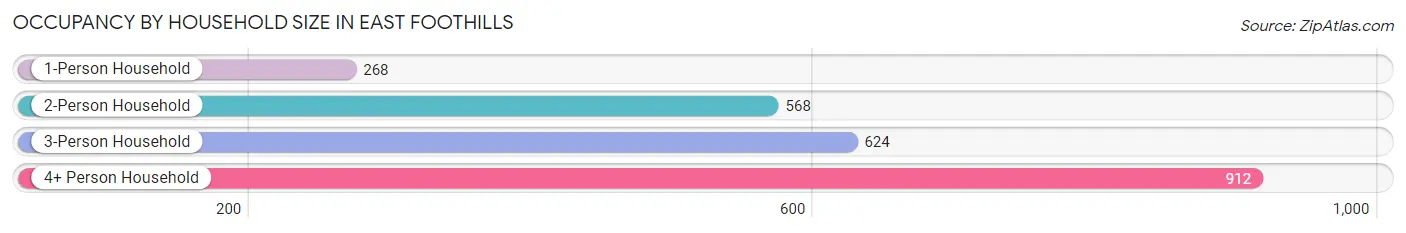
| Household Size | # Housing Units | % Housing Units |
| 1-Person Household | 268 | 11.3% |
| 2-Person Household | 568 | 23.9% |
| 3-Person Household | 624 | 26.3% |
| 4+ Person Household | 912 | 38.5% |
| Total Housing Units | 2,372 | 100.0% |
Occupancy by Ownership by Household Size in East Foothills
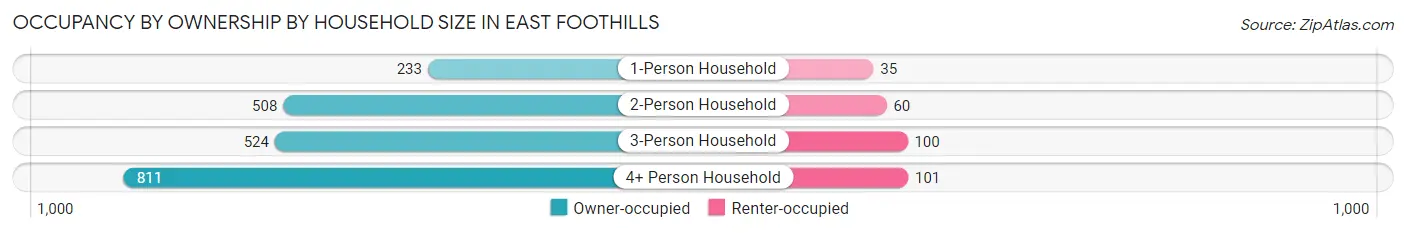
| Household Size | Owner-occupied | Renter-occupied |
| 1-Person Household | 233 (86.9%) | 35 (13.1%) |
| 2-Person Household | 508 (89.4%) | 60 (10.6%) |
| 3-Person Household | 524 (84.0%) | 100 (16.0%) |
| 4+ Person Household | 811 (88.9%) | 101 (11.1%) |
| Total Housing Units | 2,076 (87.5%) | 296 (12.5%) |
Occupancy by Educational Attainment in East Foothills
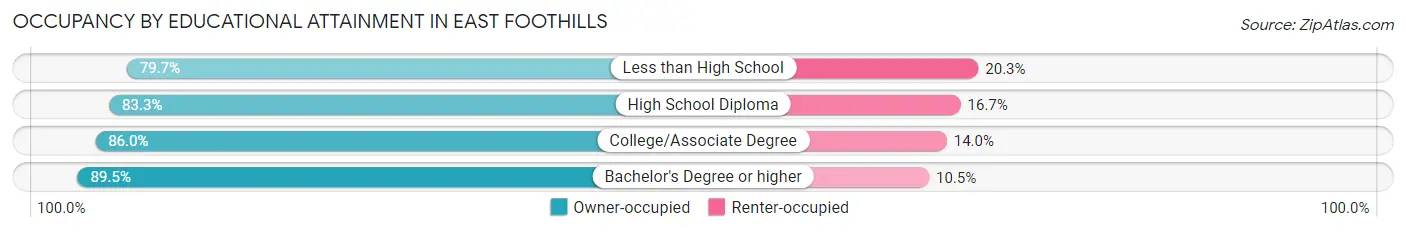
| Household Size | Owner-occupied | Renter-occupied |
| Less than High School | 122 (79.7%) | 31 (20.3%) |
| High School Diploma | 199 (83.3%) | 40 (16.7%) |
| College/Associate Degree | 424 (86.0%) | 69 (14.0%) |
| Bachelor's Degree or higher | 1,331 (89.5%) | 156 (10.5%) |
Occupancy by Age of Householder in East Foothills
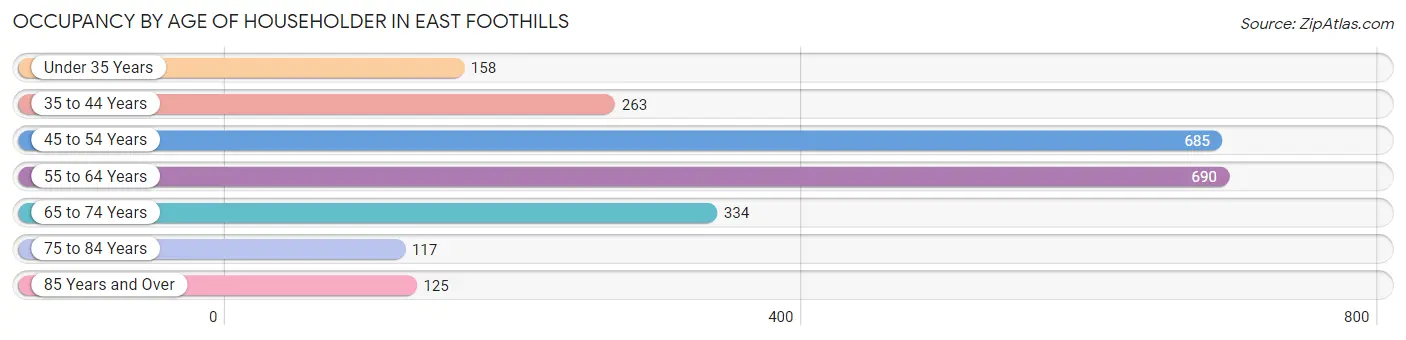
| Age Bracket | # Households | % Households |
| Under 35 Years | 158 | 6.7% |
| 35 to 44 Years | 263 | 11.1% |
| 45 to 54 Years | 685 | 28.9% |
| 55 to 64 Years | 690 | 29.1% |
| 65 to 74 Years | 334 | 14.1% |
| 75 to 84 Years | 117 | 4.9% |
| 85 Years and Over | 125 | 5.3% |
| Total | 2,372 | 100.0% |
Housing Finances in East Foothills
Median Income by Occupancy in East Foothills
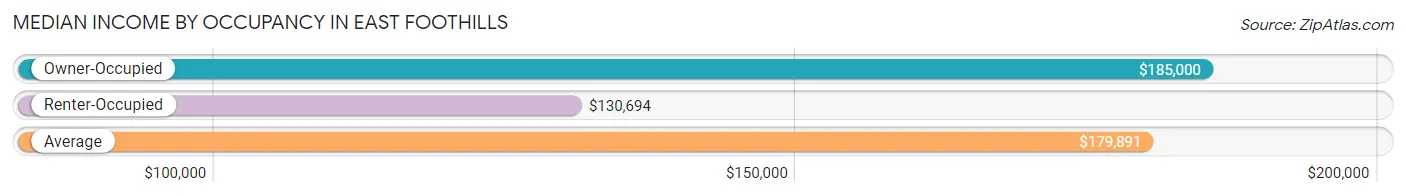
| Occupancy Type | # Households | Median Income |
| Owner-Occupied | 2,076 (87.5%) | $185,000 |
| Renter-Occupied | 296 (12.5%) | $130,694 |
| Average | 2,372 (100.0%) | $179,891 |
Occupancy by Householder Income Bracket in East Foothills
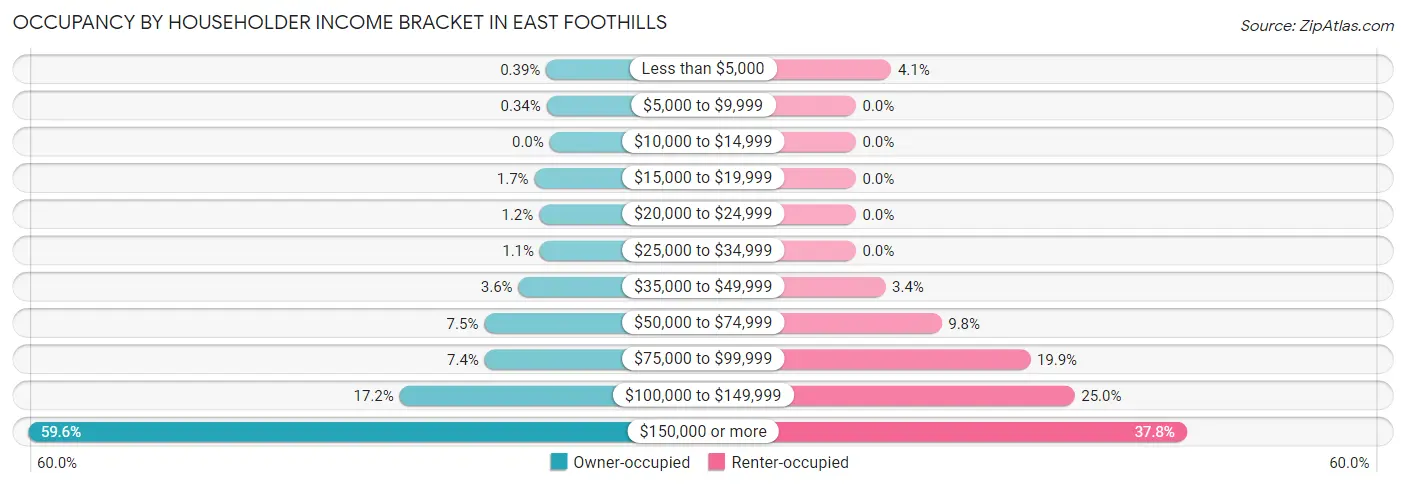
| Income Bracket | Owner-occupied | Renter-occupied |
| Less than $5,000 | 8 (0.4%) | 12 (4.1%) |
| $5,000 to $9,999 | 7 (0.3%) | 0 (0.0%) |
| $10,000 to $14,999 | 0 (0.0%) | 0 (0.0%) |
| $15,000 to $19,999 | 36 (1.7%) | 0 (0.0%) |
| $20,000 to $24,999 | 25 (1.2%) | 0 (0.0%) |
| $25,000 to $34,999 | 23 (1.1%) | 0 (0.0%) |
| $35,000 to $49,999 | 74 (3.6%) | 10 (3.4%) |
| $50,000 to $74,999 | 155 (7.5%) | 29 (9.8%) |
| $75,000 to $99,999 | 154 (7.4%) | 59 (19.9%) |
| $100,000 to $149,999 | 356 (17.2%) | 74 (25.0%) |
| $150,000 or more | 1,238 (59.6%) | 112 (37.8%) |
| Total | 2,076 (100.0%) | 296 (100.0%) |
Monthly Housing Cost Tiers in East Foothills
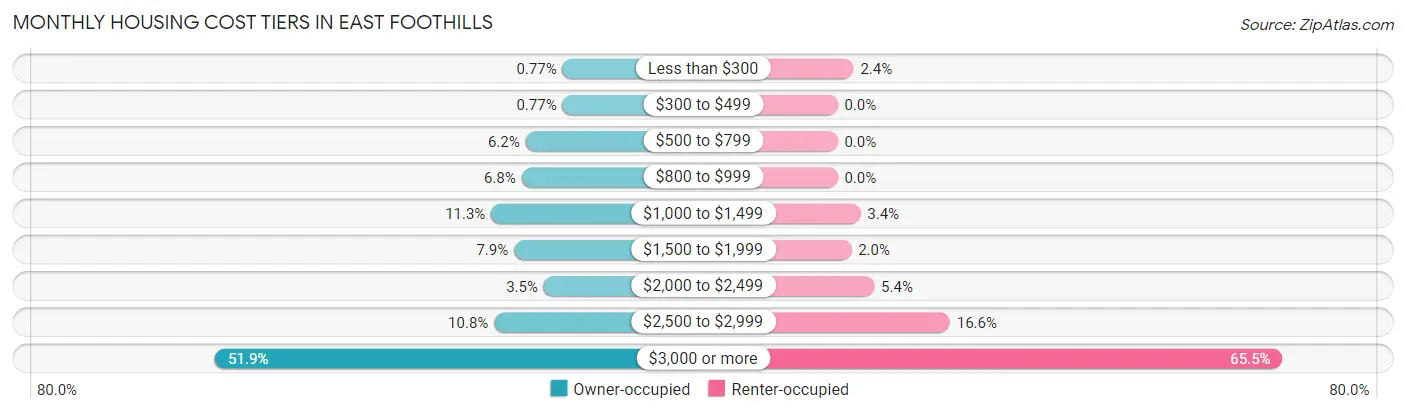
| Monthly Cost | Owner-occupied | Renter-occupied |
| Less than $300 | 16 (0.8%) | 7 (2.4%) |
| $300 to $499 | 16 (0.8%) | 0 (0.0%) |
| $500 to $799 | 129 (6.2%) | 0 (0.0%) |
| $800 to $999 | 141 (6.8%) | 0 (0.0%) |
| $1,000 to $1,499 | 234 (11.3%) | 10 (3.4%) |
| $1,500 to $1,999 | 164 (7.9%) | 6 (2.0%) |
| $2,000 to $2,499 | 73 (3.5%) | 16 (5.4%) |
| $2,500 to $2,999 | 225 (10.8%) | 49 (16.6%) |
| $3,000 or more | 1,078 (51.9%) | 194 (65.5%) |
| Total | 2,076 (100.0%) | 296 (100.0%) |
Physical Housing Characteristics in East Foothills
Housing Structures in East Foothills
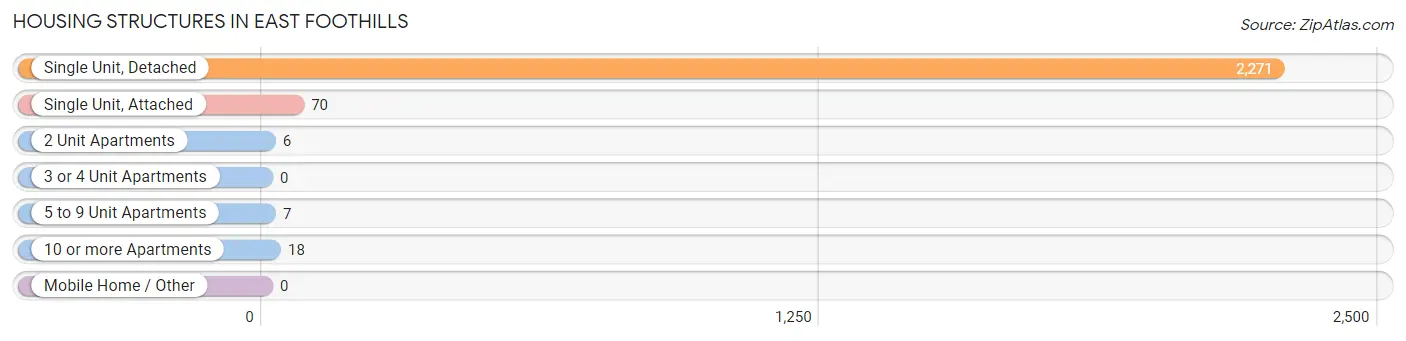
| Structure Type | # Housing Units | % Housing Units |
| Single Unit, Detached | 2,271 | 95.7% |
| Single Unit, Attached | 70 | 2.9% |
| 2 Unit Apartments | 6 | 0.3% |
| 3 or 4 Unit Apartments | 0 | 0.0% |
| 5 to 9 Unit Apartments | 7 | 0.3% |
| 10 or more Apartments | 18 | 0.8% |
| Mobile Home / Other | 0 | 0.0% |
| Total | 2,372 | 100.0% |
Housing Structures by Occupancy in East Foothills
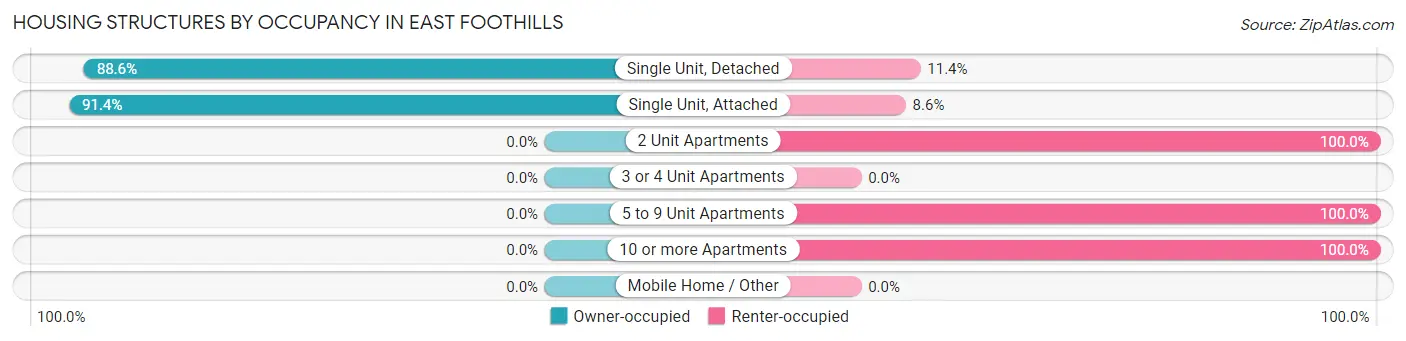
| Structure Type | Owner-occupied | Renter-occupied |
| Single Unit, Detached | 2,012 (88.6%) | 259 (11.4%) |
| Single Unit, Attached | 64 (91.4%) | 6 (8.6%) |
| 2 Unit Apartments | 0 (0.0%) | 6 (100.0%) |
| 3 or 4 Unit Apartments | 0 (0.0%) | 0 (0.0%) |
| 5 to 9 Unit Apartments | 0 (0.0%) | 7 (100.0%) |
| 10 or more Apartments | 0 (0.0%) | 18 (100.0%) |
| Mobile Home / Other | 0 (0.0%) | 0 (0.0%) |
| Total | 2,076 (87.5%) | 296 (12.5%) |
Housing Structures by Number of Rooms in East Foothills
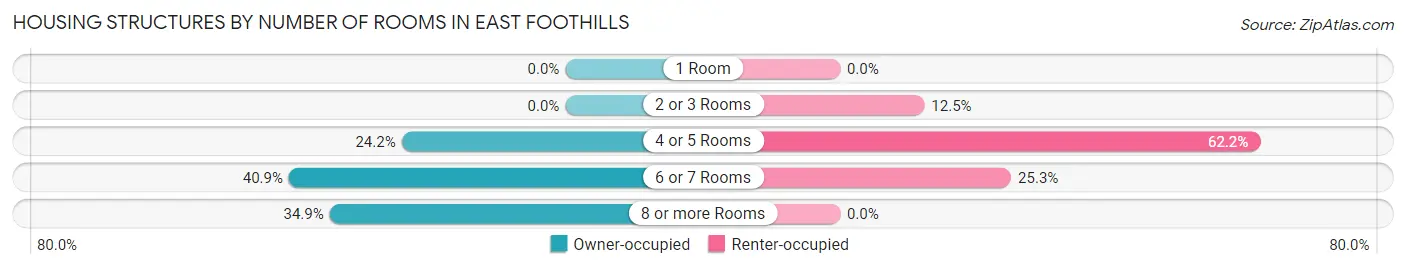
| Number of Rooms | Owner-occupied | Renter-occupied |
| 1 Room | 0 (0.0%) | 0 (0.0%) |
| 2 or 3 Rooms | 0 (0.0%) | 37 (12.5%) |
| 4 or 5 Rooms | 503 (24.2%) | 184 (62.2%) |
| 6 or 7 Rooms | 849 (40.9%) | 75 (25.3%) |
| 8 or more Rooms | 724 (34.9%) | 0 (0.0%) |
| Total | 2,076 (100.0%) | 296 (100.0%) |
Housing Structure by Heating Type in East Foothills
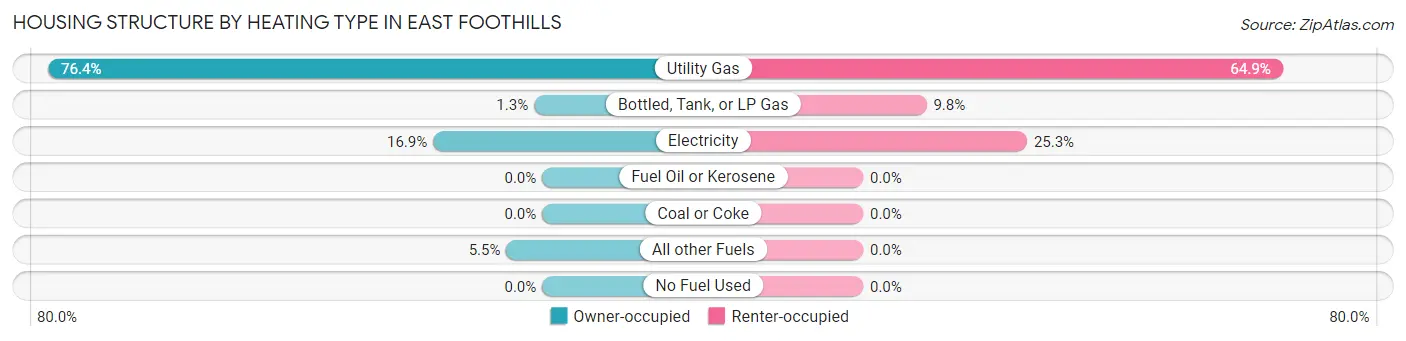
| Heating Type | Owner-occupied | Renter-occupied |
| Utility Gas | 1,585 (76.3%) | 192 (64.9%) |
| Bottled, Tank, or LP Gas | 26 (1.3%) | 29 (9.8%) |
| Electricity | 350 (16.9%) | 75 (25.3%) |
| Fuel Oil or Kerosene | 0 (0.0%) | 0 (0.0%) |
| Coal or Coke | 0 (0.0%) | 0 (0.0%) |
| All other Fuels | 115 (5.5%) | 0 (0.0%) |
| No Fuel Used | 0 (0.0%) | 0 (0.0%) |
| Total | 2,076 (100.0%) | 296 (100.0%) |
Household Vehicle Usage in East Foothills
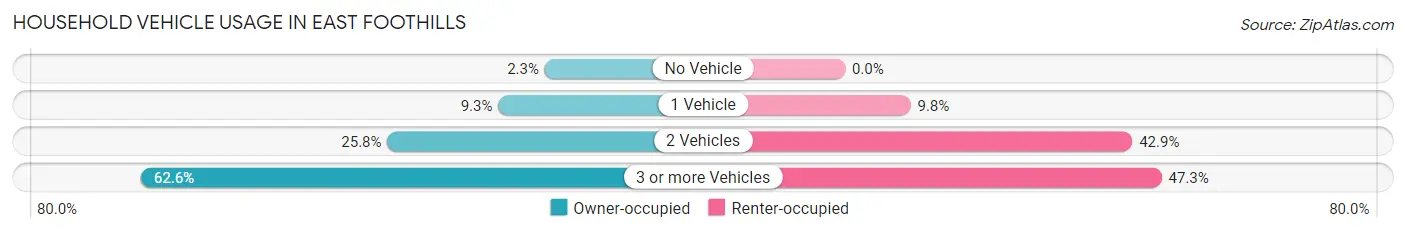
| Vehicles per Household | Owner-occupied | Renter-occupied |
| No Vehicle | 48 (2.3%) | 0 (0.0%) |
| 1 Vehicle | 192 (9.2%) | 29 (9.8%) |
| 2 Vehicles | 536 (25.8%) | 127 (42.9%) |
| 3 or more Vehicles | 1,300 (62.6%) | 140 (47.3%) |
| Total | 2,076 (100.0%) | 296 (100.0%) |
Real Estate & Mortgages in East Foothills
Real Estate and Mortgage Overview in East Foothills
| Characteristic | Without Mortgage | With Mortgage |
| Housing Units | 581 | 1,495 |
| Median Property Value | $1,142,300 | $1,160,600 |
| Median Household Income | $133,295 | $994 |
| Monthly Housing Costs | $1,097 | $1,078 |
| Real Estate Taxes | $7,507 | $44 |
Property Value by Mortgage Status in East Foothills
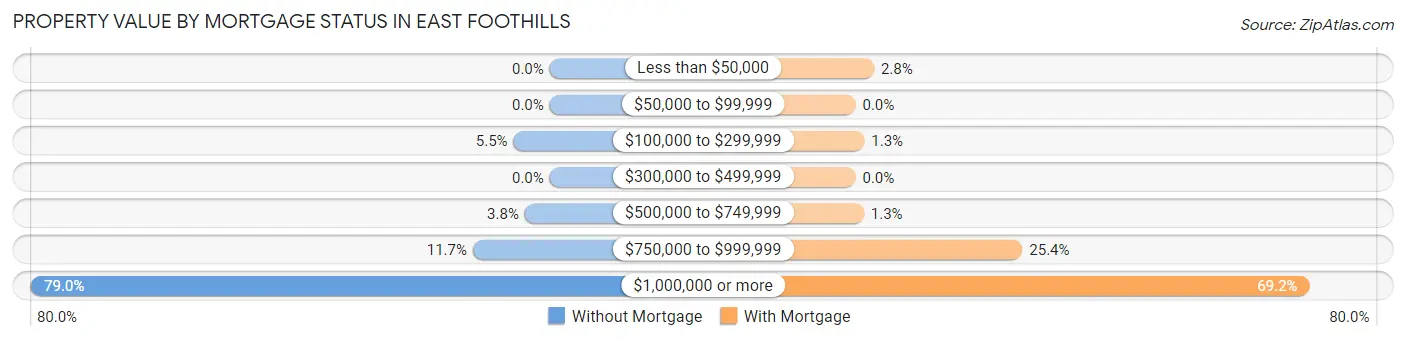
| Property Value | Without Mortgage | With Mortgage |
| Less than $50,000 | 0 (0.0%) | 42 (2.8%) |
| $50,000 to $99,999 | 0 (0.0%) | 0 (0.0%) |
| $100,000 to $299,999 | 32 (5.5%) | 20 (1.3%) |
| $300,000 to $499,999 | 0 (0.0%) | 0 (0.0%) |
| $500,000 to $749,999 | 22 (3.8%) | 19 (1.3%) |
| $750,000 to $999,999 | 68 (11.7%) | 380 (25.4%) |
| $1,000,000 or more | 459 (79.0%) | 1,034 (69.2%) |
| Total | 581 (100.0%) | 1,495 (100.0%) |
Household Income by Mortgage Status in East Foothills
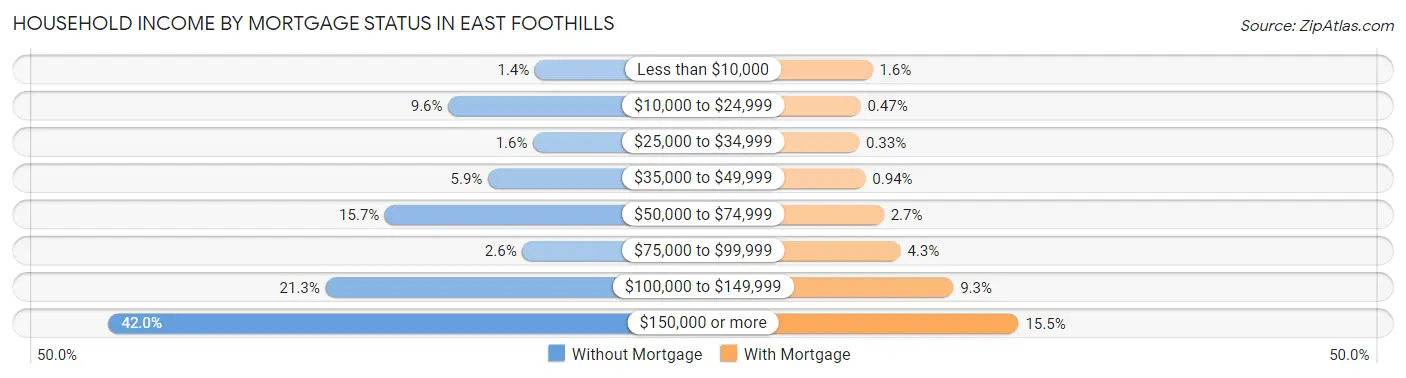
| Household Income | Without Mortgage | With Mortgage |
| Less than $10,000 | 8 (1.4%) | 24 (1.6%) |
| $10,000 to $24,999 | 56 (9.6%) | 7 (0.5%) |
| $25,000 to $34,999 | 9 (1.5%) | 5 (0.3%) |
| $35,000 to $49,999 | 34 (5.9%) | 14 (0.9%) |
| $50,000 to $74,999 | 91 (15.7%) | 40 (2.7%) |
| $75,000 to $99,999 | 15 (2.6%) | 64 (4.3%) |
| $100,000 to $149,999 | 124 (21.3%) | 139 (9.3%) |
| $150,000 or more | 244 (42.0%) | 232 (15.5%) |
| Total | 581 (100.0%) | 1,495 (100.0%) |
Property Value to Household Income Ratio in East Foothills
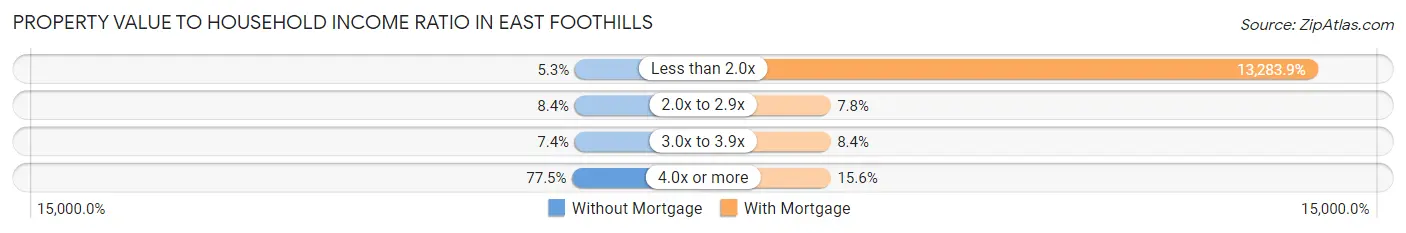
| Value-to-Income Ratio | Without Mortgage | With Mortgage |
| Less than 2.0x | 31 (5.3%) | 198,594 (13,283.9%) |
| 2.0x to 2.9x | 49 (8.4%) | 117 (7.8%) |
| 3.0x to 3.9x | 43 (7.4%) | 126 (8.4%) |
| 4.0x or more | 450 (77.4%) | 233 (15.6%) |
| Total | 581 (100.0%) | 1,495 (100.0%) |
Real Estate Taxes by Mortgage Status in East Foothills
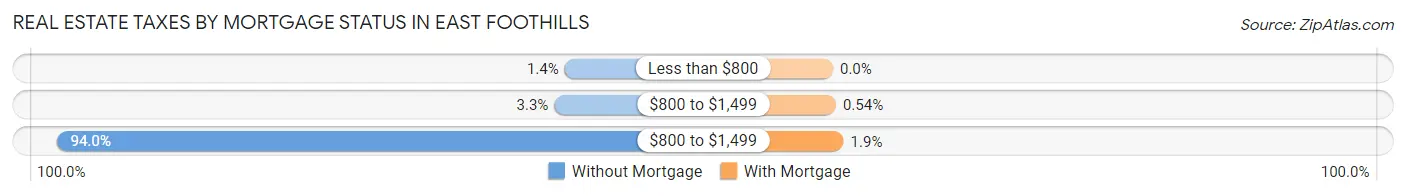
| Property Taxes | Without Mortgage | With Mortgage |
| Less than $800 | 8 (1.4%) | 0 (0.0%) |
| $800 to $1,499 | 19 (3.3%) | 8 (0.5%) |
| $800 to $1,499 | 546 (94.0%) | 29 (1.9%) |
| Total | 581 (100.0%) | 1,495 (100.0%) |
Health & Disability in East Foothills
Health Insurance Coverage by Age in East Foothills
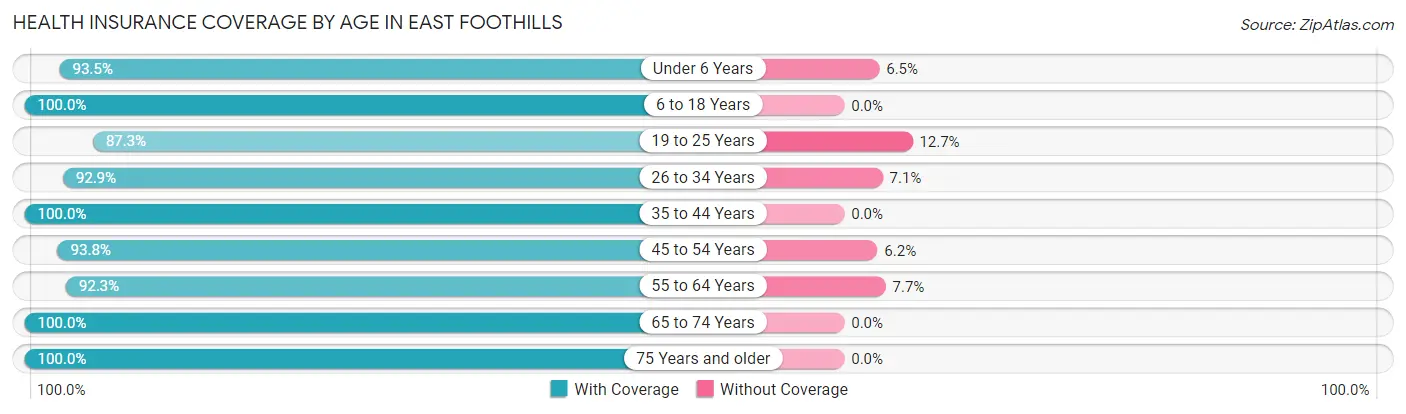
| Age Bracket | With Coverage | Without Coverage |
| Under 6 Years | 344 (93.5%) | 24 (6.5%) |
| 6 to 18 Years | 1,316 (100.0%) | 0 (0.0%) |
| 19 to 25 Years | 508 (87.3%) | 74 (12.7%) |
| 26 to 34 Years | 950 (92.9%) | 73 (7.1%) |
| 35 to 44 Years | 906 (100.0%) | 0 (0.0%) |
| 45 to 54 Years | 1,217 (93.8%) | 80 (6.2%) |
| 55 to 64 Years | 1,319 (92.3%) | 110 (7.7%) |
| 65 to 74 Years | 891 (100.0%) | 0 (0.0%) |
| 75 Years and older | 439 (100.0%) | 0 (0.0%) |
| Total | 7,890 (95.6%) | 361 (4.4%) |
Health Insurance Coverage by Citizenship Status in East Foothills
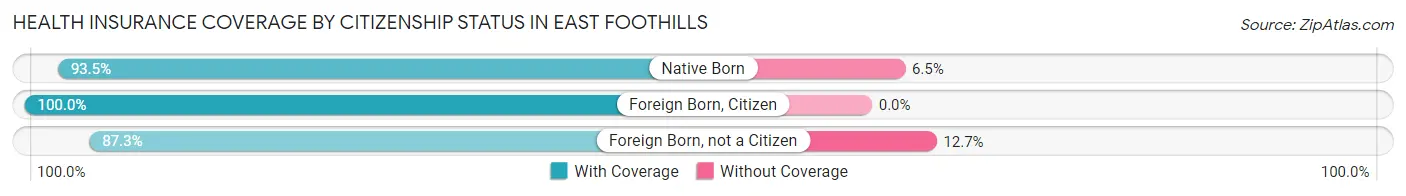
| Citizenship Status | With Coverage | Without Coverage |
| Native Born | 344 (93.5%) | 24 (6.5%) |
| Foreign Born, Citizen | 1,316 (100.0%) | 0 (0.0%) |
| Foreign Born, not a Citizen | 508 (87.3%) | 74 (12.7%) |
Health Insurance Coverage by Household Income in East Foothills
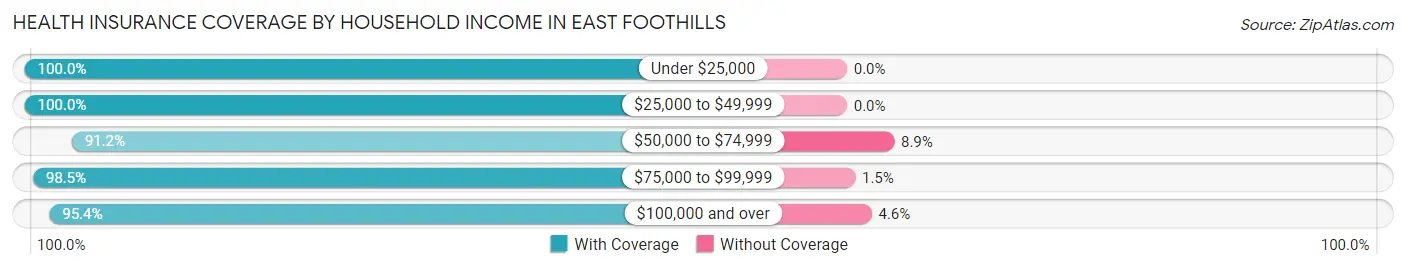
| Household Income | With Coverage | Without Coverage |
| Under $25,000 | 124 (100.0%) | 0 (0.0%) |
| $25,000 to $49,999 | 232 (100.0%) | 0 (0.0%) |
| $50,000 to $74,999 | 484 (91.1%) | 47 (8.8%) |
| $75,000 to $99,999 | 893 (98.5%) | 14 (1.5%) |
| $100,000 and over | 6,031 (95.4%) | 293 (4.6%) |
Public vs Private Health Insurance Coverage by Age in East Foothills
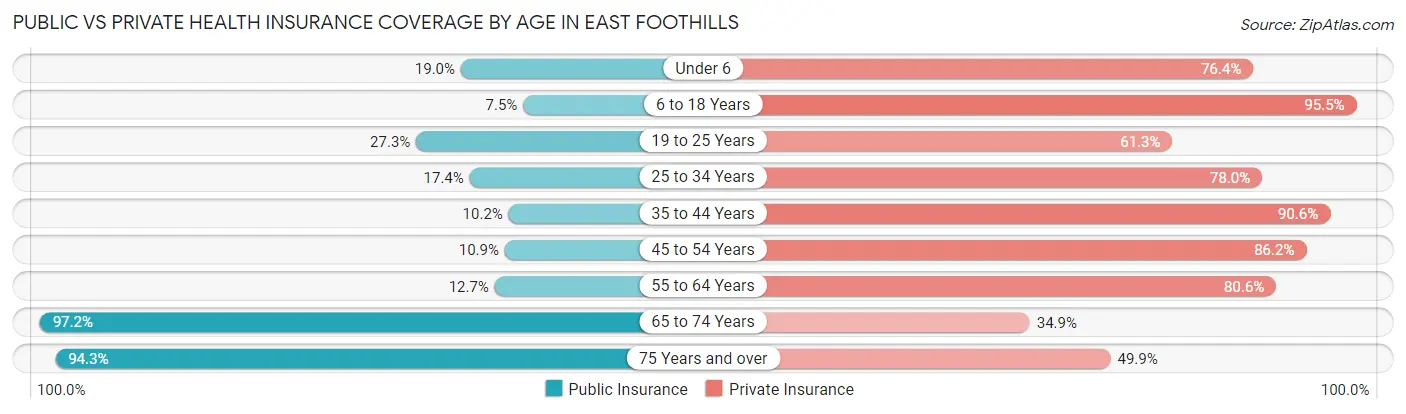
| Age Bracket | Public Insurance | Private Insurance |
| Under 6 | 70 (19.0%) | 281 (76.4%) |
| 6 to 18 Years | 98 (7.4%) | 1,257 (95.5%) |
| 19 to 25 Years | 159 (27.3%) | 357 (61.3%) |
| 25 to 34 Years | 178 (17.4%) | 798 (78.0%) |
| 35 to 44 Years | 92 (10.2%) | 821 (90.6%) |
| 45 to 54 Years | 141 (10.9%) | 1,118 (86.2%) |
| 55 to 64 Years | 182 (12.7%) | 1,152 (80.6%) |
| 65 to 74 Years | 866 (97.2%) | 311 (34.9%) |
| 75 Years and over | 414 (94.3%) | 219 (49.9%) |
| Total | 2,200 (26.7%) | 6,314 (76.5%) |
Disability Status by Sex by Age in East Foothills
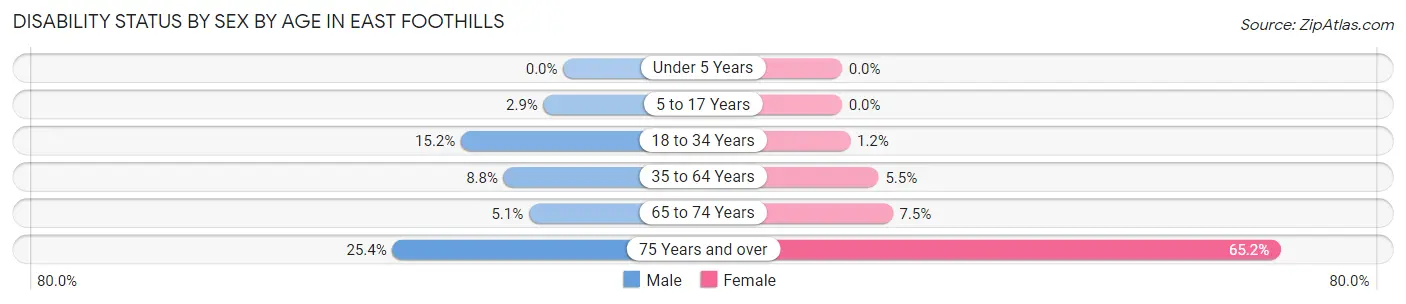
| Age Bracket | Male | Female |
| Under 5 Years | 0 (0.0%) | 0 (0.0%) |
| 5 to 17 Years | 21 (2.9%) | 0 (0.0%) |
| 18 to 34 Years | 163 (15.2%) | 8 (1.2%) |
| 35 to 64 Years | 167 (8.8%) | 95 (5.4%) |
| 65 to 74 Years | 23 (5.1%) | 33 (7.5%) |
| 75 Years and over | 53 (25.4%) | 150 (65.2%) |
Disability Class by Sex by Age in East Foothills
Disability Class: Hearing Difficulty
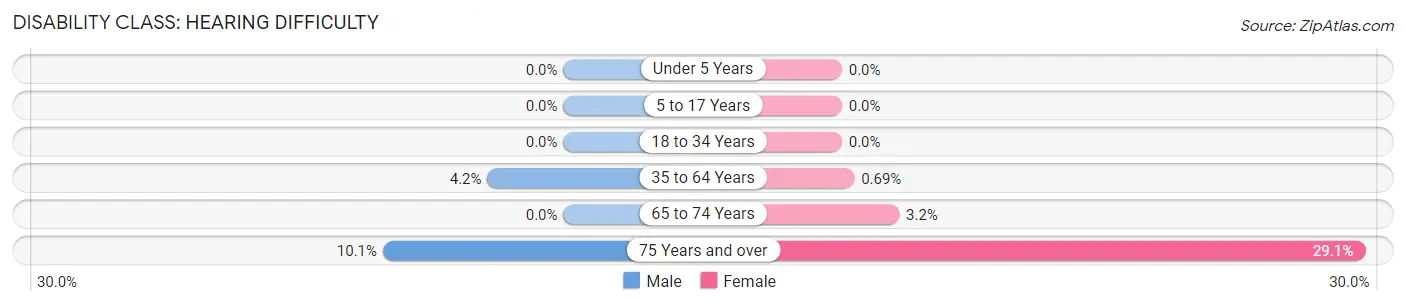
| Age Bracket | Male | Female |
| Under 5 Years | 0 (0.0%) | 0 (0.0%) |
| 5 to 17 Years | 0 (0.0%) | 0 (0.0%) |
| 18 to 34 Years | 0 (0.0%) | 0 (0.0%) |
| 35 to 64 Years | 80 (4.2%) | 12 (0.7%) |
| 65 to 74 Years | 0 (0.0%) | 14 (3.2%) |
| 75 Years and over | 21 (10.1%) | 67 (29.1%) |
Disability Class: Vision Difficulty
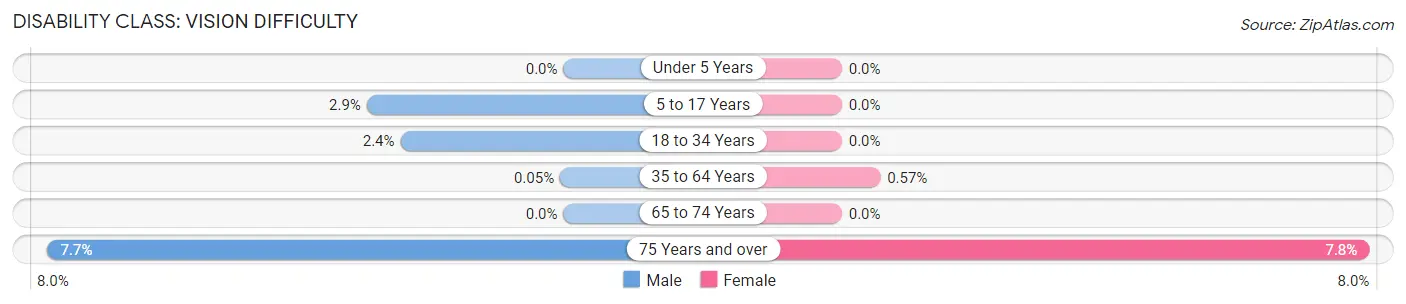
| Age Bracket | Male | Female |
| Under 5 Years | 0 (0.0%) | 0 (0.0%) |
| 5 to 17 Years | 21 (2.9%) | 0 (0.0%) |
| 18 to 34 Years | 26 (2.4%) | 0 (0.0%) |
| 35 to 64 Years | 1 (0.1%) | 10 (0.6%) |
| 65 to 74 Years | 0 (0.0%) | 0 (0.0%) |
| 75 Years and over | 16 (7.7%) | 18 (7.8%) |
Disability Class: Cognitive Difficulty
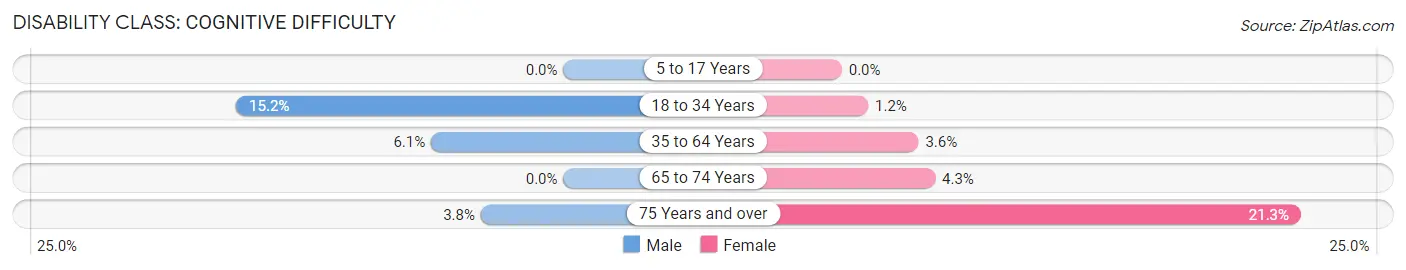
| Age Bracket | Male | Female |
| 5 to 17 Years | 0 (0.0%) | 0 (0.0%) |
| 18 to 34 Years | 163 (15.2%) | 8 (1.2%) |
| 35 to 64 Years | 116 (6.1%) | 62 (3.6%) |
| 65 to 74 Years | 0 (0.0%) | 19 (4.3%) |
| 75 Years and over | 8 (3.8%) | 49 (21.3%) |
Disability Class: Ambulatory Difficulty
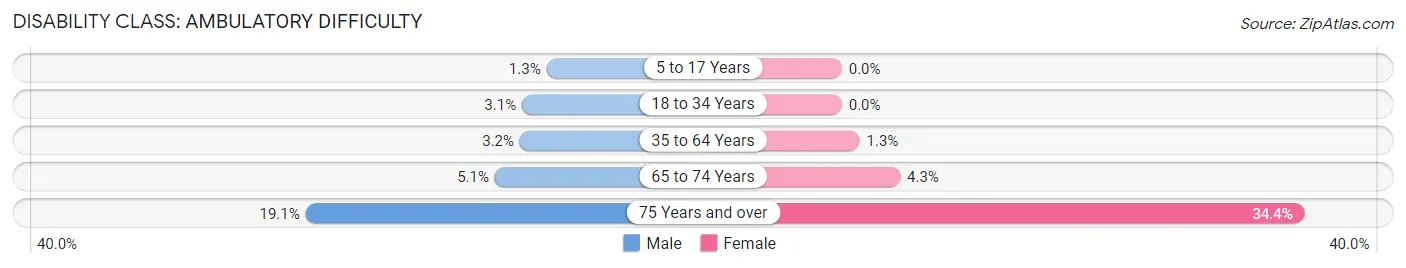
| Age Bracket | Male | Female |
| 5 to 17 Years | 9 (1.3%) | 0 (0.0%) |
| 18 to 34 Years | 33 (3.1%) | 0 (0.0%) |
| 35 to 64 Years | 61 (3.2%) | 23 (1.3%) |
| 65 to 74 Years | 23 (5.1%) | 19 (4.3%) |
| 75 Years and over | 40 (19.1%) | 79 (34.4%) |
Disability Class: Self-Care Difficulty
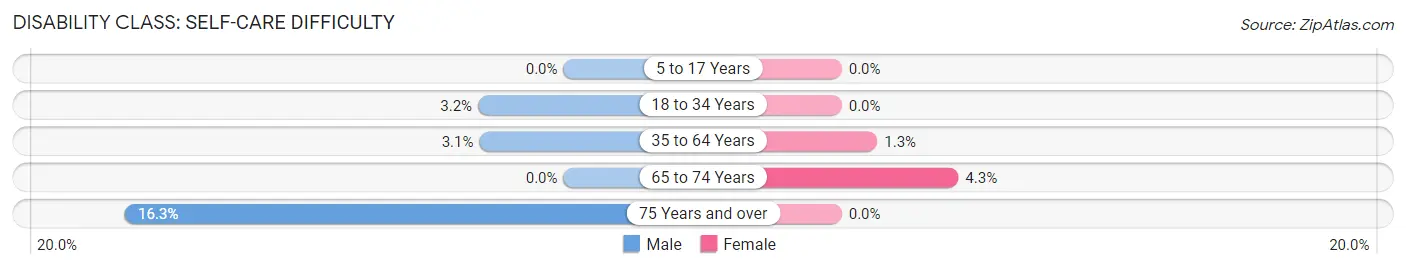
| Age Bracket | Male | Female |
| 5 to 17 Years | 0 (0.0%) | 0 (0.0%) |
| 18 to 34 Years | 34 (3.2%) | 0 (0.0%) |
| 35 to 64 Years | 59 (3.1%) | 23 (1.3%) |
| 65 to 74 Years | 0 (0.0%) | 19 (4.3%) |
| 75 Years and over | 34 (16.3%) | 0 (0.0%) |
Technology Access in East Foothills
Computing Device Access in East Foothills
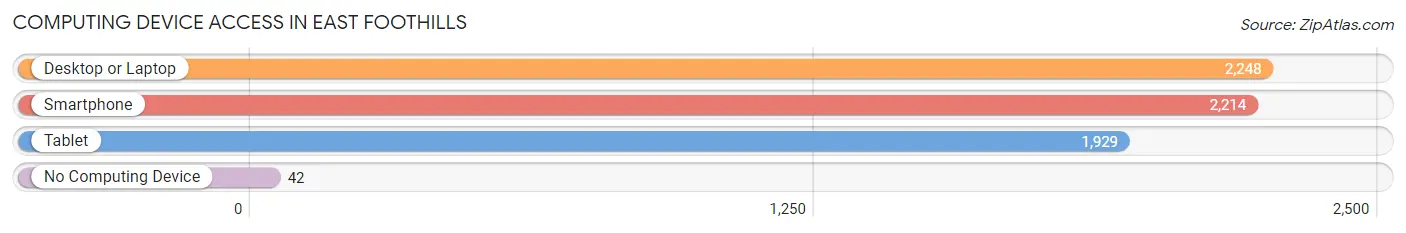
| Device Type | # Households | % Households |
| Desktop or Laptop | 2,248 | 94.8% |
| Smartphone | 2,214 | 93.3% |
| Tablet | 1,929 | 81.3% |
| No Computing Device | 42 | 1.8% |
| Total | 2,372 | 100.0% |
Internet Access in East Foothills
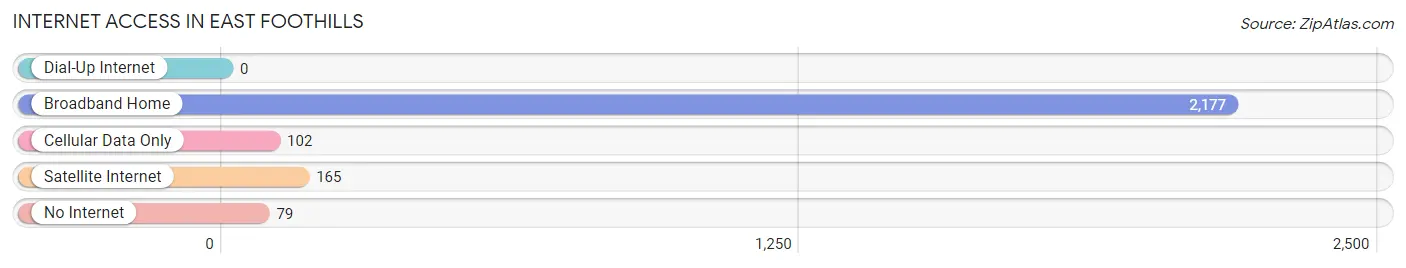
| Internet Type | # Households | % Households |
| Dial-Up Internet | 0 | 0.0% |
| Broadband Home | 2,177 | 91.8% |
| Cellular Data Only | 102 | 4.3% |
| Satellite Internet | 165 | 7.0% |
| No Internet | 79 | 3.3% |
| Total | 2,372 | 100.0% |
East Foothills Summary
East Foothills is a census-designated place (CDP) located in Santa Clara County, California, United States. The population was 8,945 at the 2010 census. It is located in the foothills of the Santa Cruz Mountains, east of San Jose.
History
East Foothills was originally inhabited by the Ohlone people, who lived in the area for thousands of years before the arrival of Europeans. The first Europeans to settle in the area were Spanish missionaries, who established a mission in nearby Santa Clara in 1777. The area remained largely rural until the 1950s, when the population began to grow rapidly due to the influx of people from the San Francisco Bay Area.
Geography
East Foothills is located at 37°17'25" North, 121°53'45" West (37.290278, -121.895833). It is situated in the foothills of the Santa Cruz Mountains, east of San Jose. The area is characterized by rolling hills and valleys, with elevations ranging from 500 to 1,000 feet.
The climate in East Foothills is mild, with temperatures ranging from the mid-50s to the mid-70s in the summer months. The area receives an average of 15 inches of rain per year.
Economy
East Foothills is primarily a residential area, with most of its residents commuting to nearby cities for work. The area is home to several small businesses, including restaurants, retail stores, and professional services.
Demographics
As of the 2010 census, there were 8,945 people, 3,093 households, and 2,541 families residing in East Foothills. The population density was 1,845.3 people per square mile (711.7/km2). The racial makeup of East Foothills was 68.2% White, 8.2% African American, 0.7% Native American, 14.2% Asian, 0.2% Pacific Islander, 4.3% from other races, and 4.2% from two or more races. Hispanic or Latino of any race were 11.3% of the population.
The median income for a household in East Foothills was $90,945, and the median income for a family was $103,945. Males had a median income of $71,945 versus $50,945 for females. The per capita income for the CDP was $37,945. About 3.2% of families and 4.3% of the population were below the poverty line, including 5.2% of those under age 18 and 4.3% of those age 65 or over.
Common Questions
What is Per Capita Income in East Foothills?
Per Capita income in East Foothills is $65,823.
What is the Median Family Income in East Foothills?
Median Family Income in East Foothills is $180,969.
What is the Median Household income in East Foothills?
Median Household Income in East Foothills is $179,891.
What is Income or Wage Gap in East Foothills?
Income or Wage Gap in East Foothills is 9.7%.
Women in East Foothills earn 90.3 cents for every dollar earned by a man.
What is Inequality or Gini Index in East Foothills?
Inequality or Gini Index in East Foothills is 0.41.
What is the Total Population of East Foothills?
Total Population of East Foothills is 8,270.
What is the Total Male Population of East Foothills?
Total Male Population of East Foothills is 4,522.
What is the Total Female Population of East Foothills?
Total Female Population of East Foothills is 3,748.
What is the Ratio of Males per 100 Females in East Foothills?
There are 120.65 Males per 100 Females in East Foothills.
What is the Ratio of Females per 100 Males in East Foothills?
There are 82.88 Females per 100 Males in East Foothills.
What is the Median Population Age in East Foothills?
Median Population Age in East Foothills is 44.3 Years.
What is the Average Family Size in East Foothills
Average Family Size in East Foothills is 3.6 People.
What is the Average Household Size in East Foothills
Average Household Size in East Foothills is 3.4 People.
How Large is the Labor Force in East Foothills?
There are 4,606 People in the Labor Forcein in East Foothills.
What is the Percentage of People in the Labor Force in East Foothills?
65.6% of People are in the Labor Force in East Foothills.
What is the Unemployment Rate in East Foothills?
Unemployment Rate in East Foothills is 3.2%.