French Valley, CA Map & Demographics
French Valley Map
French Valley Overview
$38,369
PER CAPITA INCOME
$125,746
AVG FAMILY INCOME
$124,115
AVG HOUSEHOLD INCOME
48.3%
WAGE / INCOME GAP [ % ]
51.7¢/ $1
WAGE / INCOME GAP [ $ ]
0.33
INEQUALITY / GINI INDEX
41,239
TOTAL POPULATION
20,281
MALE POPULATION
20,958
FEMALE POPULATION
96.77
MALES / 100 FEMALES
103.34
FEMALES / 100 MALES
33.8
MEDIAN AGE
3.9
AVG FAMILY SIZE
3.8
AVG HOUSEHOLD SIZE
18,402
LABOR FORCE [ PEOPLE ]
62.7%
PERCENT IN LABOR FORCE
7.7%
UNEMPLOYMENT RATE
Income in French Valley
Income Overview in French Valley
Per Capita Income in French Valley is $38,369, while median incomes of families and households are $125,746 and $124,115 respectively.
| Characteristic | Number | Measure |
| Per Capita Income | 41,239 | $38,369 |
| Median Family Income | 9,407 | $125,746 |
| Mean Family Income | 9,407 | $145,842 |
| Median Household Income | 10,697 | $124,115 |
| Mean Household Income | 10,697 | $143,239 |
| Income Deficit | 9,407 | $0 |
| Wage / Income Gap (%) | 41,239 | 48.27% |
| Wage / Income Gap ($) | 41,239 | 51.73¢ per $1 |
| Gini / Inequality Index | 41,239 | 0.33 |
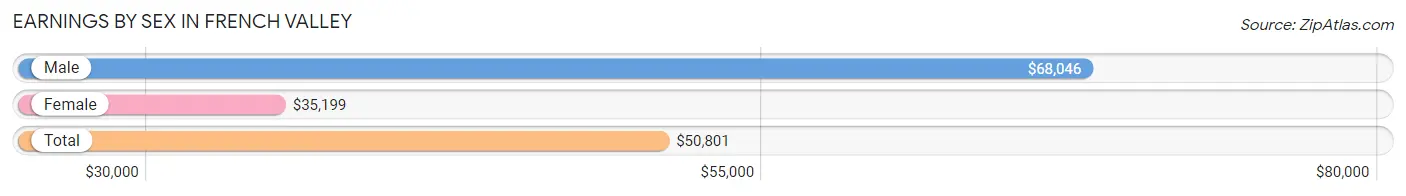
Earnings by Sex in French Valley
Average Earnings in French Valley are $50,801, $68,046 for men and $35,199 for women, a difference of 48.3%.
| Sex | Number | Average Earnings |
| Male | 10,273 (53.4%) | $68,046 |
| Female | 8,968 (46.6%) | $35,199 |
| Total | 19,241 (100.0%) | $50,801 |
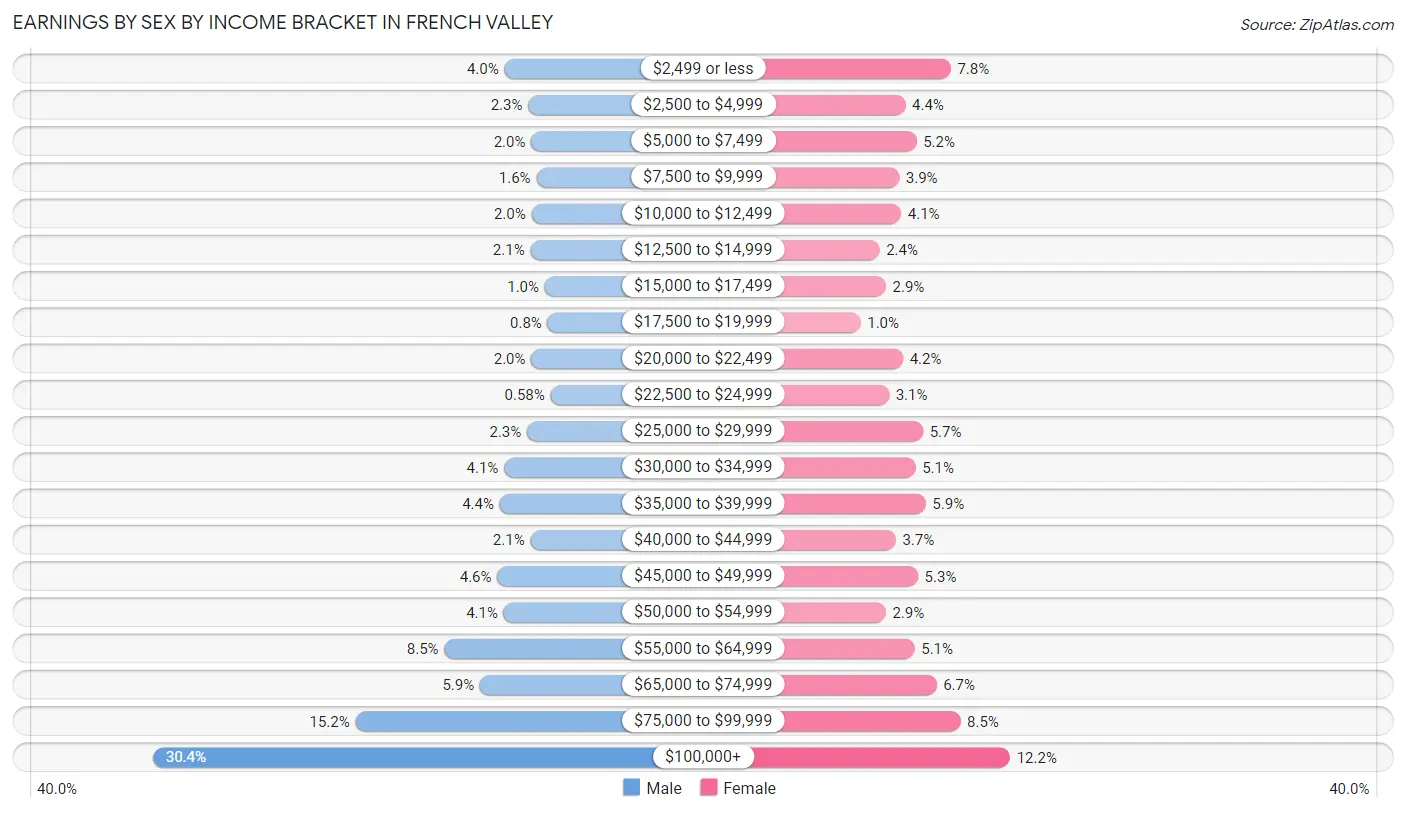
Earnings by Sex by Income Bracket in French Valley
The most common earnings brackets in French Valley are $100,000+ for men (3,122 | 30.4%) and $100,000+ for women (1,095 | 12.2%).
| Income | Male | Female |
| $2,499 or less | 414 (4.0%) | 697 (7.8%) |
| $2,500 to $4,999 | 231 (2.2%) | 392 (4.4%) |
| $5,000 to $7,499 | 209 (2.0%) | 466 (5.2%) |
| $7,500 to $9,999 | 168 (1.6%) | 350 (3.9%) |
| $10,000 to $12,499 | 206 (2.0%) | 363 (4.1%) |
| $12,500 to $14,999 | 215 (2.1%) | 218 (2.4%) |
| $15,000 to $17,499 | 104 (1.0%) | 261 (2.9%) |
| $17,500 to $19,999 | 82 (0.8%) | 91 (1.0%) |
| $20,000 to $22,499 | 208 (2.0%) | 376 (4.2%) |
| $22,500 to $24,999 | 60 (0.6%) | 282 (3.1%) |
| $25,000 to $29,999 | 240 (2.3%) | 510 (5.7%) |
| $30,000 to $34,999 | 417 (4.1%) | 460 (5.1%) |
| $35,000 to $39,999 | 451 (4.4%) | 528 (5.9%) |
| $40,000 to $44,999 | 215 (2.1%) | 327 (3.6%) |
| $45,000 to $49,999 | 469 (4.6%) | 476 (5.3%) |
| $50,000 to $54,999 | 420 (4.1%) | 260 (2.9%) |
| $55,000 to $64,999 | 877 (8.5%) | 454 (5.1%) |
| $65,000 to $74,999 | 603 (5.9%) | 601 (6.7%) |
| $75,000 to $99,999 | 1,562 (15.2%) | 761 (8.5%) |
| $100,000+ | 3,122 (30.4%) | 1,095 (12.2%) |
| Total | 10,273 (100.0%) | 8,968 (100.0%) |
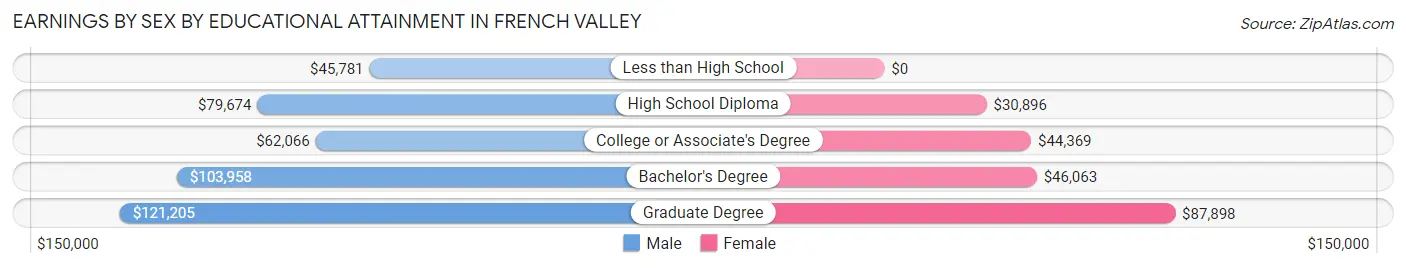
Earnings by Sex by Educational Attainment in French Valley
Average earnings in French Valley are $75,267 for men and $44,239 for women, a difference of 41.2%. Men with an educational attainment of graduate degree enjoy the highest average annual earnings of $121,205, while those with less than high school education earn the least with $45,781. Women with an educational attainment of graduate degree earn the most with the average annual earnings of $87,898, while those with high school diploma education have the smallest earnings of $30,896.
| Educational Attainment | Male Income | Female Income |
| Less than High School | $45,781 | $0 |
| High School Diploma | $79,674 | $30,896 |
| College or Associate's Degree | $62,066 | $44,369 |
| Bachelor's Degree | $103,958 | $46,063 |
| Graduate Degree | $121,205 | $87,898 |
| Total | $75,267 | $44,239 |
Family Income in French Valley
Family Income Brackets in French Valley
According to the French Valley family income data, there are 2,926 families falling into the $100,000 to $149,999 income range, which is the most common income bracket and makes up 31.1% of all families. Conversely, the $10,000 to $14,999 income bracket is the least frequent group with only 47 families (0.5%) belonging to this category.
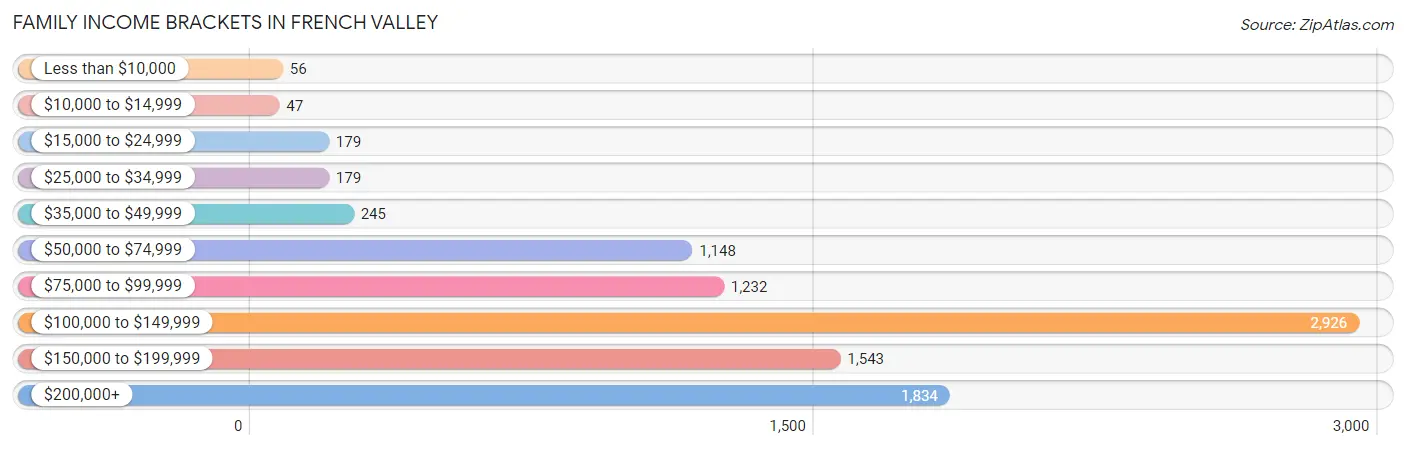
| Income Bracket | # Families | % Families |
| Less than $10,000 | 56 | 0.6% |
| $10,000 to $14,999 | 47 | 0.5% |
| $15,000 to $24,999 | 179 | 1.9% |
| $25,000 to $34,999 | 179 | 1.9% |
| $35,000 to $49,999 | 245 | 2.6% |
| $50,000 to $74,999 | 1,148 | 12.2% |
| $75,000 to $99,999 | 1,232 | 13.1% |
| $100,000 to $149,999 | 2,926 | 31.1% |
| $150,000 to $199,999 | 1,543 | 16.4% |
| $200,000+ | 1,834 | 19.5% |
Family Income by Famaliy Size in French Valley
7+ person families (513 | 5.4%) account for the highest median family income in French Valley with $175,664 per family, while 2-person families (2,673 | 28.4%) have the highest median income of $50,319 per family member.
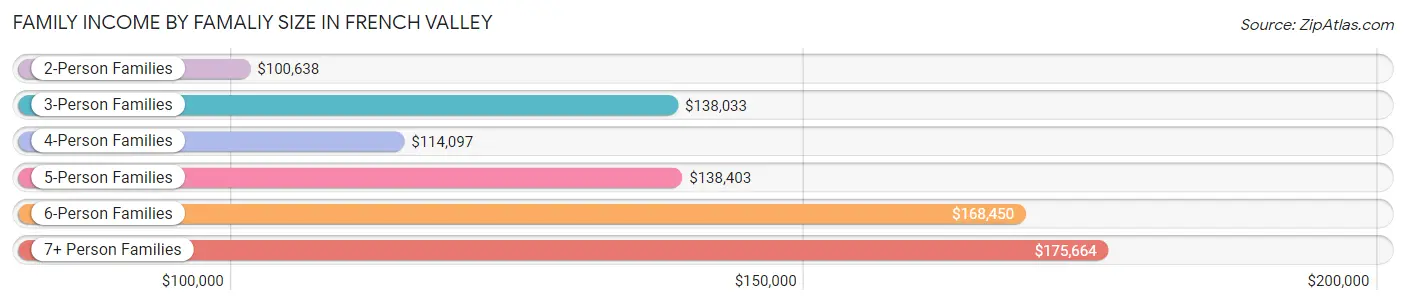
| Income Bracket | # Families | Median Income |
| 2-Person Families | 2,673 (28.4%) | $100,638 |
| 3-Person Families | 1,820 (19.4%) | $138,033 |
| 4-Person Families | 2,343 (24.9%) | $114,097 |
| 5-Person Families | 1,439 (15.3%) | $138,403 |
| 6-Person Families | 619 (6.6%) | $168,450 |
| 7+ Person Families | 513 (5.4%) | $175,664 |
| Total | 9,407 (100.0%) | $125,746 |
Family Income by Number of Earners in French Valley
The median family income in French Valley is $125,746, with families comprising 3+ earners (1,646) having the highest median family income of $158,878, while families with no earners (1,081) have the lowest median family income of $89,223, accounting for 17.5% and 11.5% of families, respectively.
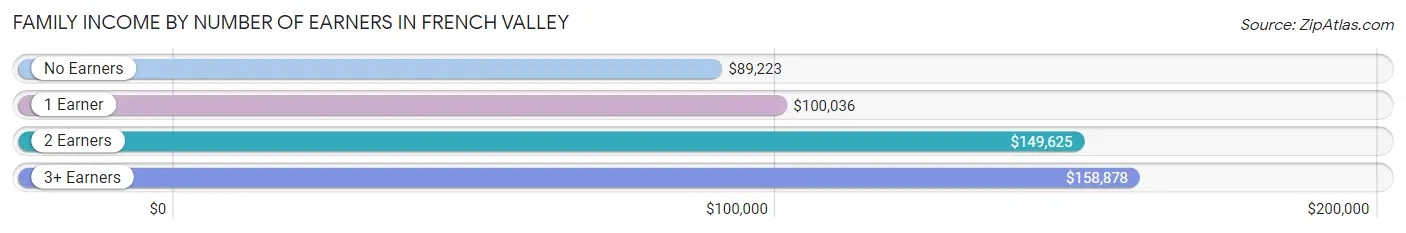
| Number of Earners | # Families | Median Income |
| No Earners | 1,081 (11.5%) | $89,223 |
| 1 Earner | 3,092 (32.9%) | $100,036 |
| 2 Earners | 3,588 (38.1%) | $149,625 |
| 3+ Earners | 1,646 (17.5%) | $158,878 |
| Total | 9,407 (100.0%) | $125,746 |
Household Income in French Valley
Household Income Brackets in French Valley
With 3,230 households falling in the category, the $100,000 to $149,999 income range is the most frequent in French Valley, accounting for 30.2% of all households. In contrast, only 53 households (0.5%) fall into the $10,000 to $14,999 income bracket, making it the least populous group.
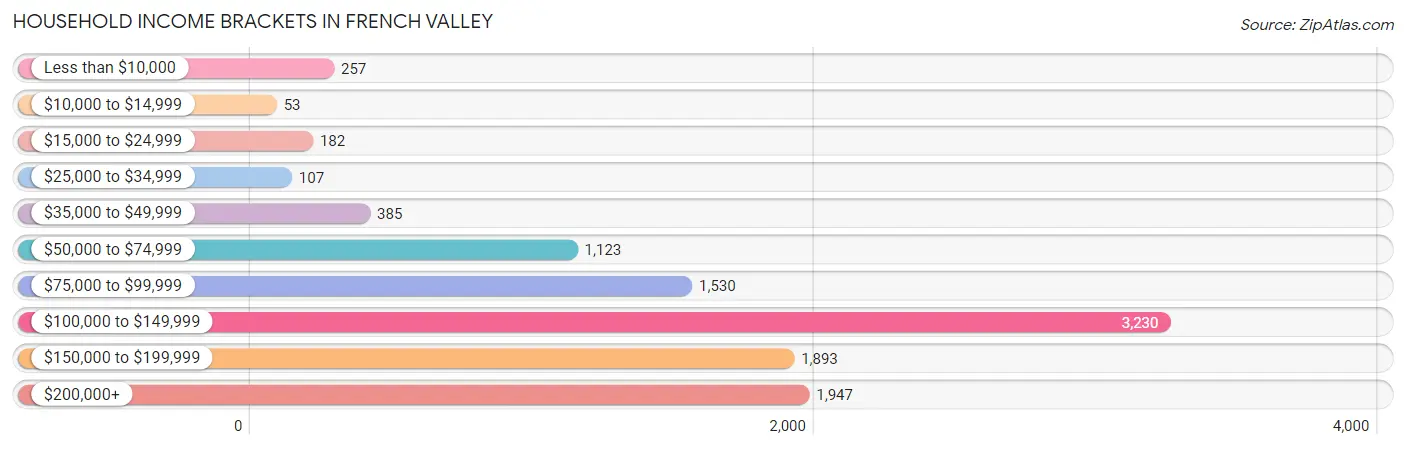
| Income Bracket | # Households | % Households |
| Less than $10,000 | 257 | 2.4% |
| $10,000 to $14,999 | 53 | 0.5% |
| $15,000 to $24,999 | 182 | 1.7% |
| $25,000 to $34,999 | 107 | 1.0% |
| $35,000 to $49,999 | 385 | 3.6% |
| $50,000 to $74,999 | 1,123 | 10.5% |
| $75,000 to $99,999 | 1,530 | 14.3% |
| $100,000 to $149,999 | 3,230 | 30.2% |
| $150,000 to $199,999 | 1,893 | 17.7% |
| $200,000+ | 1,947 | 18.2% |
Household Income by Householder Age in French Valley
The median household income in French Valley is $124,115, with the highest median household income of $144,299 found in the 45 to 64 years age bracket for the primary householder. A total of 4,311 households (40.3%) fall into this category. Meanwhile, the 15 to 24 years age bracket for the primary householder has the lowest median household income of $0, with 168 households (1.6%) in this group.
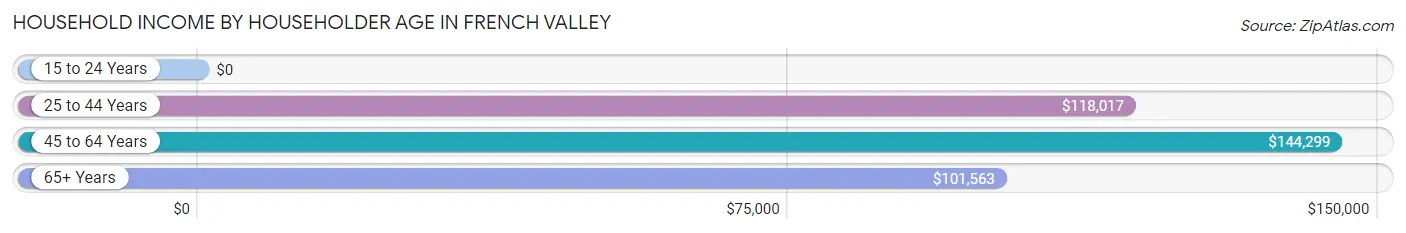
| Income Bracket | # Households | Median Income |
| 15 to 24 Years | 168 (1.6%) | $0 |
| 25 to 44 Years | 4,519 (42.2%) | $118,017 |
| 45 to 64 Years | 4,311 (40.3%) | $144,299 |
| 65+ Years | 1,699 (15.9%) | $101,563 |
| Total | 10,697 (100.0%) | $124,115 |
Poverty in French Valley
Income Below Poverty by Sex and Age in French Valley
With 3.5% poverty level for males and 8.0% for females among the residents of French Valley, 6 to 11 year old males and 5 year old females are the most vulnerable to poverty, with 286 males (11.4%) and 215 females (42.0%) in their respective age groups living below the poverty level.
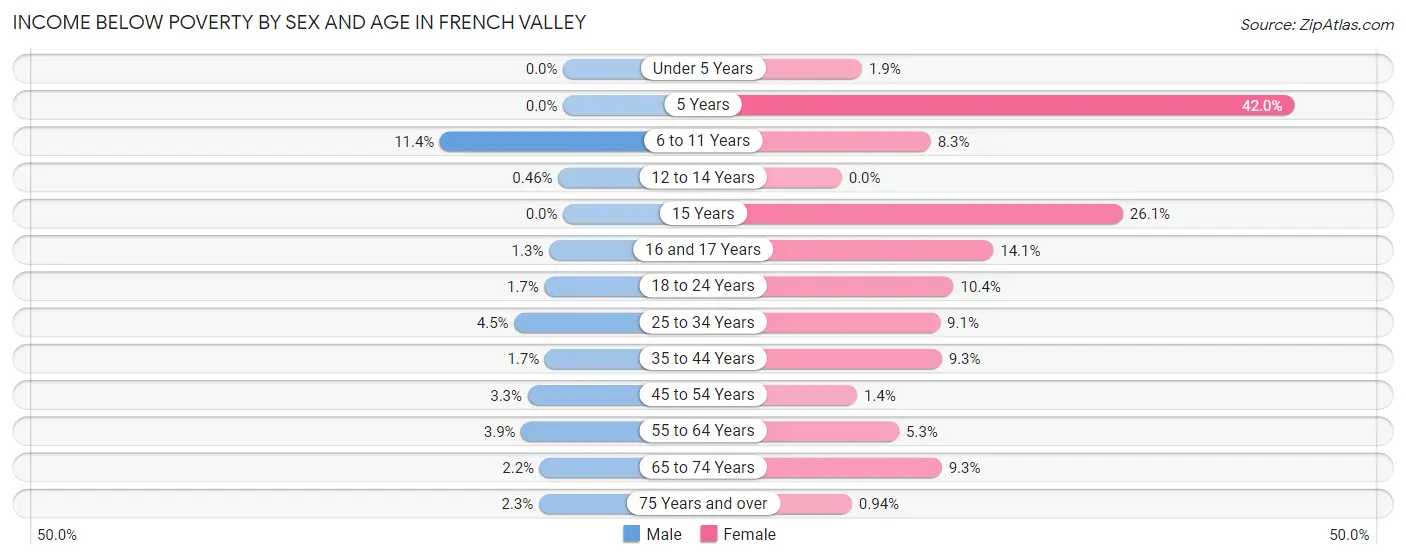
| Age Bracket | Male | Female |
| Under 5 Years | 0 (0.0%) | 25 (1.9%) |
| 5 Years | 0 (0.0%) | 215 (42.0%) |
| 6 to 11 Years | 286 (11.4%) | 245 (8.3%) |
| 12 to 14 Years | 5 (0.5%) | 0 (0.0%) |
| 15 Years | 0 (0.0%) | 60 (26.1%) |
| 16 and 17 Years | 9 (1.3%) | 135 (14.1%) |
| 18 to 24 Years | 19 (1.7%) | 179 (10.4%) |
| 25 to 34 Years | 104 (4.5%) | 202 (9.1%) |
| 35 to 44 Years | 53 (1.7%) | 311 (9.3%) |
| 45 to 54 Years | 96 (3.3%) | 35 (1.4%) |
| 55 to 64 Years | 74 (3.9%) | 84 (5.3%) |
| 65 to 74 Years | 20 (2.2%) | 170 (9.3%) |
| 75 Years and over | 12 (2.2%) | 8 (0.9%) |
| Total | 678 (3.5%) | 1,669 (8.0%) |
Income Above Poverty by Sex and Age in French Valley
According to the poverty statistics in French Valley, males aged under 5 years and females aged 12 to 14 years are the age groups that are most secure financially, with 100.0% of males and 100.0% of females in these age groups living above the poverty line.
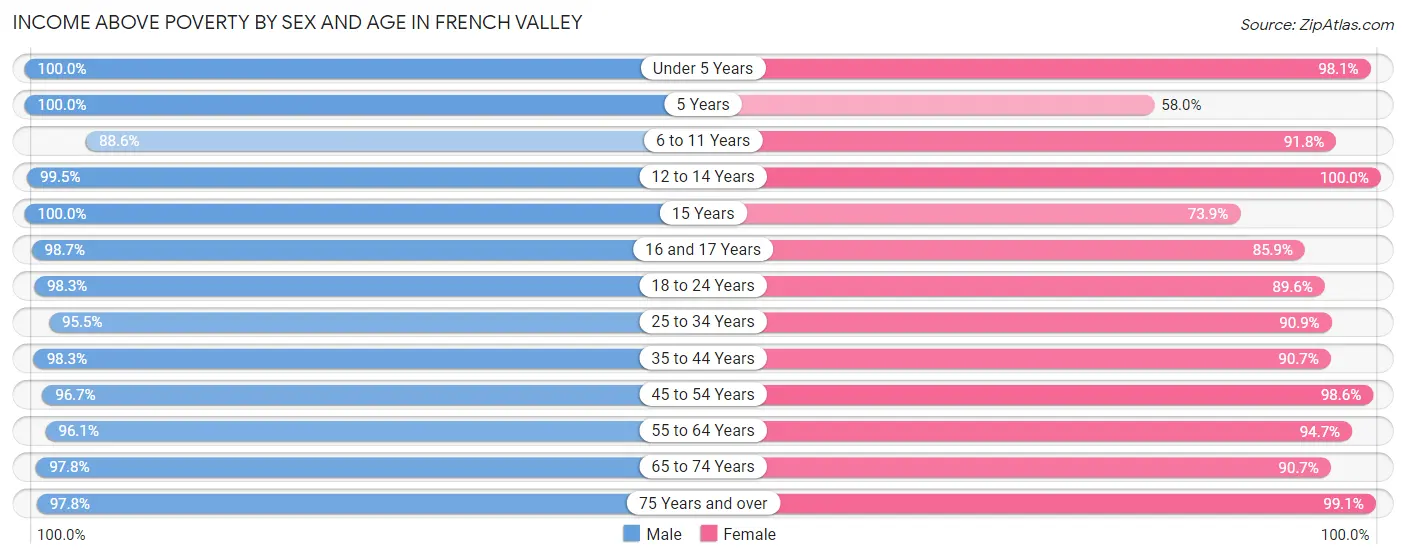
| Age Bracket | Male | Female |
| Under 5 Years | 1,615 (100.0%) | 1,307 (98.1%) |
| 5 Years | 260 (100.0%) | 297 (58.0%) |
| 6 to 11 Years | 2,217 (88.6%) | 2,725 (91.7%) |
| 12 to 14 Years | 1,076 (99.5%) | 840 (100.0%) |
| 15 Years | 378 (100.0%) | 170 (73.9%) |
| 16 and 17 Years | 677 (98.7%) | 825 (85.9%) |
| 18 to 24 Years | 1,075 (98.3%) | 1,545 (89.6%) |
| 25 to 34 Years | 2,188 (95.5%) | 2,011 (90.9%) |
| 35 to 44 Years | 3,062 (98.3%) | 3,042 (90.7%) |
| 45 to 54 Years | 2,823 (96.7%) | 2,456 (98.6%) |
| 55 to 64 Years | 1,826 (96.1%) | 1,495 (94.7%) |
| 65 to 74 Years | 902 (97.8%) | 1,664 (90.7%) |
| 75 Years and over | 522 (97.8%) | 839 (99.1%) |
| Total | 18,621 (96.5%) | 19,216 (92.0%) |
Income Below Poverty Among Married-Couple Families in French Valley
The poverty statistics for married-couple families in French Valley show that 0.7% or 48 of the total 7,240 families live below the poverty line. Families with 1 or 2 children have the highest poverty rate of 1.1%, comprising of 35 families. On the other hand, families with 3 or 4 children have the lowest poverty rate of 0.0%, which includes 0 families.
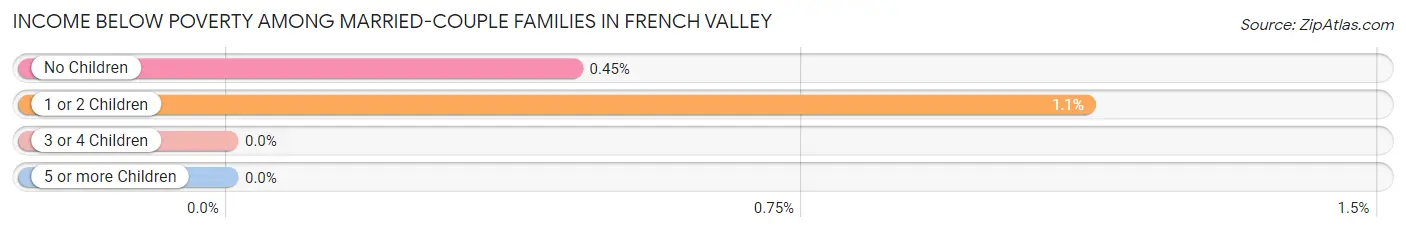
| Children | Above Poverty | Below Poverty |
| No Children | 2,858 (99.6%) | 13 (0.4%) |
| 1 or 2 Children | 3,088 (98.9%) | 35 (1.1%) |
| 3 or 4 Children | 1,144 (100.0%) | 0 (0.0%) |
| 5 or more Children | 102 (100.0%) | 0 (0.0%) |
| Total | 7,192 (99.3%) | 48 (0.7%) |
Income Below Poverty Among Single-Parent Households in French Valley
According to the poverty data in French Valley, 0.7% or 6 single-father households and 16.8% or 227 single-mother households are living below the poverty line. Among single-father households, those with 3 or 4 children have the highest poverty rate, with 6 households (2.9%) experiencing poverty. Likewise, among single-mother households, those with 3 or 4 children have the highest poverty rate, with 177 households (48.8%) falling below the poverty line.
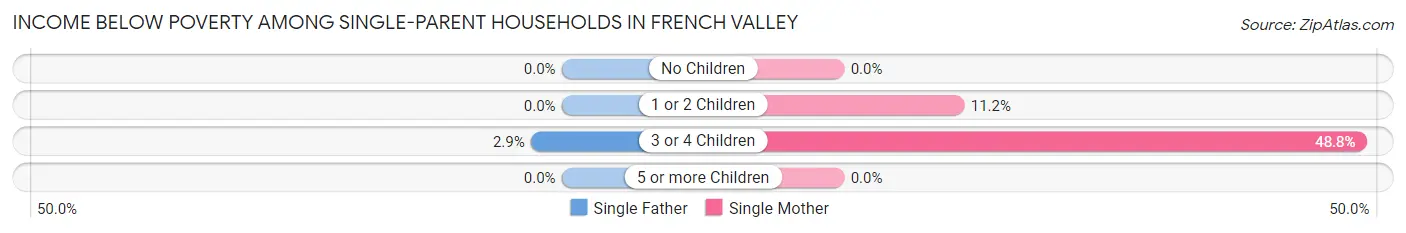
| Children | Single Father | Single Mother |
| No Children | 0 (0.0%) | 0 (0.0%) |
| 1 or 2 Children | 0 (0.0%) | 50 (11.2%) |
| 3 or 4 Children | 6 (2.9%) | 177 (48.8%) |
| 5 or more Children | 0 (0.0%) | 0 (0.0%) |
| Total | 6 (0.7%) | 227 (16.8%) |
Income Below Poverty Among Married-Couple vs Single-Parent Households in French Valley
The poverty data for French Valley shows that 48 of the married-couple family households (0.7%) and 233 of the single-parent households (10.7%) are living below the poverty level. Within the married-couple family households, those with 1 or 2 children have the highest poverty rate, with 35 households (1.1%) falling below the poverty line. Among the single-parent households, those with 3 or 4 children have the highest poverty rate, with 183 household (32.1%) living below poverty.
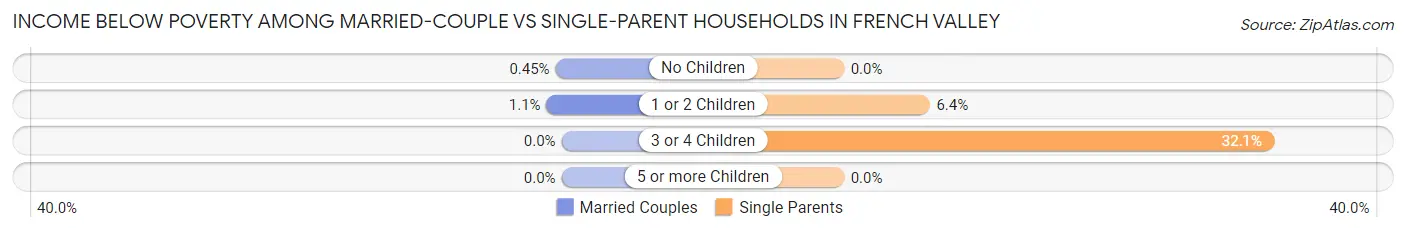
| Children | Married-Couple Families | Single-Parent Households |
| No Children | 13 (0.4%) | 0 (0.0%) |
| 1 or 2 Children | 35 (1.1%) | 50 (6.4%) |
| 3 or 4 Children | 0 (0.0%) | 183 (32.1%) |
| 5 or more Children | 0 (0.0%) | 0 (0.0%) |
| Total | 48 (0.7%) | 233 (10.7%) |
Race in French Valley
The most populous races in French Valley are White / Caucasian (21,341 | 51.7%), Hispanic or Latino (12,151 | 29.5%), and Two or more Races (6,482 | 15.7%).
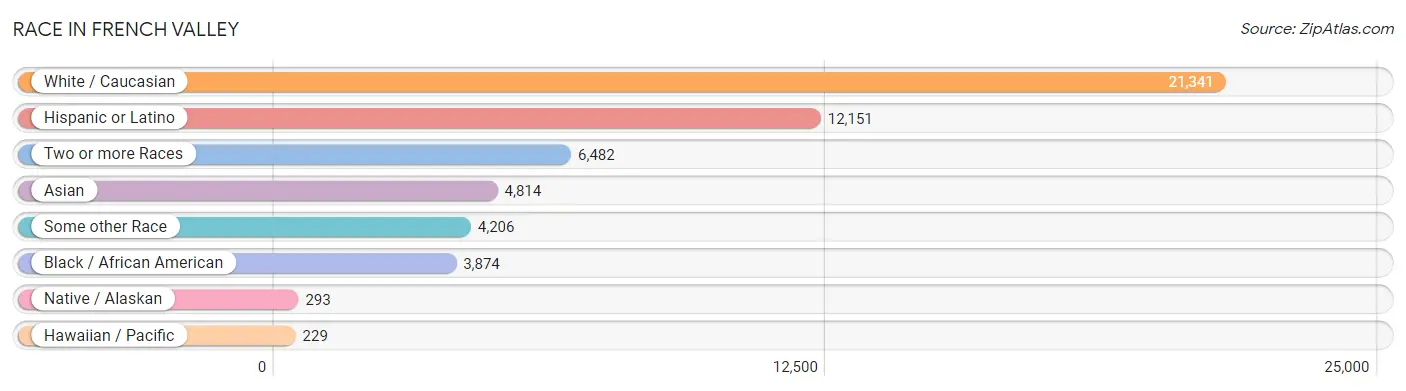
| Race | # Population | % Population |
| Asian | 4,814 | 11.7% |
| Black / African American | 3,874 | 9.4% |
| Hawaiian / Pacific | 229 | 0.6% |
| Hispanic or Latino | 12,151 | 29.5% |
| Native / Alaskan | 293 | 0.7% |
| White / Caucasian | 21,341 | 51.7% |
| Two or more Races | 6,482 | 15.7% |
| Some other Race | 4,206 | 10.2% |
| Total | 41,239 | 100.0% |
Ancestry in French Valley
The most populous ancestries reported in French Valley are Mexican (9,576 | 23.2%), Korean (4,405 | 10.7%), German (3,343 | 8.1%), Irish (2,689 | 6.5%), and English (2,423 | 5.9%), together accounting for 54.4% of all French Valley residents.
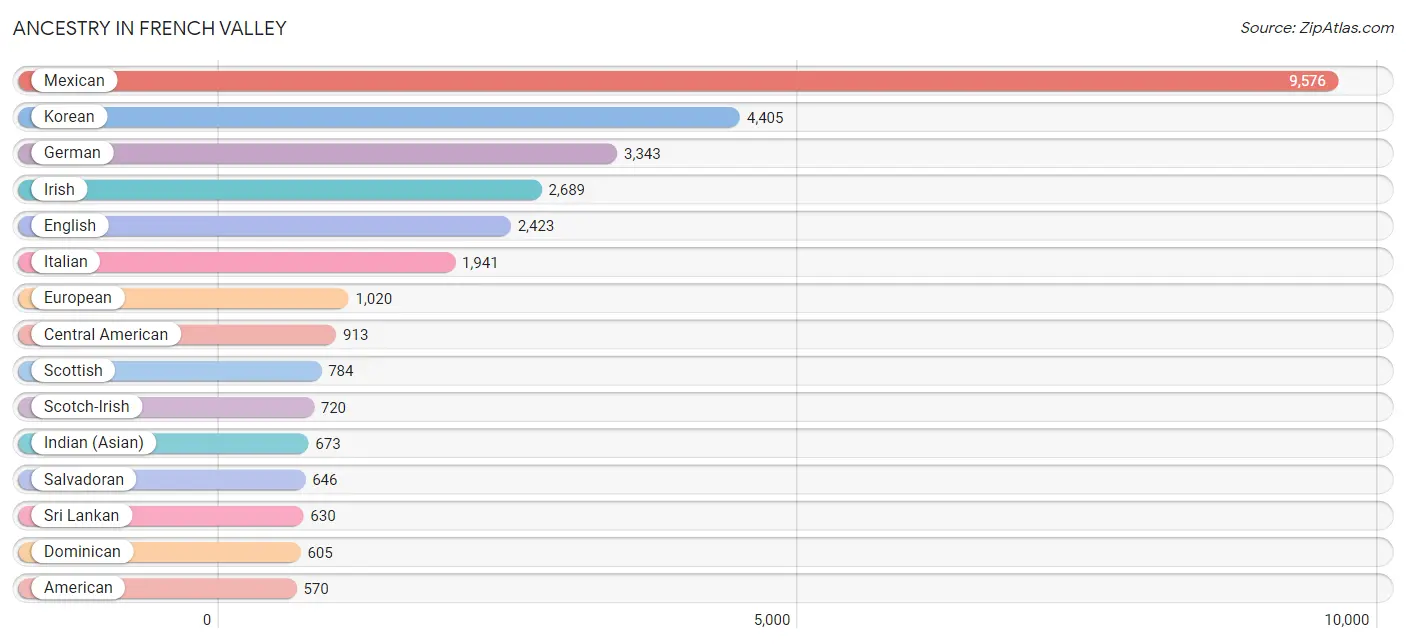
| Ancestry | # Population | % Population |
| Afghan | 23 | 0.1% |
| African | 204 | 0.5% |
| American | 570 | 1.4% |
| Apache | 47 | 0.1% |
| Arab | 188 | 0.5% |
| Argentinean | 10 | 0.0% |
| Bangladeshi | 21 | 0.1% |
| Belizean | 8 | 0.0% |
| Bhutanese | 233 | 0.6% |
| Blackfeet | 53 | 0.1% |
| Bolivian | 27 | 0.1% |
| British | 39 | 0.1% |
| Burmese | 133 | 0.3% |
| Canadian | 308 | 0.7% |
| Central American | 913 | 2.2% |
| Central American Indian | 168 | 0.4% |
| Cherokee | 84 | 0.2% |
| Cheyenne | 13 | 0.0% |
| Chinese | 48 | 0.1% |
| Costa Rican | 20 | 0.1% |
| Cuban | 57 | 0.1% |
| Czech | 115 | 0.3% |
| Danish | 294 | 0.7% |
| Dominican | 605 | 1.5% |
| Dutch | 452 | 1.1% |
| Eastern European | 108 | 0.3% |
| Egyptian | 7 | 0.0% |
| English | 2,423 | 5.9% |
| European | 1,020 | 2.5% |
| Filipino | 327 | 0.8% |
| Finnish | 12 | 0.0% |
| French | 526 | 1.3% |
| French American Indian | 37 | 0.1% |
| French Canadian | 246 | 0.6% |
| German | 3,343 | 8.1% |
| Greek | 197 | 0.5% |
| Guamanian / Chamorro | 266 | 0.6% |
| Guatemalan | 157 | 0.4% |
| Hungarian | 121 | 0.3% |
| Icelander | 48 | 0.1% |
| Indian (Asian) | 673 | 1.6% |
| Iranian | 45 | 0.1% |
| Irish | 2,689 | 6.5% |
| Italian | 1,941 | 4.7% |
| Jamaican | 70 | 0.2% |
| Japanese | 128 | 0.3% |
| Korean | 4,405 | 10.7% |
| Lebanese | 134 | 0.3% |
| Lithuanian | 32 | 0.1% |
| Malaysian | 205 | 0.5% |
| Mexican | 9,576 | 23.2% |
| Mexican American Indian | 4 | 0.0% |
| Native Hawaiian | 78 | 0.2% |
| New Zealander | 14 | 0.0% |
| Nicaraguan | 35 | 0.1% |
| Nigerian | 281 | 0.7% |
| Northern European | 57 | 0.1% |
| Norwegian | 432 | 1.1% |
| Osage | 36 | 0.1% |
| Pakistani | 21 | 0.1% |
| Panamanian | 55 | 0.1% |
| Peruvian | 64 | 0.2% |
| Polish | 383 | 0.9% |
| Portuguese | 346 | 0.8% |
| Puerto Rican | 426 | 1.0% |
| Romanian | 115 | 0.3% |
| Russian | 71 | 0.2% |
| Salvadoran | 646 | 1.6% |
| Samoan | 197 | 0.5% |
| Scandinavian | 140 | 0.3% |
| Scotch-Irish | 720 | 1.8% |
| Scottish | 784 | 1.9% |
| Serbian | 43 | 0.1% |
| Slovene | 9 | 0.0% |
| South American | 165 | 0.4% |
| South American Indian | 61 | 0.2% |
| Spaniard | 111 | 0.3% |
| Spanish | 8 | 0.0% |
| Sri Lankan | 630 | 1.5% |
| Subsaharan African | 558 | 1.3% |
| Swedish | 67 | 0.2% |
| Swiss | 19 | 0.1% |
| Syrian | 47 | 0.1% |
| Thai | 172 | 0.4% |
| Trinidadian and Tobagonian | 58 | 0.1% |
| Turkish | 36 | 0.1% |
| Ukrainian | 14 | 0.0% |
| Venezuelan | 64 | 0.2% |
| Welsh | 76 | 0.2% |
| West Indian | 72 | 0.2% |
| Yaqui | 20 | 0.1% | View All 91 Rows |
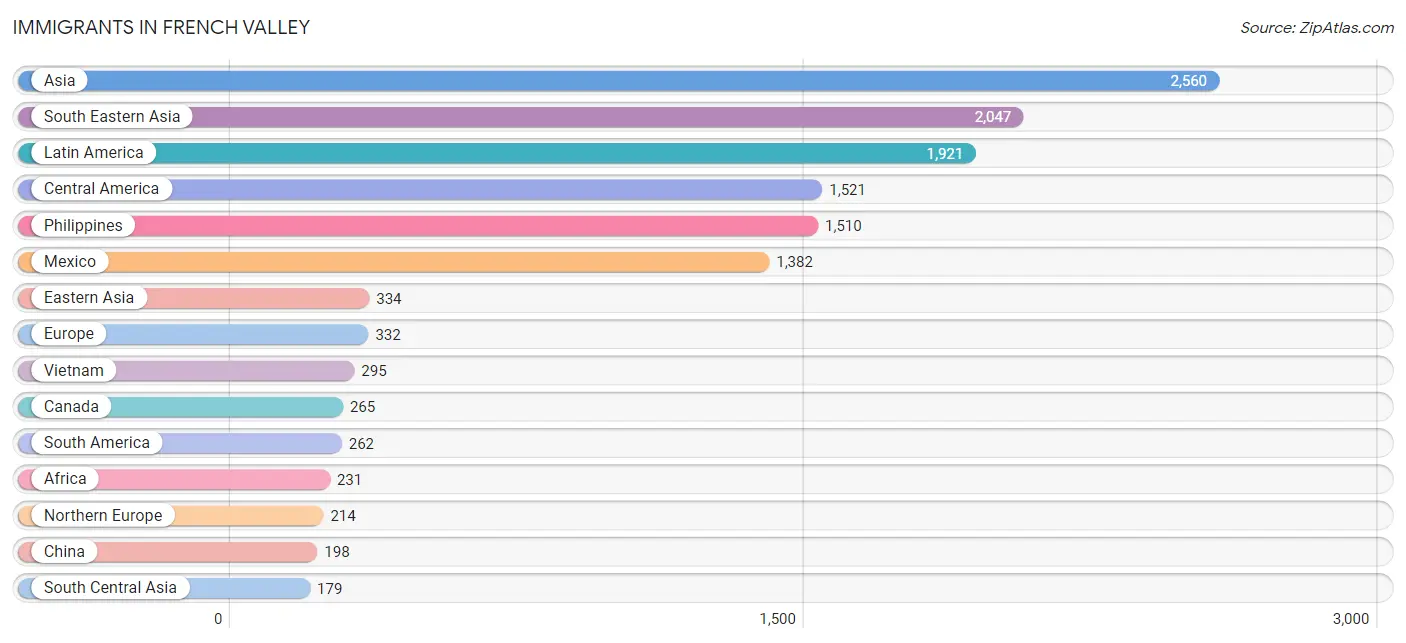
Immigrants in French Valley
The most numerous immigrant groups reported in French Valley came from Asia (2,560 | 6.2%), South Eastern Asia (2,047 | 5.0%), Latin America (1,921 | 4.7%), Central America (1,521 | 3.7%), and Philippines (1,510 | 3.7%), together accounting for 23.2% of all French Valley residents.
| Immigration Origin | # Population | % Population |
| Afghanistan | 32 | 0.1% |
| Africa | 231 | 0.6% |
| Argentina | 10 | 0.0% |
| Asia | 2,560 | 6.2% |
| Australia | 18 | 0.0% |
| Bolivia | 44 | 0.1% |
| Cambodia | 25 | 0.1% |
| Canada | 265 | 0.6% |
| Caribbean | 138 | 0.3% |
| Central America | 1,521 | 3.7% |
| China | 198 | 0.5% |
| Colombia | 57 | 0.1% |
| Dominican Republic | 89 | 0.2% |
| Eastern Africa | 18 | 0.0% |
| Eastern Asia | 334 | 0.8% |
| Eastern Europe | 14 | 0.0% |
| Ecuador | 50 | 0.1% |
| El Salvador | 67 | 0.2% |
| England | 91 | 0.2% |
| Europe | 332 | 0.8% |
| Germany | 38 | 0.1% |
| Guatemala | 63 | 0.2% |
| Guyana | 16 | 0.0% |
| Hong Kong | 32 | 0.1% |
| India | 63 | 0.2% |
| Iran | 84 | 0.2% |
| Ireland | 12 | 0.0% |
| Japan | 41 | 0.1% |
| Korea | 95 | 0.2% |
| Laos | 151 | 0.4% |
| Latin America | 1,921 | 4.7% |
| Malaysia | 12 | 0.0% |
| Mexico | 1,382 | 3.4% |
| Middle Africa | 55 | 0.1% |
| Netherlands | 43 | 0.1% |
| Nigeria | 136 | 0.3% |
| Northern Europe | 214 | 0.5% |
| Oceania | 52 | 0.1% |
| Panama | 9 | 0.0% |
| Peru | 64 | 0.2% |
| Philippines | 1,510 | 3.7% |
| Poland | 14 | 0.0% |
| Scotland | 67 | 0.2% |
| South Africa | 22 | 0.1% |
| South America | 262 | 0.6% |
| South Central Asia | 179 | 0.4% |
| South Eastern Asia | 2,047 | 5.0% |
| Switzerland | 23 | 0.1% |
| Taiwan | 27 | 0.1% |
| Thailand | 54 | 0.1% |
| Trinidad and Tobago | 49 | 0.1% |
| Venezuela | 21 | 0.1% |
| Vietnam | 295 | 0.7% |
| Western Africa | 136 | 0.3% |
| Western Europe | 104 | 0.3% |
| Zaire | 55 | 0.1% | View All 56 Rows |
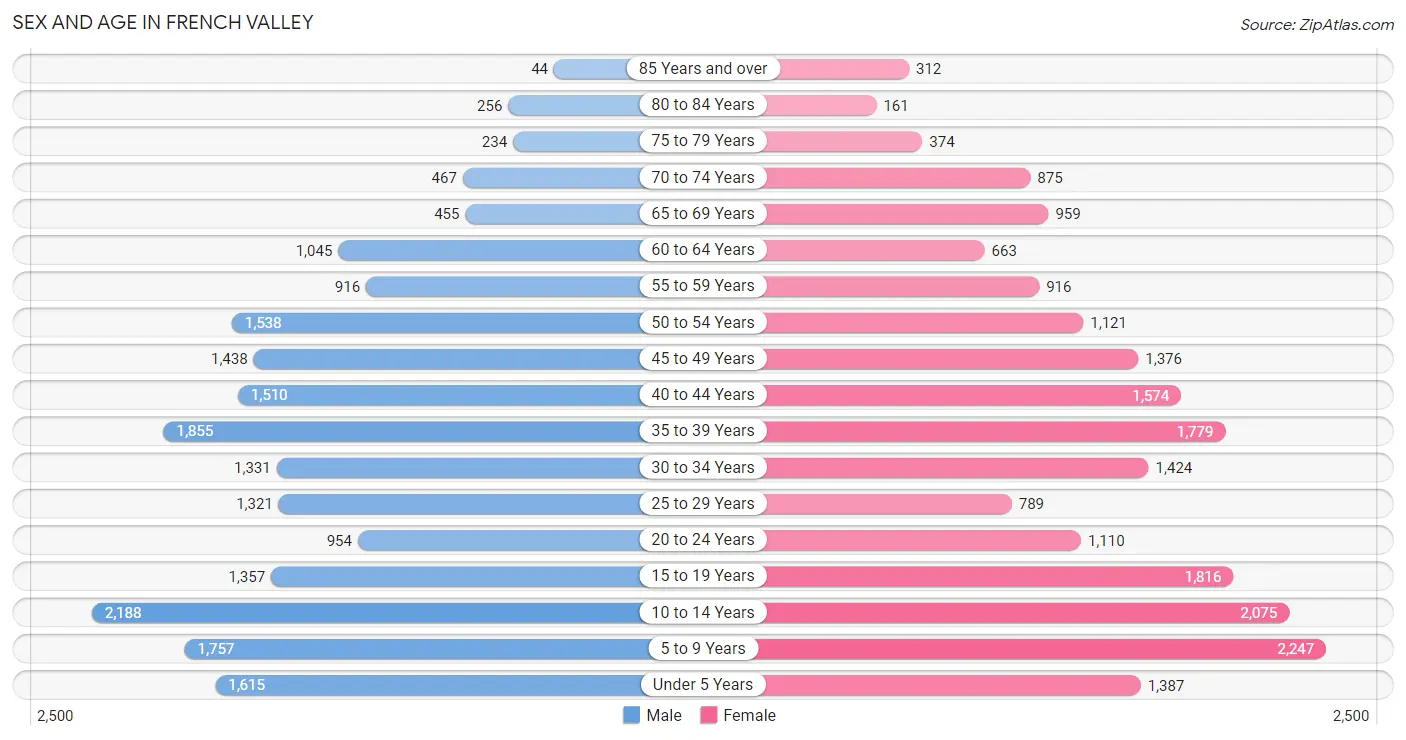
Sex and Age in French Valley
Sex and Age in French Valley
The most populous age groups in French Valley are 10 to 14 Years (2,188 | 10.8%) for men and 5 to 9 Years (2,247 | 10.7%) for women.
| Age Bracket | Male | Female |
| Under 5 Years | 1,615 (8.0%) | 1,387 (6.6%) |
| 5 to 9 Years | 1,757 (8.7%) | 2,247 (10.7%) |
| 10 to 14 Years | 2,188 (10.8%) | 2,075 (9.9%) |
| 15 to 19 Years | 1,357 (6.7%) | 1,816 (8.7%) |
| 20 to 24 Years | 954 (4.7%) | 1,110 (5.3%) |
| 25 to 29 Years | 1,321 (6.5%) | 789 (3.8%) |
| 30 to 34 Years | 1,331 (6.6%) | 1,424 (6.8%) |
| 35 to 39 Years | 1,855 (9.1%) | 1,779 (8.5%) |
| 40 to 44 Years | 1,510 (7.4%) | 1,574 (7.5%) |
| 45 to 49 Years | 1,438 (7.1%) | 1,376 (6.6%) |
| 50 to 54 Years | 1,538 (7.6%) | 1,121 (5.3%) |
| 55 to 59 Years | 916 (4.5%) | 916 (4.4%) |
| 60 to 64 Years | 1,045 (5.1%) | 663 (3.2%) |
| 65 to 69 Years | 455 (2.2%) | 959 (4.6%) |
| 70 to 74 Years | 467 (2.3%) | 875 (4.2%) |
| 75 to 79 Years | 234 (1.1%) | 374 (1.8%) |
| 80 to 84 Years | 256 (1.3%) | 161 (0.8%) |
| 85 Years and over | 44 (0.2%) | 312 (1.5%) |
| Total | 20,281 (100.0%) | 20,958 (100.0%) |
Families and Households in French Valley
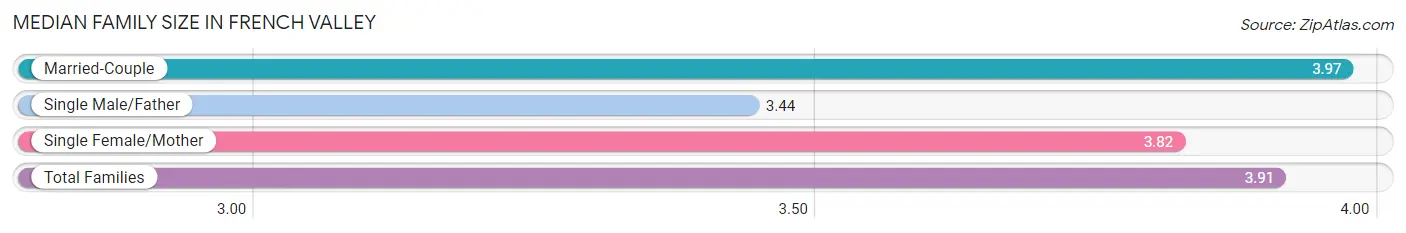
Median Family Size in French Valley
The median family size in French Valley is 3.91 persons per family, with married-couple families (7,240 | 77.0%) accounting for the largest median family size of 3.97 persons per family. On the other hand, single male/father families (818 | 8.7%) represent the smallest median family size with 3.44 persons per family.
| Family Type | # Families | Family Size |
| Married-Couple | 7,240 (77.0%) | 3.97 |
| Single Male/Father | 818 (8.7%) | 3.44 |
| Single Female/Mother | 1,349 (14.3%) | 3.82 |
| Total Families | 9,407 (100.0%) | 3.91 |
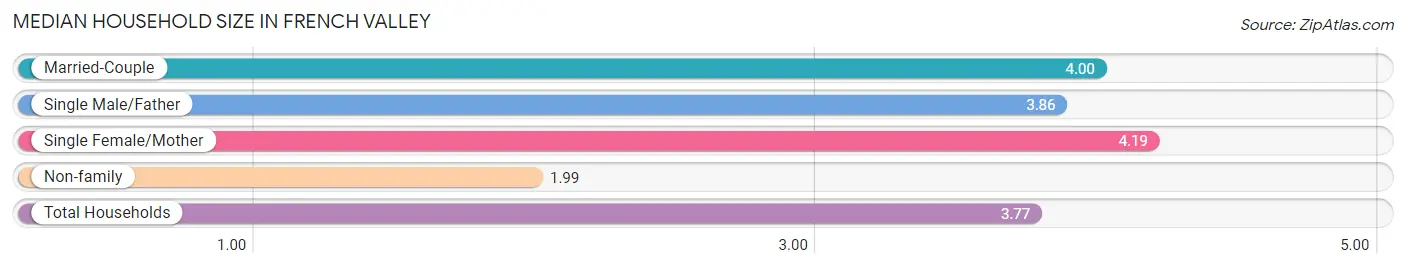
Median Household Size in French Valley
The median household size in French Valley is 3.77 persons per household, with single female/mother households (1,349 | 12.6%) accounting for the largest median household size of 4.19 persons per household. non-family households (1,290 | 12.1%) represent the smallest median household size with 1.99 persons per household.
| Household Type | # Households | Household Size |
| Married-Couple | 7,240 (67.7%) | 4.00 |
| Single Male/Father | 818 (7.6%) | 3.86 |
| Single Female/Mother | 1,349 (12.6%) | 4.19 |
| Non-family | 1,290 (12.1%) | 1.99 |
| Total Households | 10,697 (100.0%) | 3.77 |
Household Size by Marriage Status in French Valley
Out of a total of 10,697 households in French Valley, 9,407 (87.9%) are family households, while 1,290 (12.1%) are nonfamily households. The most numerous type of family households are 2-person households, comprising 2,444, and the most common type of nonfamily households are 1-person households, comprising 579.
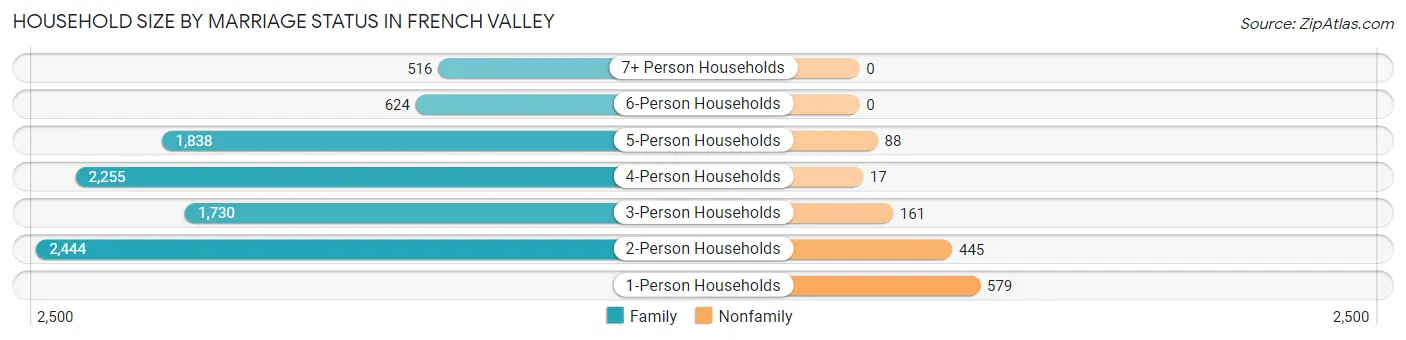
| Household Size | Family Households | Nonfamily Households |
| 1-Person Households | - | 579 (5.4%) |
| 2-Person Households | 2,444 (22.9%) | 445 (4.2%) |
| 3-Person Households | 1,730 (16.2%) | 161 (1.5%) |
| 4-Person Households | 2,255 (21.1%) | 17 (0.2%) |
| 5-Person Households | 1,838 (17.2%) | 88 (0.8%) |
| 6-Person Households | 624 (5.8%) | 0 (0.0%) |
| 7+ Person Households | 516 (4.8%) | 0 (0.0%) |
| Total | 9,407 (87.9%) | 1,290 (12.1%) |
Female Fertility in French Valley
Fertility by Age in French Valley
Average fertility rate in French Valley is 41.0 births per 1,000 women. Women in the age bracket of 20 to 34 years have the highest fertility rate with 87.0 births per 1,000 women. Women in the age bracket of 20 to 34 years acount for 69.0% of all women with births.
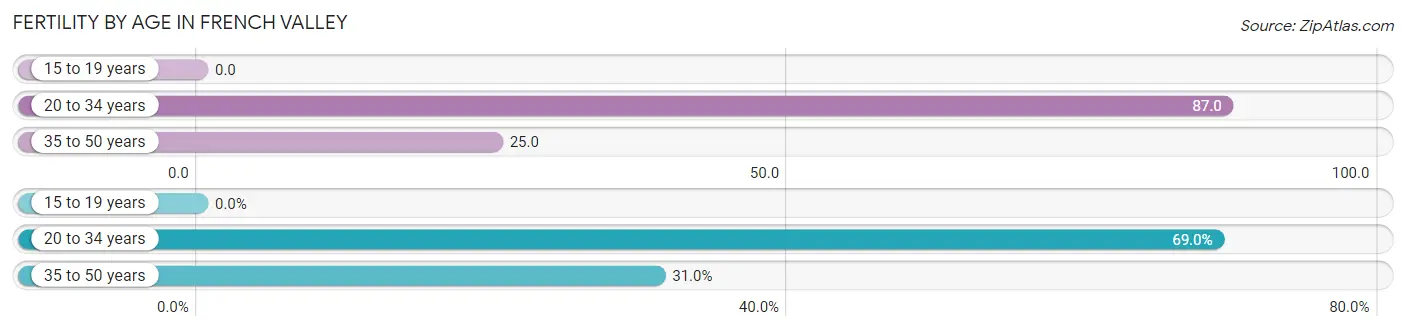
| Age Bracket | Women with Births | Births / 1,000 Women |
| 15 to 19 years | 0 (0.0%) | 0.0 |
| 20 to 34 years | 289 (69.0%) | 87.0 |
| 35 to 50 years | 130 (31.0%) | 25.0 |
| Total | 419 (100.0%) | 41.0 |
Fertility by Age by Marriage Status in French Valley
64.2% of women with births (419) in French Valley are married. The highest percentage of unmarried women with births falls into 20 to 34 years age bracket with 49.8% of them unmarried at the time of birth, while the lowest percentage of unmarried women with births belong to 35 to 50 years age bracket with 4.6% of them unmarried.
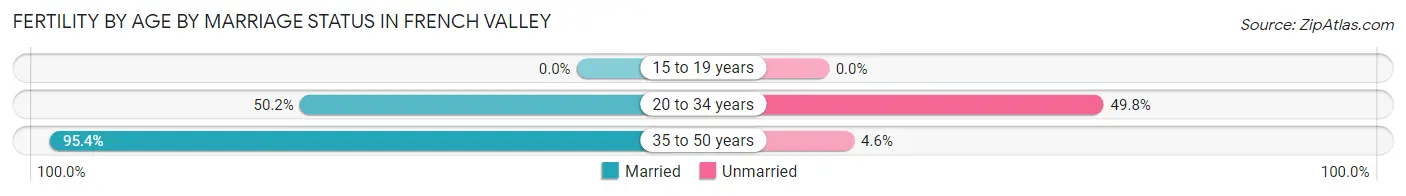
| Age Bracket | Married | Unmarried |
| 15 to 19 years | 0 (0.0%) | 0 (0.0%) |
| 20 to 34 years | 145 (50.2%) | 144 (49.8%) |
| 35 to 50 years | 124 (95.4%) | 6 (4.6%) |
| Total | 269 (64.2%) | 150 (35.8%) |
Fertility by Education in French Valley
Average fertility rate in French Valley is 41.0 births per 1,000 women. Women with the education attainment of graduate degree have the highest fertility rate of 57.0 births per 1,000 women, while women with the education attainment of less than high school have the lowest fertility at 10.0 births per 1,000 women. Women with the education attainment of college or associate's degree represent 45.1% of all women with births.
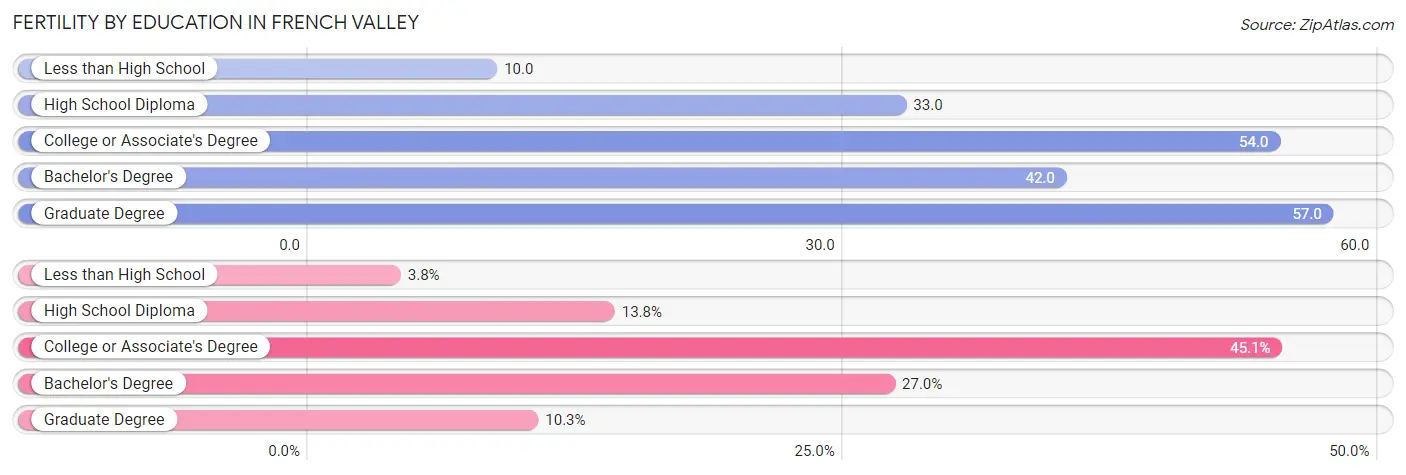
| Educational Attainment | Women with Births | Births / 1,000 Women |
| Less than High School | 16 (3.8%) | 10.0 |
| High School Diploma | 58 (13.8%) | 33.0 |
| College or Associate's Degree | 189 (45.1%) | 54.0 |
| Bachelor's Degree | 113 (27.0%) | 42.0 |
| Graduate Degree | 43 (10.3%) | 57.0 |
| Total | 419 (100.0%) | 41.0 |
Fertility by Education by Marriage Status in French Valley
35.8% of women with births in French Valley are unmarried. Women with the educational attainment of graduate degree are most likely to be married with 100.0% of them married at childbirth, while women with the educational attainment of less than high school are least likely to be married with 100.0% of them unmarried at childbirth.
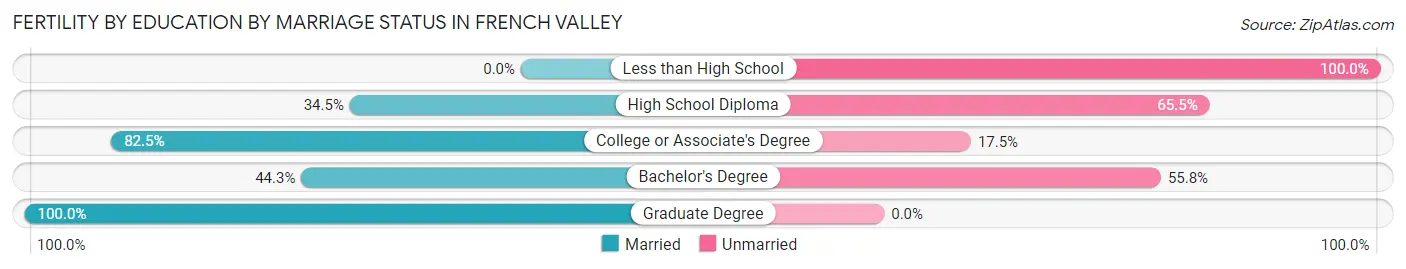
| Educational Attainment | Married | Unmarried |
| Less than High School | 0 (0.0%) | 16 (100.0%) |
| High School Diploma | 20 (34.5%) | 38 (65.5%) |
| College or Associate's Degree | 156 (82.5%) | 33 (17.5%) |
| Bachelor's Degree | 50 (44.3%) | 63 (55.7%) |
| Graduate Degree | 43 (100.0%) | 0 (0.0%) |
| Total | 269 (64.2%) | 150 (35.8%) |
Employment Characteristics in French Valley
Employment by Class of Employer in French Valley
Among the 15,930 employed individuals in French Valley, private company employees (10,150 | 63.7%), local government employees (1,829 | 11.5%), and federal government employees (1,305 | 8.2%) make up the most common classes of employment.
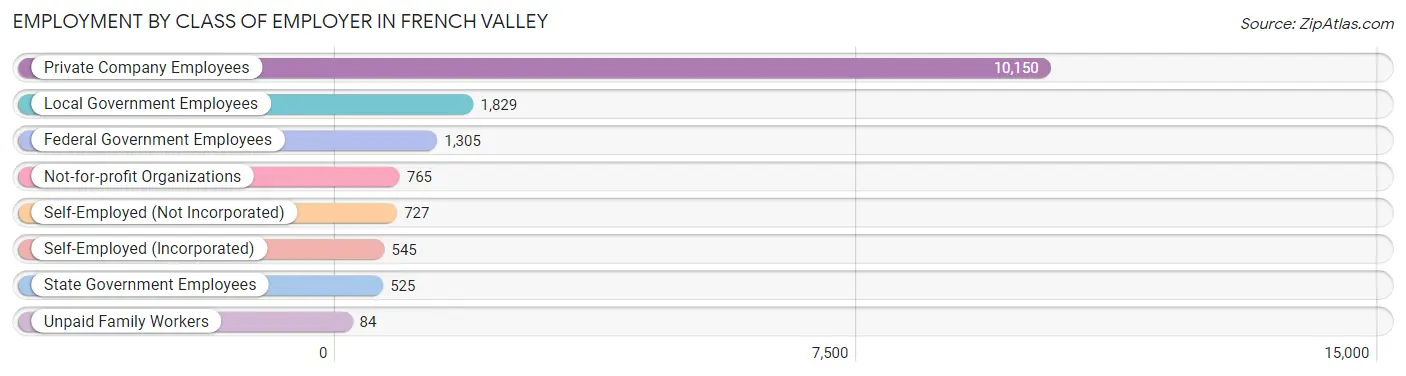
| Employer Class | # Employees | % Employees |
| Private Company Employees | 10,150 | 63.7% |
| Self-Employed (Incorporated) | 545 | 3.4% |
| Self-Employed (Not Incorporated) | 727 | 4.6% |
| Not-for-profit Organizations | 765 | 4.8% |
| Local Government Employees | 1,829 | 11.5% |
| State Government Employees | 525 | 3.3% |
| Federal Government Employees | 1,305 | 8.2% |
| Unpaid Family Workers | 84 | 0.5% |
| Total | 15,930 | 100.0% |
Employment Status by Age in French Valley
According to the labor force statistics for French Valley, out of the total population over 16 years of age (29,350), 62.7% or 18,402 individuals are in the labor force, with 7.7% or 1,417 of them unemployed. The age group with the highest labor force participation rate is 45 to 54 years, with 79.4% or 4,346 individuals in the labor force. Within the labor force, the 20 to 24 years age range has the highest percentage of unemployed individuals, with 23.9% or 323 of them being unemployed.
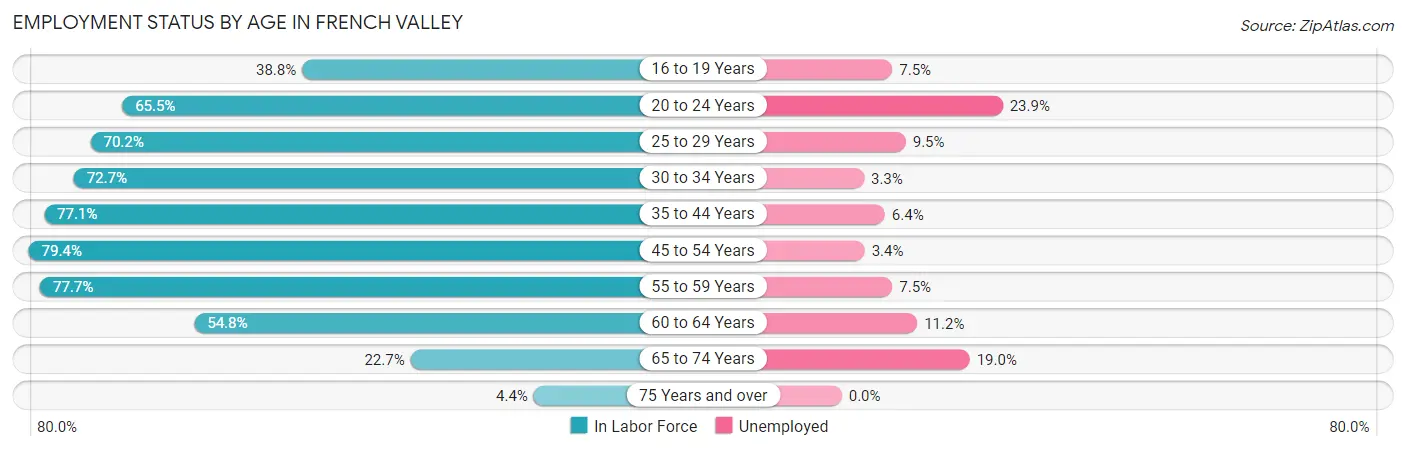
| Age Bracket | In Labor Force | Unemployed |
| 16 to 19 Years | 991 (38.8%) | 74 (7.5%) |
| 20 to 24 Years | 1,352 (65.5%) | 323 (23.9%) |
| 25 to 29 Years | 1,481 (70.2%) | 141 (9.5%) |
| 30 to 34 Years | 2,003 (72.7%) | 66 (3.3%) |
| 35 to 44 Years | 5,180 (77.1%) | 332 (6.4%) |
| 45 to 54 Years | 4,346 (79.4%) | 148 (3.4%) |
| 55 to 59 Years | 1,423 (77.7%) | 107 (7.5%) |
| 60 to 64 Years | 936 (54.8%) | 105 (11.2%) |
| 65 to 74 Years | 626 (22.7%) | 119 (19.0%) |
| 75 Years and over | 61 (4.4%) | 0 (0.0%) |
| Total | 18,402 (62.7%) | 1,417 (7.7%) |
Employment Status by Educational Attainment in French Valley
According to labor force statistics for French Valley, 74.6% of individuals (15,365) out of the total population between 25 and 64 years of age (20,596) are in the labor force, with 5.8% or 891 of them being unemployed. The group with the highest labor force participation rate are those with the educational attainment of bachelor's degree or higher, with 81.3% or 5,803 individuals in the labor force. Within the labor force, individuals with college / associate degree education have the highest percentage of unemployment, with 6.5% or 398 of them being unemployed.
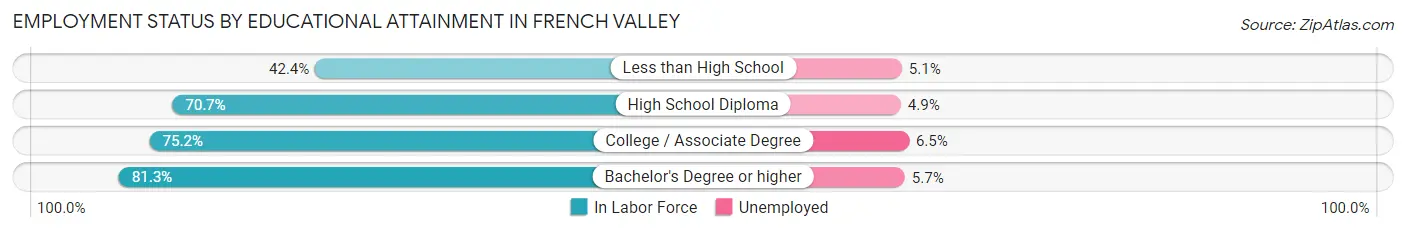
| Educational Attainment | In Labor Force | Unemployed |
| Less than High School | 469 (42.4%) | 56 (5.1%) |
| High School Diploma | 2,981 (70.7%) | 207 (4.9%) |
| College / Associate Degree | 6,118 (75.2%) | 529 (6.5%) |
| Bachelor's Degree or higher | 5,803 (81.3%) | 407 (5.7%) |
| Total | 15,365 (74.6%) | 1,195 (5.8%) |
Employment Occupations by Sex in French Valley
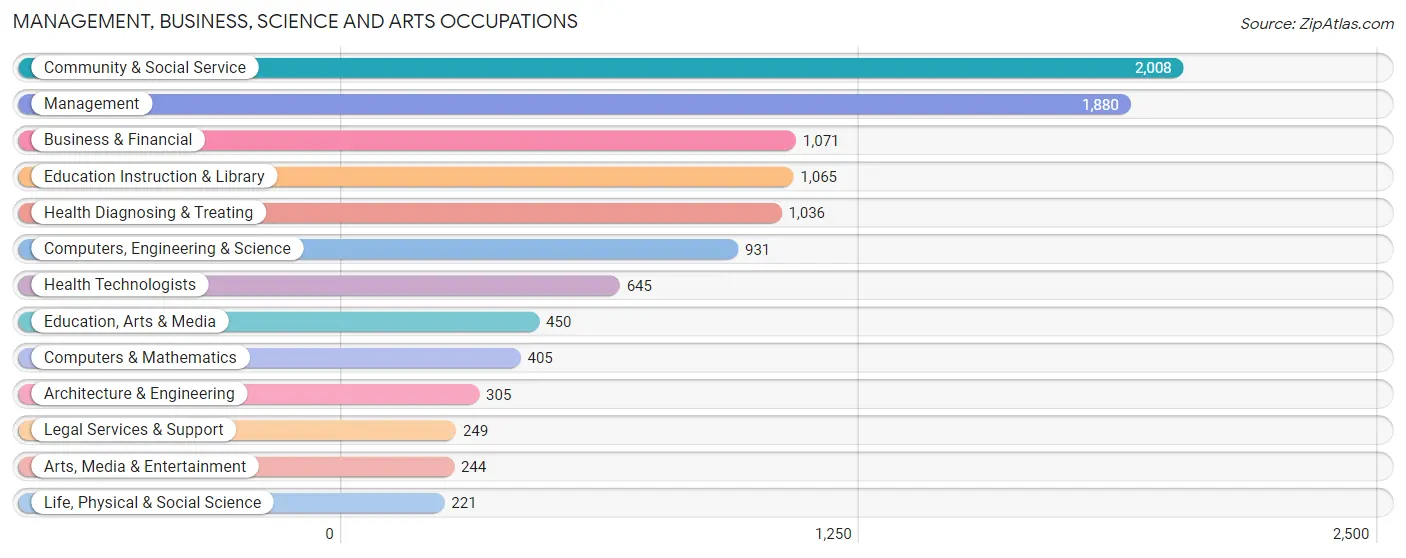
Management, Business, Science and Arts Occupations
The most common Management, Business, Science and Arts occupations in French Valley are Community & Social Service (2,008 | 12.1%), Management (1,880 | 11.4%), Business & Financial (1,071 | 6.5%), Education Instruction & Library (1,065 | 6.4%), and Health Diagnosing & Treating (1,036 | 6.3%).
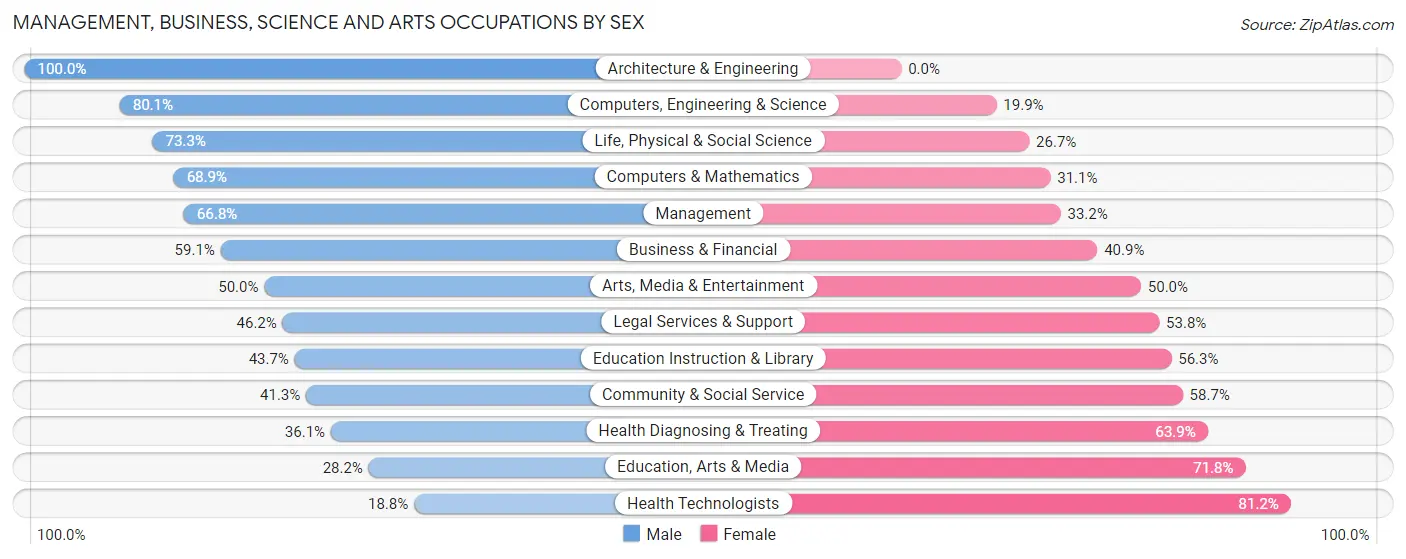
Management, Business, Science and Arts Occupations by Sex
Within the Management, Business, Science and Arts occupations in French Valley, the most male-oriented occupations are Architecture & Engineering (100.0%), Computers, Engineering & Science (80.1%), and Life, Physical & Social Science (73.3%), while the most female-oriented occupations are Health Technologists (81.2%), Education, Arts & Media (71.8%), and Health Diagnosing & Treating (63.9%).
| Occupation | Male | Female |
| Management | 1,255 (66.8%) | 625 (33.2%) |
| Business & Financial | 633 (59.1%) | 438 (40.9%) |
| Computers, Engineering & Science | 746 (80.1%) | 185 (19.9%) |
| Computers & Mathematics | 279 (68.9%) | 126 (31.1%) |
| Architecture & Engineering | 305 (100.0%) | 0 (0.0%) |
| Life, Physical & Social Science | 162 (73.3%) | 59 (26.7%) |
| Community & Social Service | 829 (41.3%) | 1,179 (58.7%) |
| Education, Arts & Media | 127 (28.2%) | 323 (71.8%) |
| Legal Services & Support | 115 (46.2%) | 134 (53.8%) |
| Education Instruction & Library | 465 (43.7%) | 600 (56.3%) |
| Arts, Media & Entertainment | 122 (50.0%) | 122 (50.0%) |
| Health Diagnosing & Treating | 374 (36.1%) | 662 (63.9%) |
| Health Technologists | 121 (18.8%) | 524 (81.2%) |
| Total (Category) | 3,837 (55.4%) | 3,089 (44.6%) |
| Total (Overall) | 8,749 (52.9%) | 7,785 (47.1%) |
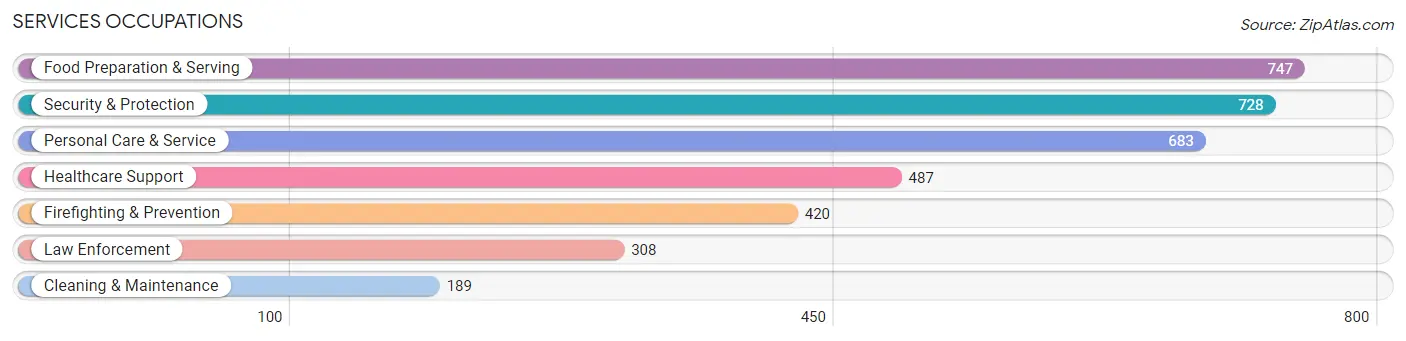
Services Occupations
The most common Services occupations in French Valley are Food Preparation & Serving (747 | 4.5%), Security & Protection (728 | 4.4%), Personal Care & Service (683 | 4.1%), Healthcare Support (487 | 2.9%), and Firefighting & Prevention (420 | 2.5%).
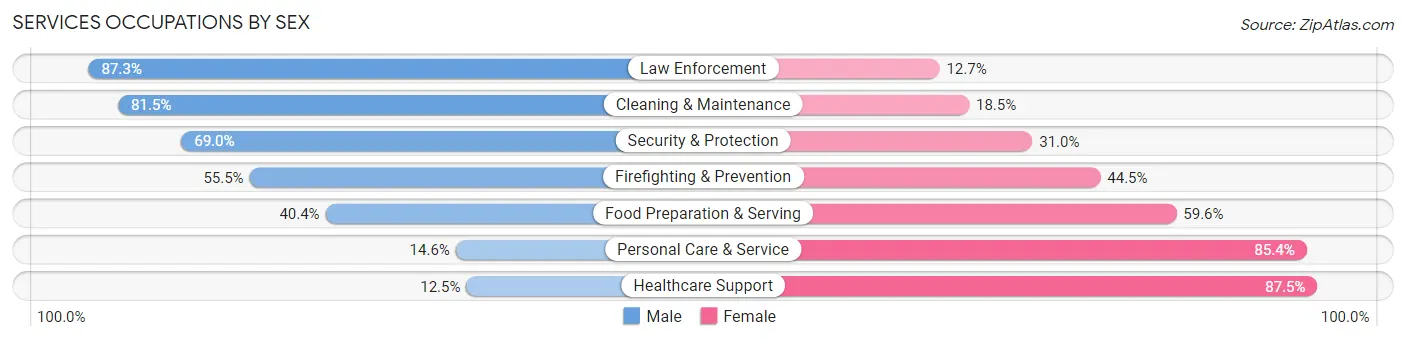
Services Occupations by Sex
Within the Services occupations in French Valley, the most male-oriented occupations are Law Enforcement (87.3%), Cleaning & Maintenance (81.5%), and Security & Protection (69.0%), while the most female-oriented occupations are Healthcare Support (87.5%), Personal Care & Service (85.4%), and Food Preparation & Serving (59.6%).
| Occupation | Male | Female |
| Healthcare Support | 61 (12.5%) | 426 (87.5%) |
| Security & Protection | 502 (69.0%) | 226 (31.0%) |
| Firefighting & Prevention | 233 (55.5%) | 187 (44.5%) |
| Law Enforcement | 269 (87.3%) | 39 (12.7%) |
| Food Preparation & Serving | 302 (40.4%) | 445 (59.6%) |
| Cleaning & Maintenance | 154 (81.5%) | 35 (18.5%) |
| Personal Care & Service | 100 (14.6%) | 583 (85.4%) |
| Total (Category) | 1,119 (39.5%) | 1,715 (60.5%) |
| Total (Overall) | 8,749 (52.9%) | 7,785 (47.1%) |
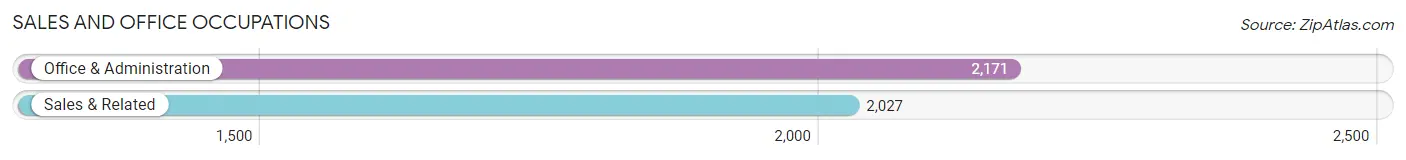
Sales and Office Occupations
The most common Sales and Office occupations in French Valley are Office & Administration (2,171 | 13.1%), and Sales & Related (2,027 | 12.3%).
Sales and Office Occupations by Sex
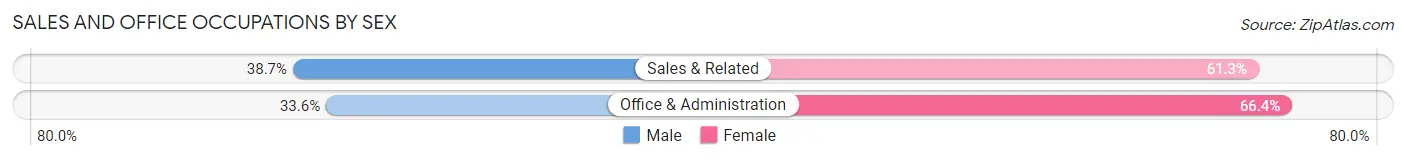
| Occupation | Male | Female |
| Sales & Related | 785 (38.7%) | 1,242 (61.3%) |
| Office & Administration | 730 (33.6%) | 1,441 (66.4%) |
| Total (Category) | 1,515 (36.1%) | 2,683 (63.9%) |
| Total (Overall) | 8,749 (52.9%) | 7,785 (47.1%) |
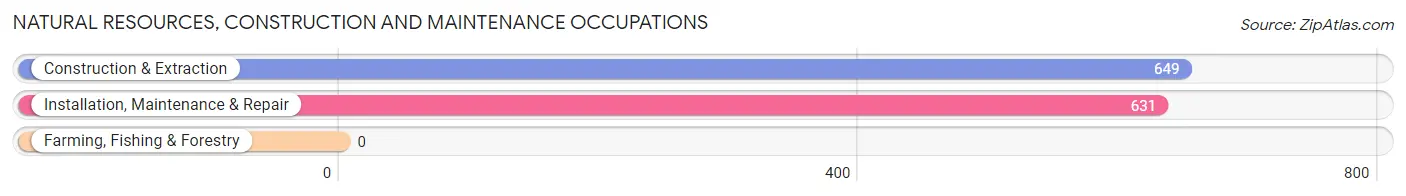
Natural Resources, Construction and Maintenance Occupations
The most common Natural Resources, Construction and Maintenance occupations in French Valley are Construction & Extraction (649 | 3.9%), and Installation, Maintenance & Repair (631 | 3.8%).
Natural Resources, Construction and Maintenance Occupations by Sex
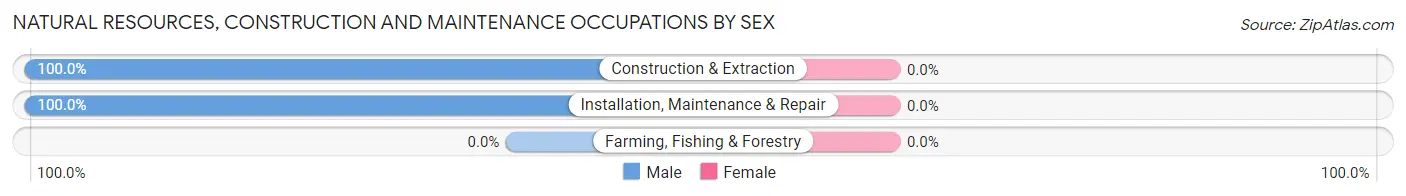
| Occupation | Male | Female |
| Farming, Fishing & Forestry | 0 (0.0%) | 0 (0.0%) |
| Construction & Extraction | 649 (100.0%) | 0 (0.0%) |
| Installation, Maintenance & Repair | 631 (100.0%) | 0 (0.0%) |
| Total (Category) | 1,280 (100.0%) | 0 (0.0%) |
| Total (Overall) | 8,749 (52.9%) | 7,785 (47.1%) |
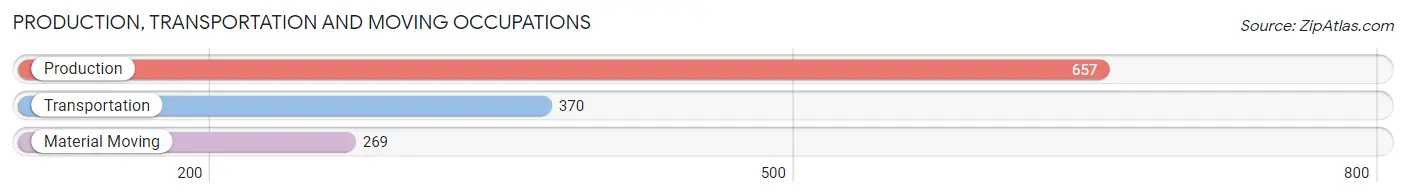
Production, Transportation and Moving Occupations
The most common Production, Transportation and Moving occupations in French Valley are Production (657 | 4.0%), Transportation (370 | 2.2%), and Material Moving (269 | 1.6%).
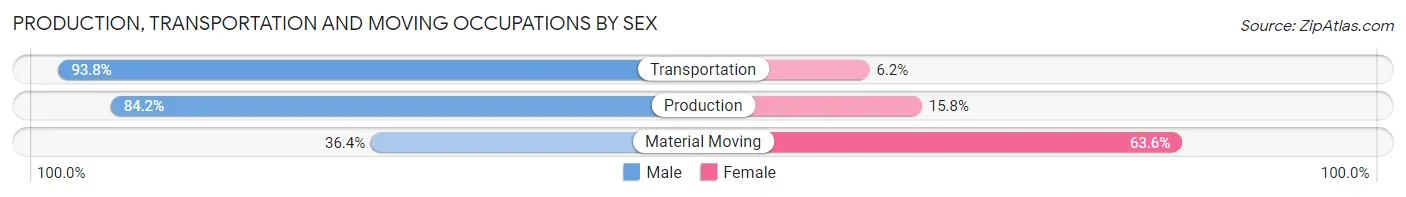
Production, Transportation and Moving Occupations by Sex
| Occupation | Male | Female |
| Production | 553 (84.2%) | 104 (15.8%) |
| Transportation | 347 (93.8%) | 23 (6.2%) |
| Material Moving | 98 (36.4%) | 171 (63.6%) |
| Total (Category) | 998 (77.0%) | 298 (23.0%) |
| Total (Overall) | 8,749 (52.9%) | 7,785 (47.1%) |
Employment Industries by Sex in French Valley
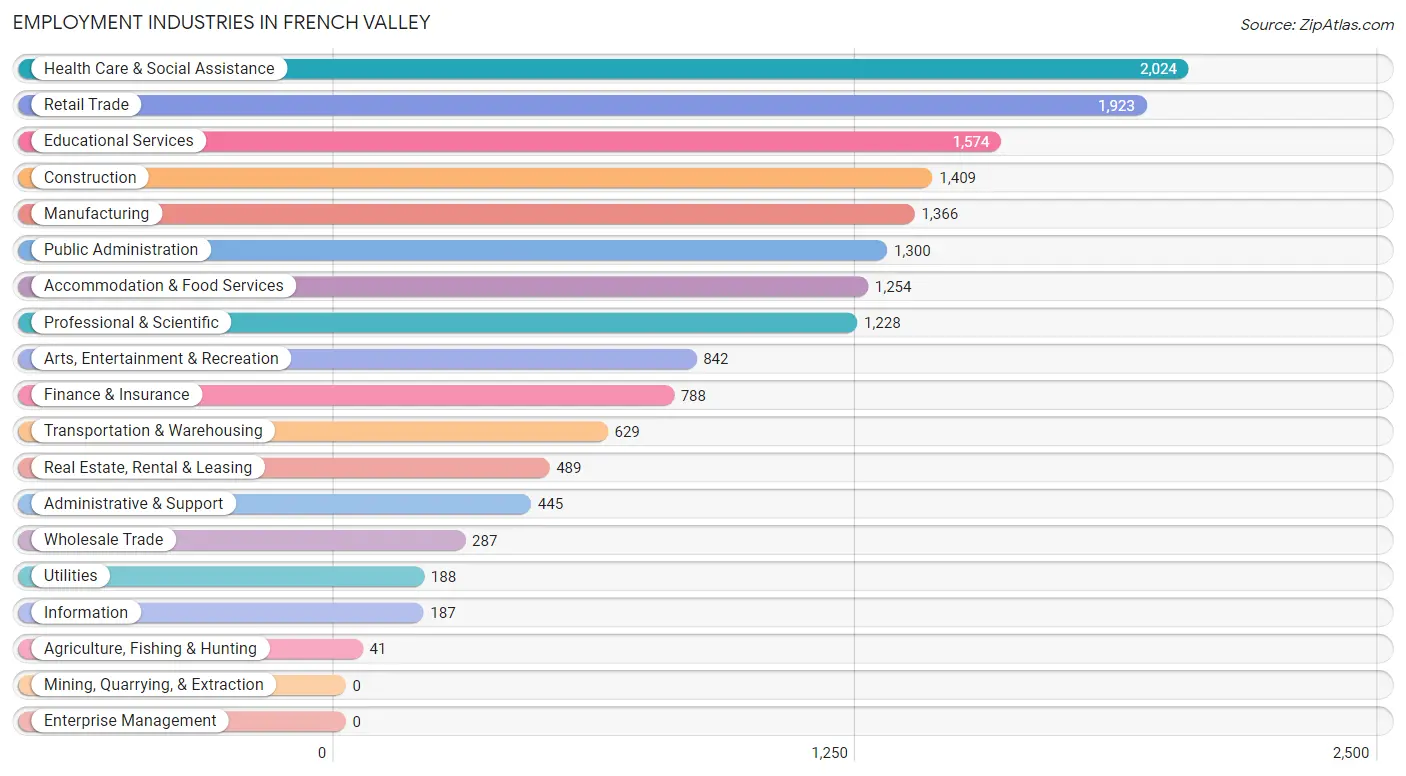
Employment Industries in French Valley
The major employment industries in French Valley include Health Care & Social Assistance (2,024 | 12.2%), Retail Trade (1,923 | 11.6%), Educational Services (1,574 | 9.5%), Construction (1,409 | 8.5%), and Manufacturing (1,366 | 8.3%).
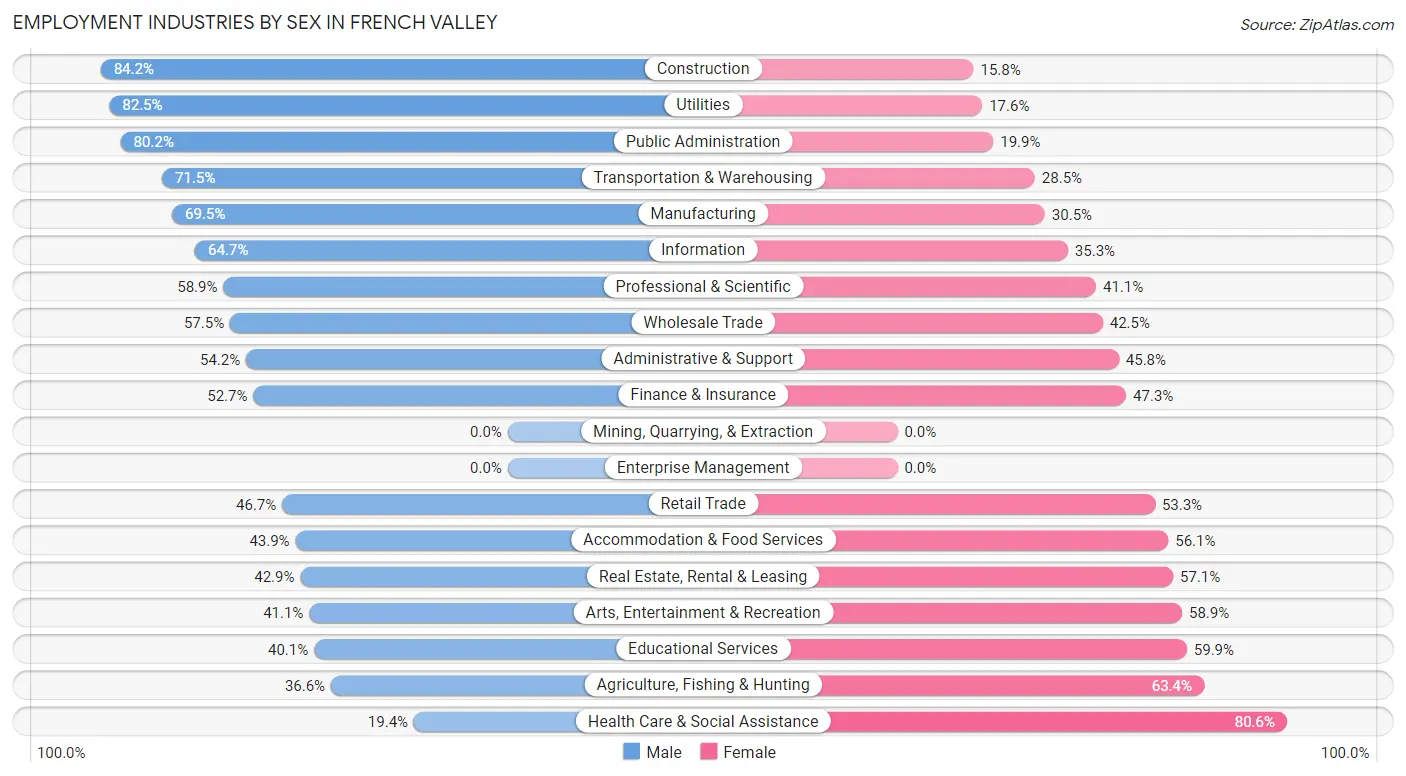
Employment Industries by Sex in French Valley
The French Valley industries that see more men than women are Construction (84.2%), Utilities (82.5%), and Public Administration (80.1%), whereas the industries that tend to have a higher number of women are Health Care & Social Assistance (80.6%), Agriculture, Fishing & Hunting (63.4%), and Educational Services (59.9%).
| Industry | Male | Female |
| Agriculture, Fishing & Hunting | 15 (36.6%) | 26 (63.4%) |
| Mining, Quarrying, & Extraction | 0 (0.0%) | 0 (0.0%) |
| Construction | 1,187 (84.2%) | 222 (15.8%) |
| Manufacturing | 949 (69.5%) | 417 (30.5%) |
| Wholesale Trade | 165 (57.5%) | 122 (42.5%) |
| Retail Trade | 898 (46.7%) | 1,025 (53.3%) |
| Transportation & Warehousing | 450 (71.5%) | 179 (28.5%) |
| Utilities | 155 (82.5%) | 33 (17.5%) |
| Information | 121 (64.7%) | 66 (35.3%) |
| Finance & Insurance | 415 (52.7%) | 373 (47.3%) |
| Real Estate, Rental & Leasing | 210 (42.9%) | 279 (57.1%) |
| Professional & Scientific | 723 (58.9%) | 505 (41.1%) |
| Enterprise Management | 0 (0.0%) | 0 (0.0%) |
| Administrative & Support | 241 (54.2%) | 204 (45.8%) |
| Educational Services | 631 (40.1%) | 943 (59.9%) |
| Health Care & Social Assistance | 393 (19.4%) | 1,631 (80.6%) |
| Arts, Entertainment & Recreation | 346 (41.1%) | 496 (58.9%) |
| Accommodation & Food Services | 551 (43.9%) | 703 (56.1%) |
| Public Administration | 1,042 (80.1%) | 258 (19.9%) |
| Total | 8,749 (52.9%) | 7,785 (47.1%) |
Education in French Valley
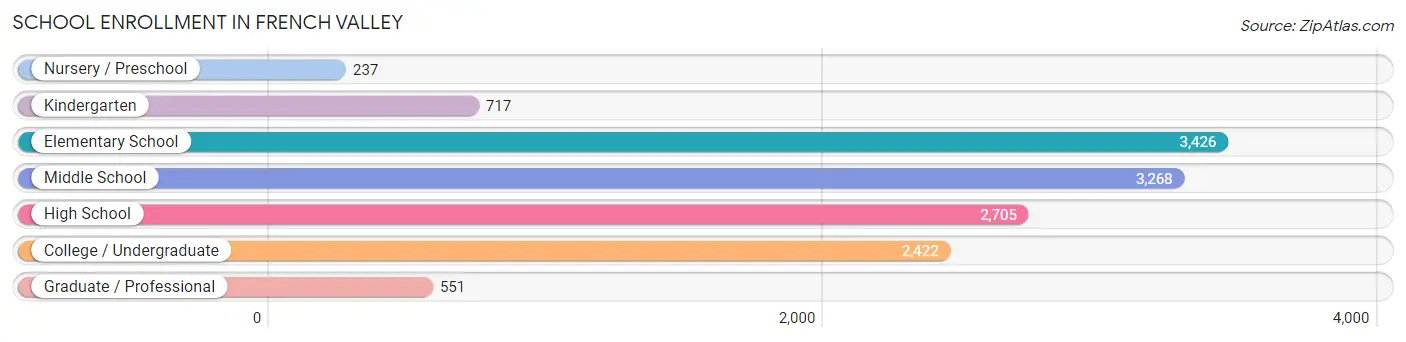
School Enrollment in French Valley
The most common levels of schooling among the 13,326 students in French Valley are elementary school (3,426 | 25.7%), middle school (3,268 | 24.5%), and high school (2,705 | 20.3%).
| School Level | # Students | % Students |
| Nursery / Preschool | 237 | 1.8% |
| Kindergarten | 717 | 5.4% |
| Elementary School | 3,426 | 25.7% |
| Middle School | 3,268 | 24.5% |
| High School | 2,705 | 20.3% |
| College / Undergraduate | 2,422 | 18.2% |
| Graduate / Professional | 551 | 4.1% |
| Total | 13,326 | 100.0% |
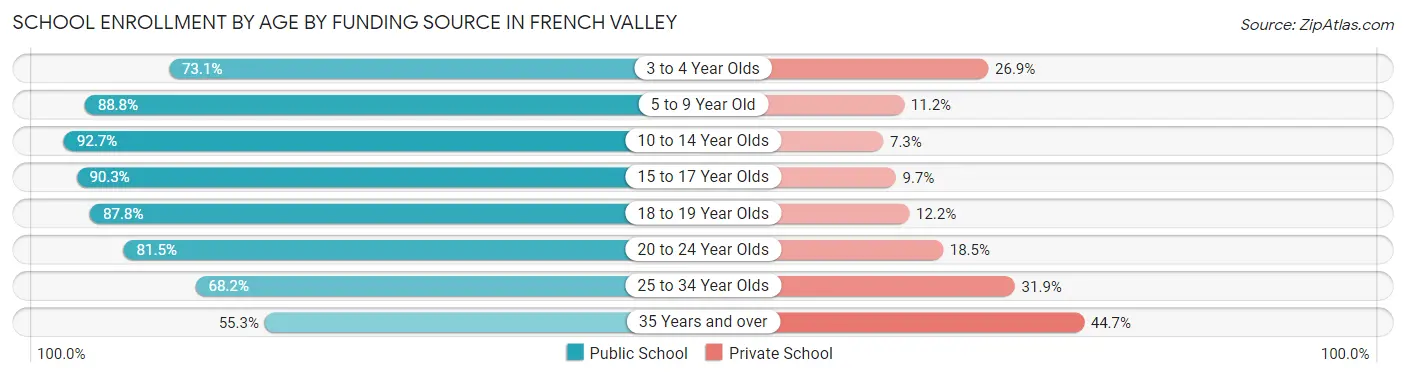
School Enrollment by Age by Funding Source in French Valley
Out of a total of 13,326 students who are enrolled in schools in French Valley, 1,892 (14.2%) attend a private institution, while the remaining 11,434 (85.8%) are enrolled in public schools. The age group of 35 years and over has the highest likelihood of being enrolled in private schools, with 509 (44.7% in the age bracket) enrolled. Conversely, the age group of 10 to 14 year olds has the lowest likelihood of being enrolled in a private school, with 3,929 (92.7% in the age bracket) attending a public institution.
| Age Bracket | Public School | Private School |
| 3 to 4 Year Olds | 144 (73.1%) | 53 (26.9%) |
| 5 to 9 Year Old | 3,205 (88.8%) | 405 (11.2%) |
| 10 to 14 Year Olds | 3,929 (92.7%) | 311 (7.3%) |
| 15 to 17 Year Olds | 1,907 (90.3%) | 204 (9.7%) |
| 18 to 19 Year Olds | 613 (87.8%) | 85 (12.2%) |
| 20 to 24 Year Olds | 592 (81.5%) | 134 (18.5%) |
| 25 to 34 Year Olds | 413 (68.1%) | 193 (31.9%) |
| 35 Years and over | 629 (55.3%) | 509 (44.7%) |
| Total | 11,434 (85.8%) | 1,892 (14.2%) |
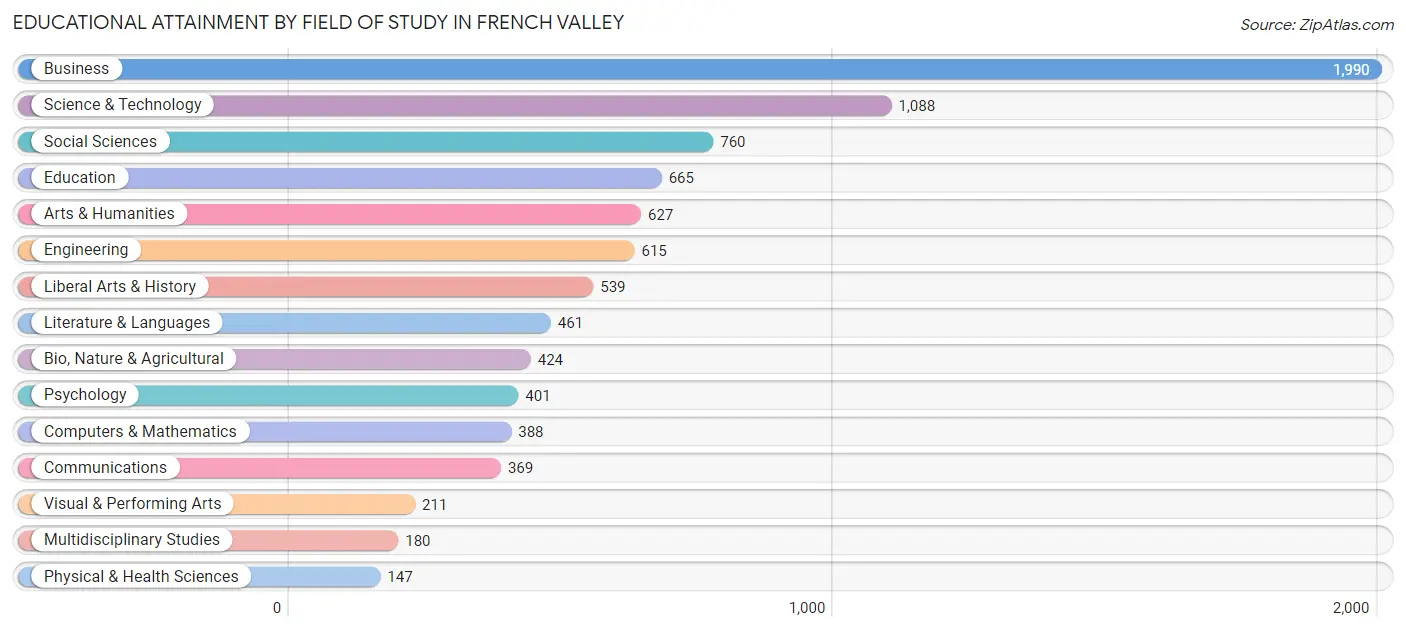
Educational Attainment by Field of Study in French Valley
Business (1,990 | 22.5%), science & technology (1,088 | 12.3%), social sciences (760 | 8.6%), education (665 | 7.5%), and arts & humanities (627 | 7.1%) are the most common fields of study among 8,865 individuals in French Valley who have obtained a bachelor's degree or higher.
| Field of Study | # Graduates | % Graduates |
| Computers & Mathematics | 388 | 4.4% |
| Bio, Nature & Agricultural | 424 | 4.8% |
| Physical & Health Sciences | 147 | 1.7% |
| Psychology | 401 | 4.5% |
| Social Sciences | 760 | 8.6% |
| Engineering | 615 | 6.9% |
| Multidisciplinary Studies | 180 | 2.0% |
| Science & Technology | 1,088 | 12.3% |
| Business | 1,990 | 22.5% |
| Education | 665 | 7.5% |
| Literature & Languages | 461 | 5.2% |
| Liberal Arts & History | 539 | 6.1% |
| Visual & Performing Arts | 211 | 2.4% |
| Communications | 369 | 4.2% |
| Arts & Humanities | 627 | 7.1% |
| Total | 8,865 | 100.0% |
Transportation & Commute in French Valley
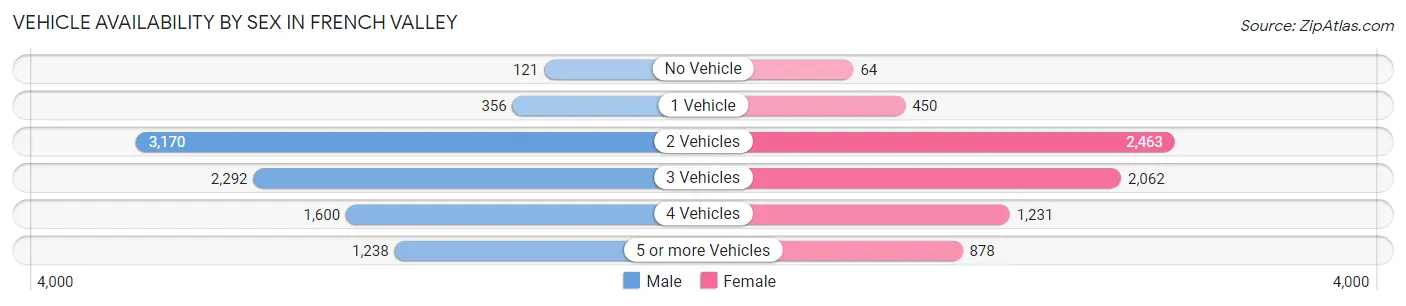
Vehicle Availability by Sex in French Valley
The most prevalent vehicle ownership categories in French Valley are males with 2 vehicles (3,170, accounting for 36.1%) and females with 2 vehicles (2,463, making up 44.4%).
| Vehicles Available | Male | Female |
| No Vehicle | 121 (1.4%) | 64 (0.9%) |
| 1 Vehicle | 356 (4.1%) | 450 (6.3%) |
| 2 Vehicles | 3,170 (36.1%) | 2,463 (34.5%) |
| 3 Vehicles | 2,292 (26.1%) | 2,062 (28.8%) |
| 4 Vehicles | 1,600 (18.2%) | 1,231 (17.2%) |
| 5 or more Vehicles | 1,238 (14.1%) | 878 (12.3%) |
| Total | 8,777 (100.0%) | 7,148 (100.0%) |
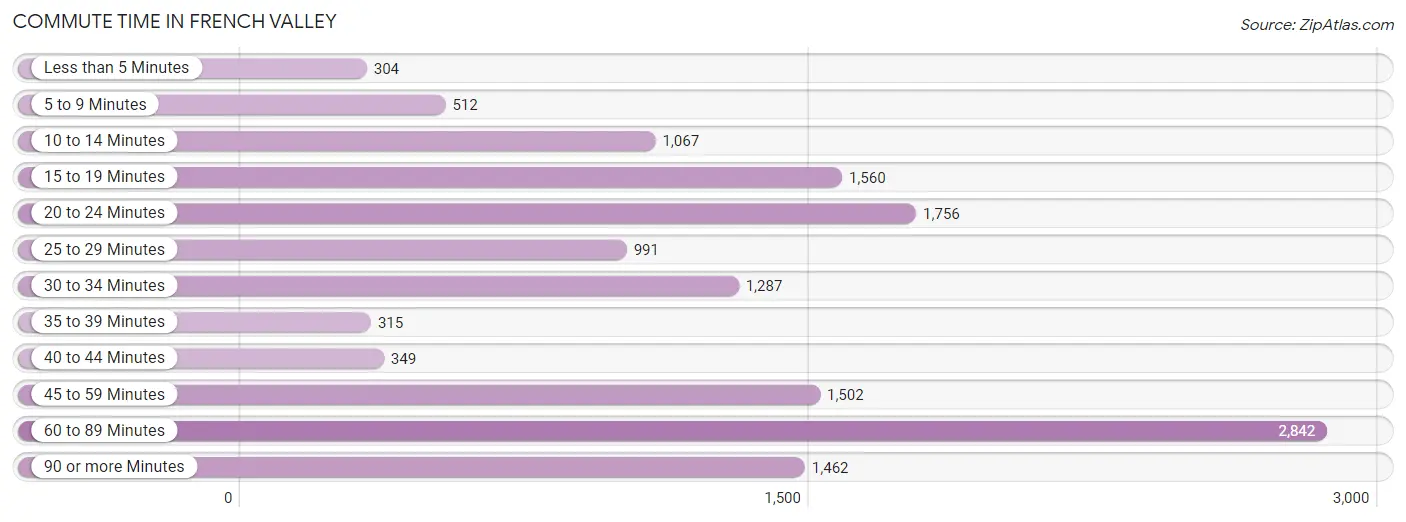
Commute Time in French Valley
The most frequently occuring commute durations in French Valley are 60 to 89 minutes (2,842 commuters, 20.4%), 20 to 24 minutes (1,756 commuters, 12.6%), and 15 to 19 minutes (1,560 commuters, 11.2%).
| Commute Time | # Commuters | % Commuters |
| Less than 5 Minutes | 304 | 2.2% |
| 5 to 9 Minutes | 512 | 3.7% |
| 10 to 14 Minutes | 1,067 | 7.6% |
| 15 to 19 Minutes | 1,560 | 11.2% |
| 20 to 24 Minutes | 1,756 | 12.6% |
| 25 to 29 Minutes | 991 | 7.1% |
| 30 to 34 Minutes | 1,287 | 9.2% |
| 35 to 39 Minutes | 315 | 2.3% |
| 40 to 44 Minutes | 349 | 2.5% |
| 45 to 59 Minutes | 1,502 | 10.8% |
| 60 to 89 Minutes | 2,842 | 20.4% |
| 90 or more Minutes | 1,462 | 10.5% |
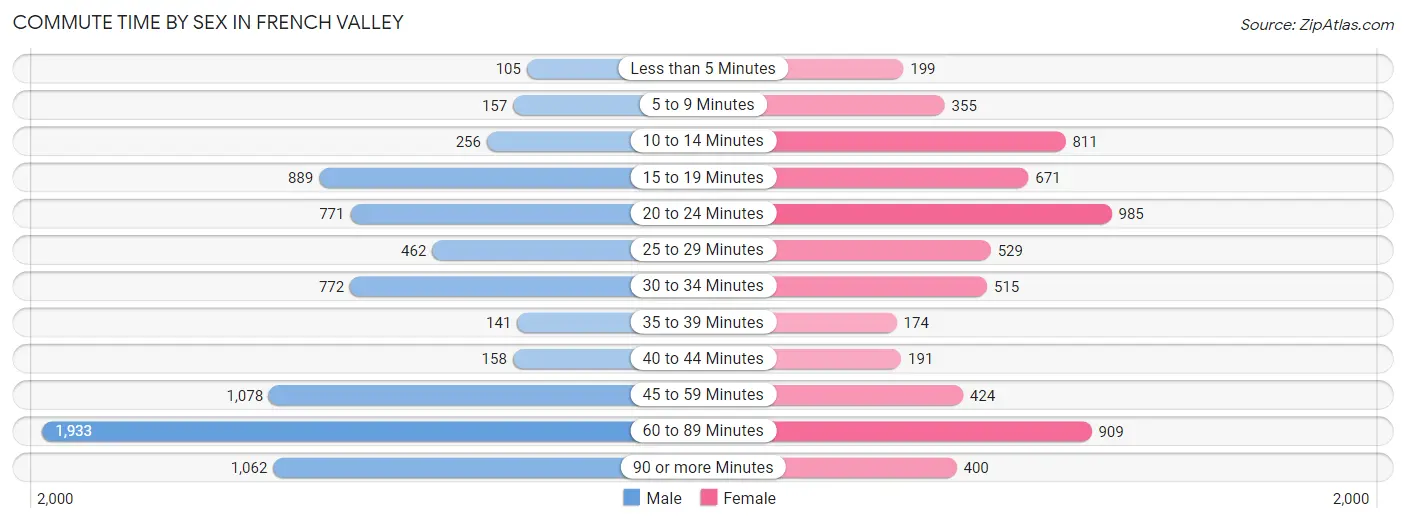
Commute Time by Sex in French Valley
The most common commute times in French Valley are 60 to 89 minutes (1,933 commuters, 24.8%) for males and 20 to 24 minutes (985 commuters, 16.0%) for females.
| Commute Time | Male | Female |
| Less than 5 Minutes | 105 (1.3%) | 199 (3.2%) |
| 5 to 9 Minutes | 157 (2.0%) | 355 (5.8%) |
| 10 to 14 Minutes | 256 (3.3%) | 811 (13.2%) |
| 15 to 19 Minutes | 889 (11.4%) | 671 (10.9%) |
| 20 to 24 Minutes | 771 (9.9%) | 985 (16.0%) |
| 25 to 29 Minutes | 462 (5.9%) | 529 (8.6%) |
| 30 to 34 Minutes | 772 (9.9%) | 515 (8.4%) |
| 35 to 39 Minutes | 141 (1.8%) | 174 (2.8%) |
| 40 to 44 Minutes | 158 (2.0%) | 191 (3.1%) |
| 45 to 59 Minutes | 1,078 (13.9%) | 424 (6.9%) |
| 60 to 89 Minutes | 1,933 (24.8%) | 909 (14.7%) |
| 90 or more Minutes | 1,062 (13.6%) | 400 (6.5%) |
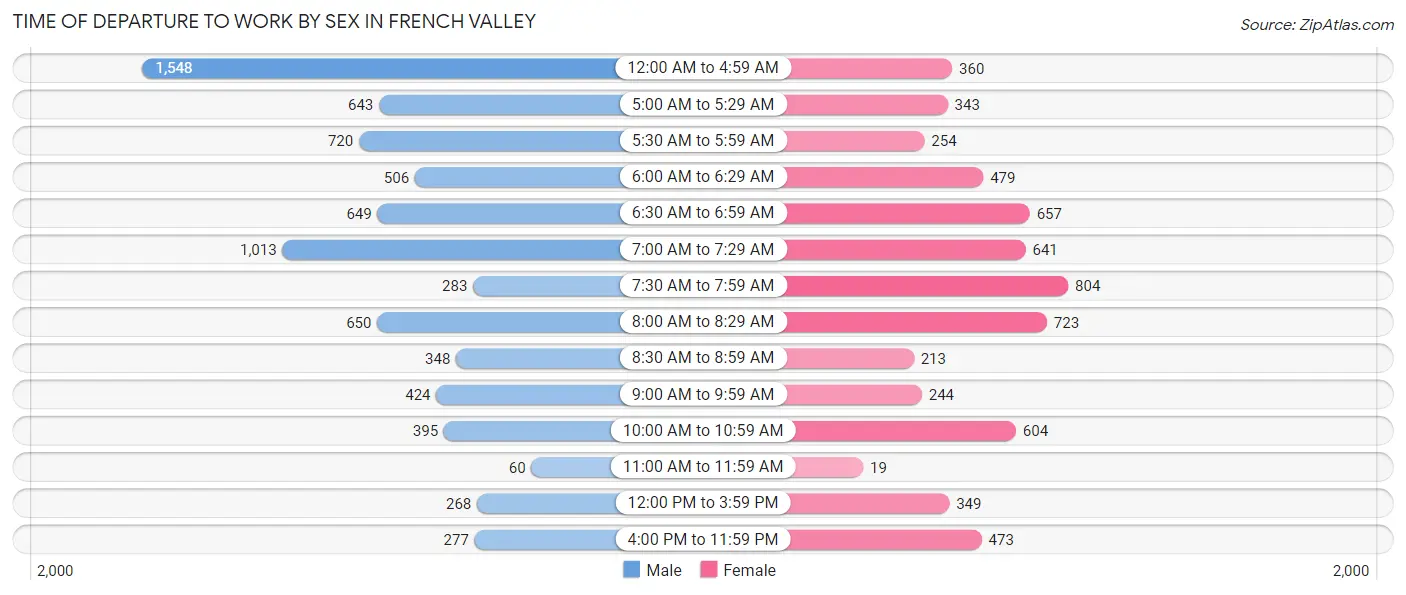
Time of Departure to Work by Sex in French Valley
The most frequent times of departure to work in French Valley are 12:00 AM to 4:59 AM (1,548, 19.9%) for males and 7:30 AM to 7:59 AM (804, 13.1%) for females.
| Time of Departure | Male | Female |
| 12:00 AM to 4:59 AM | 1,548 (19.9%) | 360 (5.8%) |
| 5:00 AM to 5:29 AM | 643 (8.3%) | 343 (5.6%) |
| 5:30 AM to 5:59 AM | 720 (9.2%) | 254 (4.1%) |
| 6:00 AM to 6:29 AM | 506 (6.5%) | 479 (7.8%) |
| 6:30 AM to 6:59 AM | 649 (8.3%) | 657 (10.7%) |
| 7:00 AM to 7:29 AM | 1,013 (13.0%) | 641 (10.4%) |
| 7:30 AM to 7:59 AM | 283 (3.6%) | 804 (13.1%) |
| 8:00 AM to 8:29 AM | 650 (8.4%) | 723 (11.7%) |
| 8:30 AM to 8:59 AM | 348 (4.5%) | 213 (3.5%) |
| 9:00 AM to 9:59 AM | 424 (5.4%) | 244 (4.0%) |
| 10:00 AM to 10:59 AM | 395 (5.1%) | 604 (9.8%) |
| 11:00 AM to 11:59 AM | 60 (0.8%) | 19 (0.3%) |
| 12:00 PM to 3:59 PM | 268 (3.4%) | 349 (5.7%) |
| 4:00 PM to 11:59 PM | 277 (3.6%) | 473 (7.7%) |
| Total | 7,784 (100.0%) | 6,163 (100.0%) |
Housing Occupancy in French Valley
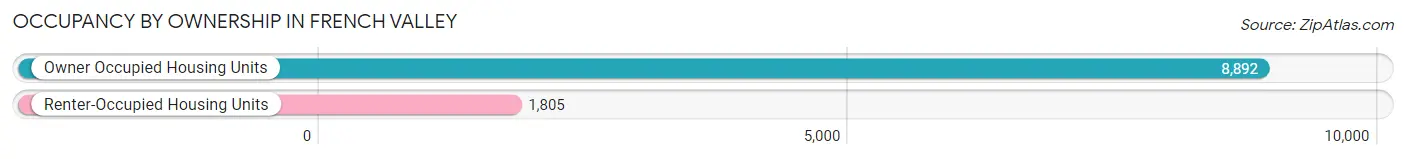
Occupancy by Ownership in French Valley
Of the total 10,697 dwellings in French Valley, owner-occupied units account for 8,892 (83.1%), while renter-occupied units make up 1,805 (16.9%).
| Occupancy | # Housing Units | % Housing Units |
| Owner Occupied Housing Units | 8,892 | 83.1% |
| Renter-Occupied Housing Units | 1,805 | 16.9% |
| Total Occupied Housing Units | 10,697 | 100.0% |
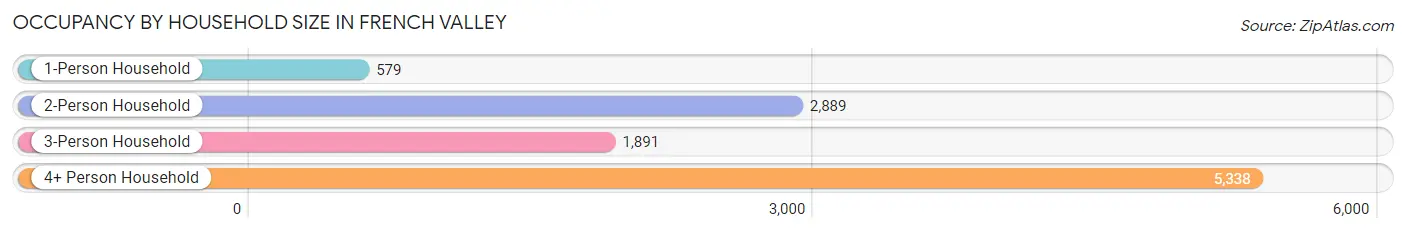
Occupancy by Household Size in French Valley
| Household Size | # Housing Units | % Housing Units |
| 1-Person Household | 579 | 5.4% |
| 2-Person Household | 2,889 | 27.0% |
| 3-Person Household | 1,891 | 17.7% |
| 4+ Person Household | 5,338 | 49.9% |
| Total Housing Units | 10,697 | 100.0% |
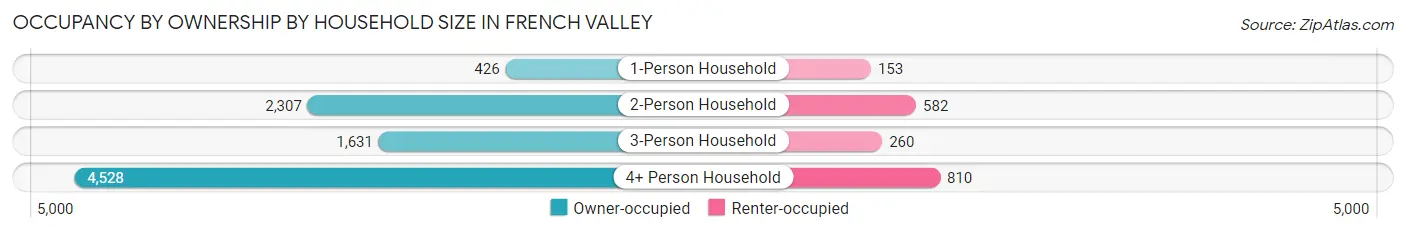
Occupancy by Ownership by Household Size in French Valley
| Household Size | Owner-occupied | Renter-occupied |
| 1-Person Household | 426 (73.6%) | 153 (26.4%) |
| 2-Person Household | 2,307 (79.8%) | 582 (20.2%) |
| 3-Person Household | 1,631 (86.3%) | 260 (13.8%) |
| 4+ Person Household | 4,528 (84.8%) | 810 (15.2%) |
| Total Housing Units | 8,892 (83.1%) | 1,805 (16.9%) |
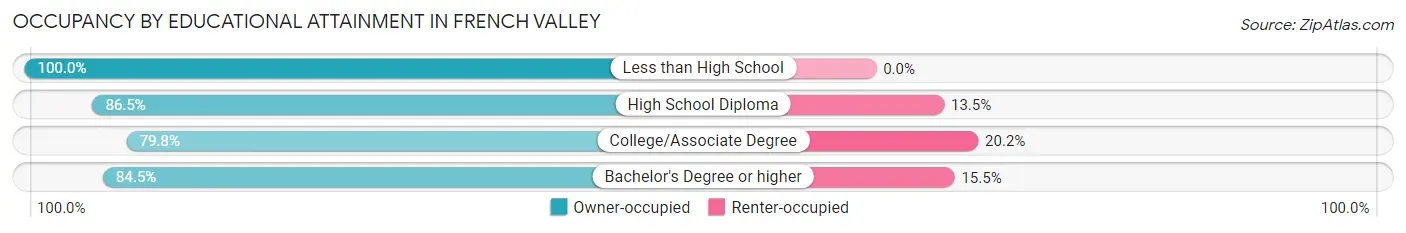
Occupancy by Educational Attainment in French Valley
| Household Size | Owner-occupied | Renter-occupied |
| Less than High School | 199 (100.0%) | 0 (0.0%) |
| High School Diploma | 1,331 (86.5%) | 207 (13.5%) |
| College/Associate Degree | 3,516 (79.8%) | 891 (20.2%) |
| Bachelor's Degree or higher | 3,846 (84.5%) | 707 (15.5%) |
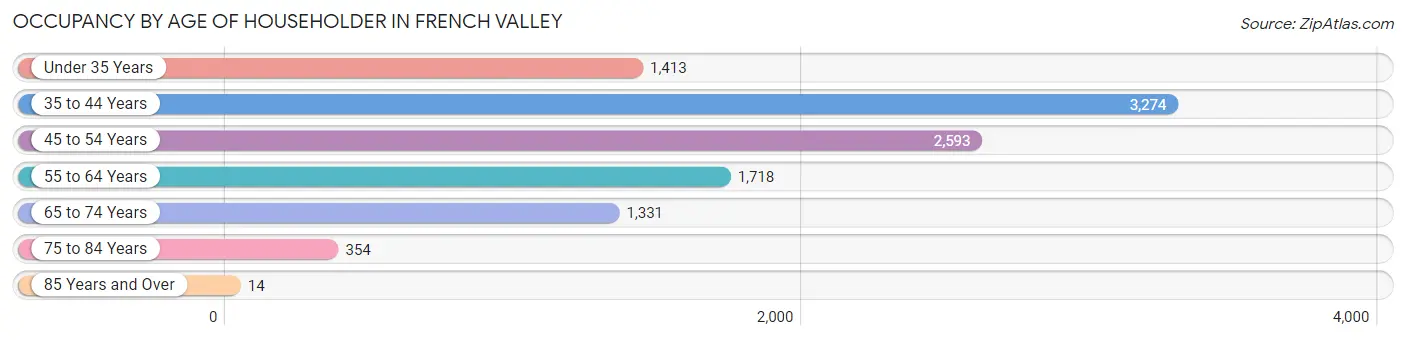
Occupancy by Age of Householder in French Valley
| Age Bracket | # Households | % Households |
| Under 35 Years | 1,413 | 13.2% |
| 35 to 44 Years | 3,274 | 30.6% |
| 45 to 54 Years | 2,593 | 24.2% |
| 55 to 64 Years | 1,718 | 16.1% |
| 65 to 74 Years | 1,331 | 12.4% |
| 75 to 84 Years | 354 | 3.3% |
| 85 Years and Over | 14 | 0.1% |
| Total | 10,697 | 100.0% |
Housing Finances in French Valley
Median Income by Occupancy in French Valley
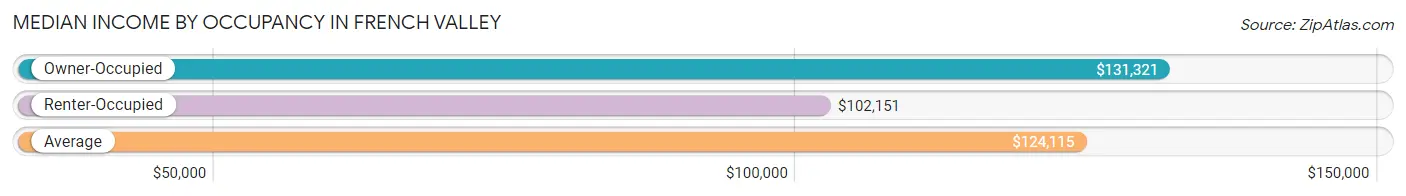
| Occupancy Type | # Households | Median Income |
| Owner-Occupied | 8,892 (83.1%) | $131,321 |
| Renter-Occupied | 1,805 (16.9%) | $102,151 |
| Average | 10,697 (100.0%) | $124,115 |
Occupancy by Householder Income Bracket in French Valley
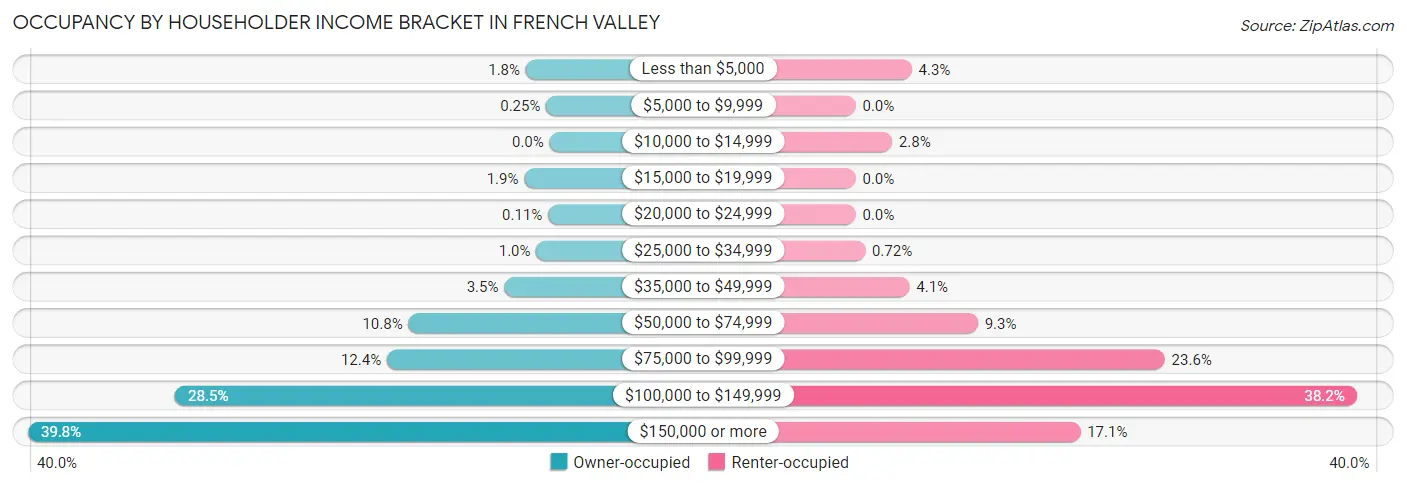
| Income Bracket | Owner-occupied | Renter-occupied |
| Less than $5,000 | 161 (1.8%) | 77 (4.3%) |
| $5,000 to $9,999 | 22 (0.3%) | 0 (0.0%) |
| $10,000 to $14,999 | 0 (0.0%) | 50 (2.8%) |
| $15,000 to $19,999 | 172 (1.9%) | 0 (0.0%) |
| $20,000 to $24,999 | 10 (0.1%) | 0 (0.0%) |
| $25,000 to $34,999 | 90 (1.0%) | 13 (0.7%) |
| $35,000 to $49,999 | 307 (3.5%) | 74 (4.1%) |
| $50,000 to $74,999 | 956 (10.7%) | 168 (9.3%) |
| $75,000 to $99,999 | 1,102 (12.4%) | 425 (23.5%) |
| $100,000 to $149,999 | 2,537 (28.5%) | 689 (38.2%) |
| $150,000 or more | 3,535 (39.8%) | 309 (17.1%) |
| Total | 8,892 (100.0%) | 1,805 (100.0%) |
Monthly Housing Cost Tiers in French Valley
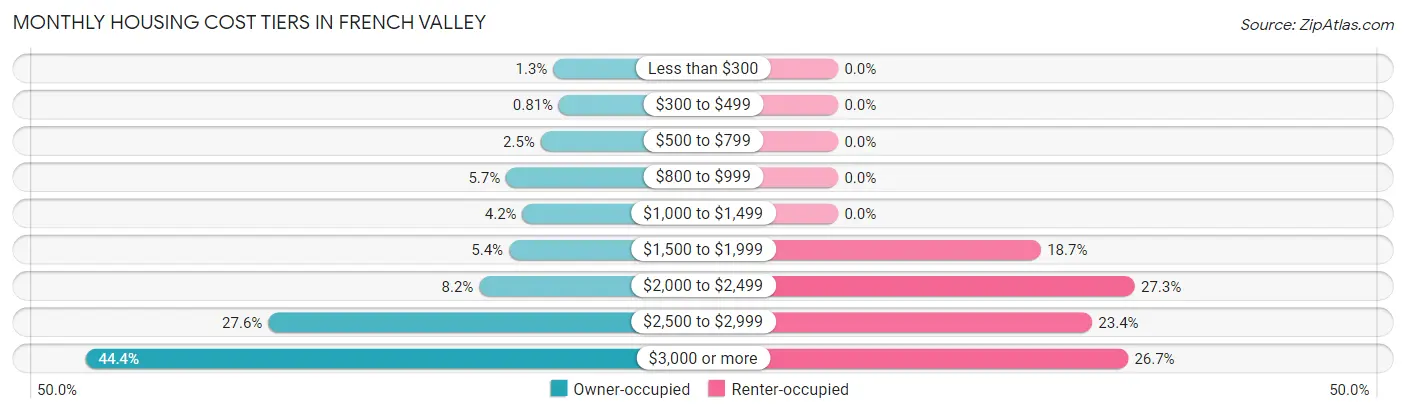
| Monthly Cost | Owner-occupied | Renter-occupied |
| Less than $300 | 119 (1.3%) | 0 (0.0%) |
| $300 to $499 | 72 (0.8%) | 0 (0.0%) |
| $500 to $799 | 221 (2.5%) | 0 (0.0%) |
| $800 to $999 | 505 (5.7%) | 0 (0.0%) |
| $1,000 to $1,499 | 371 (4.2%) | 0 (0.0%) |
| $1,500 to $1,999 | 481 (5.4%) | 337 (18.7%) |
| $2,000 to $2,499 | 725 (8.2%) | 493 (27.3%) |
| $2,500 to $2,999 | 2,452 (27.6%) | 422 (23.4%) |
| $3,000 or more | 3,946 (44.4%) | 482 (26.7%) |
| Total | 8,892 (100.0%) | 1,805 (100.0%) |
Physical Housing Characteristics in French Valley
Housing Structures in French Valley
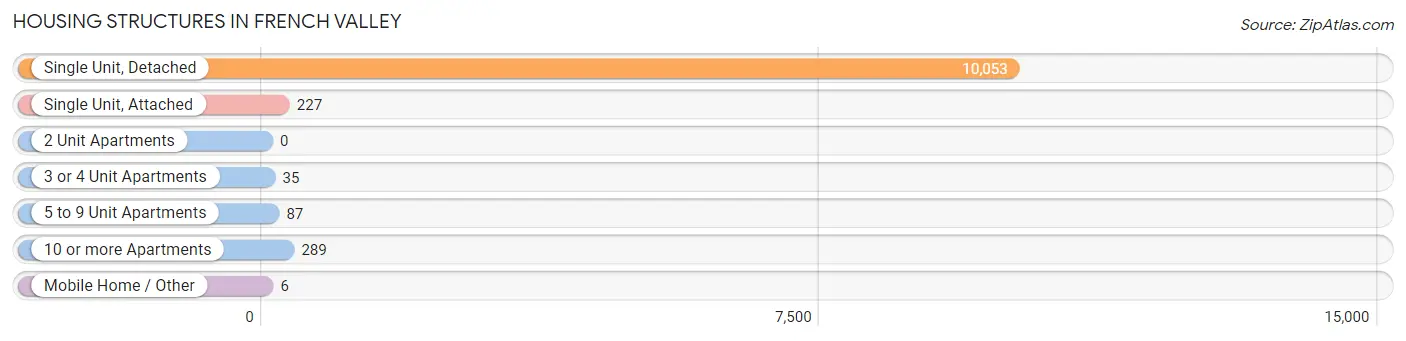
| Structure Type | # Housing Units | % Housing Units |
| Single Unit, Detached | 10,053 | 94.0% |
| Single Unit, Attached | 227 | 2.1% |
| 2 Unit Apartments | 0 | 0.0% |
| 3 or 4 Unit Apartments | 35 | 0.3% |
| 5 to 9 Unit Apartments | 87 | 0.8% |
| 10 or more Apartments | 289 | 2.7% |
| Mobile Home / Other | 6 | 0.1% |
| Total | 10,697 | 100.0% |
Housing Structures by Occupancy in French Valley
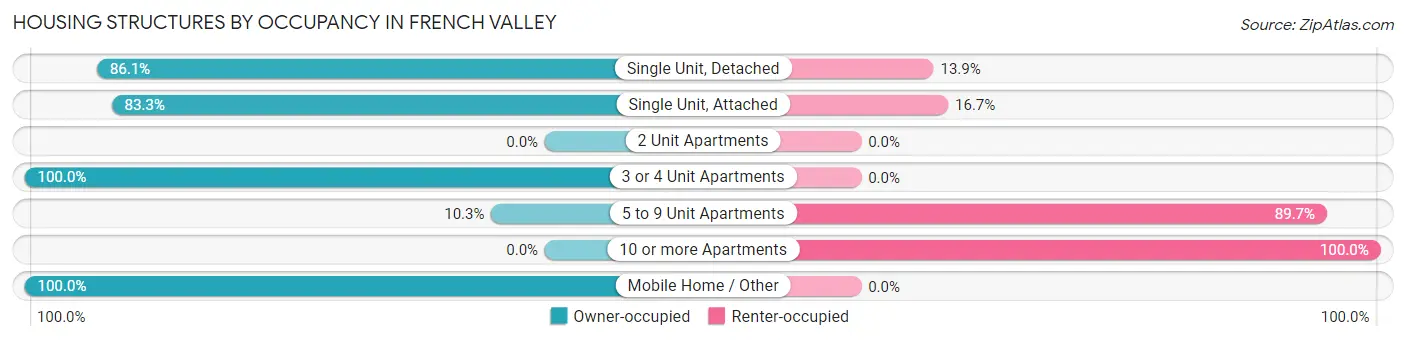
| Structure Type | Owner-occupied | Renter-occupied |
| Single Unit, Detached | 8,653 (86.1%) | 1,400 (13.9%) |
| Single Unit, Attached | 189 (83.3%) | 38 (16.7%) |
| 2 Unit Apartments | 0 (0.0%) | 0 (0.0%) |
| 3 or 4 Unit Apartments | 35 (100.0%) | 0 (0.0%) |
| 5 to 9 Unit Apartments | 9 (10.3%) | 78 (89.7%) |
| 10 or more Apartments | 0 (0.0%) | 289 (100.0%) |
| Mobile Home / Other | 6 (100.0%) | 0 (0.0%) |
| Total | 8,892 (83.1%) | 1,805 (16.9%) |
Housing Structures by Number of Rooms in French Valley
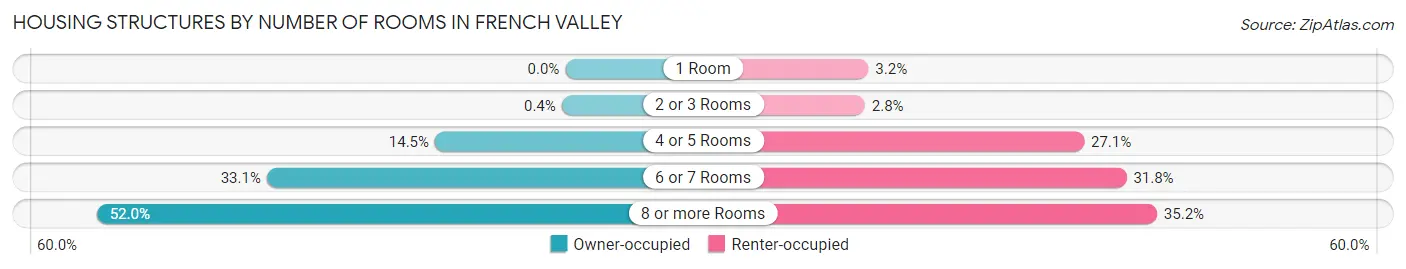
| Number of Rooms | Owner-occupied | Renter-occupied |
| 1 Room | 0 (0.0%) | 57 (3.2%) |
| 2 or 3 Rooms | 36 (0.4%) | 50 (2.8%) |
| 4 or 5 Rooms | 1,287 (14.5%) | 489 (27.1%) |
| 6 or 7 Rooms | 2,946 (33.1%) | 574 (31.8%) |
| 8 or more Rooms | 4,623 (52.0%) | 635 (35.2%) |
| Total | 8,892 (100.0%) | 1,805 (100.0%) |
Housing Structure by Heating Type in French Valley
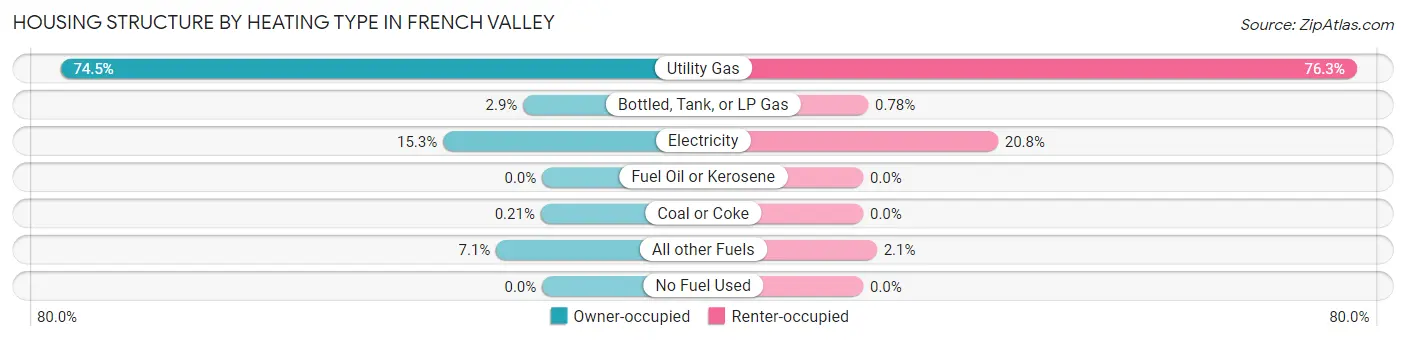
| Heating Type | Owner-occupied | Renter-occupied |
| Utility Gas | 6,621 (74.5%) | 1,377 (76.3%) |
| Bottled, Tank, or LP Gas | 260 (2.9%) | 14 (0.8%) |
| Electricity | 1,361 (15.3%) | 376 (20.8%) |
| Fuel Oil or Kerosene | 0 (0.0%) | 0 (0.0%) |
| Coal or Coke | 19 (0.2%) | 0 (0.0%) |
| All other Fuels | 631 (7.1%) | 38 (2.1%) |
| No Fuel Used | 0 (0.0%) | 0 (0.0%) |
| Total | 8,892 (100.0%) | 1,805 (100.0%) |
Household Vehicle Usage in French Valley
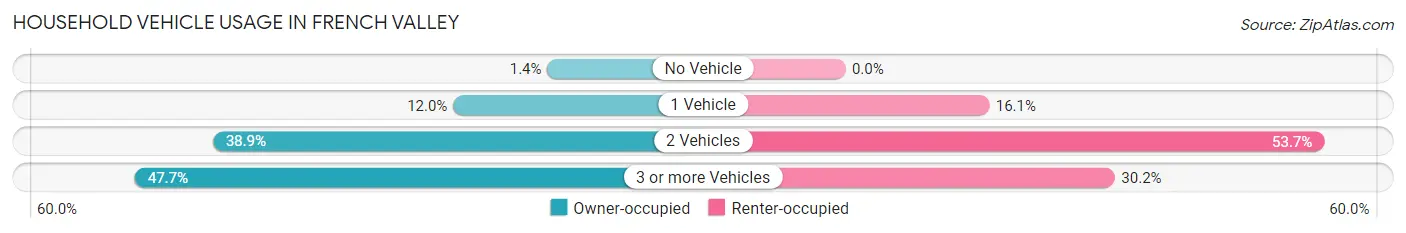
| Vehicles per Household | Owner-occupied | Renter-occupied |
| No Vehicle | 128 (1.4%) | 0 (0.0%) |
| 1 Vehicle | 1,066 (12.0%) | 291 (16.1%) |
| 2 Vehicles | 3,461 (38.9%) | 969 (53.7%) |
| 3 or more Vehicles | 4,237 (47.6%) | 545 (30.2%) |
| Total | 8,892 (100.0%) | 1,805 (100.0%) |
Real Estate & Mortgages in French Valley
Real Estate and Mortgage Overview in French Valley
| Characteristic | Without Mortgage | With Mortgage |
| Housing Units | 1,151 | 7,741 |
| Median Property Value | $606,300 | $612,500 |
| Median Household Income | $113,329 | $3,299 |
| Monthly Housing Costs | $872 | $3,946 |
| Real Estate Taxes | $6,828 | $160 |
Property Value by Mortgage Status in French Valley
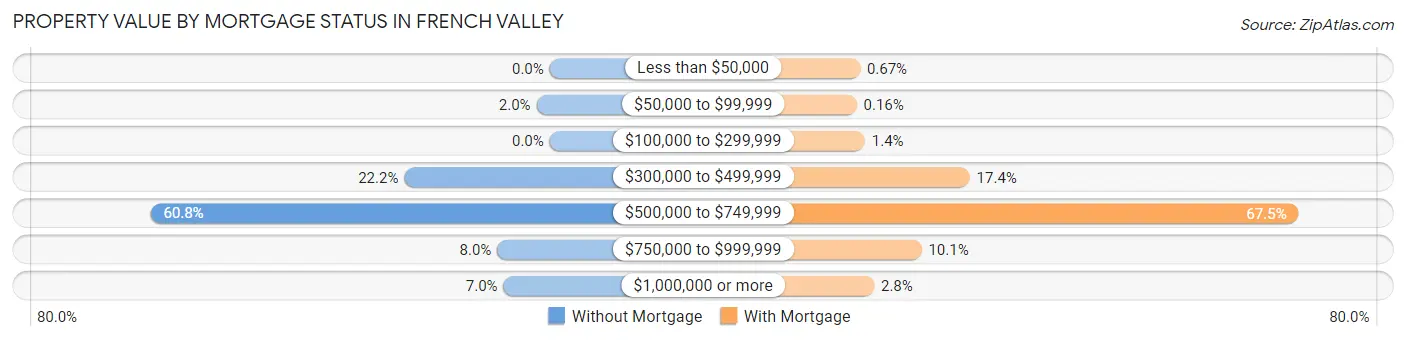
| Property Value | Without Mortgage | With Mortgage |
| Less than $50,000 | 0 (0.0%) | 52 (0.7%) |
| $50,000 to $99,999 | 23 (2.0%) | 12 (0.2%) |
| $100,000 to $299,999 | 0 (0.0%) | 110 (1.4%) |
| $300,000 to $499,999 | 255 (22.2%) | 1,346 (17.4%) |
| $500,000 to $749,999 | 700 (60.8%) | 5,225 (67.5%) |
| $750,000 to $999,999 | 92 (8.0%) | 778 (10.1%) |
| $1,000,000 or more | 81 (7.0%) | 218 (2.8%) |
| Total | 1,151 (100.0%) | 7,741 (100.0%) |
Household Income by Mortgage Status in French Valley
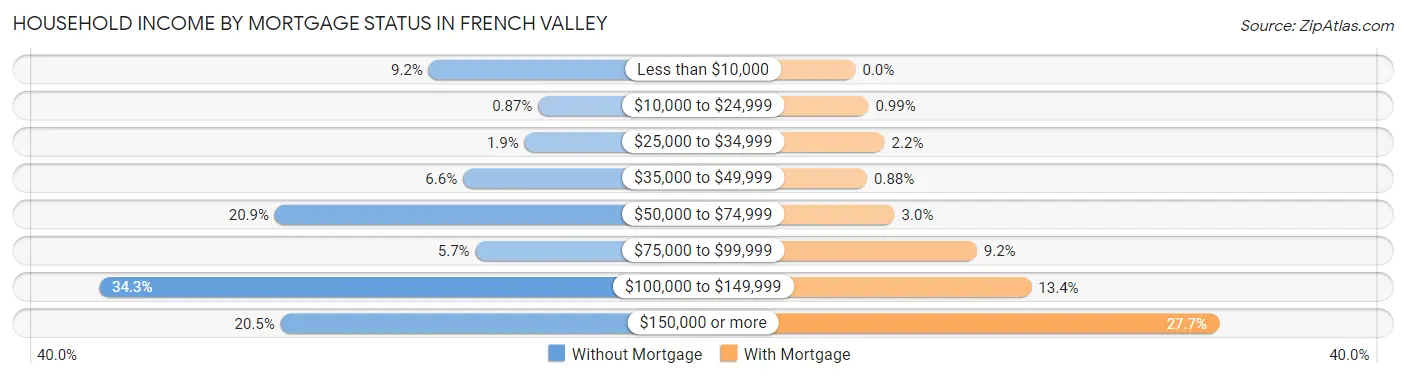
| Household Income | Without Mortgage | With Mortgage |
| Less than $10,000 | 106 (9.2%) | 0 (0.0%) |
| $10,000 to $24,999 | 10 (0.9%) | 77 (1.0%) |
| $25,000 to $34,999 | 22 (1.9%) | 172 (2.2%) |
| $35,000 to $49,999 | 76 (6.6%) | 68 (0.9%) |
| $50,000 to $74,999 | 241 (20.9%) | 231 (3.0%) |
| $75,000 to $99,999 | 65 (5.7%) | 715 (9.2%) |
| $100,000 to $149,999 | 395 (34.3%) | 1,037 (13.4%) |
| $150,000 or more | 236 (20.5%) | 2,142 (27.7%) |
| Total | 1,151 (100.0%) | 7,741 (100.0%) |
Property Value to Household Income Ratio in French Valley
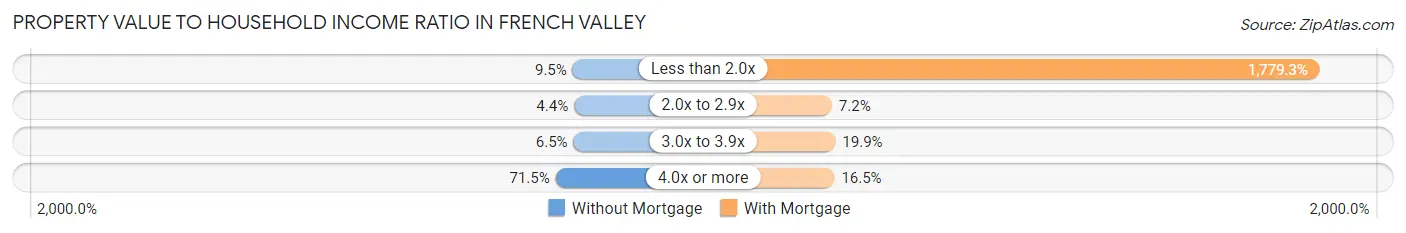
| Value-to-Income Ratio | Without Mortgage | With Mortgage |
| Less than 2.0x | 109 (9.5%) | 137,734 (1,779.3%) |
| 2.0x to 2.9x | 51 (4.4%) | 555 (7.2%) |
| 3.0x to 3.9x | 75 (6.5%) | 1,539 (19.9%) |
| 4.0x or more | 823 (71.5%) | 1,274 (16.5%) |
| Total | 1,151 (100.0%) | 7,741 (100.0%) |
Real Estate Taxes by Mortgage Status in French Valley
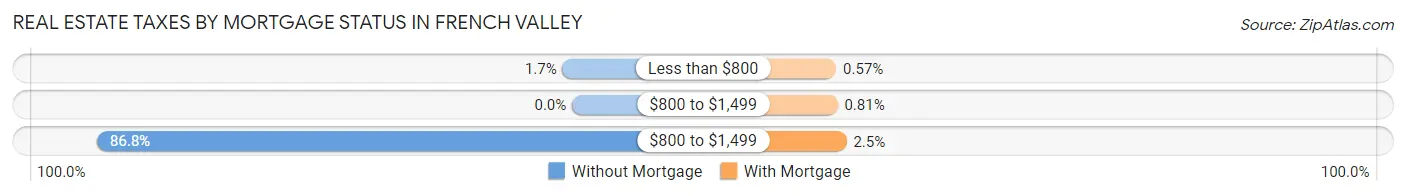
| Property Taxes | Without Mortgage | With Mortgage |
| Less than $800 | 20 (1.7%) | 44 (0.6%) |
| $800 to $1,499 | 0 (0.0%) | 63 (0.8%) |
| $800 to $1,499 | 999 (86.8%) | 190 (2.5%) |
| Total | 1,151 (100.0%) | 7,741 (100.0%) |
Health & Disability in French Valley
Health Insurance Coverage by Age in French Valley
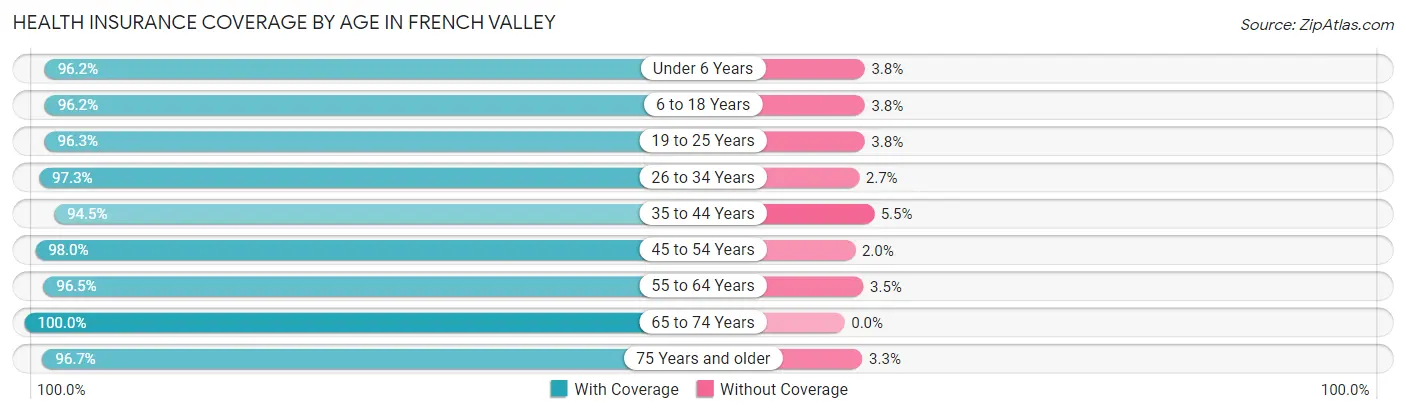
| Age Bracket | With Coverage | Without Coverage |
| Under 6 Years | 3,632 (96.2%) | 142 (3.8%) |
| 6 to 18 Years | 9,943 (96.2%) | 389 (3.8%) |
| 19 to 25 Years | 2,363 (96.3%) | 92 (3.7%) |
| 26 to 34 Years | 4,005 (97.3%) | 112 (2.7%) |
| 35 to 44 Years | 5,837 (94.5%) | 339 (5.5%) |
| 45 to 54 Years | 5,275 (98.0%) | 107 (2.0%) |
| 55 to 64 Years | 3,357 (96.5%) | 122 (3.5%) |
| 65 to 74 Years | 2,756 (100.0%) | 0 (0.0%) |
| 75 Years and older | 1,335 (96.7%) | 46 (3.3%) |
| Total | 38,503 (96.6%) | 1,349 (3.4%) |
Health Insurance Coverage by Citizenship Status in French Valley
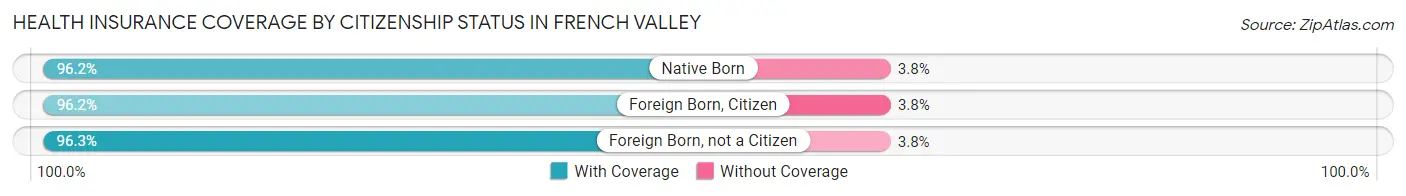
| Citizenship Status | With Coverage | Without Coverage |
| Native Born | 3,632 (96.2%) | 142 (3.8%) |
| Foreign Born, Citizen | 9,943 (96.2%) | 389 (3.8%) |
| Foreign Born, not a Citizen | 2,363 (96.3%) | 92 (3.7%) |
Health Insurance Coverage by Household Income in French Valley
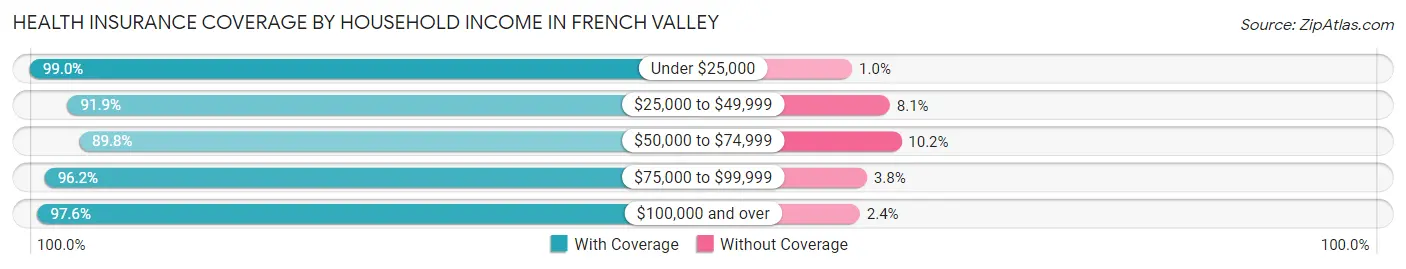
| Household Income | With Coverage | Without Coverage |
| Under $25,000 | 1,381 (99.0%) | 14 (1.0%) |
| $25,000 to $49,999 | 1,117 (91.9%) | 98 (8.1%) |
| $50,000 to $74,999 | 3,004 (89.8%) | 342 (10.2%) |
| $75,000 to $99,999 | 4,950 (96.2%) | 194 (3.8%) |
| $100,000 and over | 28,042 (97.6%) | 701 (2.4%) |
Public vs Private Health Insurance Coverage by Age in French Valley
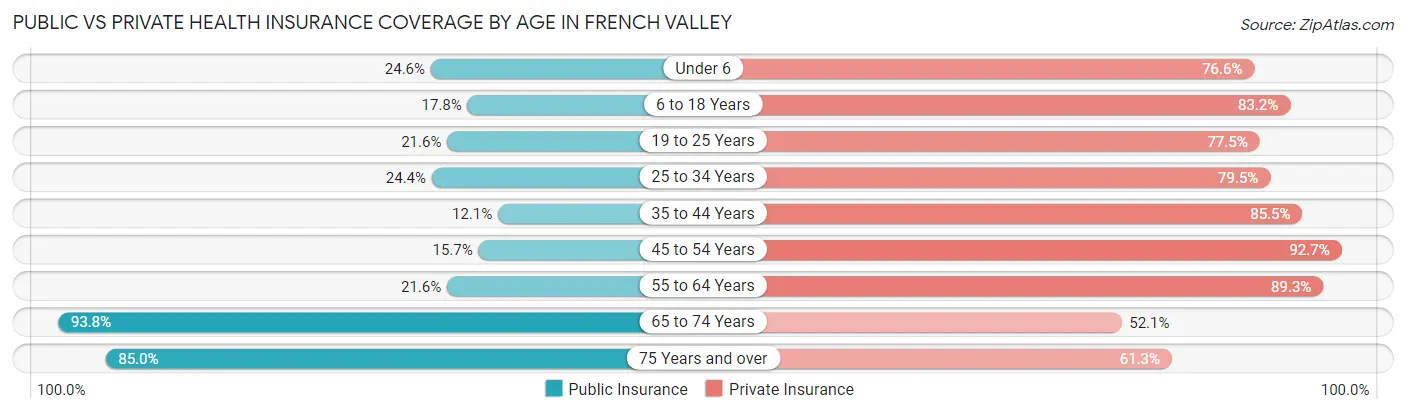
| Age Bracket | Public Insurance | Private Insurance |
| Under 6 | 928 (24.6%) | 2,889 (76.5%) |
| 6 to 18 Years | 1,836 (17.8%) | 8,596 (83.2%) |
| 19 to 25 Years | 529 (21.5%) | 1,903 (77.5%) |
| 25 to 34 Years | 1,005 (24.4%) | 3,273 (79.5%) |
| 35 to 44 Years | 749 (12.1%) | 5,279 (85.5%) |
| 45 to 54 Years | 847 (15.7%) | 4,991 (92.7%) |
| 55 to 64 Years | 751 (21.6%) | 3,108 (89.3%) |
| 65 to 74 Years | 2,586 (93.8%) | 1,435 (52.1%) |
| 75 Years and over | 1,174 (85.0%) | 846 (61.3%) |
| Total | 10,405 (26.1%) | 32,320 (81.1%) |
Disability Status by Sex by Age in French Valley
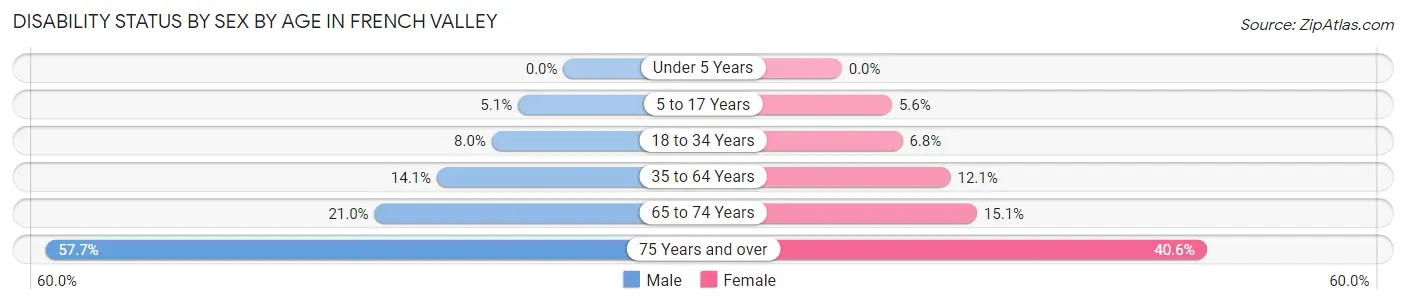
| Age Bracket | Male | Female |
| Under 5 Years | 0 (0.0%) | 0 (0.0%) |
| 5 to 17 Years | 253 (5.1%) | 308 (5.6%) |
| 18 to 34 Years | 258 (8.0%) | 265 (6.8%) |
| 35 to 64 Years | 1,073 (14.1%) | 899 (12.1%) |
| 65 to 74 Years | 194 (21.0%) | 276 (15.0%) |
| 75 Years and over | 308 (57.7%) | 344 (40.6%) |
Disability Class by Sex by Age in French Valley
Disability Class: Hearing Difficulty
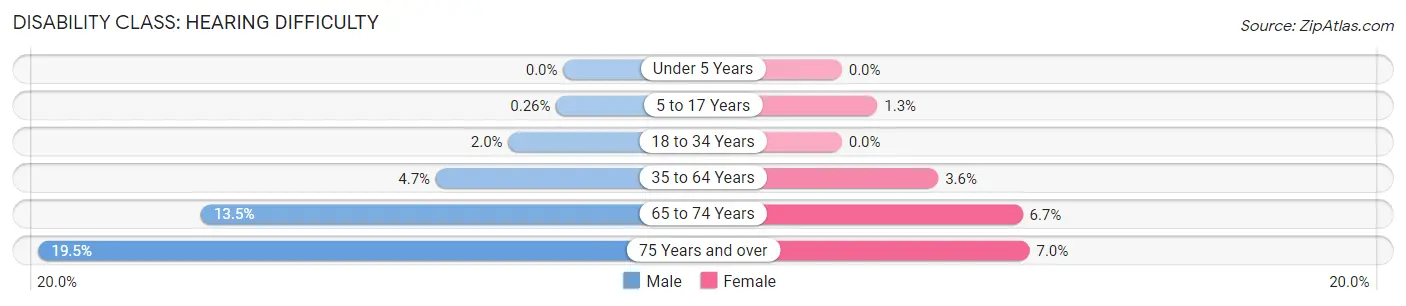
| Age Bracket | Male | Female |
| Under 5 Years | 0 (0.0%) | 0 (0.0%) |
| 5 to 17 Years | 13 (0.3%) | 73 (1.3%) |
| 18 to 34 Years | 66 (2.0%) | 0 (0.0%) |
| 35 to 64 Years | 360 (4.7%) | 266 (3.6%) |
| 65 to 74 Years | 124 (13.5%) | 123 (6.7%) |
| 75 Years and over | 104 (19.5%) | 59 (7.0%) |
Disability Class: Vision Difficulty
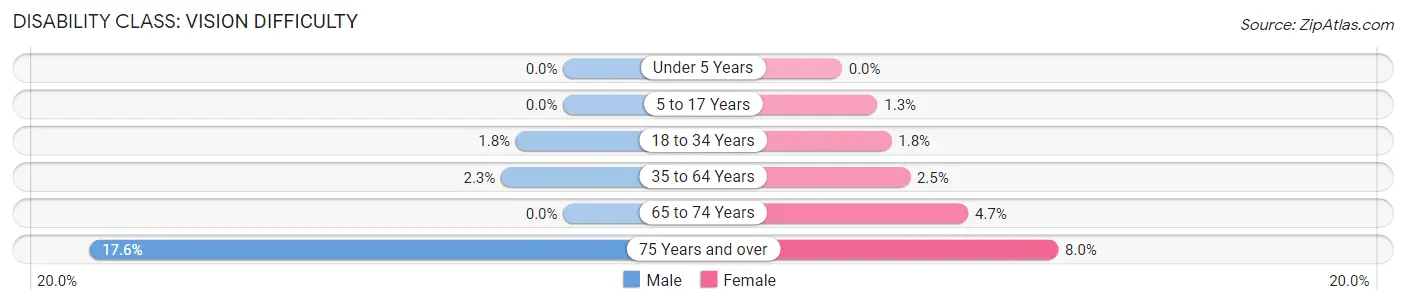
| Age Bracket | Male | Female |
| Under 5 Years | 0 (0.0%) | 0 (0.0%) |
| 5 to 17 Years | 0 (0.0%) | 73 (1.3%) |
| 18 to 34 Years | 57 (1.8%) | 72 (1.8%) |
| 35 to 64 Years | 176 (2.3%) | 188 (2.5%) |
| 65 to 74 Years | 0 (0.0%) | 86 (4.7%) |
| 75 Years and over | 94 (17.6%) | 68 (8.0%) |
Disability Class: Cognitive Difficulty
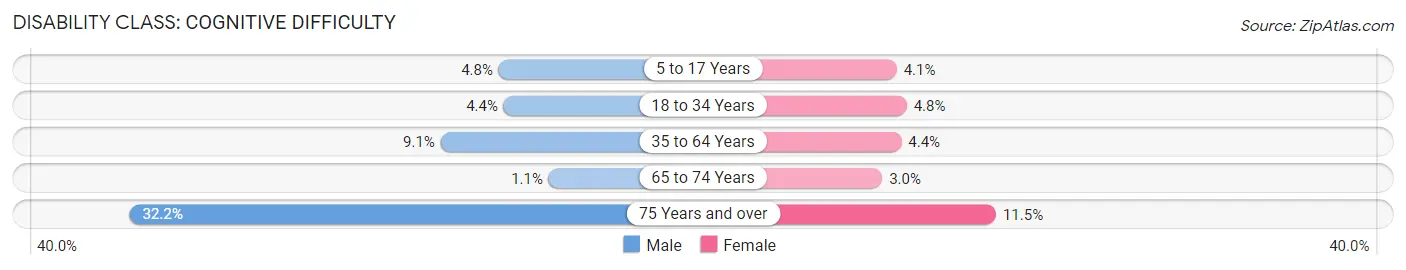
| Age Bracket | Male | Female |
| 5 to 17 Years | 240 (4.8%) | 225 (4.1%) |
| 18 to 34 Years | 143 (4.4%) | 189 (4.8%) |
| 35 to 64 Years | 694 (9.1%) | 328 (4.4%) |
| 65 to 74 Years | 10 (1.1%) | 55 (3.0%) |
| 75 Years and over | 172 (32.2%) | 97 (11.5%) |
Disability Class: Ambulatory Difficulty
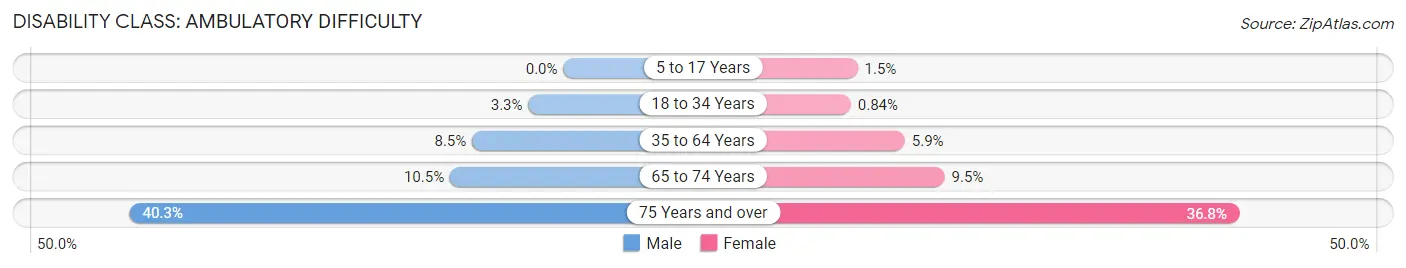
| Age Bracket | Male | Female |
| 5 to 17 Years | 0 (0.0%) | 81 (1.5%) |
| 18 to 34 Years | 105 (3.3%) | 33 (0.8%) |
| 35 to 64 Years | 645 (8.5%) | 434 (5.9%) |
| 65 to 74 Years | 97 (10.5%) | 175 (9.5%) |
| 75 Years and over | 215 (40.3%) | 312 (36.8%) |
Disability Class: Self-Care Difficulty
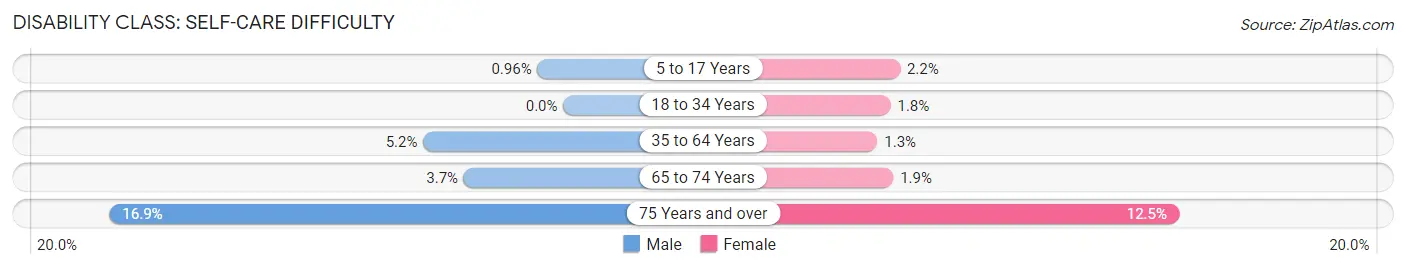
| Age Bracket | Male | Female |
| 5 to 17 Years | 48 (1.0%) | 119 (2.2%) |
| 18 to 34 Years | 0 (0.0%) | 71 (1.8%) |
| 35 to 64 Years | 396 (5.2%) | 98 (1.3%) |
| 65 to 74 Years | 34 (3.7%) | 35 (1.9%) |
| 75 Years and over | 90 (16.9%) | 106 (12.5%) |
Technology Access in French Valley
Computing Device Access in French Valley
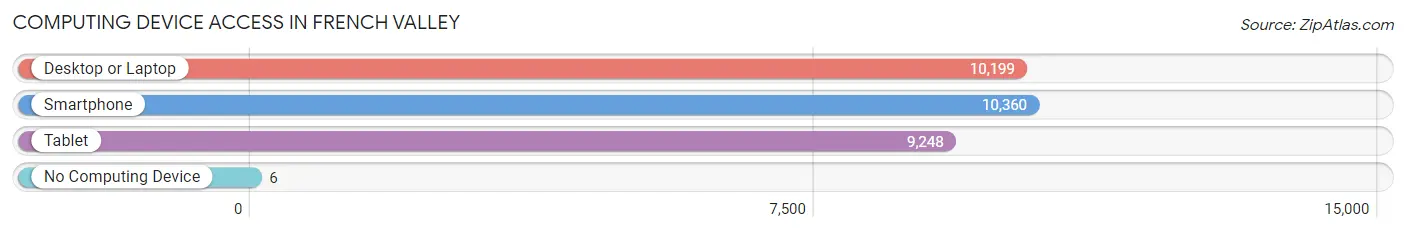
| Device Type | # Households | % Households |
| Desktop or Laptop | 10,199 | 95.3% |
| Smartphone | 10,360 | 96.9% |
| Tablet | 9,248 | 86.5% |
| No Computing Device | 6 | 0.1% |
| Total | 10,697 | 100.0% |
Internet Access in French Valley
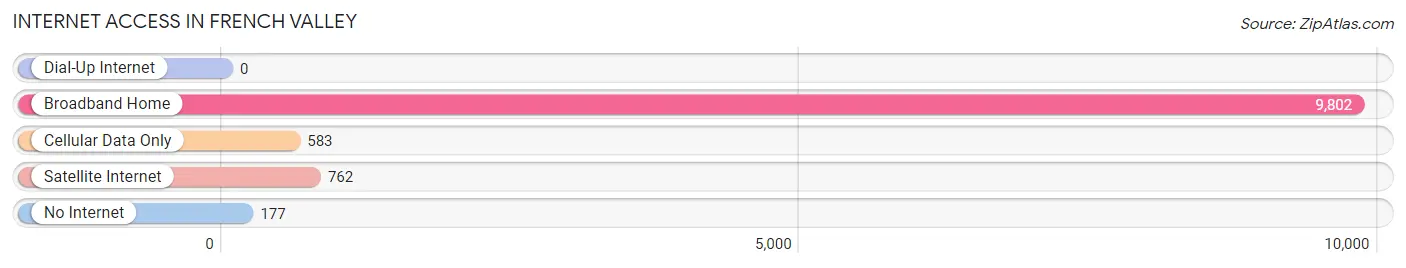
| Internet Type | # Households | % Households |
| Dial-Up Internet | 0 | 0.0% |
| Broadband Home | 9,802 | 91.6% |
| Cellular Data Only | 583 | 5.4% |
| Satellite Internet | 762 | 7.1% |
| No Internet | 177 | 1.7% |
| Total | 10,697 | 100.0% |
French Valley Summary
History
French Valley is a census-designated place located in Riverside County, California. It is situated in the Temecula Valley, and is part of the Temecula-Murrieta-Menifee Metropolitan Statistical Area. The area was first settled in the late 1800s by French settlers, who named the area after their homeland. The area was primarily used for farming and ranching until the 1950s, when the population began to grow.
Geography
French Valley is located in the Temecula Valley, which is part of the larger Inland Empire region of Southern California. The area is bordered by Murrieta to the north, Winchester to the east, and Temecula to the south. The area is characterized by rolling hills and valleys, with elevations ranging from 1,000 to 2,000 feet. The climate is mild, with temperatures ranging from the mid-50s to the mid-90s.
Economy
French Valley is primarily a residential area, with a few small businesses located in the area. The primary industries in the area are retail, healthcare, and education. The area is home to several large employers, including the Temecula Valley Unified School District, the French Valley Medical Center, and the Temecula Valley Hospital.
Demographics
As of the 2010 census, the population of French Valley was 25,716. The population is primarily white (77.3%), with smaller percentages of Hispanic (14.2%), African American (2.3%), and Asian (2.2%) residents. The median household income is $77,845, and the median age is 36. The area is primarily composed of married couples (60.2%), with a smaller percentage of single-parent households (14.2%).
Conclusion
French Valley is a census-designated place located in Riverside County, California. It is situated in the Temecula Valley, and is part of the Temecula-Murrieta-Menifee Metropolitan Statistical Area. The area was first settled in the late 1800s by French settlers, and has since grown to become a primarily residential area. The area is characterized by rolling hills and valleys, with mild temperatures and a diverse population. The primary industries in the area are retail, healthcare, and education, and the median household income is $77,845.
Common Questions
What is Per Capita Income in French Valley?
Per Capita income in French Valley is $38,369.
What is the Median Family Income in French Valley?
Median Family Income in French Valley is $125,746.
What is the Median Household income in French Valley?
Median Household Income in French Valley is $124,115.
What is Income or Wage Gap in French Valley?
Income or Wage Gap in French Valley is 48.3%.
Women in French Valley earn 51.7 cents for every dollar earned by a man.
What is Inequality or Gini Index in French Valley?
Inequality or Gini Index in French Valley is 0.33.
What is the Total Population of French Valley?
Total Population of French Valley is 41,239.
What is the Total Male Population of French Valley?
Total Male Population of French Valley is 20,281.
What is the Total Female Population of French Valley?
Total Female Population of French Valley is 20,958.
What is the Ratio of Males per 100 Females in French Valley?
There are 96.77 Males per 100 Females in French Valley.
What is the Ratio of Females per 100 Males in French Valley?
There are 103.34 Females per 100 Males in French Valley.
What is the Median Population Age in French Valley?
Median Population Age in French Valley is 33.8 Years.
What is the Average Family Size in French Valley
Average Family Size in French Valley is 3.9 People.
What is the Average Household Size in French Valley
Average Household Size in French Valley is 3.8 People.
How Large is the Labor Force in French Valley?
There are 18,402 People in the Labor Forcein in French Valley.
What is the Percentage of People in the Labor Force in French Valley?
62.7% of People are in the Labor Force in French Valley.
What is the Unemployment Rate in French Valley?
Unemployment Rate in French Valley is 7.7%.