Cities with the Lowest Poverty Level Among Seniors Over the Age of 75 in Wyoming

RELATED REPORTS & OPTIONS

Lowest Poverty | Seniors 75+
Population
Families and Households
Female Fertility
Female Fertility (Unmarried)
Race (Community Size)
Race (Percentage)
Ancestry (Community Size)
AfghanAfricanAlaska NativeAlaskan AthabascanAlbanianAleutAlsatianAmericanApacheArabArapahoArgentineanArmenianAssyrian / Chaldean / SyriacAustralianAustrianBahamianBangladeshiBarbadianBasqueBelgianBelizeanBermudanBhutaneseBlackfeetBolivianBrazilianBritishBritish West IndianBulgarianBurmeseCajunCambodianCanadianCape VerdeanCarpatho RusynCelticCentral AmericanCentral American IndianCherokeeCheyenneChickasawChileanChineseChippewaChoctawColombianColvilleComancheCosta RicanCreeCreekCroatianCrowCubanCypriotCzechCzechoslovakianDanishDelawareDominicanDutchDutch West IndianEastern EuropeanEcuadorianEgyptianEnglishEstonianEthiopianEuropeanFijianFilipinoFinnishFrenchFrench American IndianFrench CanadianGermanGerman RussianGhanaianGreekGuamanian / ChamorroGuatemalanGuyaneseHaitianHmongHonduranHopiHoumaHungarianIcelanderIndian (Asian)IndonesianInupiatIranianIraqiIrishIroquoisIsraeliItalianJamaicanJapaneseJordanianKenyanKiowaKoreanLaotianLatvianLebaneseLiberianLithuanianLumbeeLuxembourgerMacedonianMalaysianMalteseMarshalleseMenomineeMexicanMexican American IndianMongolianMoroccanNative HawaiianNavajoNepaleseNew ZealanderNicaraguanNigerianNorthern EuropeanNorwegianOkinawanOsageOttawaPaiutePakistaniPalestinianPanamanianParaguayanPennsylvania GermanPeruvianPimaPolishPortuguesePotawatomiPuebloPuerto RicanPuget Sound SalishRomanianRussianSalvadoranSamoanScandinavianScotch-IrishScottishSeminoleSenegaleseSerbianShoshoneSierra LeoneanSiouxSlavicSlovakSloveneSomaliSouth AfricanSouth AmericanSouth American IndianSoviet UnionSpaniardSpanishSpanish AmericanSpanish American IndianSri LankanSubsaharan AfricanSudaneseSwedishSwissSyrianTaiwaneseThaiTlingit-HaidaTohono O'OdhamTonganTrinidadian and TobagonianTsimshianTurkishU.S. Virgin IslanderUgandanUkrainianUruguayanUteVenezuelanVietnameseWelshWest IndianYakamaYaquiYugoslavianYumanYup'ikZimbabwean
Ancestry (Percentage)
AfghanAfricanAlaska NativeAlaskan AthabascanAlbanianAleutAlsatianAmericanApacheArabArapahoArgentineanArmenianAssyrian / Chaldean / SyriacAustralianAustrianBahamianBangladeshiBarbadianBasqueBelgianBelizeanBermudanBhutaneseBlackfeetBolivianBrazilianBritishBritish West IndianBulgarianBurmeseCajunCambodianCanadianCape VerdeanCarpatho RusynCelticCentral AmericanCentral American IndianCherokeeCheyenneChickasawChileanChineseChippewaChoctawColombianColvilleComancheCosta RicanCreeCreekCroatianCrowCubanCypriotCzechCzechoslovakianDanishDelawareDominicanDutchDutch West IndianEastern EuropeanEcuadorianEgyptianEnglishEstonianEthiopianEuropeanFijianFilipinoFinnishFrenchFrench American IndianFrench CanadianGermanGerman RussianGhanaianGreekGuamanian / ChamorroGuatemalanGuyaneseHaitianHmongHonduranHopiHoumaHungarianIcelanderIndian (Asian)IndonesianInupiatIranianIraqiIrishIroquoisIsraeliItalianJamaicanJapaneseJordanianKenyanKiowaKoreanLaotianLatvianLebaneseLiberianLithuanianLumbeeLuxembourgerMacedonianMalaysianMalteseMarshalleseMenomineeMexicanMexican American IndianMongolianMoroccanNative HawaiianNavajoNepaleseNew ZealanderNicaraguanNigerianNorthern EuropeanNorwegianOkinawanOsageOttawaPaiutePakistaniPalestinianPanamanianParaguayanPennsylvania GermanPeruvianPimaPolishPortuguesePotawatomiPuebloPuerto RicanPuget Sound SalishRomanianRussianSalvadoranSamoanScandinavianScotch-IrishScottishSeminoleSenegaleseSerbianShoshoneSierra LeoneanSiouxSlavicSlovakSloveneSomaliSouth AfricanSouth AmericanSouth American IndianSoviet UnionSpaniardSpanishSpanish AmericanSpanish American IndianSri LankanSubsaharan AfricanSudaneseSwedishSwissSyrianTaiwaneseThaiTlingit-HaidaTohono O'OdhamTonganTrinidadian and TobagonianTsimshianTurkishU.S. Virgin IslanderUgandanUkrainianUruguayanUteVenezuelanVietnameseWelshWest IndianYakamaYaquiYugoslavianYumanYup'ikZimbabwean
Immigrant Origin (Total)
AfghanistanAfricaAlbaniaArgentinaArmeniaAsiaAustraliaAustriaAzoresBahamasBangladeshBarbadosBelarusBelgiumBelizeBoliviaBosnia and HerzegovinaBrazilBulgariaBurma / MyanmarCabo VerdeCambodiaCameroonCanadaCaribbeanCentral AmericaChileChinaColombiaCongoCosta RicaCroatiaCubaCzechoslovakiaDenmarkDominicaDominican RepublicEastern AfricaEastern AsiaEastern EuropeEcuadorEgyptEl SalvadorEnglandEritreaEthiopiaEuropeFijiFranceGermanyGhanaGreeceGrenadaGuatemalaGuyanaHaitiHondurasHong KongHungaryIndiaIndonesiaIranIraqIrelandIsraelItalyJamaicaJapanJordanKazakhstanKenyaKoreaKuwaitLaosLatin AmericaLatviaLebanonLiberiaLithuaniaMalaysiaMexicoMicronesiaMiddle AfricaMoldovaMoroccoNepalNetherlandsNicaraguaNigeriaNorth MacedoniaNorthern AfricaNorthern EuropeNorwayOceaniaPakistanPanamaPeruPhilippinesPolandPortugalRomaniaRussiaSaudi ArabiaScotlandSenegalSerbiaSierra LeoneSingaporeSomaliaSouth AfricaSouth AmericaSouth Central AsiaSouth Eastern AsiaSouthern EuropeSpainSri LankaSt. Vincent and the GrenadinesSudanSwedenSwitzerlandSyriaTaiwanThailandTrinidad and TobagoTurkeyUgandaUkraineUruguayUzbekistanVenezuelaVietnamWest IndiesWestern AfricaWestern AsiaWestern EuropeYemenZaireZimbabwe
Immigrant Origin (Percentage)
AfghanistanAfricaAlbaniaArgentinaArmeniaAsiaAustraliaAustriaAzoresBahamasBangladeshBarbadosBelarusBelgiumBelizeBoliviaBosnia and HerzegovinaBrazilBulgariaBurma / MyanmarCabo VerdeCambodiaCameroonCanadaCaribbeanCentral AmericaChileChinaColombiaCongoCosta RicaCroatiaCubaCzechoslovakiaDenmarkDominicaDominican RepublicEastern AfricaEastern AsiaEastern EuropeEcuadorEgyptEl SalvadorEnglandEritreaEthiopiaEuropeFijiFranceGermanyGhanaGreeceGrenadaGuatemalaGuyanaHaitiHondurasHong KongHungaryIndiaIndonesiaIranIraqIrelandIsraelItalyJamaicaJapanJordanKazakhstanKenyaKoreaKuwaitLaosLatin AmericaLatviaLebanonLiberiaLithuaniaMalaysiaMexicoMicronesiaMiddle AfricaMoldovaMoroccoNepalNetherlandsNicaraguaNigeriaNorth MacedoniaNorthern AfricaNorthern EuropeNorwayOceaniaPakistanPanamaPeruPhilippinesPolandPortugalRomaniaRussiaSaudi ArabiaScotlandSenegalSerbiaSierra LeoneSingaporeSomaliaSouth AfricaSouth AmericaSouth Central AsiaSouth Eastern AsiaSouthern EuropeSpainSri LankaSt. Vincent and the GrenadinesSudanSwedenSwitzerlandSyriaTaiwanThailandTrinidad and TobagoTurkeyUgandaUkraineUruguayUzbekistanVenezuelaVietnamWest IndiesWestern AfricaWestern AsiaWestern EuropeYemenZaireZimbabwe
Income
Income (Families)
Income (Households)
Poverty
Poverty (Families)
Unemployment
Employment Occupations
Employment Industries
Employer Class
Commute Time
Commute Means
School Enrollment
Education by Degree Field
Occupancy
Finances
Physical Characteristics
Wyoming
Compare Cities
Comparison Subject

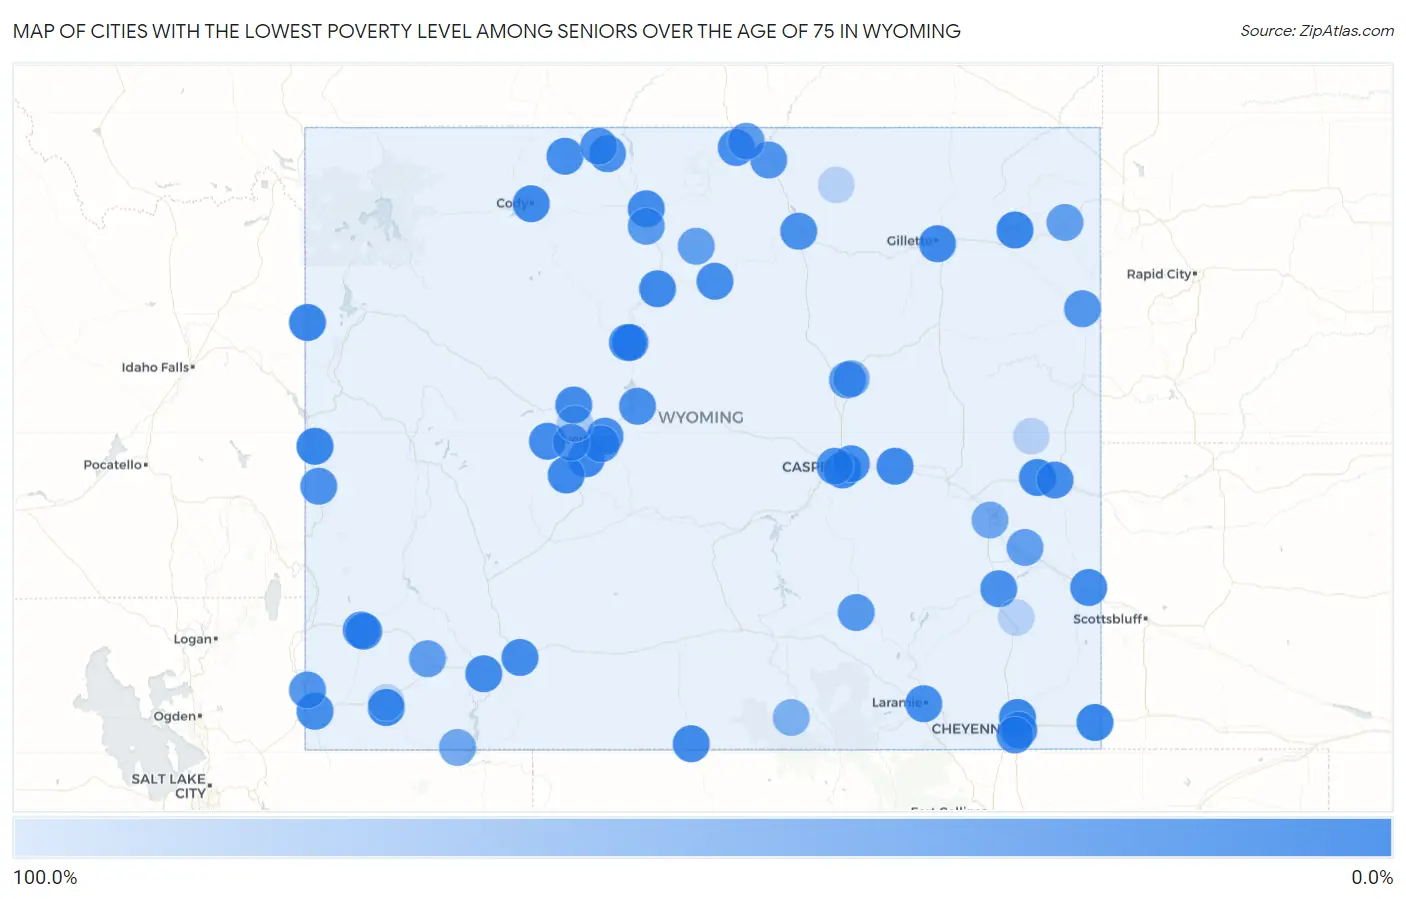
Map of Cities with the Lowest Poverty Level Among Seniors Over the Age of 75 in Wyoming

100.0%
0.0%
Cities with the Lowest Poverty Level Among Seniors Over the Age of 75 in Wyoming Map

Cities with the Lowest Poverty Level Among Seniors Over the Age of 75 in Wyoming

City Senior Poverty vs State vs National
1.Star Valley Ranch0.82%8.9%(-8.05)#111.1%(-10.2)#111
2.Alta1.7%8.9%(-7.18)#211.1%(-9.37)#382
3.Ranchettes2.0%8.9%(-6.89)#311.1%(-9.08)#511
4.Thermopolis2.7%8.9%(-6.19)#411.1%(-8.38)#983
5.Pine Bluffs2.9%8.9%(-6.00)#511.1%(-8.19)#1,146
6.Pine Haven3.1%8.9%(-5.75)#611.1%(-7.94)#1,349
7.Mountain View3.6%8.9%(-5.30)#711.1%(-7.50)#1,740
8.Hudson4.0%8.9%(-4.88)#811.1%(-7.07)#2,183
9.Manville5.0%8.9%(-3.88)#911.1%(-6.07)#3,226
10.Casper5.5%8.9%(-3.41)#1011.1%(-5.60)#3,659
11.Cheyenne5.8%8.9%(-3.05)#1111.1%(-5.24)#4,051
12.Cody6.3%8.9%(-2.60)#1211.1%(-4.79)#4,583
13.Lander6.6%8.9%(-2.27)#1311.1%(-4.46)#4,911
14.Worland7.2%8.9%(-1.70)#1411.1%(-3.89)#5,511
15.Glenrock7.3%8.9%(-1.55)#1511.1%(-3.74)#5,646
16.Baggs7.7%8.9%(-1.18)#1611.1%(-3.37)#6,000
17.Gillette8.0%8.9%(-0.850)#1711.1%(-3.04)#6,315
18.Fort Washakie8.3%8.9%(-0.542)#1811.1%(-2.73)#6,578
19.Greybull9.1%8.9%(+0.216)#1911.1%(-1.98)#7,301
20.Torrington9.2%8.9%(+0.300)#2011.1%(-1.89)#7,454
21.Rock Springs9.2%8.9%(+0.323)#2111.1%(-1.87)#7,470
22.Pavillion9.5%8.9%(+0.648)#2211.1%(-1.54)#7,773
23.Green River9.9%8.9%(+0.981)#2311.1%(-1.21)#8,067
24.Powell10.4%8.9%(+1.50)#2411.1%(-0.695)#8,560
25.Riverton10.6%8.9%(+1.68)#2511.1%(-0.511)#8,747
26.Ten Sleep10.8%8.9%(+1.94)#2611.1%(-0.256)#8,960
27.Dayton10.9%8.9%(+2.03)#2711.1%(-0.158)#9,040
28.Laramie10.9%8.9%(+2.04)#2811.1%(-0.156)#9,041
29.Evansville11.5%8.9%(+2.58)#2911.1%(+0.391)#9,531
30.Evanston11.5%8.9%(+2.65)#3011.1%(+0.460)#9,573
31.Kemmerer12.5%8.9%(+3.62)#3111.1%(+1.43)#10,288
32.Lusk12.6%8.9%(+3.74)#3211.1%(+1.55)#10,464
33.Shoshoni13.6%8.9%(+4.76)#3311.1%(+2.57)#11,236
34.Lovell13.9%8.9%(+5.05)#3411.1%(+2.86)#11,428
35.Arapahoe14.3%8.9%(+5.41)#3511.1%(+3.22)#11,627
36.Buffalo14.9%8.9%(+6.03)#3611.1%(+3.84)#12,096
37.Wheatland15.9%8.9%(+7.05)#3711.1%(+4.85)#12,637
38.Mills16.7%8.9%(+7.79)#3811.1%(+5.60)#12,973
39.La Grange16.7%8.9%(+7.79)#3911.1%(+5.60)#13,057
40.East Thermopolis17.0%8.9%(+8.15)#4011.1%(+5.95)#13,247
41.Afton17.3%8.9%(+8.40)#4111.1%(+6.21)#13,363
42.Cowley17.6%8.9%(+8.77)#4211.1%(+6.58)#13,519
43.South Greeley18.1%8.9%(+9.22)#4311.1%(+7.03)#13,720
44.Diamondville18.6%8.9%(+9.73)#4411.1%(+7.54)#13,980
45.Sheridan19.3%8.9%(+10.4)#4511.1%(+8.20)#14,257
46.Bear River20.0%8.9%(+11.1)#4611.1%(+8.93)#14,514
47.Newcastle21.5%8.9%(+12.6)#4711.1%(+10.5)#15,091
48.Ethete22.0%8.9%(+13.1)#4811.1%(+10.9)#15,240
49.Midwest22.2%8.9%(+13.3)#4911.1%(+11.2)#15,335
50.Medicine Bow25.4%8.9%(+16.5)#5011.1%(+14.3)#16,201
51.Basin26.8%8.9%(+17.9)#5111.1%(+15.7)#16,495
52.Granger31.6%8.9%(+22.7)#5211.1%(+20.5)#17,314
53.Ranchester32.1%8.9%(+23.3)#5311.1%(+21.1)#17,377
54.Hartville33.3%8.9%(+24.5)#5411.1%(+22.3)#17,632
55.Sundance34.3%8.9%(+25.4)#5511.1%(+23.2)#17,716
56.Hyattville34.3%8.9%(+25.4)#5611.1%(+23.2)#17,720
57.Washam43.5%8.9%(+34.6)#5711.1%(+32.4)#18,563
58.Glendo44.7%8.9%(+35.9)#5811.1%(+33.7)#18,636
59.Edgerton50.0%8.9%(+41.1)#5911.1%(+38.9)#18,985
60.Riverside55.6%8.9%(+46.7)#6011.1%(+44.5)#19,210
61.Johnstown90.0%8.9%(+81.1)#6111.1%(+78.9)#19,780
62.Urie100.0%8.9%(+91.1)#6211.1%(+88.9)#20,014
63.Clearmont100.0%8.9%(+91.1)#6311.1%(+88.9)#20,054
64.Slater100.0%8.9%(+91.1)#6411.1%(+88.9)#20,120
65.Lance Creek100.0%8.9%(+91.1)#6511.1%(+88.9)#20,131

Common Questions

What are the Top 10 Cities with the Lowest Poverty Level Among Seniors Over the Age of 75 in Wyoming?
Top 10 Cities with the Lowest Poverty Level Among Seniors Over the Age of 75 in Wyoming are:
What city has the Lowest Poverty Level Among Seniors Over the Age of 75 in Wyoming?
Star Valley Ranch has the Lowest Poverty Level Among Seniors Over the Age of 75 in Wyoming with 0.82%.
What is the Poverty Level Among Seniors Over the Age of 75 in the State of Wyoming?
Poverty Level Among Seniors Over the Age of 75 in Wyoming is 8.9%.
What is the Poverty Level Among Seniors Over the Age of 75 in the United States?
Poverty Level Among Seniors Over the Age of 75 in the United States is 11.1%.