Cities with the Lowest Poverty Level Among Seniors Over the Age of 75 in New Mexico
RELATED REPORTS & OPTIONS
Lowest Poverty | Seniors 75+
New Mexico
Compare Cities
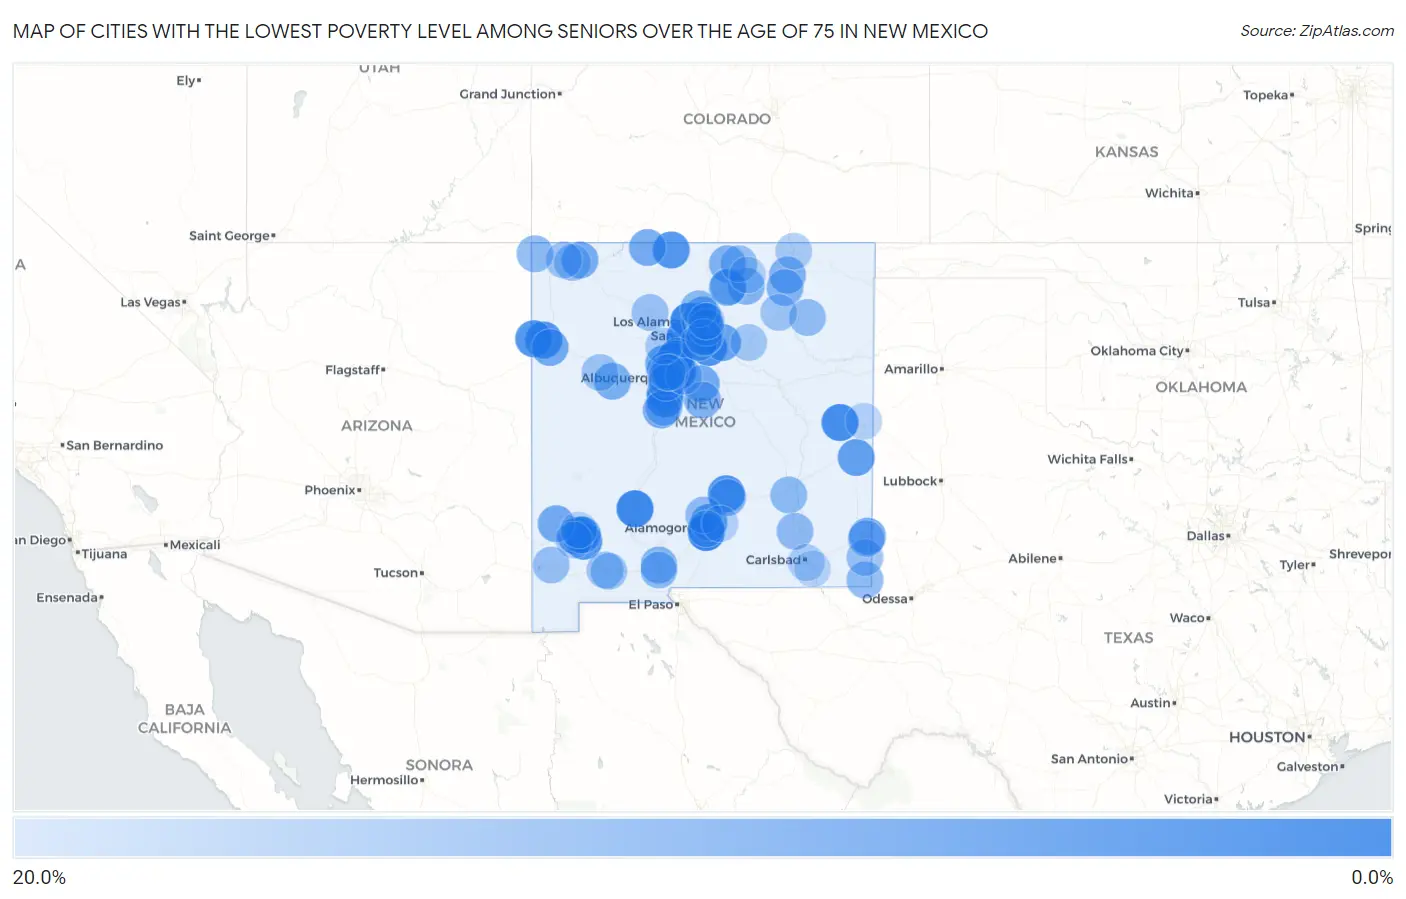
Map of Cities with the Lowest Poverty Level Among Seniors Over the Age of 75 in New Mexico
20.0%
0.0%
Cities with the Lowest Poverty Level Among Seniors Over the Age of 75 in New Mexico
| City | Senior Poverty | vs State | vs National | |
| 1. | Boles Acres | 0.83% | 13.3%(-12.4)#1 | 11.1%(-10.2)#112 |
| 2. | Sandia Heights | 1.6% | 13.3%(-11.7)#2 | 11.1%(-9.49)#327 |
| 3. | Cochiti Lake | 1.6% | 13.3%(-11.6)#3 | 11.1%(-9.43)#357 |
| 4. | Elephant Butte | 1.7% | 13.3%(-11.5)#4 | 11.1%(-9.32)#400 |
| 5. | Los Alamos | 1.8% | 13.3%(-11.4)#5 | 11.1%(-9.24)#436 |
| 6. | Las Campanas | 2.4% | 13.3%(-10.9)#6 | 11.1%(-8.65)#789 |
| 7. | El Rancho | 2.4% | 13.3%(-10.9)#7 | 11.1%(-8.65)#794 |
| 8. | Melrose | 2.4% | 13.3%(-10.8)#8 | 11.1%(-8.63)#809 |
| 9. | Corrales | 2.7% | 13.3%(-10.5)#9 | 11.1%(-8.35)#1,022 |
| 10. | Rock Springs | 3.6% | 13.3%(-9.67)#10 | 11.1%(-7.46)#1,781 |
| 11. | Eldorado At Santa Fe | 3.8% | 13.3%(-9.43)#11 | 11.1%(-7.23)#2,003 |
| 12. | El Cerro | 4.1% | 13.3%(-9.19)#12 | 11.1%(-6.99)#2,250 |
| 13. | Edith Enclave | 4.2% | 13.3%(-9.10)#13 | 11.1%(-6.90)#2,358 |
| 14. | Ruidoso | 4.2% | 13.3%(-9.02)#14 | 11.1%(-6.82)#2,426 |
| 15. | Hurley | 4.4% | 13.3%(-8.86)#15 | 11.1%(-6.66)#2,596 |
| 16. | Pojoaque | 4.4% | 13.3%(-8.83)#16 | 11.1%(-6.62)#2,627 |
| 17. | Tse Bonito | 4.4% | 13.3%(-8.83)#17 | 11.1%(-6.62)#2,638 |
| 18. | Chama | 4.6% | 13.3%(-8.67)#18 | 11.1%(-6.47)#2,806 |
| 19. | Little Walnut | 5.5% | 13.3%(-7.76)#19 | 11.1%(-5.56)#3,705 |
| 20. | Center Point | 5.7% | 13.3%(-7.60)#20 | 11.1%(-5.40)#3,902 |
| 21. | La Luz | 6.6% | 13.3%(-6.71)#21 | 11.1%(-4.51)#4,864 |
| 22. | Dora | 6.7% | 13.3%(-6.60)#22 | 11.1%(-4.40)#5,024 |
| 23. | Silver City | 6.8% | 13.3%(-6.49)#23 | 11.1%(-4.29)#5,096 |
| 24. | Bernalillo | 7.0% | 13.3%(-6.25)#24 | 11.1%(-4.05)#5,342 |
| 25. | Rio Rancho | 7.5% | 13.3%(-5.76)#25 | 11.1%(-3.56)#5,834 |
| 26. | Arenas Valley | 7.7% | 13.3%(-5.58)#26 | 11.1%(-3.37)#5,978 |
| 27. | Santa Clara | 7.7% | 13.3%(-5.54)#27 | 11.1%(-3.33)#6,055 |
| 28. | Pecos | 7.7% | 13.3%(-5.52)#28 | 11.1%(-3.32)#6,060 |
| 29. | Santa Fe | 7.8% | 13.3%(-5.46)#29 | 11.1%(-3.26)#6,101 |
| 30. | Algodones | 7.9% | 13.3%(-5.38)#30 | 11.1%(-3.17)#6,179 |
| 31. | Bosque Farms | 8.0% | 13.3%(-5.23)#31 | 11.1%(-3.03)#6,328 |
| 32. | North Hobbs | 8.4% | 13.3%(-4.86)#32 | 11.1%(-2.66)#6,705 |
| 33. | Santa Fe Foothills | 8.5% | 13.3%(-4.78)#33 | 11.1%(-2.58)#6,778 |
| 34. | Gallup | 9.0% | 13.3%(-4.23)#34 | 11.1%(-2.03)#7,270 |
| 35. | Thunder Mountain | 9.1% | 13.3%(-4.18)#35 | 11.1%(-1.98)#7,306 |
| 36. | Cliff | 9.1% | 13.3%(-4.18)#36 | 11.1%(-1.98)#7,385 |
| 37. | Dulce | 9.2% | 13.3%(-4.07)#37 | 11.1%(-1.87)#7,467 |
| 38. | Sombrillo | 9.3% | 13.3%(-3.97)#38 | 11.1%(-1.76)#7,563 |
| 39. | Moriarty | 9.4% | 13.3%(-3.90)#39 | 11.1%(-1.69)#7,616 |
| 40. | Pena Blanca | 9.5% | 13.3%(-3.75)#40 | 11.1%(-1.54)#7,757 |
| 41. | Jarales | 9.7% | 13.3%(-3.59)#41 | 11.1%(-1.39)#7,894 |
| 42. | Farmington | 9.8% | 13.3%(-3.52)#42 | 11.1%(-1.31)#7,978 |
| 43. | Paradise Hills | 9.9% | 13.3%(-3.40)#43 | 11.1%(-1.20)#8,075 |
| 44. | Skyline Ganipa | 10.0% | 13.3%(-3.27)#44 | 11.1%(-1.07)#8,168 |
| 45. | Ruidoso Downs | 10.5% | 13.3%(-2.74)#45 | 11.1%(-0.541)#8,682 |
| 46. | Questa | 10.7% | 13.3%(-2.60)#46 | 11.1%(-0.396)#8,833 |
| 47. | Maxwell | 10.7% | 13.3%(-2.56)#47 | 11.1%(-0.353)#8,874 |
| 48. | Estancia | 11.1% | 13.3%(-2.16)#48 | 11.1%(+0.044)#9,185 |
| 49. | Penasco | 11.1% | 13.3%(-2.16)#49 | 11.1%(+0.044)#9,215 |
| 50. | Angel Fire | 11.4% | 13.3%(-1.88)#50 | 11.1%(+0.325)#9,478 |
| 51. | Santa Ana Pueblo | 11.4% | 13.3%(-1.84)#51 | 11.1%(+0.362)#9,501 |
| 52. | La Cienega | 11.5% | 13.3%(-1.77)#52 | 11.1%(+0.438)#9,560 |
| 53. | Las Cruces | 11.6% | 13.3%(-1.69)#53 | 11.1%(+0.511)#9,615 |
| 54. | Springer | 11.6% | 13.3%(-1.64)#54 | 11.1%(+0.561)#9,653 |
| 55. | Tesuque Pueblo | 11.8% | 13.3%(-1.51)#55 | 11.1%(+0.698)#9,766 |
| 56. | Taos | 12.2% | 13.3%(-1.09)#56 | 11.1%(+1.11)#10,066 |
| 57. | Chamita | 12.2% | 13.3%(-1.07)#57 | 11.1%(+1.13)#10,088 |
| 58. | Albuquerque | 12.2% | 13.3%(-1.05)#58 | 11.1%(+1.15)#10,111 |
| 59. | Ranchos De Taos | 12.2% | 13.3%(-1.03)#59 | 11.1%(+1.17)#10,128 |
| 60. | Roswell | 12.3% | 13.3%(-0.930)#60 | 11.1%(+1.27)#10,194 |
| 61. | Mesilla | 12.4% | 13.3%(-0.822)#61 | 11.1%(+1.38)#10,261 |
| 62. | Jal | 12.5% | 13.3%(-0.770)#62 | 11.1%(+1.43)#10,290 |
| 63. | Beclabito | 12.5% | 13.3%(-0.770)#63 | 11.1%(+1.43)#10,381 |
| 64. | Artesia | 12.6% | 13.3%(-0.640)#64 | 11.1%(+1.56)#10,475 |
| 65. | Tularosa | 13.0% | 13.3%(-0.307)#65 | 11.1%(+1.90)#10,736 |
| 66. | Rio Communities | 13.2% | 13.3%(-0.065)#66 | 11.1%(+2.14)#10,911 |
| 67. | Roy | 13.3% | 13.3%(+0.063)#67 | 11.1%(+2.27)#11,040 |
| 68. | Dona Ana | 13.5% | 13.3%(+0.243)#68 | 11.1%(+2.45)#11,155 |
| 69. | Upper Fruitland | 13.8% | 13.3%(+0.523)#69 | 11.1%(+2.73)#11,348 |
| 70. | Eunice | 13.9% | 13.3%(+0.585)#70 | 11.1%(+2.79)#11,387 |
| 71. | Red River | 13.9% | 13.3%(+0.619)#71 | 11.1%(+2.82)#11,414 |
| 72. | Lordsburg | 14.0% | 13.3%(+0.720)#72 | 11.1%(+2.92)#11,465 |
| 73. | South Valley | 14.2% | 13.3%(+0.895)#73 | 11.1%(+3.10)#11,566 |
| 74. | Deming | 14.2% | 13.3%(+0.924)#74 | 11.1%(+3.13)#11,584 |
| 75. | Alamogordo | 14.2% | 13.3%(+0.943)#75 | 11.1%(+3.15)#11,593 |
| 76. | Cuba | 14.3% | 13.3%(+1.02)#76 | 11.1%(+3.22)#11,664 |
| 77. | Grants | 14.4% | 13.3%(+1.10)#77 | 11.1%(+3.30)#11,774 |
| 78. | Agua Fria | 14.6% | 13.3%(+1.32)#78 | 11.1%(+3.52)#11,879 |
| 79. | Ventura | 14.6% | 13.3%(+1.36)#79 | 11.1%(+3.57)#11,914 |
| 80. | South River | 14.7% | 13.3%(+1.44)#80 | 11.1%(+3.64)#11,965 |
| 81. | Cedar Crest | 14.8% | 13.3%(+1.48)#81 | 11.1%(+3.69)#11,998 |
| 82. | Wagon Mound | 14.9% | 13.3%(+1.59)#82 | 11.1%(+3.80)#12,074 |
| 83. | Hyde Park | 14.9% | 13.3%(+1.62)#83 | 11.1%(+3.83)#12,091 |
| 84. | Hobbs | 15.0% | 13.3%(+1.77)#84 | 11.1%(+3.97)#12,173 |
| 85. | Waterflow | 15.2% | 13.3%(+1.88)#85 | 11.1%(+4.08)#12,221 |
| 86. | Las Vegas | 15.5% | 13.3%(+2.18)#86 | 11.1%(+4.39)#12,397 |
| 87. | North Valley | 16.0% | 13.3%(+2.68)#87 | 11.1%(+4.89)#12,654 |
| 88. | Zia Pueblo | 16.0% | 13.3%(+2.73)#88 | 11.1%(+4.93)#12,678 |
| 89. | Raton | 16.1% | 13.3%(+2.83)#89 | 11.1%(+5.04)#12,743 |
| 90. | Los Ranchos De Albuquerque | 16.2% | 13.3%(+2.90)#90 | 11.1%(+5.11)#12,779 |
| 91. | Nambe | 16.2% | 13.3%(+2.92)#91 | 11.1%(+5.13)#12,786 |
| 92. | Carlsbad | 16.6% | 13.3%(+3.31)#92 | 11.1%(+5.52)#12,948 |
| 93. | Sunlit Hills | 16.9% | 13.3%(+3.58)#93 | 11.1%(+5.79)#13,180 |
| 94. | Tyrone | 17.1% | 13.3%(+3.87)#94 | 11.1%(+6.08)#13,304 |
| 95. | Eagle Nest | 17.2% | 13.3%(+3.97)#95 | 11.1%(+6.17)#13,354 |
| 96. | Cloudcroft | 17.6% | 13.3%(+4.38)#96 | 11.1%(+6.58)#13,514 |
| 97. | Clovis | 17.7% | 13.3%(+4.47)#97 | 11.1%(+6.68)#13,585 |
| 98. | Isleta | 17.9% | 13.3%(+4.68)#98 | 11.1%(+6.88)#13,672 |
| 99. | Pinos Altos | 18.1% | 13.3%(+4.79)#99 | 11.1%(+6.99)#13,707 |
| 100. | Loving | 18.3% | 13.3%(+5.00)#100 | 11.1%(+7.20)#13,849 |
Common Questions
What are the Top 10 Cities with the Lowest Poverty Level Among Seniors Over the Age of 75 in New Mexico?
Top 10 Cities with the Lowest Poverty Level Among Seniors Over the Age of 75 in New Mexico are:
#1
0.83%
#2
1.6%
#3
1.6%
#4
1.7%
#5
1.8%
#6
2.4%
#7
2.4%
#8
2.7%
#9
3.6%
#10
3.8%
What city has the Lowest Poverty Level Among Seniors Over the Age of 75 in New Mexico?
Boles Acres has the Lowest Poverty Level Among Seniors Over the Age of 75 in New Mexico with 0.83%.
What is the Poverty Level Among Seniors Over the Age of 75 in the State of New Mexico?
Poverty Level Among Seniors Over the Age of 75 in New Mexico is 13.3%.
What is the Poverty Level Among Seniors Over the Age of 75 in the United States?
Poverty Level Among Seniors Over the Age of 75 in the United States is 11.1%.