Cities with the Lowest Poverty Level Among Seniors Over the Age of 75 in New Hampshire

RELATED REPORTS & OPTIONS

Lowest Poverty | Seniors 75+
Population
Families and Households
Female Fertility
Female Fertility (Unmarried)
Race (Community Size)
Race (Percentage)
Ancestry (Community Size)
AfghanAfricanAlaska NativeAlaskan AthabascanAlbanianAleutAlsatianAmericanApacheArabArapahoArgentineanArmenianAssyrian / Chaldean / SyriacAustralianAustrianBahamianBangladeshiBarbadianBasqueBelgianBelizeanBermudanBhutaneseBlackfeetBolivianBrazilianBritishBritish West IndianBulgarianBurmeseCajunCambodianCanadianCape VerdeanCarpatho RusynCelticCentral AmericanCentral American IndianCherokeeCheyenneChickasawChileanChineseChippewaChoctawColombianColvilleComancheCosta RicanCreeCreekCroatianCrowCubanCypriotCzechCzechoslovakianDanishDelawareDominicanDutchDutch West IndianEastern EuropeanEcuadorianEgyptianEnglishEstonianEthiopianEuropeanFijianFilipinoFinnishFrenchFrench American IndianFrench CanadianGermanGerman RussianGhanaianGreekGuamanian / ChamorroGuatemalanGuyaneseHaitianHmongHonduranHopiHoumaHungarianIcelanderIndian (Asian)IndonesianInupiatIranianIraqiIrishIroquoisIsraeliItalianJamaicanJapaneseJordanianKenyanKiowaKoreanLaotianLatvianLebaneseLiberianLithuanianLumbeeLuxembourgerMacedonianMalaysianMalteseMarshalleseMenomineeMexicanMexican American IndianMongolianMoroccanNative HawaiianNavajoNepaleseNew ZealanderNicaraguanNigerianNorthern EuropeanNorwegianOkinawanOsageOttawaPaiutePakistaniPalestinianPanamanianParaguayanPennsylvania GermanPeruvianPimaPolishPortuguesePotawatomiPuebloPuerto RicanPuget Sound SalishRomanianRussianSalvadoranSamoanScandinavianScotch-IrishScottishSeminoleSenegaleseSerbianShoshoneSierra LeoneanSiouxSlavicSlovakSloveneSomaliSouth AfricanSouth AmericanSouth American IndianSoviet UnionSpaniardSpanishSpanish AmericanSpanish American IndianSri LankanSubsaharan AfricanSudaneseSwedishSwissSyrianTaiwaneseThaiTlingit-HaidaTohono O'OdhamTonganTrinidadian and TobagonianTsimshianTurkishU.S. Virgin IslanderUgandanUkrainianUruguayanUteVenezuelanVietnameseWelshWest IndianYakamaYaquiYugoslavianYumanYup'ikZimbabwean
Ancestry (Percentage)
AfghanAfricanAlaska NativeAlaskan AthabascanAlbanianAleutAlsatianAmericanApacheArabArapahoArgentineanArmenianAssyrian / Chaldean / SyriacAustralianAustrianBahamianBangladeshiBarbadianBasqueBelgianBelizeanBermudanBhutaneseBlackfeetBolivianBrazilianBritishBritish West IndianBulgarianBurmeseCajunCambodianCanadianCape VerdeanCarpatho RusynCelticCentral AmericanCentral American IndianCherokeeCheyenneChickasawChileanChineseChippewaChoctawColombianColvilleComancheCosta RicanCreeCreekCroatianCrowCubanCypriotCzechCzechoslovakianDanishDelawareDominicanDutchDutch West IndianEastern EuropeanEcuadorianEgyptianEnglishEstonianEthiopianEuropeanFijianFilipinoFinnishFrenchFrench American IndianFrench CanadianGermanGerman RussianGhanaianGreekGuamanian / ChamorroGuatemalanGuyaneseHaitianHmongHonduranHopiHoumaHungarianIcelanderIndian (Asian)IndonesianInupiatIranianIraqiIrishIroquoisIsraeliItalianJamaicanJapaneseJordanianKenyanKiowaKoreanLaotianLatvianLebaneseLiberianLithuanianLumbeeLuxembourgerMacedonianMalaysianMalteseMarshalleseMenomineeMexicanMexican American IndianMongolianMoroccanNative HawaiianNavajoNepaleseNew ZealanderNicaraguanNigerianNorthern EuropeanNorwegianOkinawanOsageOttawaPaiutePakistaniPalestinianPanamanianParaguayanPennsylvania GermanPeruvianPimaPolishPortuguesePotawatomiPuebloPuerto RicanPuget Sound SalishRomanianRussianSalvadoranSamoanScandinavianScotch-IrishScottishSeminoleSenegaleseSerbianShoshoneSierra LeoneanSiouxSlavicSlovakSloveneSomaliSouth AfricanSouth AmericanSouth American IndianSoviet UnionSpaniardSpanishSpanish AmericanSpanish American IndianSri LankanSubsaharan AfricanSudaneseSwedishSwissSyrianTaiwaneseThaiTlingit-HaidaTohono O'OdhamTonganTrinidadian and TobagonianTsimshianTurkishU.S. Virgin IslanderUgandanUkrainianUruguayanUteVenezuelanVietnameseWelshWest IndianYakamaYaquiYugoslavianYumanYup'ikZimbabwean
Immigrant Origin (Total)
AfghanistanAfricaAlbaniaArgentinaArmeniaAsiaAustraliaAustriaAzoresBahamasBangladeshBarbadosBelarusBelgiumBelizeBoliviaBosnia and HerzegovinaBrazilBulgariaBurma / MyanmarCabo VerdeCambodiaCameroonCanadaCaribbeanCentral AmericaChileChinaColombiaCongoCosta RicaCroatiaCubaCzechoslovakiaDenmarkDominicaDominican RepublicEastern AfricaEastern AsiaEastern EuropeEcuadorEgyptEl SalvadorEnglandEritreaEthiopiaEuropeFijiFranceGermanyGhanaGreeceGrenadaGuatemalaGuyanaHaitiHondurasHong KongHungaryIndiaIndonesiaIranIraqIrelandIsraelItalyJamaicaJapanJordanKazakhstanKenyaKoreaKuwaitLaosLatin AmericaLatviaLebanonLiberiaLithuaniaMalaysiaMexicoMicronesiaMiddle AfricaMoldovaMoroccoNepalNetherlandsNicaraguaNigeriaNorth MacedoniaNorthern AfricaNorthern EuropeNorwayOceaniaPakistanPanamaPeruPhilippinesPolandPortugalRomaniaRussiaSaudi ArabiaScotlandSenegalSerbiaSierra LeoneSingaporeSomaliaSouth AfricaSouth AmericaSouth Central AsiaSouth Eastern AsiaSouthern EuropeSpainSri LankaSt. Vincent and the GrenadinesSudanSwedenSwitzerlandSyriaTaiwanThailandTrinidad and TobagoTurkeyUgandaUkraineUruguayUzbekistanVenezuelaVietnamWest IndiesWestern AfricaWestern AsiaWestern EuropeYemenZaireZimbabwe
Immigrant Origin (Percentage)
AfghanistanAfricaAlbaniaArgentinaArmeniaAsiaAustraliaAustriaAzoresBahamasBangladeshBarbadosBelarusBelgiumBelizeBoliviaBosnia and HerzegovinaBrazilBulgariaBurma / MyanmarCabo VerdeCambodiaCameroonCanadaCaribbeanCentral AmericaChileChinaColombiaCongoCosta RicaCroatiaCubaCzechoslovakiaDenmarkDominicaDominican RepublicEastern AfricaEastern AsiaEastern EuropeEcuadorEgyptEl SalvadorEnglandEritreaEthiopiaEuropeFijiFranceGermanyGhanaGreeceGrenadaGuatemalaGuyanaHaitiHondurasHong KongHungaryIndiaIndonesiaIranIraqIrelandIsraelItalyJamaicaJapanJordanKazakhstanKenyaKoreaKuwaitLaosLatin AmericaLatviaLebanonLiberiaLithuaniaMalaysiaMexicoMicronesiaMiddle AfricaMoldovaMoroccoNepalNetherlandsNicaraguaNigeriaNorth MacedoniaNorthern AfricaNorthern EuropeNorwayOceaniaPakistanPanamaPeruPhilippinesPolandPortugalRomaniaRussiaSaudi ArabiaScotlandSenegalSerbiaSierra LeoneSingaporeSomaliaSouth AfricaSouth AmericaSouth Central AsiaSouth Eastern AsiaSouthern EuropeSpainSri LankaSt. Vincent and the GrenadinesSudanSwedenSwitzerlandSyriaTaiwanThailandTrinidad and TobagoTurkeyUgandaUkraineUruguayUzbekistanVenezuelaVietnamWest IndiesWestern AfricaWestern AsiaWestern EuropeYemenZaireZimbabwe
Income
Income (Families)
Income (Households)
Poverty
Poverty (Families)
Unemployment
Employment Occupations
Employment Industries
Employer Class
Commute Time
Commute Means
School Enrollment
Education by Degree Field
Occupancy
Finances
Physical Characteristics
New Hampshire
Compare Cities
Comparison Subject

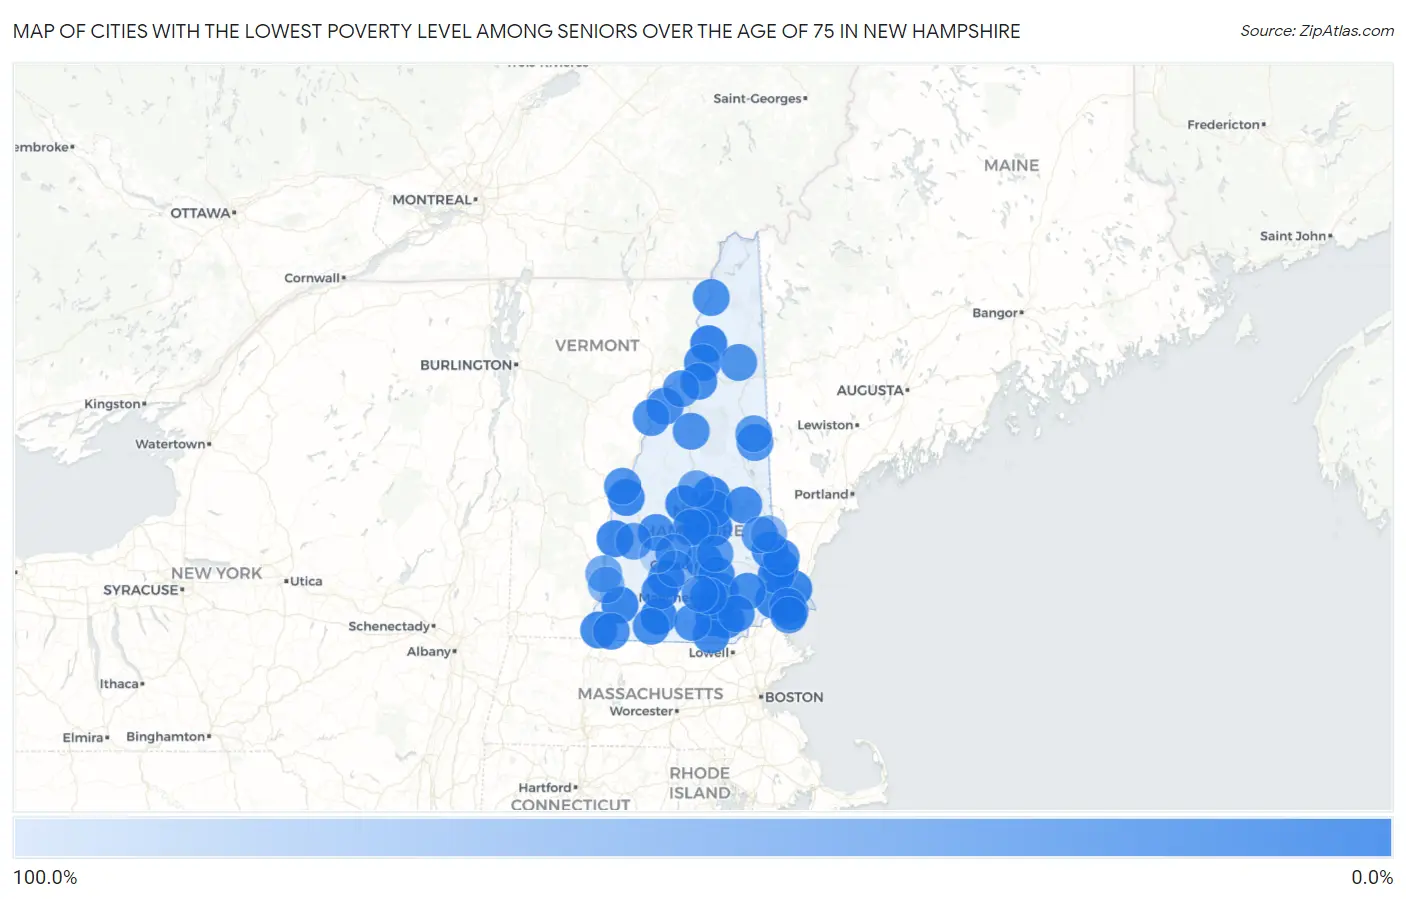
Map of Cities with the Lowest Poverty Level Among Seniors Over the Age of 75 in New Hampshire

100.0%
0.0%
Cities with the Lowest Poverty Level Among Seniors Over the Age of 75 in New Hampshire Map

Cities with the Lowest Poverty Level Among Seniors Over the Age of 75 in New Hampshire

City Senior Poverty vs State vs National
1.Peterborough2.4%8.3%(-5.89)#111.1%(-8.65)#791
2.Meredith2.7%8.3%(-5.59)#211.1%(-8.35)#1,020
3.Groveton3.2%8.3%(-5.14)#311.1%(-7.89)#1,387
4.Concord3.2%8.3%(-5.11)#411.1%(-7.86)#1,407
5.Keene3.4%8.3%(-4.92)#511.1%(-7.67)#1,596
6.Exeter3.8%8.3%(-4.49)#611.1%(-7.25)#1,988
7.Francestown4.3%8.3%(-4.06)#711.1%(-6.81)#2,445
8.Bristol4.6%8.3%(-3.74)#811.1%(-6.50)#2,772
9.Belmont5.0%8.3%(-3.31)#911.1%(-6.07)#3,194
10.Laconia5.3%8.3%(-3.04)#1011.1%(-5.80)#3,504
11.Portsmouth6.0%8.3%(-2.28)#1111.1%(-5.03)#4,295
12.Dover6.1%8.3%(-2.17)#1211.1%(-4.93)#4,411
13.East Merrimack6.3%8.3%(-2.03)#1311.1%(-4.78)#4,589
14.Durham6.5%8.3%(-1.77)#1411.1%(-4.52)#4,855
15.Tilton Northfield6.9%8.3%(-1.39)#1511.1%(-4.14)#5,260
16.Claremont7.1%8.3%(-1.24)#1611.1%(-4.00)#5,389
17.Hampton Beach7.3%8.3%(-0.977)#1711.1%(-3.73)#5,652
18.Lebanon7.8%8.3%(-0.560)#1811.1%(-3.31)#6,066
19.Londonderry8.1%8.3%(-0.227)#1911.1%(-2.98)#6,367
20.Hampton8.3%8.3%(+0.021)#2011.1%(-2.73)#6,567
21.South Hooksett8.7%8.3%(+0.383)#2111.1%(-2.37)#6,947
22.Hillsborough9.7%8.3%(+1.35)#2211.1%(-1.41)#7,883
23.Franklin9.8%8.3%(+1.45)#2311.1%(-1.31)#8,001
24.Nashua10.4%8.3%(+2.14)#2411.1%(-0.619)#8,626
25.Suncook10.5%8.3%(+2.17)#2511.1%(-0.580)#8,652
26.Manchester10.6%8.3%(+2.33)#2611.1%(-0.429)#8,808
27.Hinsdale10.7%8.3%(+2.43)#2711.1%(-0.326)#8,895
28.Lancaster10.8%8.3%(+2.52)#2811.1%(-0.234)#8,976
29.Rochester11.8%8.3%(+3.45)#2911.1%(+0.698)#9,744
30.Wolfeboro12.3%8.3%(+4.04)#3011.1%(+1.28)#10,202
31.Antrim12.6%8.3%(+4.32)#3111.1%(+1.56)#10,481
32.Whitefield12.8%8.3%(+4.45)#3211.1%(+1.70)#10,592
33.Raymond13.0%8.3%(+4.66)#3311.1%(+1.90)#10,747
34.Derry14.0%8.3%(+5.66)#3411.1%(+2.90)#11,453
35.Lisbon14.3%8.3%(+5.97)#3511.1%(+3.22)#11,646
36.Milford15.3%8.3%(+6.96)#3611.1%(+4.20)#12,290
37.New London16.2%8.3%(+7.88)#3711.1%(+5.13)#12,787
38.Pinardville16.3%8.3%(+7.97)#3811.1%(+5.22)#12,834
39.Warner16.7%8.3%(+8.35)#3911.1%(+5.60)#13,047
40.Winchester16.9%8.3%(+8.54)#4011.1%(+5.79)#13,177
41.Colebrook17.3%8.3%(+9.03)#4111.1%(+6.28)#13,394
42.Jaffrey17.7%8.3%(+9.40)#4211.1%(+6.64)#13,569
43.Somersworth18.3%8.3%(+9.95)#4311.1%(+7.20)#13,844
44.Woodsville18.8%8.3%(+10.5)#4411.1%(+7.74)#14,067
45.Lincoln19.3%8.3%(+11.0)#4511.1%(+8.20)#14,256
46.Hanover19.8%8.3%(+11.5)#4611.1%(+8.77)#14,459
47.Goffstown20.5%8.3%(+12.2)#4711.1%(+9.40)#14,763
48.Berlin21.5%8.3%(+13.2)#4811.1%(+10.4)#15,085
49.Conway22.8%8.3%(+14.5)#4911.1%(+11.7)#15,489
50.Seabrook Beach24.8%8.3%(+16.5)#5011.1%(+13.8)#15,989
51.Littleton26.2%8.3%(+17.9)#5111.1%(+15.1)#16,368
52.Farmington27.9%8.3%(+19.6)#5211.1%(+16.9)#16,733
53.Loudon28.7%8.3%(+20.4)#5311.1%(+17.7)#16,888
54.North Conway29.3%8.3%(+21.0)#5411.1%(+18.3)#16,959
55.Newport33.3%8.3%(+24.9)#5511.1%(+22.2)#17,470
56.Ashland40.0%8.3%(+31.7)#5611.1%(+28.9)#18,240
57.North Walpole43.5%8.3%(+35.2)#5711.1%(+32.4)#18,558
58.Walpole56.1%8.3%(+47.8)#5811.1%(+45.0)#19,223
59.Henniker57.9%8.3%(+49.6)#5911.1%(+46.8)#19,281
60.Milton60.0%8.3%(+51.7)#6011.1%(+48.9)#19,346
61.Bradford100.0%8.3%(+91.7)#6111.1%(+88.9)#19,901

Common Questions

What are the Top 10 Cities with the Lowest Poverty Level Among Seniors Over the Age of 75 in New Hampshire?
Top 10 Cities with the Lowest Poverty Level Among Seniors Over the Age of 75 in New Hampshire are:
#1
0.0%
#2
0.0%
#3
0.0%
#4
0.0%
#5
0.0%
#6
0.0%
#7
0.0%
#8
0.0%
#9
0.0%
#10
0.0%
What city has the Lowest Poverty Level Among Seniors Over the Age of 75 in New Hampshire?
Peterborough has the Lowest Poverty Level Among Seniors Over the Age of 75 in New Hampshire with 2.4%.
What is the Poverty Level Among Seniors Over the Age of 75 in the State of New Hampshire?
Poverty Level Among Seniors Over the Age of 75 in New Hampshire is 8.3%.
What is the Poverty Level Among Seniors Over the Age of 75 in the United States?
Poverty Level Among Seniors Over the Age of 75 in the United States is 11.1%.