Cities with the Lowest Poverty Level Among Seniors Over the Age of 75 in North Carolina
RELATED REPORTS & OPTIONS
Lowest Poverty | Seniors 75+
North Carolina
Compare Cities
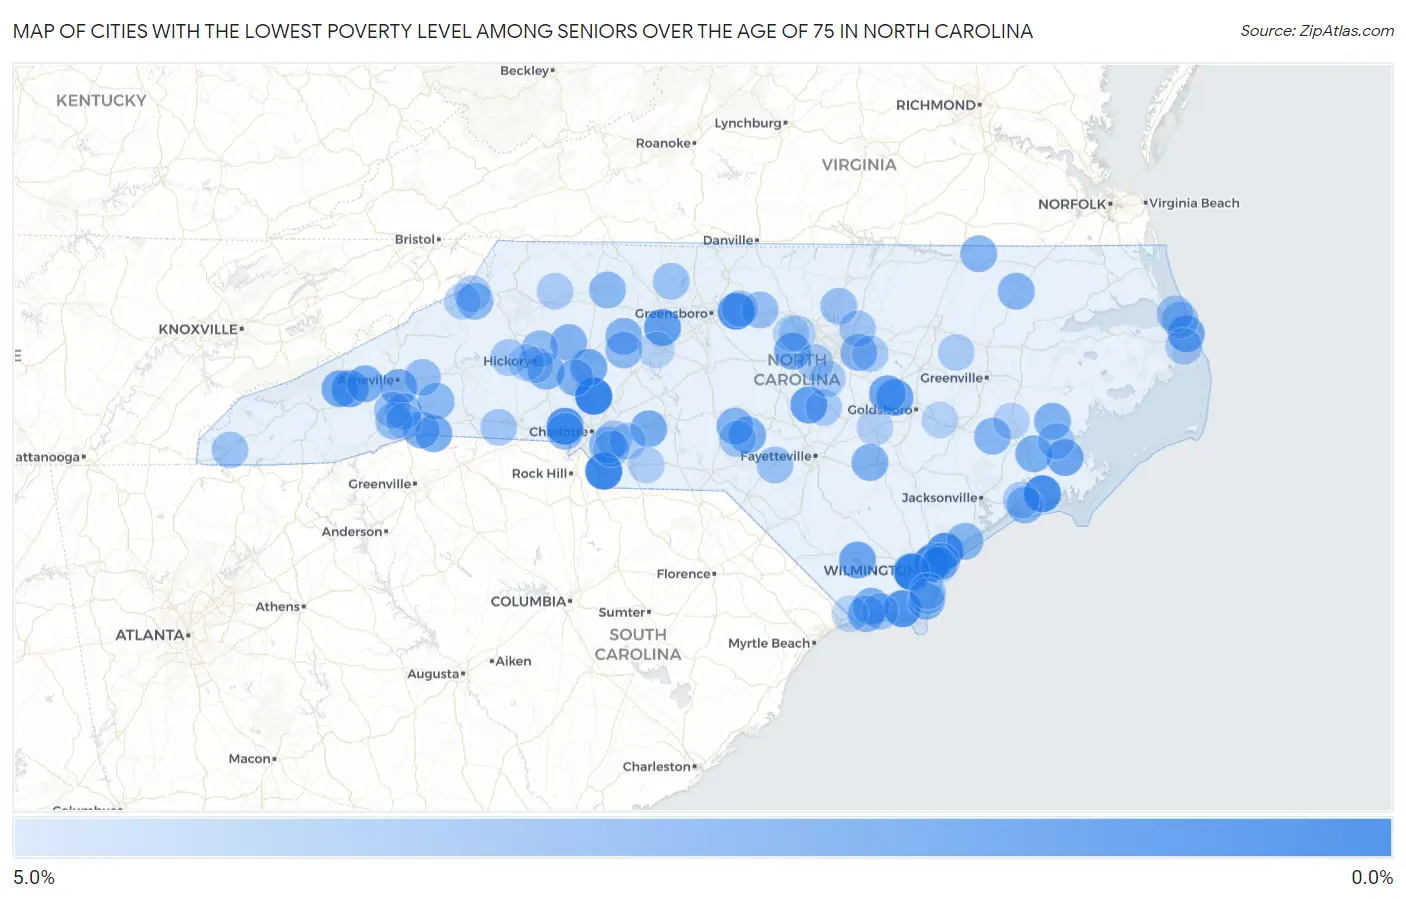
Map of Cities with the Lowest Poverty Level Among Seniors Over the Age of 75 in North Carolina
5.0%
0.0%
Cities with the Lowest Poverty Level Among Seniors Over the Age of 75 in North Carolina
| City | Senior Poverty | vs State | vs National | |
| 1. | Davidson | 0.10% | 11.2%(-11.1)#1 | 11.1%(-11.0)#3 |
| 2. | Waxhaw | 0.34% | 11.2%(-10.9)#2 | 11.1%(-10.7)#31 |
| 3. | Belville | 0.65% | 11.2%(-10.6)#3 | 11.1%(-10.4)#77 |
| 4. | Newport | 0.75% | 11.2%(-10.5)#4 | 11.1%(-10.3)#94 |
| 5. | Hampstead | 1.1% | 11.2%(-10.1)#5 | 11.1%(-9.96)#160 |
| 6. | St James | 1.1% | 11.2%(-10.1)#6 | 11.1%(-9.92)#173 |
| 7. | Mcadenville | 1.2% | 11.2%(-9.97)#7 | 11.1%(-9.83)#195 |
| 8. | Whitsett | 1.3% | 11.2%(-9.95)#8 | 11.1%(-9.82)#202 |
| 9. | Brandywine Bay | 1.6% | 11.2%(-9.63)#9 | 11.1%(-9.49)#325 |
| 10. | Midway | 1.8% | 11.2%(-9.45)#10 | 11.1%(-9.31)#404 |
| 11. | Mamers | 1.8% | 11.2%(-9.42)#11 | 11.1%(-9.28)#418 |
| 12. | Lake Junaluska | 2.1% | 11.2%(-9.10)#12 | 11.1%(-8.97)#592 |
| 13. | Princeton | 2.1% | 11.2%(-9.07)#13 | 11.1%(-8.94)#601 |
| 14. | Alexis | 2.2% | 11.2%(-9.00)#14 | 11.1%(-8.86)#657 |
| 15. | Lake Waccamaw | 2.3% | 11.2%(-8.95)#15 | 11.1%(-8.81)#687 |
| 16. | Oriental | 2.3% | 11.2%(-8.95)#16 | 11.1%(-8.81)#691 |
| 17. | Murraysville | 2.3% | 11.2%(-8.93)#17 | 11.1%(-8.79)#711 |
| 18. | Nags Head | 2.3% | 11.2%(-8.88)#18 | 11.1%(-8.74)#734 |
| 19. | Pine Level | 2.4% | 11.2%(-8.79)#19 | 11.1%(-8.66)#783 |
| 20. | Troutman | 2.4% | 11.2%(-8.79)#20 | 11.1%(-8.65)#788 |
| 21. | Maggie Valley | 2.4% | 11.2%(-8.76)#21 | 11.1%(-8.63)#803 |
| 22. | Fearrington Village | 2.6% | 11.2%(-8.63)#22 | 11.1%(-8.50)#906 |
| 23. | Tryon | 2.6% | 11.2%(-8.61)#23 | 11.1%(-8.48)#920 |
| 24. | Oakboro | 2.6% | 11.2%(-8.57)#24 | 11.1%(-8.44)#951 |
| 25. | Biltmore Forest | 2.7% | 11.2%(-8.55)#25 | 11.1%(-8.41)#969 |
| 26. | Pinehurst | 2.7% | 11.2%(-8.49)#26 | 11.1%(-8.36)#1,010 |
| 27. | Fairfield Harbour | 2.8% | 11.2%(-8.44)#27 | 11.1%(-8.30)#1,056 |
| 28. | Canton | 2.8% | 11.2%(-8.43)#28 | 11.1%(-8.30)#1,057 |
| 29. | Kings Grant | 2.8% | 11.2%(-8.39)#29 | 11.1%(-8.25)#1,094 |
| 30. | Shallotte | 2.9% | 11.2%(-8.32)#30 | 11.1%(-8.19)#1,147 |
| 31. | Newton | 2.9% | 11.2%(-8.27)#31 | 11.1%(-8.14)#1,179 |
| 32. | Bonnetsville | 2.9% | 11.2%(-8.26)#32 | 11.1%(-8.13)#1,187 |
| 33. | Aurora | 2.9% | 11.2%(-8.26)#33 | 11.1%(-8.13)#1,196 |
| 34. | Saluda | 3.0% | 11.2%(-8.22)#34 | 11.1%(-8.08)#1,230 |
| 35. | Kure Beach | 3.0% | 11.2%(-8.15)#35 | 11.1%(-8.02)#1,284 |
| 36. | Stony Point | 3.1% | 11.2%(-8.15)#36 | 11.1%(-8.01)#1,288 |
| 37. | Seven Lakes | 3.1% | 11.2%(-8.11)#37 | 11.1%(-7.98)#1,314 |
| 38. | Mocksville | 3.1% | 11.2%(-8.10)#38 | 11.1%(-7.96)#1,325 |
| 39. | Knightdale | 3.1% | 11.2%(-8.07)#39 | 11.1%(-7.94)#1,357 |
| 40. | Lake Norman Of Catawba | 3.1% | 11.2%(-8.06)#40 | 11.1%(-7.93)#1,361 |
| 41. | Ocean Isle Beach | 3.2% | 11.2%(-8.04)#41 | 11.1%(-7.90)#1,377 |
| 42. | Aulander | 3.2% | 11.2%(-8.01)#42 | 11.1%(-7.88)#1,399 |
| 43. | Cove City | 3.2% | 11.2%(-7.98)#43 | 11.1%(-7.84)#1,432 |
| 44. | Seaboard | 3.2% | 11.2%(-7.98)#44 | 11.1%(-7.84)#1,433 |
| 45. | Surf City | 3.3% | 11.2%(-7.93)#45 | 11.1%(-7.80)#1,475 |
| 46. | Porters Neck | 3.3% | 11.2%(-7.89)#46 | 11.1%(-7.75)#1,510 |
| 47. | Banner Elk | 3.3% | 11.2%(-7.87)#47 | 11.1%(-7.73)#1,518 |
| 48. | Leland | 3.3% | 11.2%(-7.85)#48 | 11.1%(-7.72)#1,543 |
| 49. | Boonville | 3.3% | 11.2%(-7.85)#49 | 11.1%(-7.72)#1,548 |
| 50. | Bogue | 3.4% | 11.2%(-7.83)#50 | 11.1%(-7.70)#1,565 |
| 51. | Cramerton | 3.4% | 11.2%(-7.83)#51 | 11.1%(-7.69)#1,571 |
| 52. | Lake Lure | 3.4% | 11.2%(-7.83)#52 | 11.1%(-7.69)#1,573 |
| 53. | Matthews | 3.4% | 11.2%(-7.83)#53 | 11.1%(-7.69)#1,574 |
| 54. | Mountain Home | 3.6% | 11.2%(-7.63)#54 | 11.1%(-7.50)#1,734 |
| 55. | Cooleemee | 3.6% | 11.2%(-7.63)#55 | 11.1%(-7.50)#1,744 |
| 56. | Bethlehem | 3.6% | 11.2%(-7.57)#56 | 11.1%(-7.43)#1,804 |
| 57. | Black Mountain | 3.7% | 11.2%(-7.47)#57 | 11.1%(-7.33)#1,903 |
| 58. | Haw River | 3.8% | 11.2%(-7.44)#58 | 11.1%(-7.31)#1,922 |
| 59. | Etowah | 3.8% | 11.2%(-7.44)#59 | 11.1%(-7.30)#1,928 |
| 60. | Creedmoor | 3.9% | 11.2%(-7.31)#60 | 11.1%(-7.17)#2,065 |
| 61. | Mills River | 3.9% | 11.2%(-7.30)#61 | 11.1%(-7.17)#2,080 |
| 62. | Kill Devil Hills | 3.9% | 11.2%(-7.26)#62 | 11.1%(-7.12)#2,115 |
| 63. | Raeford | 4.0% | 11.2%(-7.24)#63 | 11.1%(-7.11)#2,135 |
| 64. | Murphy | 4.0% | 11.2%(-7.17)#64 | 11.1%(-7.04)#2,200 |
| 65. | Walnut Cove | 4.1% | 11.2%(-7.15)#65 | 11.1%(-7.01)#2,228 |
| 66. | Kitty Hawk | 4.1% | 11.2%(-7.07)#66 | 11.1%(-6.94)#2,301 |
| 67. | Wake Forest | 4.2% | 11.2%(-7.05)#67 | 11.1%(-6.91)#2,316 |
| 68. | Mint Hill | 4.2% | 11.2%(-7.04)#68 | 11.1%(-6.90)#2,321 |
| 69. | Foxfire | 4.2% | 11.2%(-7.04)#69 | 11.1%(-6.90)#2,334 |
| 70. | Boiling Springs | 4.2% | 11.2%(-7.02)#70 | 11.1%(-6.89)#2,371 |
| 71. | Apex | 4.2% | 11.2%(-6.99)#71 | 11.1%(-6.86)#2,394 |
| 72. | Bayboro | 4.2% | 11.2%(-6.98)#72 | 11.1%(-6.84)#2,404 |
| 73. | Holden Beach | 4.3% | 11.2%(-6.91)#73 | 11.1%(-6.77)#2,472 |
| 74. | Valdese | 4.3% | 11.2%(-6.87)#74 | 11.1%(-6.74)#2,498 |
| 75. | Gibsonville | 4.3% | 11.2%(-6.85)#75 | 11.1%(-6.72)#2,508 |
| 76. | Brookford | 4.3% | 11.2%(-6.85)#76 | 11.1%(-6.72)#2,535 |
| 77. | Wanchese | 4.4% | 11.2%(-6.81)#77 | 11.1%(-6.67)#2,582 |
| 78. | Fairview | 4.4% | 11.2%(-6.78)#78 | 11.1%(-6.65)#2,604 |
| 79. | Wendell | 4.5% | 11.2%(-6.70)#79 | 11.1%(-6.56)#2,681 |
| 80. | Beech Mountain | 4.5% | 11.2%(-6.69)#80 | 11.1%(-6.56)#2,695 |
| 81. | Lillington | 4.5% | 11.2%(-6.66)#81 | 11.1%(-6.52)#2,720 |
| 82. | Peletier | 4.5% | 11.2%(-6.66)#82 | 11.1%(-6.52)#2,736 |
| 83. | Fuquay Varina | 4.6% | 11.2%(-6.62)#83 | 11.1%(-6.48)#2,781 |
| 84. | Mulberry | 4.6% | 11.2%(-6.61)#84 | 11.1%(-6.48)#2,786 |
| 85. | Pinetops | 4.6% | 11.2%(-6.60)#85 | 11.1%(-6.47)#2,803 |
| 86. | Marshville | 4.8% | 11.2%(-6.44)#86 | 11.1%(-6.31)#2,930 |
| 87. | Elk Park | 4.8% | 11.2%(-6.44)#87 | 11.1%(-6.31)#2,950 |
| 88. | Stallings | 4.8% | 11.2%(-6.43)#88 | 11.1%(-6.29)#2,978 |
| 89. | Vanceboro | 4.8% | 11.2%(-6.40)#89 | 11.1%(-6.27)#2,998 |
| 90. | Newton Grove | 4.8% | 11.2%(-6.39)#90 | 11.1%(-6.26)#3,003 |
| 91. | La Grange | 4.9% | 11.2%(-6.32)#91 | 11.1%(-6.19)#3,063 |
| 92. | Carolina Beach | 4.9% | 11.2%(-6.32)#92 | 11.1%(-6.18)#3,080 |
| 93. | Chapel Hill | 4.9% | 11.2%(-6.29)#93 | 11.1%(-6.15)#3,102 |
| 94. | Carolina Shores | 4.9% | 11.2%(-6.26)#94 | 11.1%(-6.12)#3,141 |
| 95. | Carrboro | 5.0% | 11.2%(-6.25)#95 | 11.1%(-6.12)#3,149 |
| 96. | Ogden | 5.0% | 11.2%(-6.24)#96 | 11.1%(-6.11)#3,154 |
| 97. | Sea Breeze | 5.0% | 11.2%(-6.24)#97 | 11.1%(-6.11)#3,161 |
| 98. | Hildebran | 5.0% | 11.2%(-6.23)#98 | 11.1%(-6.10)#3,166 |
| 99. | Valley Hill | 5.0% | 11.2%(-6.22)#99 | 11.1%(-6.08)#3,177 |
| 100. | Lexington | 5.0% | 11.2%(-6.20)#100 | 11.1%(-6.07)#3,183 |
Common Questions
What are the Top 10 Cities with the Lowest Poverty Level Among Seniors Over the Age of 75 in North Carolina?
Top 10 Cities with the Lowest Poverty Level Among Seniors Over the Age of 75 in North Carolina are:
What city has the Lowest Poverty Level Among Seniors Over the Age of 75 in North Carolina?
Davidson has the Lowest Poverty Level Among Seniors Over the Age of 75 in North Carolina with 0.10%.
What is the Poverty Level Among Seniors Over the Age of 75 in the State of North Carolina?
Poverty Level Among Seniors Over the Age of 75 in North Carolina is 11.2%.
What is the Poverty Level Among Seniors Over the Age of 75 in the United States?
Poverty Level Among Seniors Over the Age of 75 in the United States is 11.1%.