Home Gardens, CA Map & Demographics
Home Gardens Map
Home Gardens Overview
$27,763
PER CAPITA INCOME
$84,207
AVG FAMILY INCOME
$88,125
AVG HOUSEHOLD INCOME
24.8%
WAGE / INCOME GAP [ % ]
75.2¢/ $1
WAGE / INCOME GAP [ $ ]
$12,162
FAMILY INCOME DEFICIT
0.40
INEQUALITY / GINI INDEX
12,278
TOTAL POPULATION
6,143
MALE POPULATION
6,135
FEMALE POPULATION
100.13
MALES / 100 FEMALES
99.87
FEMALES / 100 MALES
35.2
MEDIAN AGE
4.3
AVG FAMILY SIZE
4.1
AVG HOUSEHOLD SIZE
5,805
LABOR FORCE [ PEOPLE ]
61.4%
PERCENT IN LABOR FORCE
4.1%
UNEMPLOYMENT RATE
Income in Home Gardens
Income Overview in Home Gardens
Per Capita Income in Home Gardens is $27,763, while median incomes of families and households are $84,207 and $88,125 respectively.
| Characteristic | Number | Measure |
| Per Capita Income | 12,278 | $27,763 |
| Median Family Income | 2,566 | $84,207 |
| Mean Family Income | 2,566 | $103,554 |
| Median Household Income | 2,986 | $88,125 |
| Mean Household Income | 2,986 | $103,744 |
| Income Deficit | 2,566 | $12,162 |
| Wage / Income Gap (%) | 12,278 | 24.75% |
| Wage / Income Gap ($) | 12,278 | 75.25¢ per $1 |
| Gini / Inequality Index | 12,278 | 0.40 |
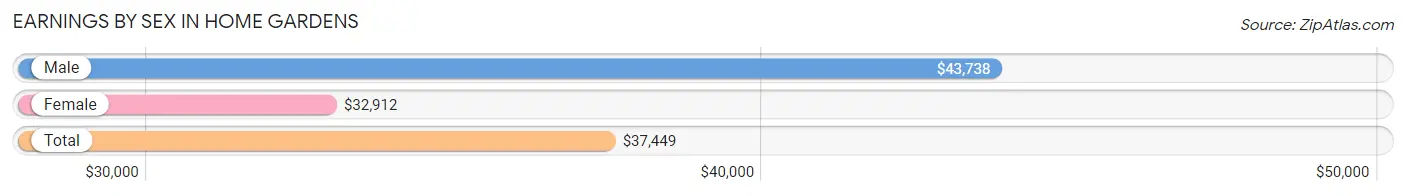
Earnings by Sex in Home Gardens
Average Earnings in Home Gardens are $37,449, $43,738 for men and $32,912 for women, a difference of 24.7%.
| Sex | Number | Average Earnings |
| Male | 3,652 (61.1%) | $43,738 |
| Female | 2,324 (38.9%) | $32,912 |
| Total | 5,976 (100.0%) | $37,449 |
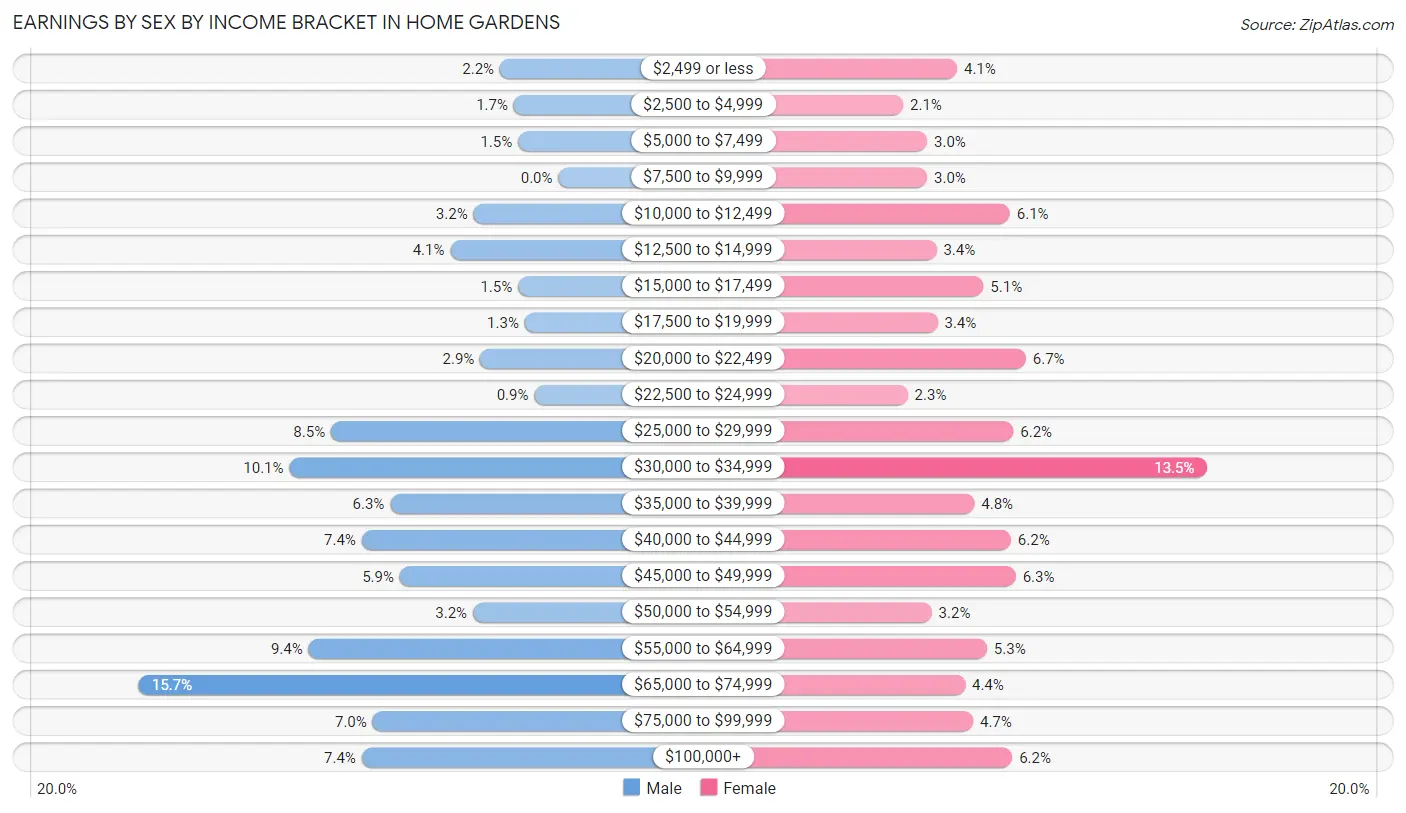
Earnings by Sex by Income Bracket in Home Gardens
The most common earnings brackets in Home Gardens are $65,000 to $74,999 for men (574 | 15.7%) and $30,000 to $34,999 for women (313 | 13.5%).
| Income | Male | Female |
| $2,499 or less | 80 (2.2%) | 96 (4.1%) |
| $2,500 to $4,999 | 61 (1.7%) | 49 (2.1%) |
| $5,000 to $7,499 | 55 (1.5%) | 70 (3.0%) |
| $7,500 to $9,999 | 0 (0.0%) | 70 (3.0%) |
| $10,000 to $12,499 | 116 (3.2%) | 142 (6.1%) |
| $12,500 to $14,999 | 148 (4.1%) | 78 (3.4%) |
| $15,000 to $17,499 | 55 (1.5%) | 119 (5.1%) |
| $17,500 to $19,999 | 46 (1.3%) | 79 (3.4%) |
| $20,000 to $22,499 | 107 (2.9%) | 156 (6.7%) |
| $22,500 to $24,999 | 33 (0.9%) | 53 (2.3%) |
| $25,000 to $29,999 | 311 (8.5%) | 145 (6.2%) |
| $30,000 to $34,999 | 368 (10.1%) | 313 (13.5%) |
| $35,000 to $39,999 | 230 (6.3%) | 111 (4.8%) |
| $40,000 to $44,999 | 269 (7.4%) | 143 (6.1%) |
| $45,000 to $49,999 | 217 (5.9%) | 147 (6.3%) |
| $50,000 to $54,999 | 117 (3.2%) | 74 (3.2%) |
| $55,000 to $64,999 | 342 (9.4%) | 122 (5.2%) |
| $65,000 to $74,999 | 574 (15.7%) | 103 (4.4%) |
| $75,000 to $99,999 | 254 (7.0%) | 110 (4.7%) |
| $100,000+ | 269 (7.4%) | 144 (6.2%) |
| Total | 3,652 (100.0%) | 2,324 (100.0%) |
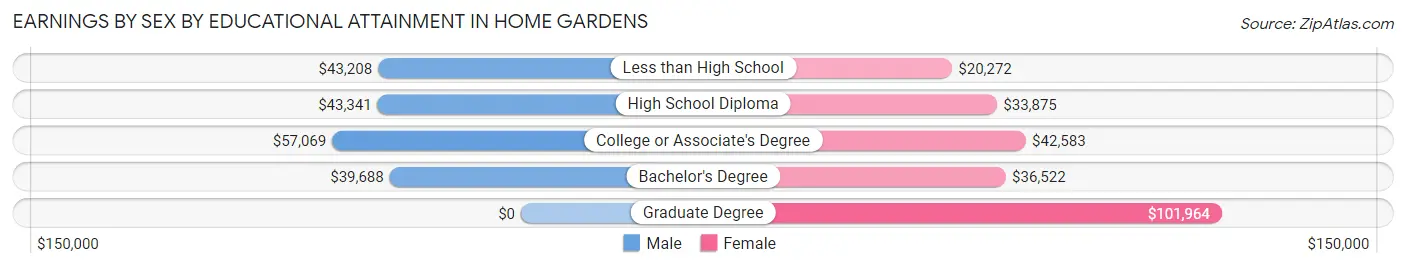
Earnings by Sex by Educational Attainment in Home Gardens
Average earnings in Home Gardens are $47,344 for men and $34,880 for women, a difference of 26.3%. Men with an educational attainment of college or associate's degree enjoy the highest average annual earnings of $57,069, while those with bachelor's degree education earn the least with $39,688. Women with an educational attainment of graduate degree earn the most with the average annual earnings of $101,964, while those with less than high school education have the smallest earnings of $20,272.
| Educational Attainment | Male Income | Female Income |
| Less than High School | $43,208 | $20,272 |
| High School Diploma | $43,341 | $33,875 |
| College or Associate's Degree | $57,069 | $42,583 |
| Bachelor's Degree | $39,688 | $36,522 |
| Graduate Degree | - | - |
| Total | $47,344 | $34,880 |
Family Income in Home Gardens
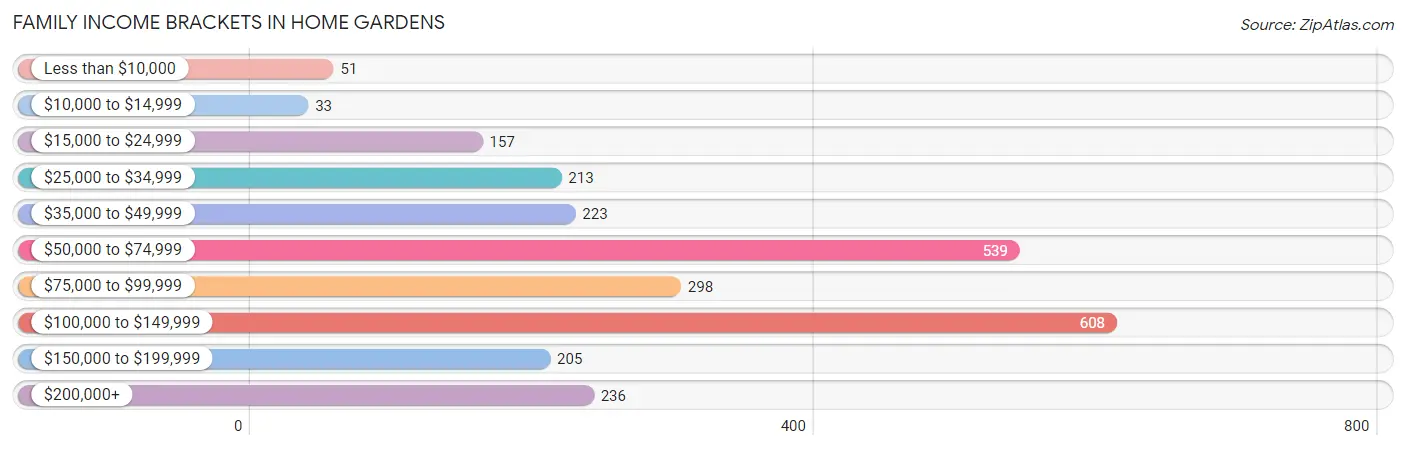
Family Income Brackets in Home Gardens
According to the Home Gardens family income data, there are 608 families falling into the $100,000 to $149,999 income range, which is the most common income bracket and makes up 23.7% of all families. Conversely, the $10,000 to $14,999 income bracket is the least frequent group with only 33 families (1.3%) belonging to this category.
| Income Bracket | # Families | % Families |
| Less than $10,000 | 51 | 2.0% |
| $10,000 to $14,999 | 33 | 1.3% |
| $15,000 to $24,999 | 157 | 6.1% |
| $25,000 to $34,999 | 213 | 8.3% |
| $35,000 to $49,999 | 223 | 8.7% |
| $50,000 to $74,999 | 539 | 21.0% |
| $75,000 to $99,999 | 298 | 11.6% |
| $100,000 to $149,999 | 608 | 23.7% |
| $150,000 to $199,999 | 205 | 8.0% |
| $200,000+ | 236 | 9.2% |
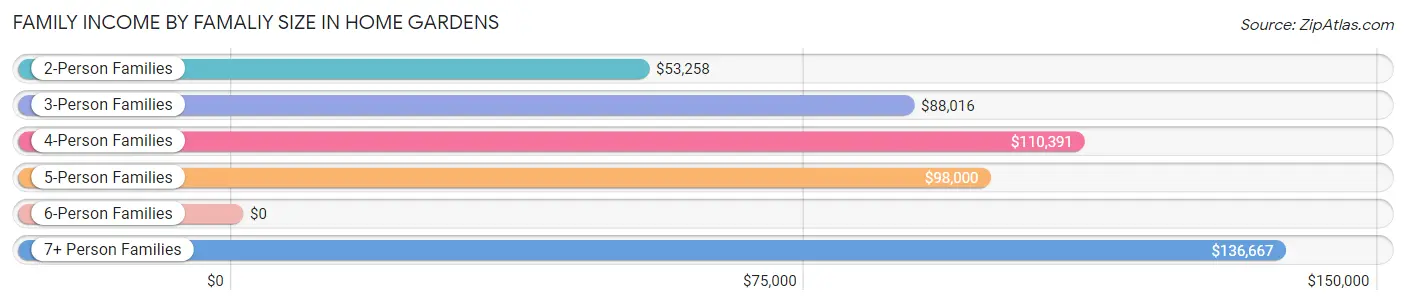
Family Income by Famaliy Size in Home Gardens
7+ person families (212 | 8.3%) account for the highest median family income in Home Gardens with $136,667 per family, while 3-person families (581 | 22.6%) have the highest median income of $29,339 per family member.
| Income Bracket | # Families | Median Income |
| 2-Person Families | 646 (25.2%) | $53,258 |
| 3-Person Families | 581 (22.6%) | $88,016 |
| 4-Person Families | 561 (21.9%) | $110,391 |
| 5-Person Families | 372 (14.5%) | $98,000 |
| 6-Person Families | 194 (7.6%) | $0 |
| 7+ Person Families | 212 (8.3%) | $136,667 |
| Total | 2,566 (100.0%) | $84,207 |
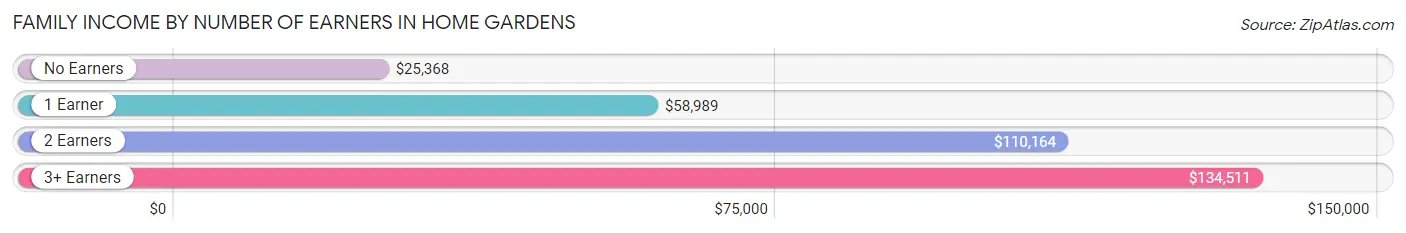
Family Income by Number of Earners in Home Gardens
The median family income in Home Gardens is $84,207, with families comprising 3+ earners (625) having the highest median family income of $134,511, while families with no earners (173) have the lowest median family income of $25,368, accounting for 24.4% and 6.7% of families, respectively.
| Number of Earners | # Families | Median Income |
| No Earners | 173 (6.7%) | $25,368 |
| 1 Earner | 1,022 (39.8%) | $58,989 |
| 2 Earners | 746 (29.1%) | $110,164 |
| 3+ Earners | 625 (24.4%) | $134,511 |
| Total | 2,566 (100.0%) | $84,207 |
Household Income in Home Gardens
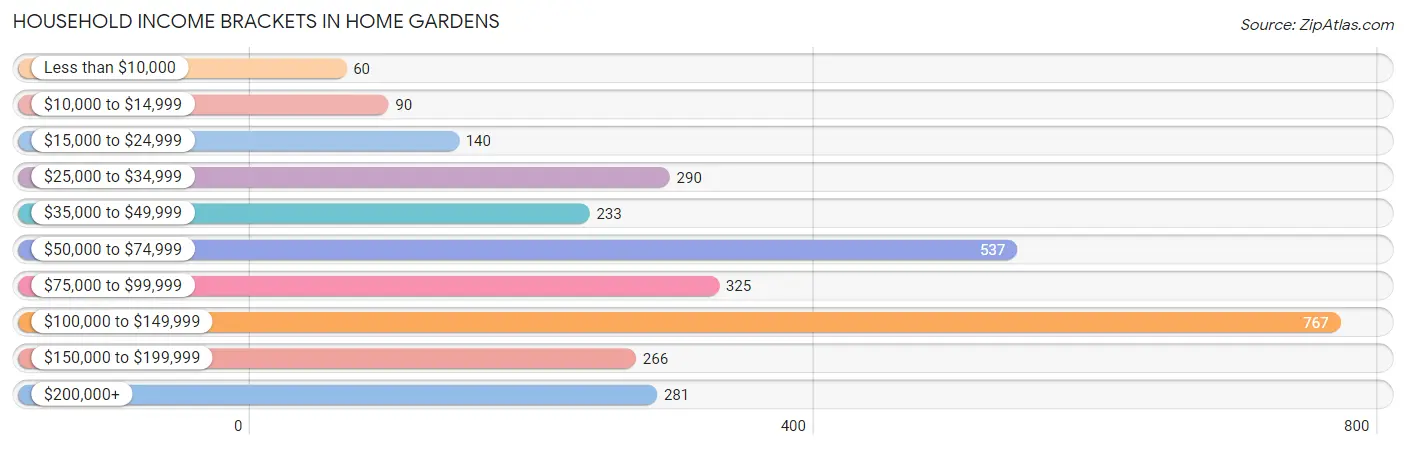
Household Income Brackets in Home Gardens
With 767 households falling in the category, the $100,000 to $149,999 income range is the most frequent in Home Gardens, accounting for 25.7% of all households. In contrast, only 60 households (2.0%) fall into the less than $10,000 income bracket, making it the least populous group.
| Income Bracket | # Households | % Households |
| Less than $10,000 | 60 | 2.0% |
| $10,000 to $14,999 | 90 | 3.0% |
| $15,000 to $24,999 | 140 | 4.7% |
| $25,000 to $34,999 | 290 | 9.7% |
| $35,000 to $49,999 | 233 | 7.8% |
| $50,000 to $74,999 | 537 | 18.0% |
| $75,000 to $99,999 | 325 | 10.9% |
| $100,000 to $149,999 | 767 | 25.7% |
| $150,000 to $199,999 | 266 | 8.9% |
| $200,000+ | 281 | 9.4% |
Household Income by Householder Age in Home Gardens
The median household income in Home Gardens is $88,125, with the highest median household income of $103,889 found in the 25 to 44 years age bracket for the primary householder. A total of 1,020 households (34.2%) fall into this category. Meanwhile, the 15 to 24 years age bracket for the primary householder has the lowest median household income of $0, with 32 households (1.1%) in this group.
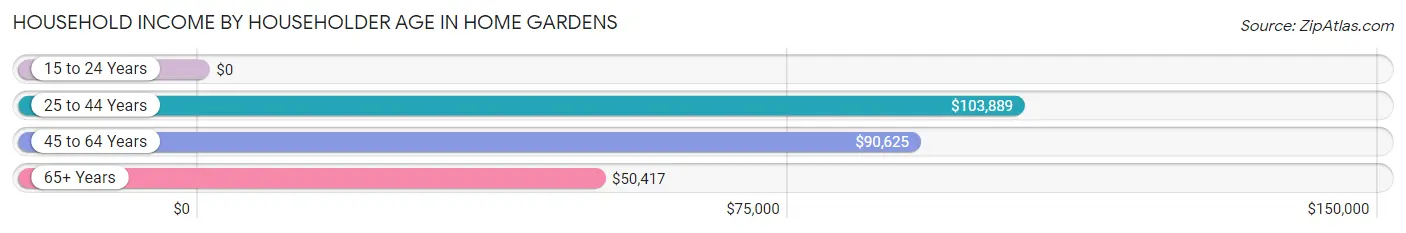
| Income Bracket | # Households | Median Income |
| 15 to 24 Years | 32 (1.1%) | $0 |
| 25 to 44 Years | 1,020 (34.2%) | $103,889 |
| 45 to 64 Years | 1,272 (42.6%) | $90,625 |
| 65+ Years | 662 (22.2%) | $50,417 |
| Total | 2,986 (100.0%) | $88,125 |
Poverty in Home Gardens
Income Below Poverty by Sex and Age in Home Gardens
With 9.3% poverty level for males and 13.8% for females among the residents of Home Gardens, under 5 year old males and 15 year old females are the most vulnerable to poverty, with 94 males (22.8%) and 41 females (36.3%) in their respective age groups living below the poverty level.
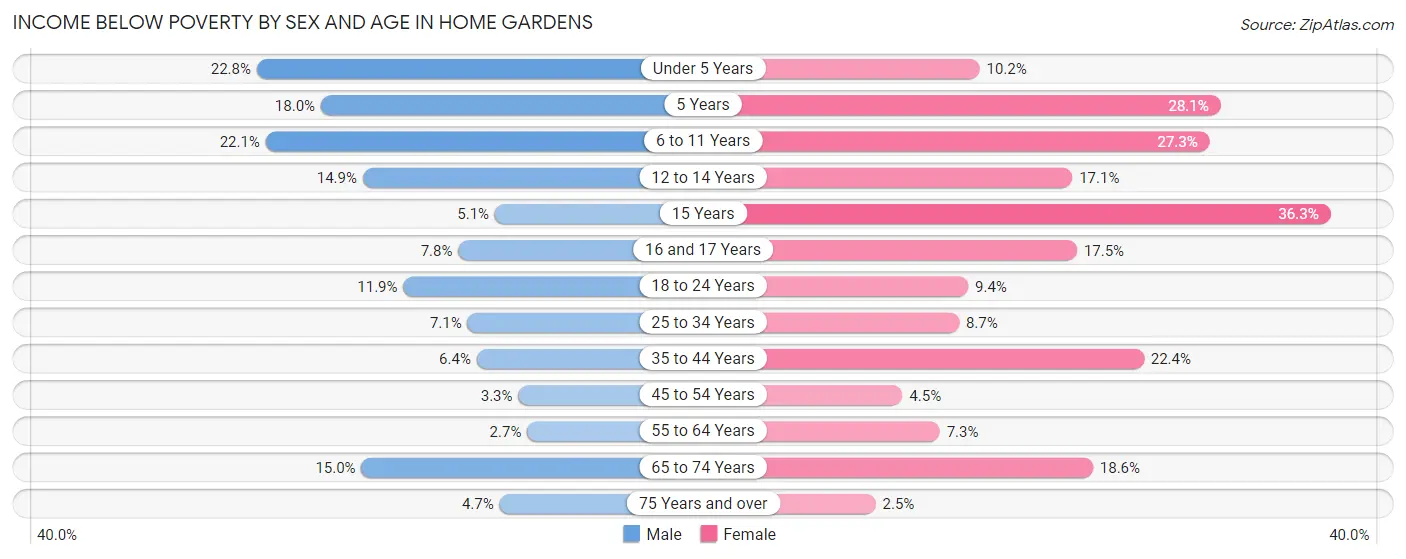
| Age Bracket | Male | Female |
| Under 5 Years | 94 (22.8%) | 40 (10.2%) |
| 5 Years | 36 (18.0%) | 27 (28.1%) |
| 6 to 11 Years | 59 (22.1%) | 166 (27.3%) |
| 12 to 14 Years | 39 (14.9%) | 58 (17.1%) |
| 15 Years | 3 (5.1%) | 41 (36.3%) |
| 16 and 17 Years | 11 (7.8%) | 22 (17.5%) |
| 18 to 24 Years | 70 (11.9%) | 60 (9.4%) |
| 25 to 34 Years | 67 (7.1%) | 71 (8.7%) |
| 35 to 44 Years | 64 (6.4%) | 189 (22.4%) |
| 45 to 54 Years | 24 (3.3%) | 34 (4.5%) |
| 55 to 64 Years | 19 (2.7%) | 42 (7.3%) |
| 65 to 74 Years | 58 (15.0%) | 85 (18.6%) |
| 75 Years and over | 19 (4.7%) | 9 (2.5%) |
| Total | 563 (9.3%) | 844 (13.8%) |
Income Above Poverty by Sex and Age in Home Gardens
According to the poverty statistics in Home Gardens, males aged 55 to 64 years and females aged 75 years and over are the age groups that are most secure financially, with 97.3% of males and 97.5% of females in these age groups living above the poverty line.
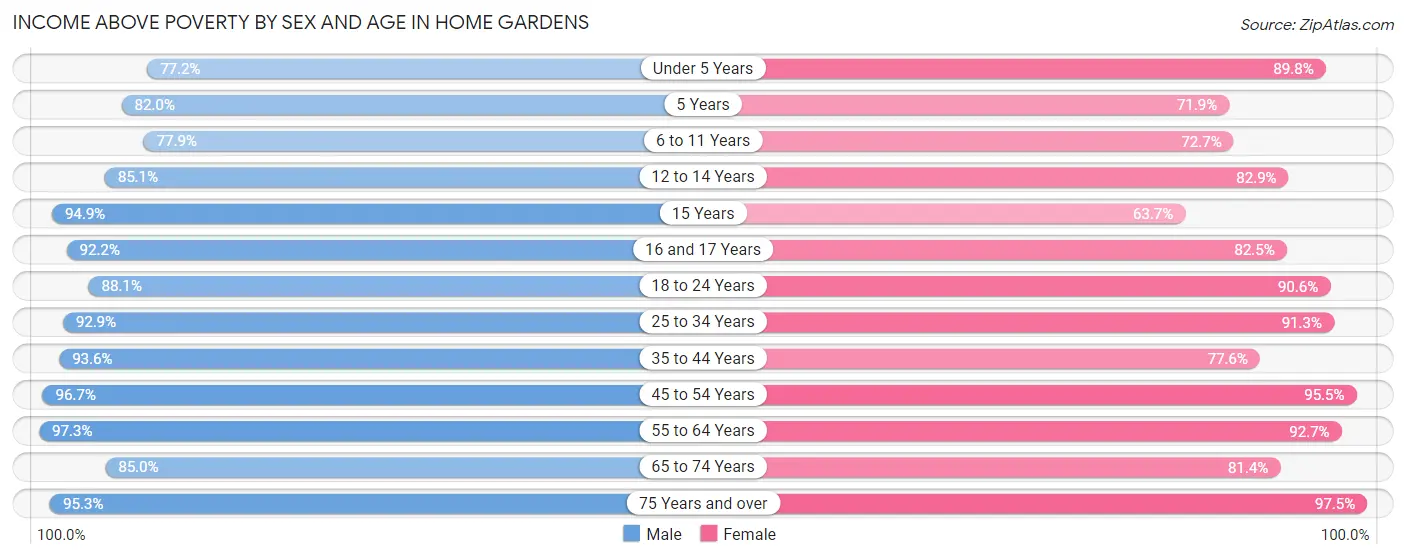
| Age Bracket | Male | Female |
| Under 5 Years | 319 (77.2%) | 351 (89.8%) |
| 5 Years | 164 (82.0%) | 69 (71.9%) |
| 6 to 11 Years | 208 (77.9%) | 442 (72.7%) |
| 12 to 14 Years | 223 (85.1%) | 281 (82.9%) |
| 15 Years | 56 (94.9%) | 72 (63.7%) |
| 16 and 17 Years | 130 (92.2%) | 104 (82.5%) |
| 18 to 24 Years | 519 (88.1%) | 580 (90.6%) |
| 25 to 34 Years | 875 (92.9%) | 745 (91.3%) |
| 35 to 44 Years | 931 (93.6%) | 654 (77.6%) |
| 45 to 54 Years | 695 (96.7%) | 721 (95.5%) |
| 55 to 64 Years | 689 (97.3%) | 536 (92.7%) |
| 65 to 74 Years | 329 (85.0%) | 371 (81.4%) |
| 75 Years and over | 382 (95.3%) | 349 (97.5%) |
| Total | 5,520 (90.7%) | 5,275 (86.2%) |
Income Below Poverty Among Married-Couple Families in Home Gardens
The poverty statistics for married-couple families in Home Gardens show that 7.1% or 119 of the total 1,678 families live below the poverty line. Families with 3 or 4 children have the highest poverty rate of 20.7%, comprising of 56 families. On the other hand, families with 5 or more children have the lowest poverty rate of 0.0%, which includes 0 families.
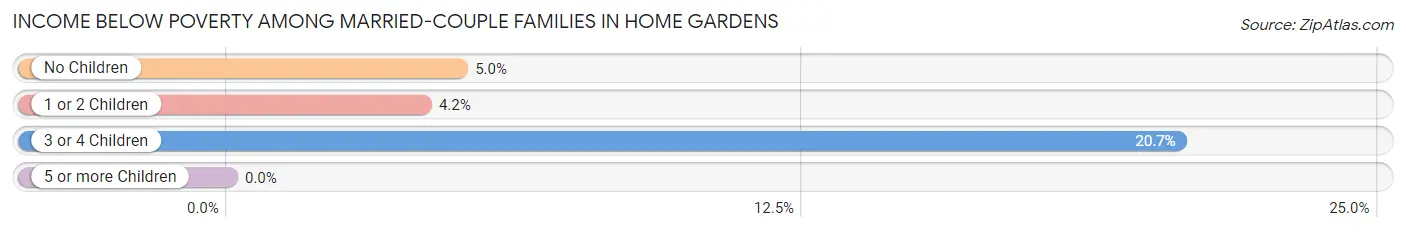
| Children | Above Poverty | Below Poverty |
| No Children | 720 (95.0%) | 38 (5.0%) |
| 1 or 2 Children | 568 (95.8%) | 25 (4.2%) |
| 3 or 4 Children | 215 (79.3%) | 56 (20.7%) |
| 5 or more Children | 56 (100.0%) | 0 (0.0%) |
| Total | 1,559 (92.9%) | 119 (7.1%) |
Income Below Poverty Among Single-Parent Households in Home Gardens
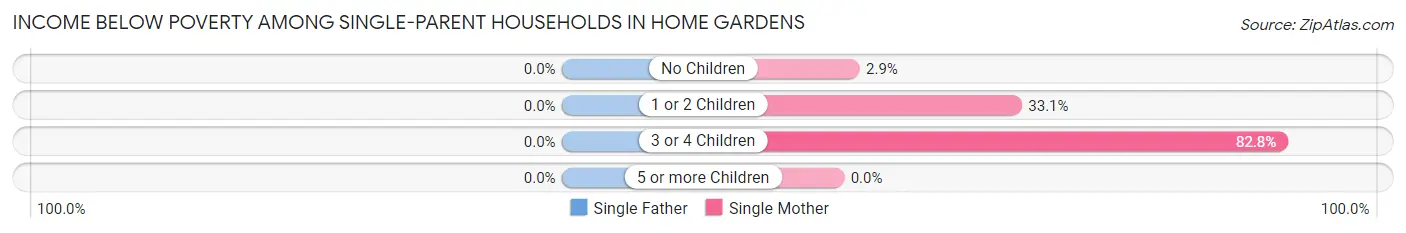
| Children | Single Father | Single Mother |
| No Children | 0 (0.0%) | 6 (2.9%) |
| 1 or 2 Children | 0 (0.0%) | 48 (33.1%) |
| 3 or 4 Children | 0 (0.0%) | 72 (82.8%) |
| 5 or more Children | 0 (0.0%) | 0 (0.0%) |
| Total | 0 (0.0%) | 126 (28.6%) |
Income Below Poverty Among Married-Couple vs Single-Parent Households in Home Gardens
The poverty data for Home Gardens shows that 119 of the married-couple family households (7.1%) and 126 of the single-parent households (14.2%) are living below the poverty level. Within the married-couple family households, those with 3 or 4 children have the highest poverty rate, with 56 households (20.7%) falling below the poverty line. Among the single-parent households, those with 3 or 4 children have the highest poverty rate, with 72 household (82.8%) living below poverty.
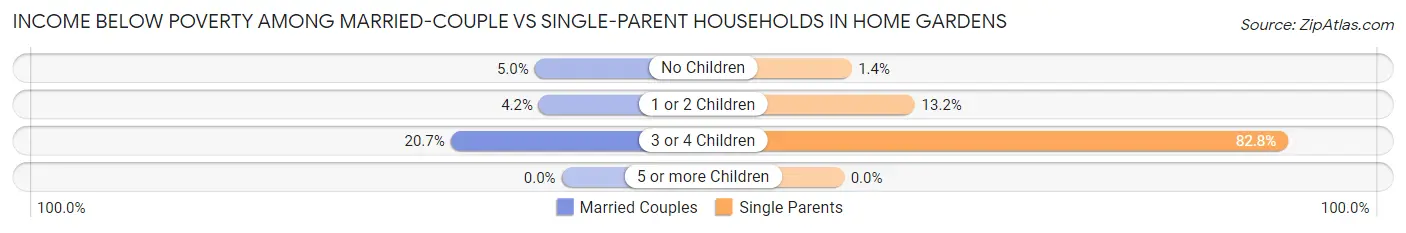
| Children | Married-Couple Families | Single-Parent Households |
| No Children | 38 (5.0%) | 6 (1.4%) |
| 1 or 2 Children | 25 (4.2%) | 48 (13.2%) |
| 3 or 4 Children | 56 (20.7%) | 72 (82.8%) |
| 5 or more Children | 0 (0.0%) | 0 (0.0%) |
| Total | 119 (7.1%) | 126 (14.2%) |
Race in Home Gardens
The most populous races in Home Gardens are Hispanic or Latino (8,709 | 70.9%), Some other Race (4,624 | 37.7%), and White / Caucasian (4,471 | 36.4%).
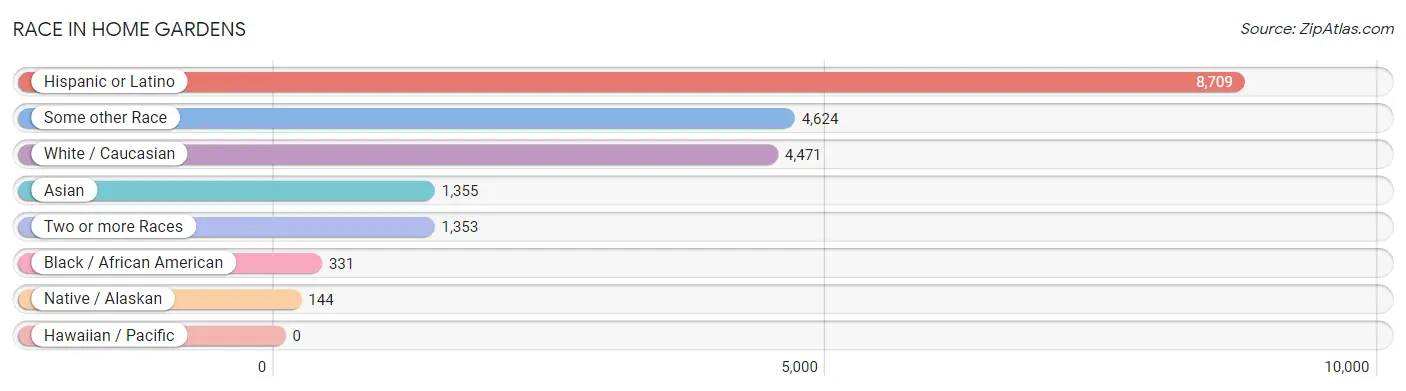
| Race | # Population | % Population |
| Asian | 1,355 | 11.0% |
| Black / African American | 331 | 2.7% |
| Hawaiian / Pacific | 0 | 0.0% |
| Hispanic or Latino | 8,709 | 70.9% |
| Native / Alaskan | 144 | 1.2% |
| White / Caucasian | 4,471 | 36.4% |
| Two or more Races | 1,353 | 11.0% |
| Some other Race | 4,624 | 37.7% |
| Total | 12,278 | 100.0% |
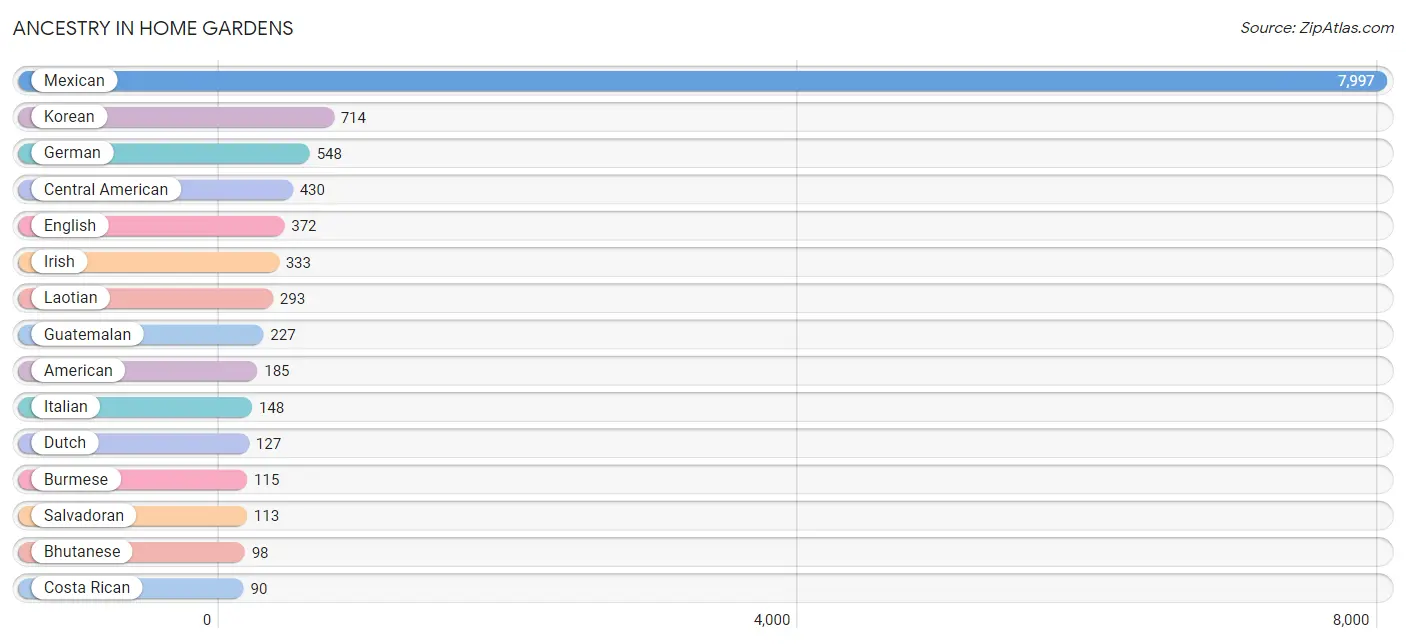
Ancestry in Home Gardens
The most populous ancestries reported in Home Gardens are Mexican (7,997 | 65.1%), Korean (714 | 5.8%), German (548 | 4.5%), Central American (430 | 3.5%), and English (372 | 3.0%), together accounting for 81.9% of all Home Gardens residents.
| Ancestry | # Population | % Population |
| African | 11 | 0.1% |
| American | 185 | 1.5% |
| Arab | 66 | 0.5% |
| Belizean | 28 | 0.2% |
| Bhutanese | 98 | 0.8% |
| British | 16 | 0.1% |
| Burmese | 115 | 0.9% |
| Central American | 430 | 3.5% |
| Colombian | 48 | 0.4% |
| Costa Rican | 90 | 0.7% |
| Dutch | 127 | 1.0% |
| Egyptian | 44 | 0.4% |
| English | 372 | 3.0% |
| European | 22 | 0.2% |
| German | 548 | 4.5% |
| Greek | 11 | 0.1% |
| Guatemalan | 227 | 1.8% |
| Hungarian | 16 | 0.1% |
| Indian (Asian) | 24 | 0.2% |
| Irish | 333 | 2.7% |
| Italian | 148 | 1.2% |
| Jamaican | 27 | 0.2% |
| Japanese | 30 | 0.2% |
| Korean | 714 | 5.8% |
| Laotian | 293 | 2.4% |
| Lebanese | 22 | 0.2% |
| Mexican | 7,997 | 65.1% |
| Native Hawaiian | 60 | 0.5% |
| Norwegian | 21 | 0.2% |
| Pakistani | 4 | 0.0% |
| Polish | 66 | 0.5% |
| Portuguese | 27 | 0.2% |
| Puerto Rican | 41 | 0.3% |
| Salvadoran | 113 | 0.9% |
| Scandinavian | 24 | 0.2% |
| Scotch-Irish | 41 | 0.3% |
| Scottish | 11 | 0.1% |
| Sioux | 2 | 0.0% |
| South American | 48 | 0.4% |
| Spaniard | 65 | 0.5% |
| Spanish | 36 | 0.3% |
| Sri Lankan | 39 | 0.3% |
| Subsaharan African | 11 | 0.1% |
| Swedish | 14 | 0.1% |
| Swiss | 5 | 0.0% |
| Thai | 11 | 0.1% |
| Tohono O'Odham | 49 | 0.4% |
| Yaqui | 50 | 0.4% | View All 48 Rows |
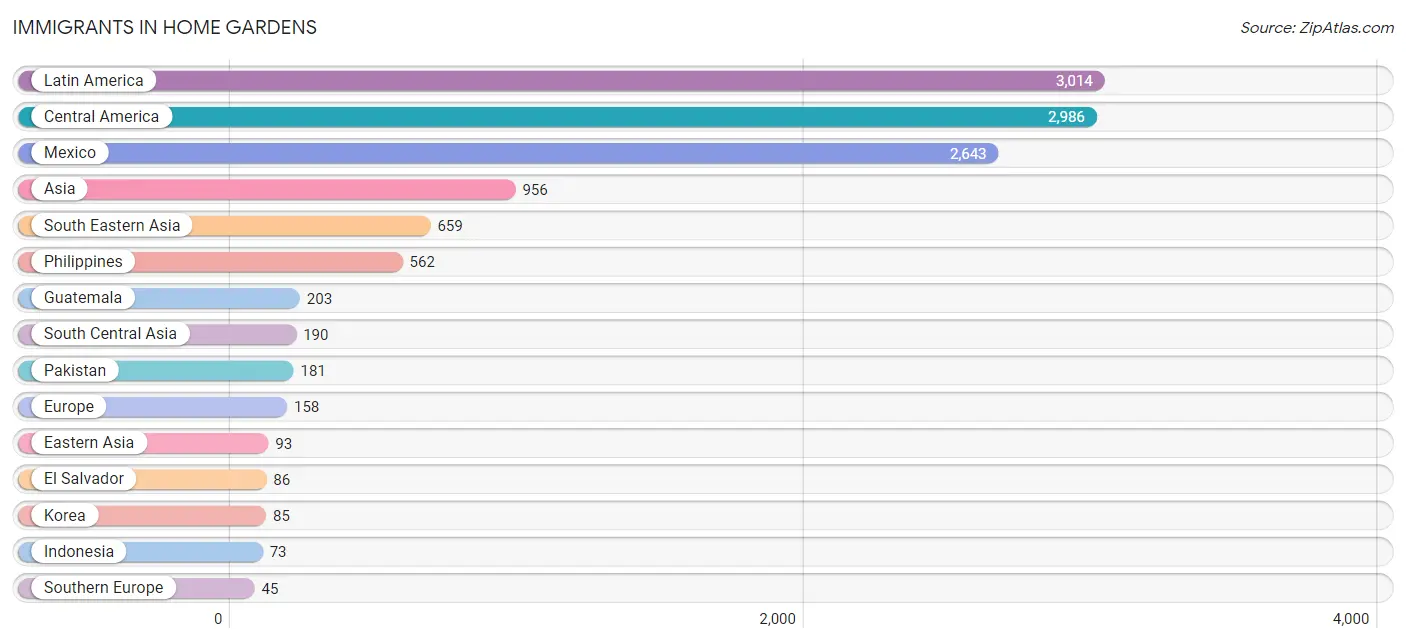
Immigrants in Home Gardens
The most numerous immigrant groups reported in Home Gardens came from Latin America (3,014 | 24.5%), Central America (2,986 | 24.3%), Mexico (2,643 | 21.5%), Asia (956 | 7.8%), and South Eastern Asia (659 | 5.4%), together accounting for 83.6% of all Home Gardens residents.
| Immigration Origin | # Population | % Population |
| Africa | 44 | 0.4% |
| Argentina | 2 | 0.0% |
| Asia | 956 | 7.8% |
| Belize | 33 | 0.3% |
| Cambodia | 6 | 0.1% |
| Canada | 6 | 0.1% |
| Caribbean | 17 | 0.1% |
| Central America | 2,986 | 24.3% |
| Colombia | 9 | 0.1% |
| Costa Rica | 21 | 0.2% |
| Eastern Asia | 93 | 0.8% |
| Eastern Europe | 33 | 0.3% |
| Egypt | 44 | 0.4% |
| El Salvador | 86 | 0.7% |
| England | 14 | 0.1% |
| Europe | 158 | 1.3% |
| France | 5 | 0.0% |
| Germany | 33 | 0.3% |
| Guatemala | 203 | 1.7% |
| India | 5 | 0.0% |
| Indonesia | 73 | 0.6% |
| Jamaica | 17 | 0.1% |
| Japan | 8 | 0.1% |
| Korea | 85 | 0.7% |
| Latin America | 3,014 | 24.5% |
| Lebanon | 14 | 0.1% |
| Mexico | 2,643 | 21.5% |
| Northern Africa | 44 | 0.4% |
| Northern Europe | 42 | 0.3% |
| Pakistan | 181 | 1.5% |
| Philippines | 562 | 4.6% |
| Poland | 33 | 0.3% |
| South America | 11 | 0.1% |
| South Central Asia | 190 | 1.5% |
| South Eastern Asia | 659 | 5.4% |
| Southern Europe | 45 | 0.4% |
| Spain | 45 | 0.4% |
| Sri Lanka | 4 | 0.0% |
| Vietnam | 18 | 0.2% |
| Western Asia | 14 | 0.1% |
| Western Europe | 38 | 0.3% | View All 41 Rows |
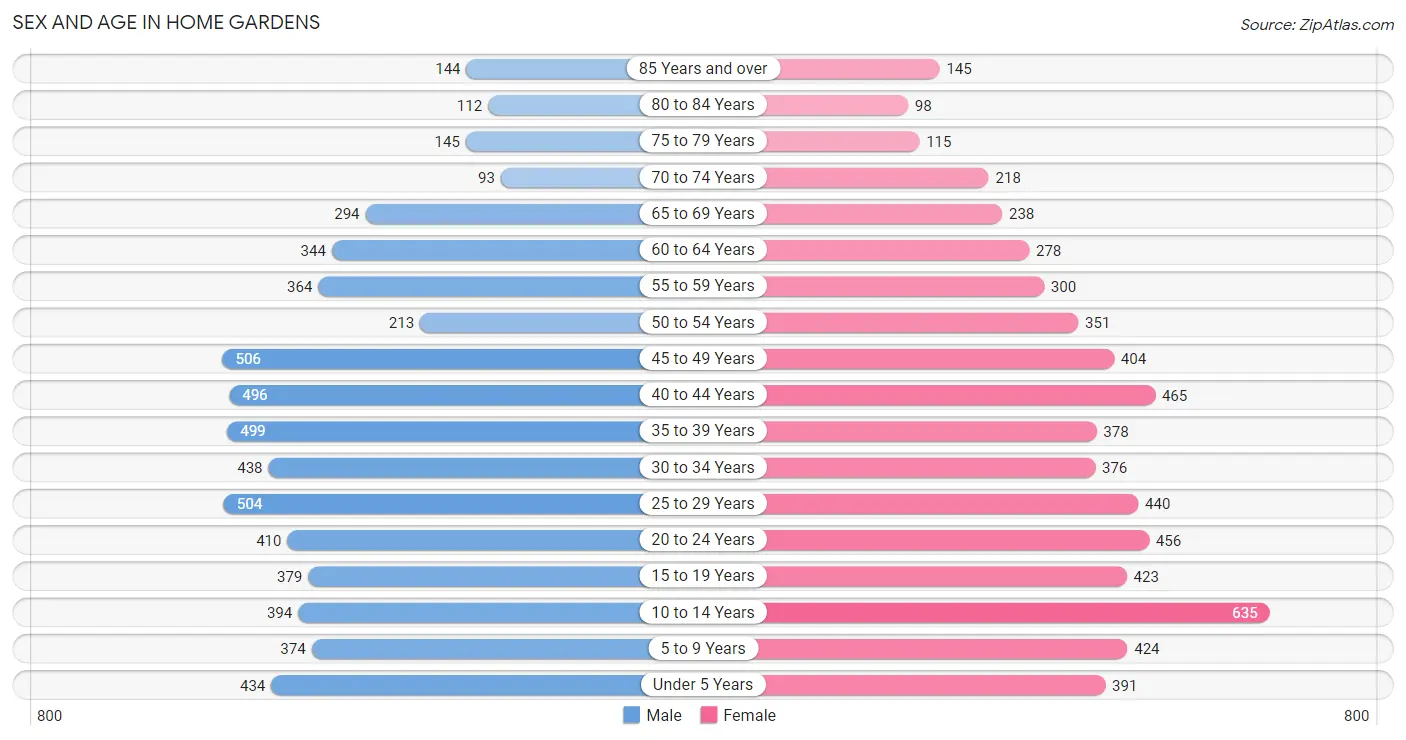
Sex and Age in Home Gardens
Sex and Age in Home Gardens
The most populous age groups in Home Gardens are 45 to 49 Years (506 | 8.2%) for men and 10 to 14 Years (635 | 10.3%) for women.
| Age Bracket | Male | Female |
| Under 5 Years | 434 (7.1%) | 391 (6.4%) |
| 5 to 9 Years | 374 (6.1%) | 424 (6.9%) |
| 10 to 14 Years | 394 (6.4%) | 635 (10.3%) |
| 15 to 19 Years | 379 (6.2%) | 423 (6.9%) |
| 20 to 24 Years | 410 (6.7%) | 456 (7.4%) |
| 25 to 29 Years | 504 (8.2%) | 440 (7.2%) |
| 30 to 34 Years | 438 (7.1%) | 376 (6.1%) |
| 35 to 39 Years | 499 (8.1%) | 378 (6.2%) |
| 40 to 44 Years | 496 (8.1%) | 465 (7.6%) |
| 45 to 49 Years | 506 (8.2%) | 404 (6.6%) |
| 50 to 54 Years | 213 (3.5%) | 351 (5.7%) |
| 55 to 59 Years | 364 (5.9%) | 300 (4.9%) |
| 60 to 64 Years | 344 (5.6%) | 278 (4.5%) |
| 65 to 69 Years | 294 (4.8%) | 238 (3.9%) |
| 70 to 74 Years | 93 (1.5%) | 218 (3.5%) |
| 75 to 79 Years | 145 (2.4%) | 115 (1.9%) |
| 80 to 84 Years | 112 (1.8%) | 98 (1.6%) |
| 85 Years and over | 144 (2.3%) | 145 (2.4%) |
| Total | 6,143 (100.0%) | 6,135 (100.0%) |
Families and Households in Home Gardens
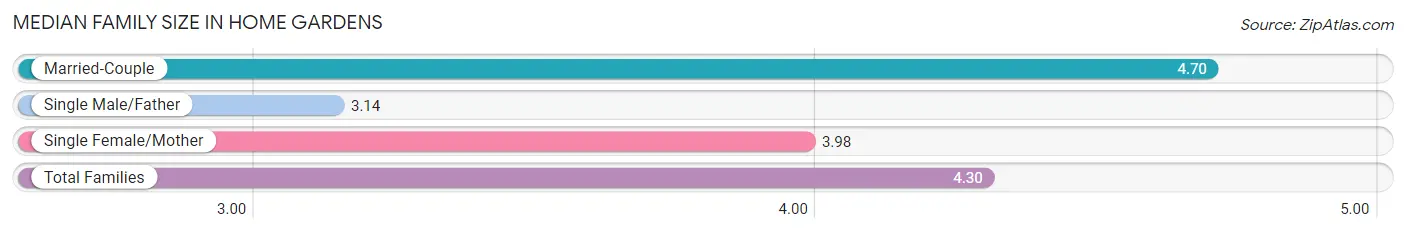
Median Family Size in Home Gardens
The median family size in Home Gardens is 4.30 persons per family, with married-couple families (1,678 | 65.4%) accounting for the largest median family size of 4.7 persons per family. On the other hand, single male/father families (447 | 17.4%) represent the smallest median family size with 3.14 persons per family.
| Family Type | # Families | Family Size |
| Married-Couple | 1,678 (65.4%) | 4.70 |
| Single Male/Father | 447 (17.4%) | 3.14 |
| Single Female/Mother | 441 (17.2%) | 3.98 |
| Total Families | 2,566 (100.0%) | 4.30 |
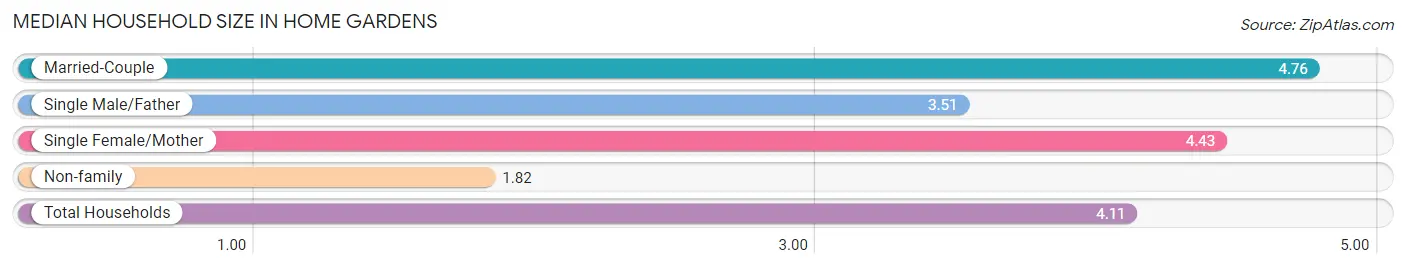
Median Household Size in Home Gardens
The median household size in Home Gardens is 4.11 persons per household, with married-couple households (1,678 | 56.2%) accounting for the largest median household size of 4.76 persons per household. non-family households (420 | 14.1%) represent the smallest median household size with 1.82 persons per household.
| Household Type | # Households | Household Size |
| Married-Couple | 1,678 (56.2%) | 4.76 |
| Single Male/Father | 447 (15.0%) | 3.51 |
| Single Female/Mother | 441 (14.8%) | 4.43 |
| Non-family | 420 (14.1%) | 1.82 |
| Total Households | 2,986 (100.0%) | 4.11 |
Household Size by Marriage Status in Home Gardens
Out of a total of 2,986 households in Home Gardens, 2,566 (85.9%) are family households, while 420 (14.1%) are nonfamily households. The most numerous type of family households are 4-person households, comprising 703, and the most common type of nonfamily households are 1-person households, comprising 314.
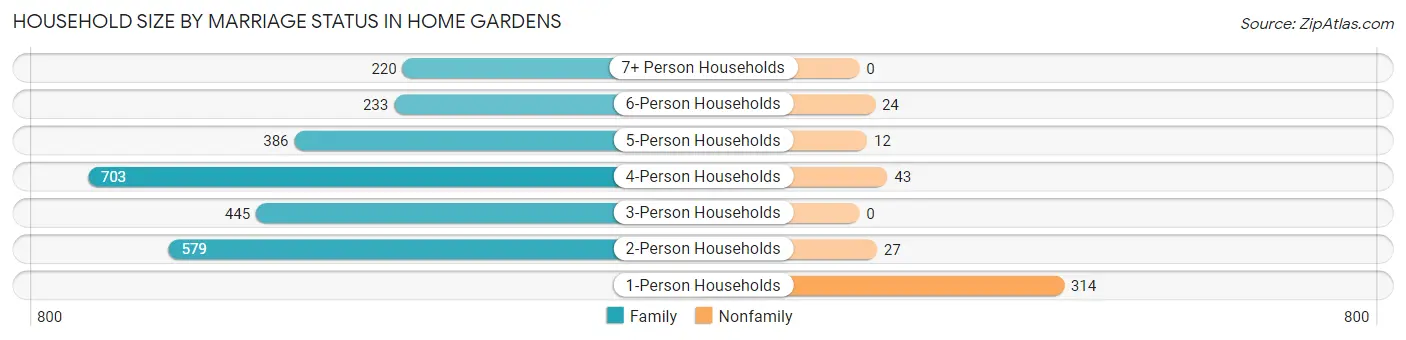
| Household Size | Family Households | Nonfamily Households |
| 1-Person Households | - | 314 (10.5%) |
| 2-Person Households | 579 (19.4%) | 27 (0.9%) |
| 3-Person Households | 445 (14.9%) | 0 (0.0%) |
| 4-Person Households | 703 (23.5%) | 43 (1.4%) |
| 5-Person Households | 386 (12.9%) | 12 (0.4%) |
| 6-Person Households | 233 (7.8%) | 24 (0.8%) |
| 7+ Person Households | 220 (7.4%) | 0 (0.0%) |
| Total | 2,566 (85.9%) | 420 (14.1%) |
Female Fertility in Home Gardens
Fertility by Age in Home Gardens
Average fertility rate in Home Gardens is 56.0 births per 1,000 women. Women in the age bracket of 20 to 34 years have the highest fertility rate with 80.0 births per 1,000 women. Women in the age bracket of 20 to 34 years acount for 58.0% of all women with births.
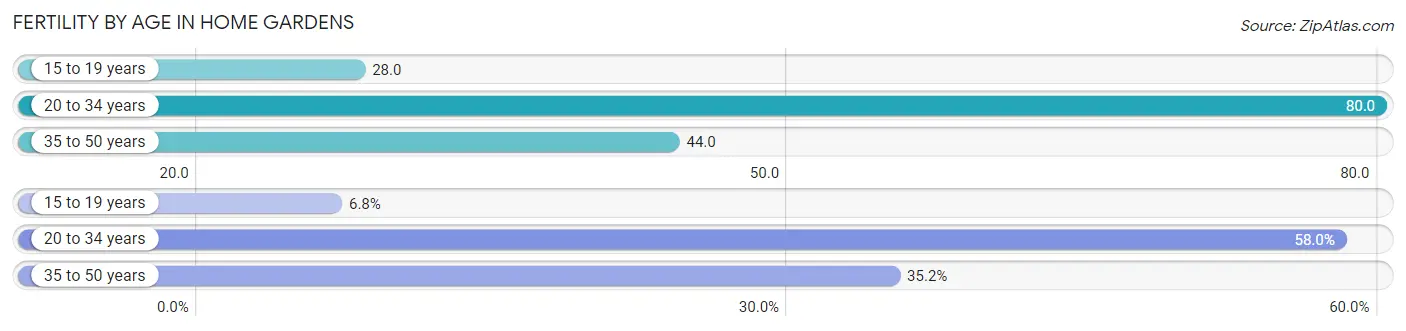
| Age Bracket | Women with Births | Births / 1,000 Women |
| 15 to 19 years | 12 (6.8%) | 28.0 |
| 20 to 34 years | 102 (58.0%) | 80.0 |
| 35 to 50 years | 62 (35.2%) | 44.0 |
| Total | 176 (100.0%) | 56.0 |
Fertility by Age by Marriage Status in Home Gardens
89.2% of women with births (176) in Home Gardens are married. The highest percentage of unmarried women with births falls into 20 to 34 years age bracket with 18.6% of them unmarried at the time of birth, while the lowest percentage of unmarried women with births belong to 15 to 19 years age bracket with 0.0% of them unmarried.
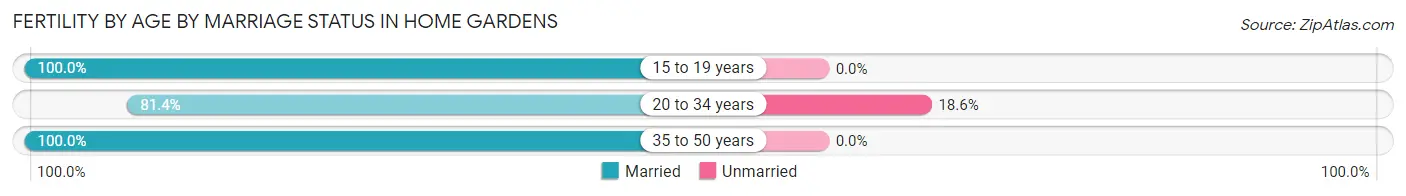
| Age Bracket | Married | Unmarried |
| 15 to 19 years | 12 (100.0%) | 0 (0.0%) |
| 20 to 34 years | 83 (81.4%) | 19 (18.6%) |
| 35 to 50 years | 62 (100.0%) | 0 (0.0%) |
| Total | 157 (89.2%) | 19 (10.8%) |
Fertility by Education in Home Gardens
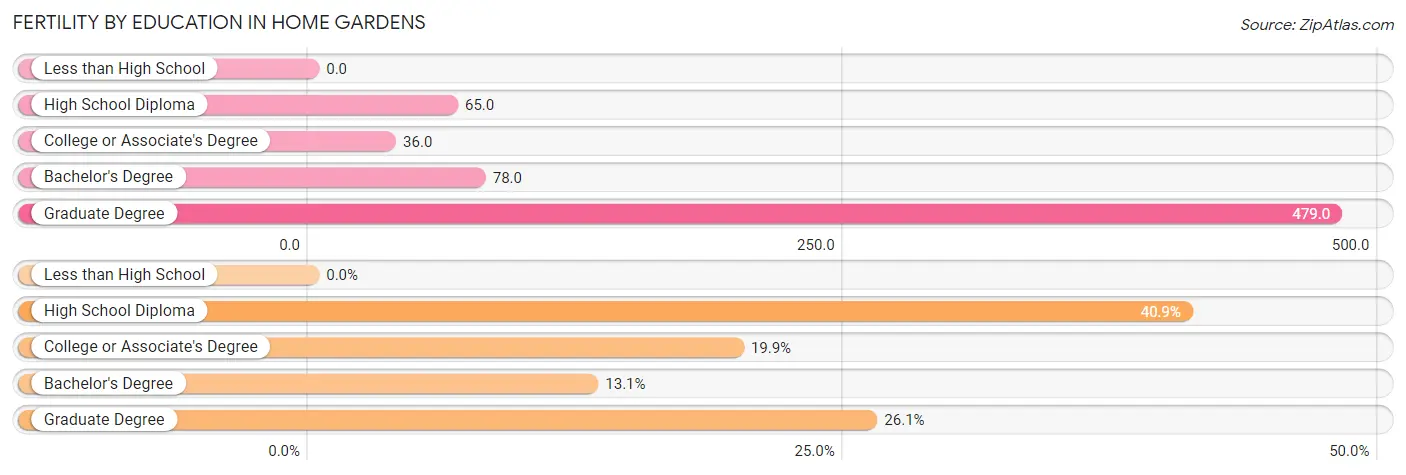
| Educational Attainment | Women with Births | Births / 1,000 Women |
| Less than High School | 0 (0.0%) | 0.0 |
| High School Diploma | 72 (40.9%) | 65.0 |
| College or Associate's Degree | 35 (19.9%) | 36.0 |
| Bachelor's Degree | 23 (13.1%) | 78.0 |
| Graduate Degree | 46 (26.1%) | 479.0 |
| Total | 176 (100.0%) | 56.0 |
Fertility by Education by Marriage Status in Home Gardens
10.8% of women with births in Home Gardens are unmarried. Women with the educational attainment of bachelor's degree are most likely to be married with 100.0% of them married at childbirth, while women with the educational attainment of college or associate's degree are least likely to be married with 25.7% of them unmarried at childbirth.
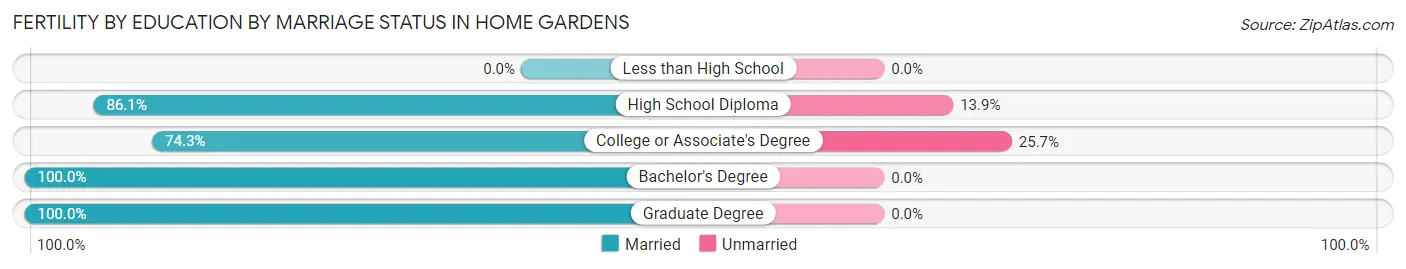
| Educational Attainment | Married | Unmarried |
| Less than High School | 0 (0.0%) | 0 (0.0%) |
| High School Diploma | 62 (86.1%) | 10 (13.9%) |
| College or Associate's Degree | 26 (74.3%) | 9 (25.7%) |
| Bachelor's Degree | 23 (100.0%) | 0 (0.0%) |
| Graduate Degree | 46 (100.0%) | 0 (0.0%) |
| Total | 157 (89.2%) | 19 (10.8%) |
Employment Characteristics in Home Gardens
Employment by Class of Employer in Home Gardens
Among the 5,464 employed individuals in Home Gardens, private company employees (4,235 | 77.5%), self-employed (not incorporated) (339 | 6.2%), and state government employees (247 | 4.5%) make up the most common classes of employment.
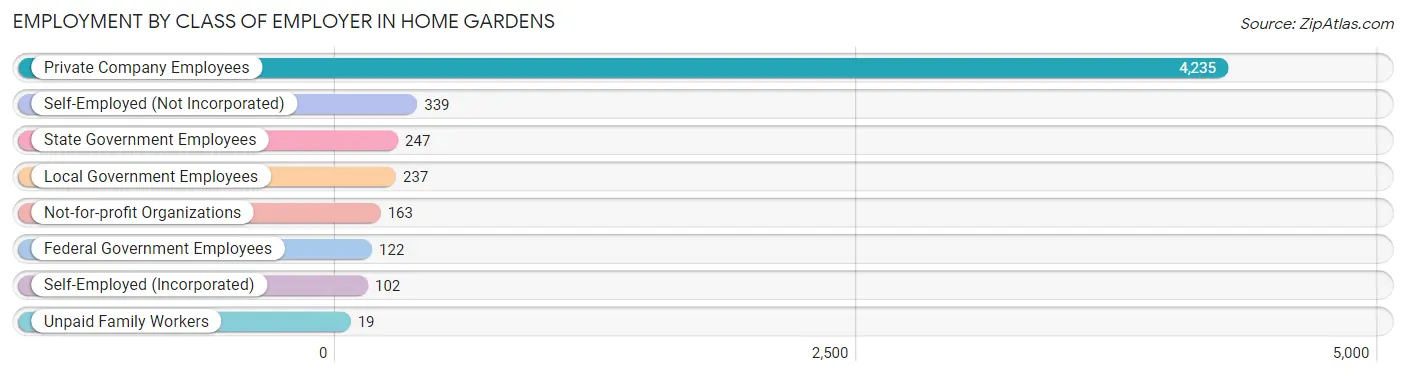
| Employer Class | # Employees | % Employees |
| Private Company Employees | 4,235 | 77.5% |
| Self-Employed (Incorporated) | 102 | 1.9% |
| Self-Employed (Not Incorporated) | 339 | 6.2% |
| Not-for-profit Organizations | 163 | 3.0% |
| Local Government Employees | 237 | 4.3% |
| State Government Employees | 247 | 4.5% |
| Federal Government Employees | 122 | 2.2% |
| Unpaid Family Workers | 19 | 0.4% |
| Total | 5,464 | 100.0% |
Employment Status by Age in Home Gardens
According to the labor force statistics for Home Gardens, out of the total population over 16 years of age (9,454), 61.4% or 5,805 individuals are in the labor force, with 4.1% or 238 of them unemployed. The age group with the highest labor force participation rate is 30 to 34 years, with 86.9% or 707 individuals in the labor force. Within the labor force, the 20 to 24 years age range has the highest percentage of unemployed individuals, with 12.3% or 83 of them being unemployed.
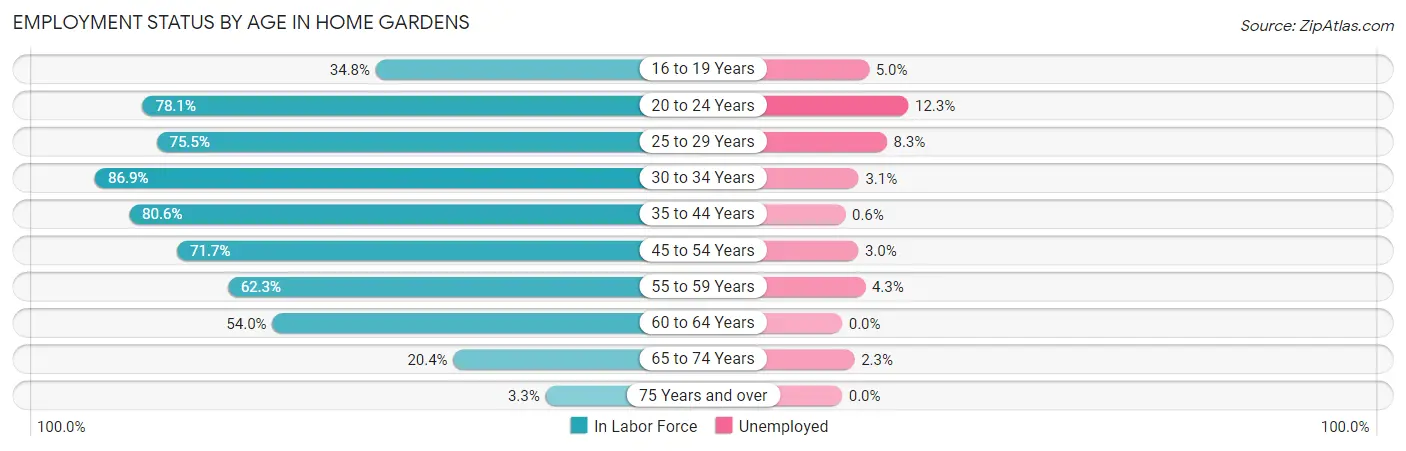
| Age Bracket | In Labor Force | Unemployed |
| 16 to 19 Years | 219 (34.8%) | 11 (5.0%) |
| 20 to 24 Years | 676 (78.1%) | 83 (12.3%) |
| 25 to 29 Years | 713 (75.5%) | 59 (8.3%) |
| 30 to 34 Years | 707 (86.9%) | 22 (3.1%) |
| 35 to 44 Years | 1,481 (80.6%) | 9 (0.6%) |
| 45 to 54 Years | 1,057 (71.7%) | 32 (3.0%) |
| 55 to 59 Years | 414 (62.3%) | 18 (4.3%) |
| 60 to 64 Years | 336 (54.0%) | 0 (0.0%) |
| 65 to 74 Years | 172 (20.4%) | 4 (2.3%) |
| 75 Years and over | 25 (3.3%) | 0 (0.0%) |
| Total | 5,805 (61.4%) | 238 (4.1%) |
Employment Status by Educational Attainment in Home Gardens
According to labor force statistics for Home Gardens, 74.1% of individuals (4,710) out of the total population between 25 and 64 years of age (6,356) are in the labor force, with 3.0% or 141 of them being unemployed. The group with the highest labor force participation rate are those with the educational attainment of bachelor's degree or higher, with 80.8% or 599 individuals in the labor force. Within the labor force, individuals with less than high school education have the highest percentage of unemployment, with 3.5% or 26 of them being unemployed.
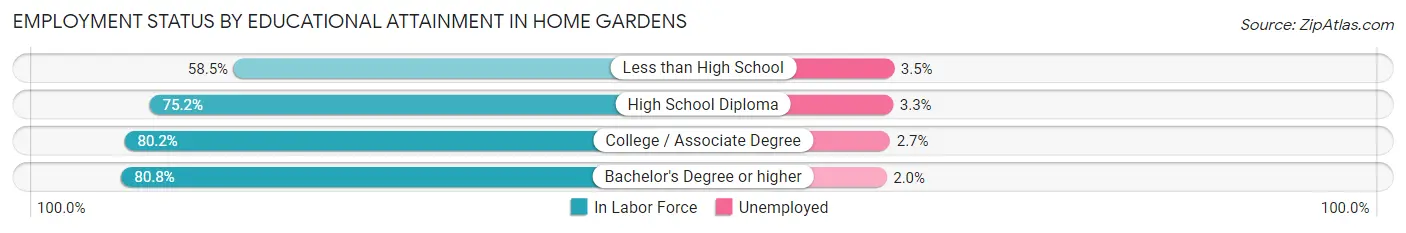
| Educational Attainment | In Labor Force | Unemployed |
| Less than High School | 737 (58.5%) | 44 (3.5%) |
| High School Diploma | 1,804 (75.2%) | 79 (3.3%) |
| College / Associate Degree | 1,570 (80.2%) | 53 (2.7%) |
| Bachelor's Degree or higher | 599 (80.8%) | 15 (2.0%) |
| Total | 4,710 (74.1%) | 191 (3.0%) |
Employment Occupations by Sex in Home Gardens
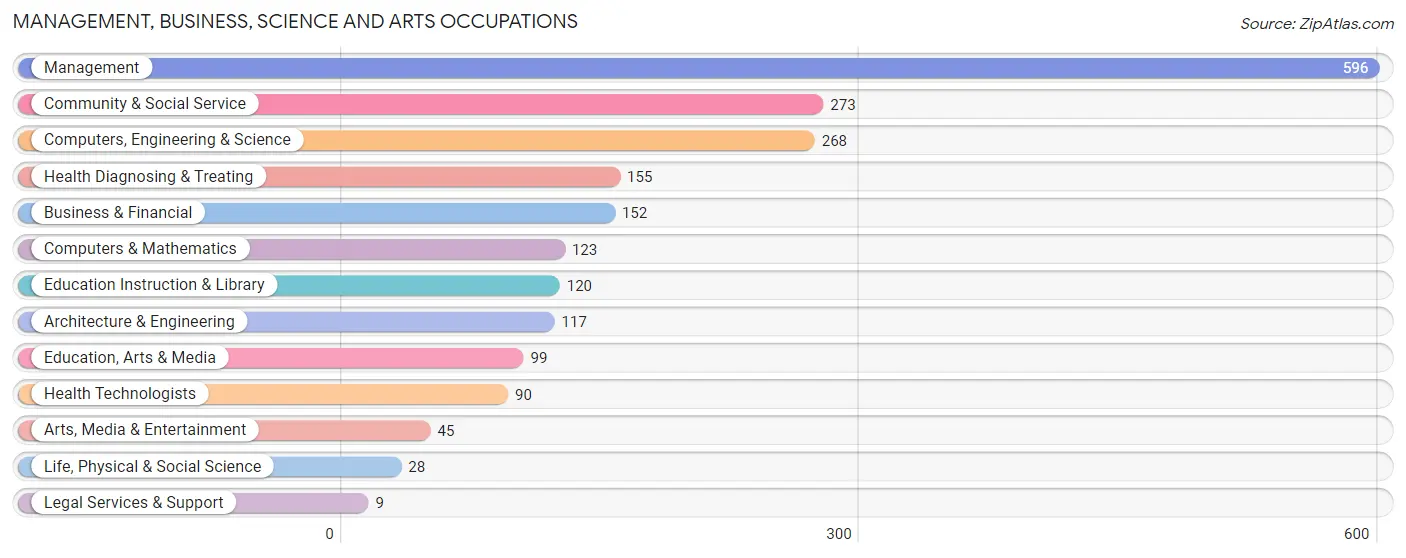
Management, Business, Science and Arts Occupations
The most common Management, Business, Science and Arts occupations in Home Gardens are Management (596 | 10.7%), Community & Social Service (273 | 4.9%), Computers, Engineering & Science (268 | 4.8%), Health Diagnosing & Treating (155 | 2.8%), and Business & Financial (152 | 2.7%).
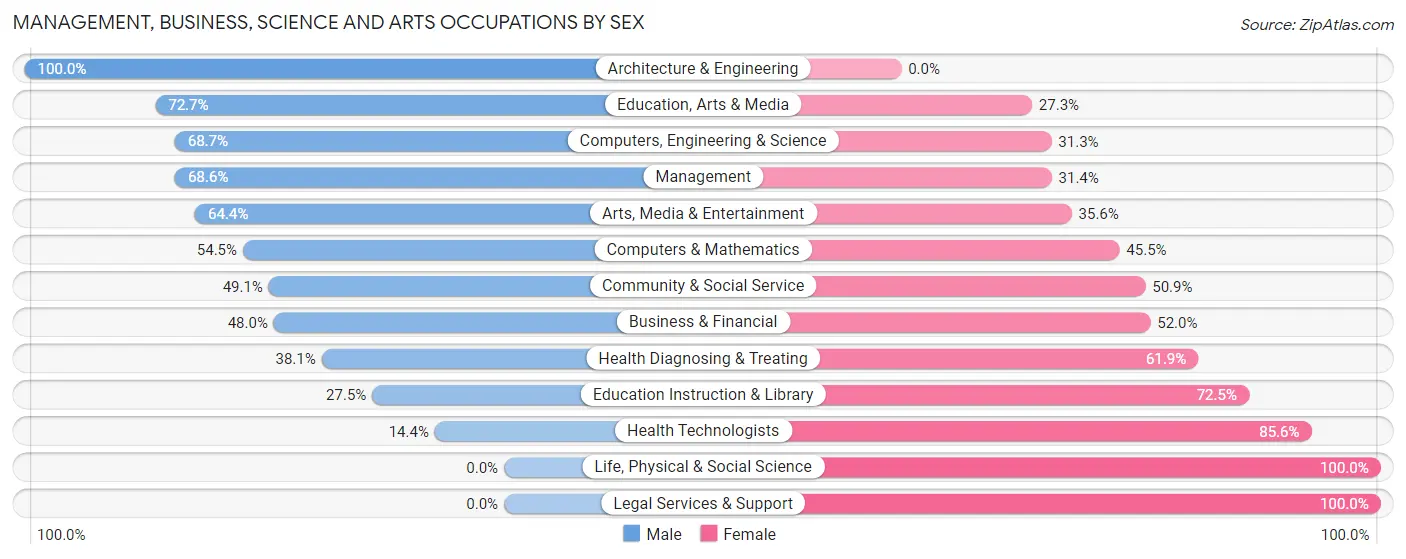
Management, Business, Science and Arts Occupations by Sex
Within the Management, Business, Science and Arts occupations in Home Gardens, the most male-oriented occupations are Architecture & Engineering (100.0%), Education, Arts & Media (72.7%), and Computers, Engineering & Science (68.7%), while the most female-oriented occupations are Life, Physical & Social Science (100.0%), Legal Services & Support (100.0%), and Health Technologists (85.6%).
| Occupation | Male | Female |
| Management | 409 (68.6%) | 187 (31.4%) |
| Business & Financial | 73 (48.0%) | 79 (52.0%) |
| Computers, Engineering & Science | 184 (68.7%) | 84 (31.3%) |
| Computers & Mathematics | 67 (54.5%) | 56 (45.5%) |
| Architecture & Engineering | 117 (100.0%) | 0 (0.0%) |
| Life, Physical & Social Science | 0 (0.0%) | 28 (100.0%) |
| Community & Social Service | 134 (49.1%) | 139 (50.9%) |
| Education, Arts & Media | 72 (72.7%) | 27 (27.3%) |
| Legal Services & Support | 0 (0.0%) | 9 (100.0%) |
| Education Instruction & Library | 33 (27.5%) | 87 (72.5%) |
| Arts, Media & Entertainment | 29 (64.4%) | 16 (35.6%) |
| Health Diagnosing & Treating | 59 (38.1%) | 96 (61.9%) |
| Health Technologists | 13 (14.4%) | 77 (85.6%) |
| Total (Category) | 859 (59.5%) | 585 (40.5%) |
| Total (Overall) | 3,384 (61.0%) | 2,167 (39.0%) |
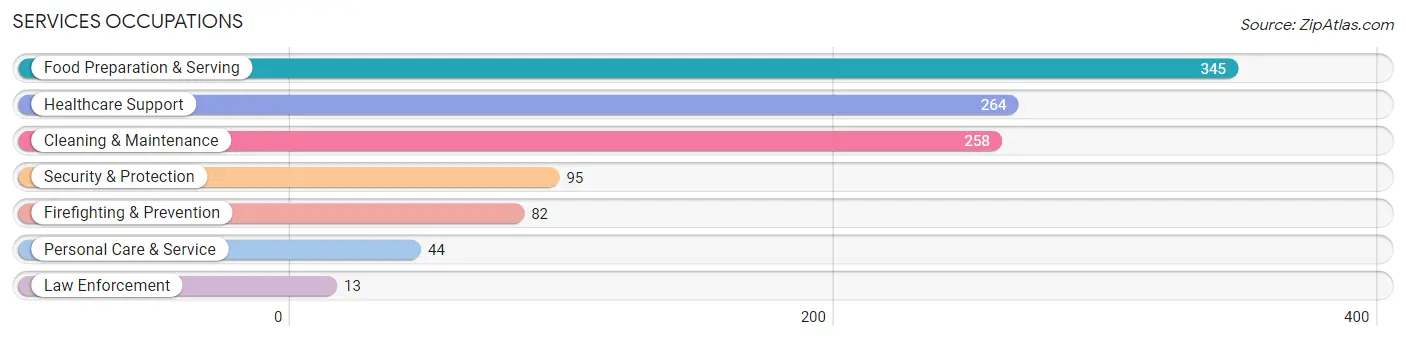
Services Occupations
The most common Services occupations in Home Gardens are Food Preparation & Serving (345 | 6.2%), Healthcare Support (264 | 4.8%), Cleaning & Maintenance (258 | 4.6%), Security & Protection (95 | 1.7%), and Firefighting & Prevention (82 | 1.5%).
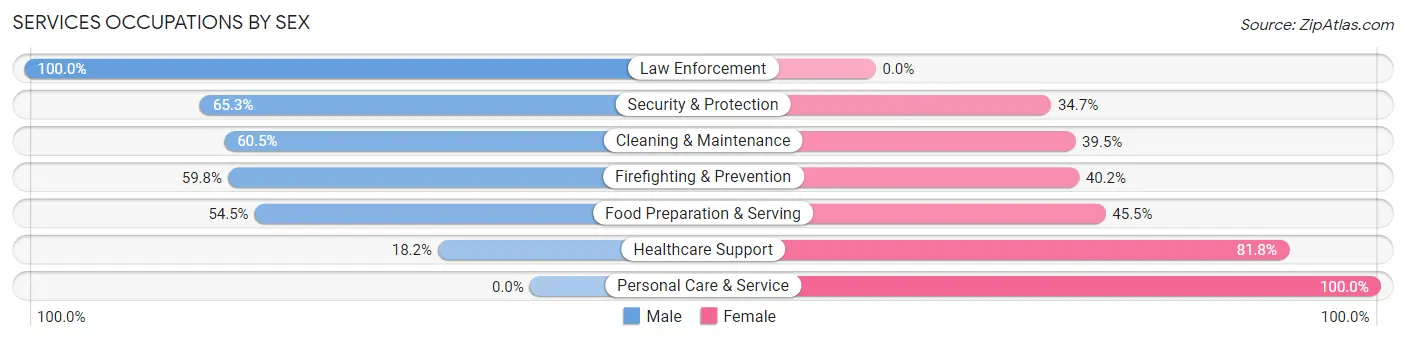
Services Occupations by Sex
Within the Services occupations in Home Gardens, the most male-oriented occupations are Law Enforcement (100.0%), Security & Protection (65.3%), and Cleaning & Maintenance (60.5%), while the most female-oriented occupations are Personal Care & Service (100.0%), Healthcare Support (81.8%), and Food Preparation & Serving (45.5%).
| Occupation | Male | Female |
| Healthcare Support | 48 (18.2%) | 216 (81.8%) |
| Security & Protection | 62 (65.3%) | 33 (34.7%) |
| Firefighting & Prevention | 49 (59.8%) | 33 (40.2%) |
| Law Enforcement | 13 (100.0%) | 0 (0.0%) |
| Food Preparation & Serving | 188 (54.5%) | 157 (45.5%) |
| Cleaning & Maintenance | 156 (60.5%) | 102 (39.5%) |
| Personal Care & Service | 0 (0.0%) | 44 (100.0%) |
| Total (Category) | 454 (45.1%) | 552 (54.9%) |
| Total (Overall) | 3,384 (61.0%) | 2,167 (39.0%) |
Sales and Office Occupations
The most common Sales and Office occupations in Home Gardens are Office & Administration (649 | 11.7%), and Sales & Related (364 | 6.6%).
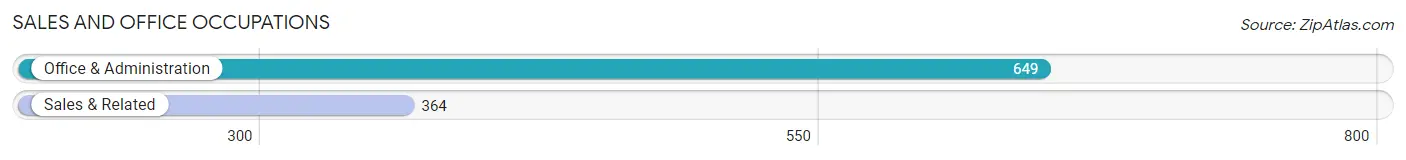
Sales and Office Occupations by Sex
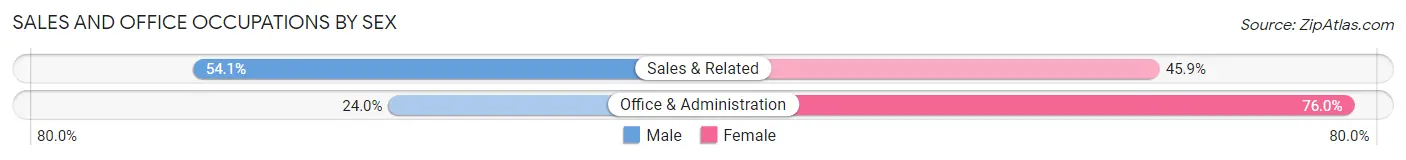
| Occupation | Male | Female |
| Sales & Related | 197 (54.1%) | 167 (45.9%) |
| Office & Administration | 156 (24.0%) | 493 (76.0%) |
| Total (Category) | 353 (34.8%) | 660 (65.1%) |
| Total (Overall) | 3,384 (61.0%) | 2,167 (39.0%) |
Natural Resources, Construction and Maintenance Occupations
The most common Natural Resources, Construction and Maintenance occupations in Home Gardens are Construction & Extraction (576 | 10.4%), Installation, Maintenance & Repair (201 | 3.6%), and Farming, Fishing & Forestry (10 | 0.2%).
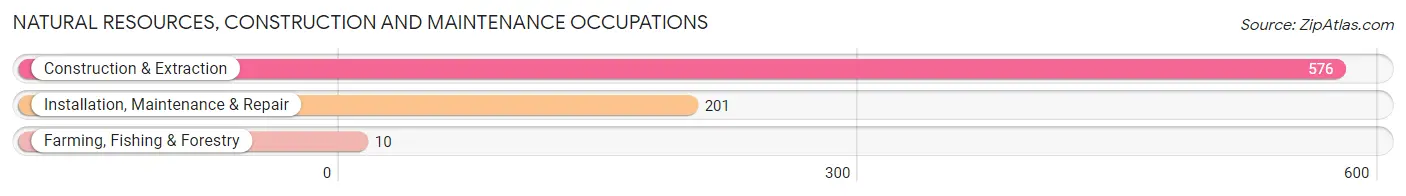
Natural Resources, Construction and Maintenance Occupations by Sex
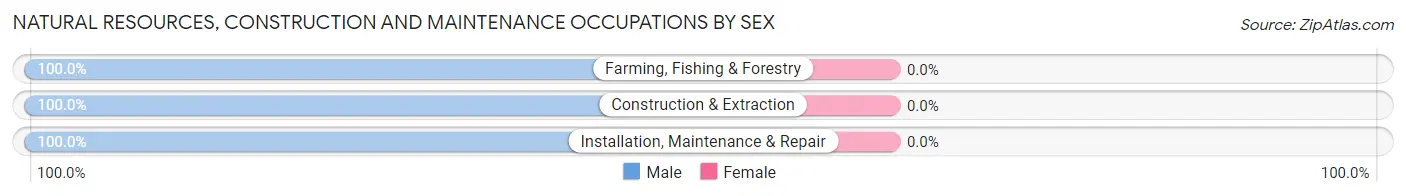
| Occupation | Male | Female |
| Farming, Fishing & Forestry | 10 (100.0%) | 0 (0.0%) |
| Construction & Extraction | 576 (100.0%) | 0 (0.0%) |
| Installation, Maintenance & Repair | 201 (100.0%) | 0 (0.0%) |
| Total (Category) | 787 (100.0%) | 0 (0.0%) |
| Total (Overall) | 3,384 (61.0%) | 2,167 (39.0%) |
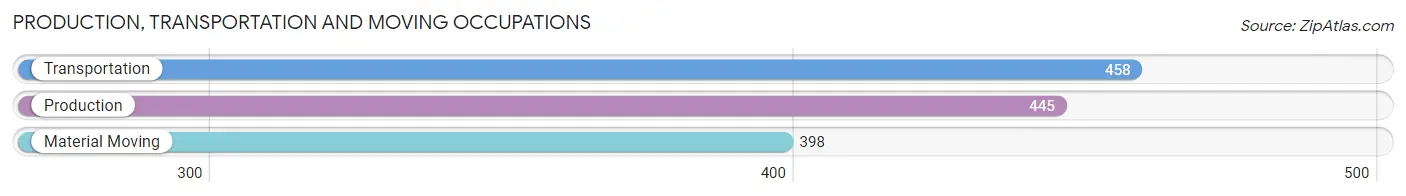
Production, Transportation and Moving Occupations
The most common Production, Transportation and Moving occupations in Home Gardens are Transportation (458 | 8.3%), Production (445 | 8.0%), and Material Moving (398 | 7.2%).
Production, Transportation and Moving Occupations by Sex
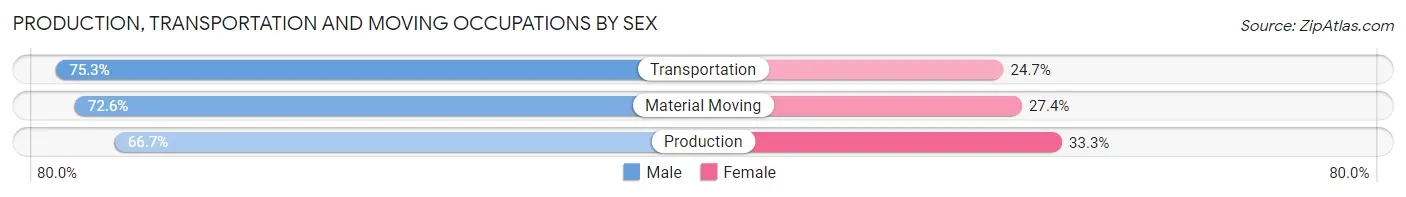
| Occupation | Male | Female |
| Production | 297 (66.7%) | 148 (33.3%) |
| Transportation | 345 (75.3%) | 113 (24.7%) |
| Material Moving | 289 (72.6%) | 109 (27.4%) |
| Total (Category) | 931 (71.6%) | 370 (28.4%) |
| Total (Overall) | 3,384 (61.0%) | 2,167 (39.0%) |
Employment Industries by Sex in Home Gardens
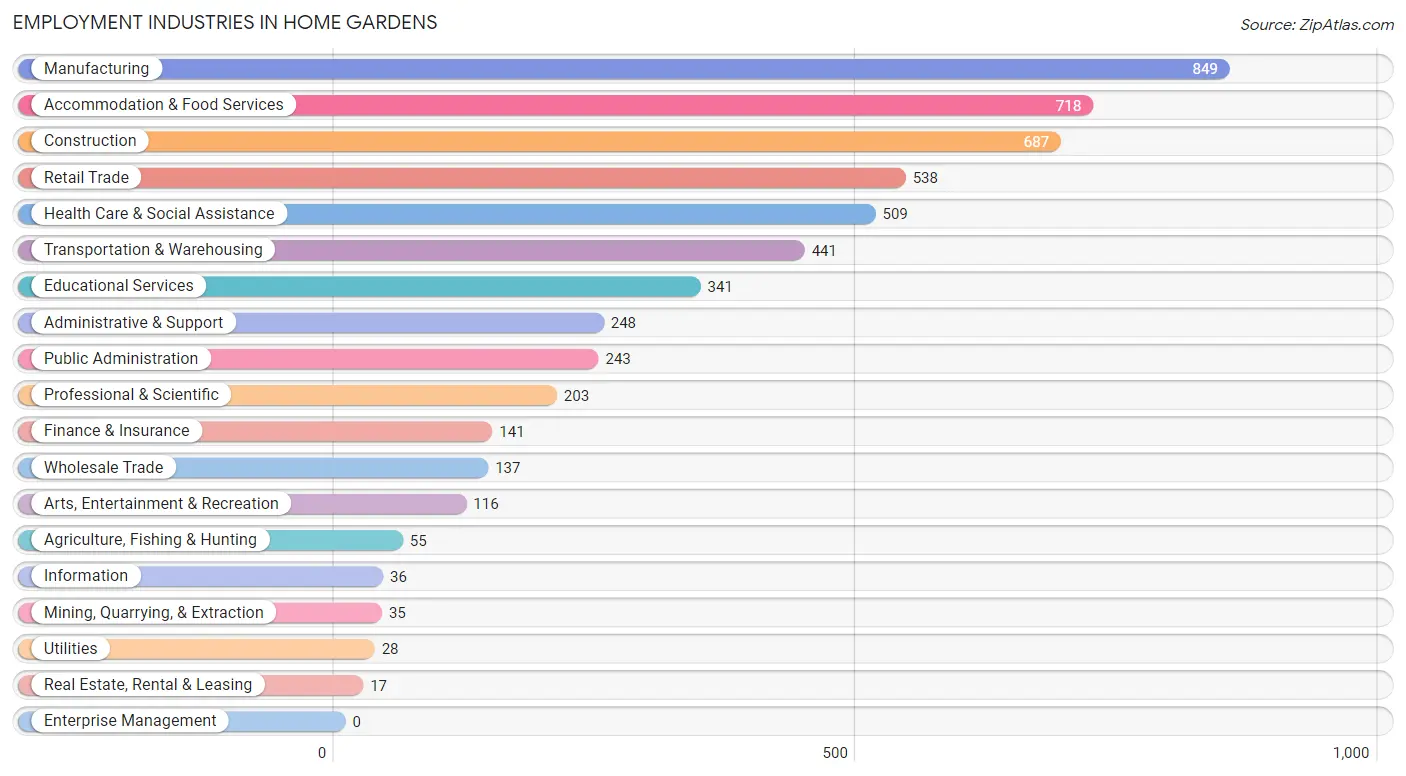
Employment Industries in Home Gardens
The major employment industries in Home Gardens include Manufacturing (849 | 15.3%), Accommodation & Food Services (718 | 12.9%), Construction (687 | 12.4%), Retail Trade (538 | 9.7%), and Health Care & Social Assistance (509 | 9.2%).
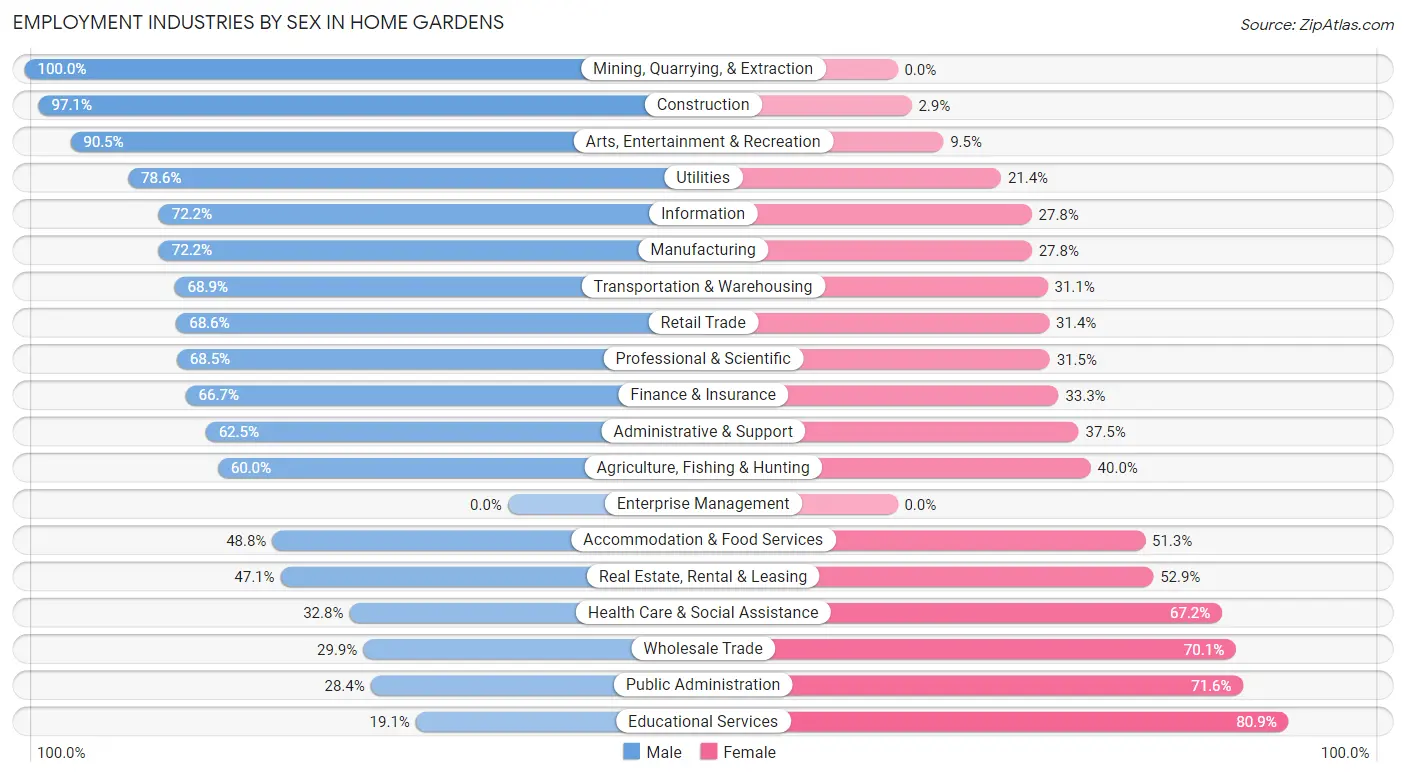
Employment Industries by Sex in Home Gardens
The Home Gardens industries that see more men than women are Mining, Quarrying, & Extraction (100.0%), Construction (97.1%), and Arts, Entertainment & Recreation (90.5%), whereas the industries that tend to have a higher number of women are Educational Services (80.9%), Public Administration (71.6%), and Wholesale Trade (70.1%).
| Industry | Male | Female |
| Agriculture, Fishing & Hunting | 33 (60.0%) | 22 (40.0%) |
| Mining, Quarrying, & Extraction | 35 (100.0%) | 0 (0.0%) |
| Construction | 667 (97.1%) | 20 (2.9%) |
| Manufacturing | 613 (72.2%) | 236 (27.8%) |
| Wholesale Trade | 41 (29.9%) | 96 (70.1%) |
| Retail Trade | 369 (68.6%) | 169 (31.4%) |
| Transportation & Warehousing | 304 (68.9%) | 137 (31.1%) |
| Utilities | 22 (78.6%) | 6 (21.4%) |
| Information | 26 (72.2%) | 10 (27.8%) |
| Finance & Insurance | 94 (66.7%) | 47 (33.3%) |
| Real Estate, Rental & Leasing | 8 (47.1%) | 9 (52.9%) |
| Professional & Scientific | 139 (68.5%) | 64 (31.5%) |
| Enterprise Management | 0 (0.0%) | 0 (0.0%) |
| Administrative & Support | 155 (62.5%) | 93 (37.5%) |
| Educational Services | 65 (19.1%) | 276 (80.9%) |
| Health Care & Social Assistance | 167 (32.8%) | 342 (67.2%) |
| Arts, Entertainment & Recreation | 105 (90.5%) | 11 (9.5%) |
| Accommodation & Food Services | 350 (48.7%) | 368 (51.2%) |
| Public Administration | 69 (28.4%) | 174 (71.6%) |
| Total | 3,384 (61.0%) | 2,167 (39.0%) |
Education in Home Gardens
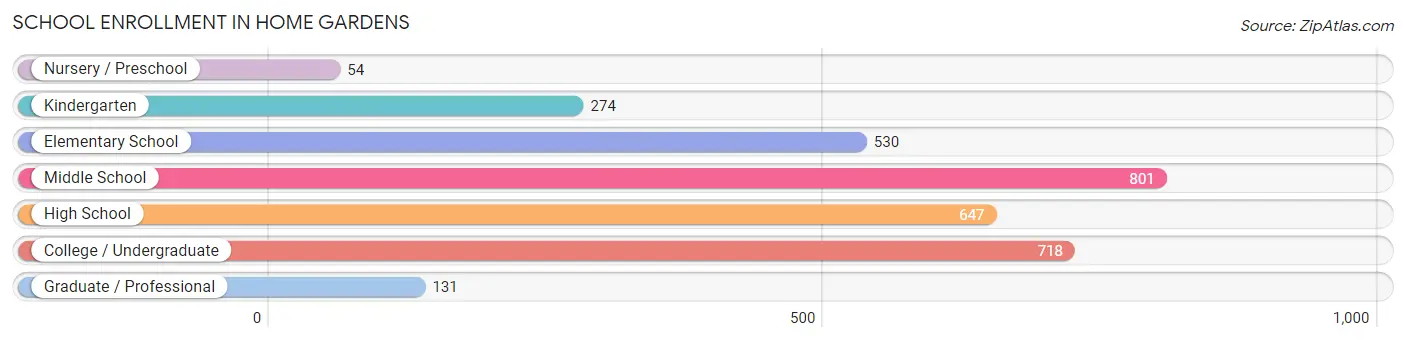
School Enrollment in Home Gardens
The most common levels of schooling among the 3,155 students in Home Gardens are middle school (801 | 25.4%), college / undergraduate (718 | 22.8%), and high school (647 | 20.5%).
| School Level | # Students | % Students |
| Nursery / Preschool | 54 | 1.7% |
| Kindergarten | 274 | 8.7% |
| Elementary School | 530 | 16.8% |
| Middle School | 801 | 25.4% |
| High School | 647 | 20.5% |
| College / Undergraduate | 718 | 22.8% |
| Graduate / Professional | 131 | 4.2% |
| Total | 3,155 | 100.0% |
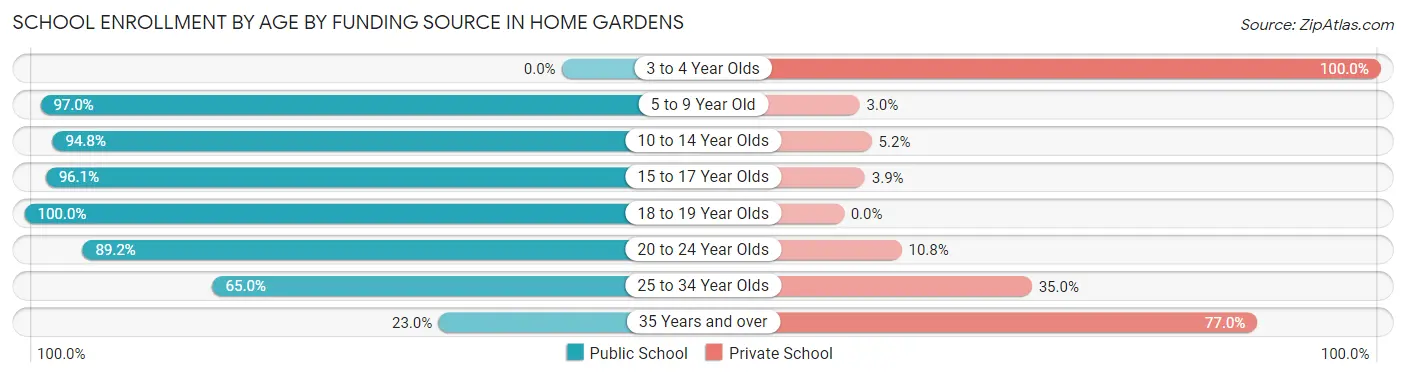
School Enrollment by Age by Funding Source in Home Gardens
Out of a total of 3,155 students who are enrolled in schools in Home Gardens, 274 (8.7%) attend a private institution, while the remaining 2,881 (91.3%) are enrolled in public schools. The age group of 3 to 4 year olds has the highest likelihood of being enrolled in private schools, with 6 (100.0% in the age bracket) enrolled. Conversely, the age group of 18 to 19 year olds has the lowest likelihood of being enrolled in a private school, with 267 (100.0% in the age bracket) attending a public institution.
| Age Bracket | Public School | Private School |
| 3 to 4 Year Olds | 0 (0.0%) | 6 (100.0%) |
| 5 to 9 Year Old | 754 (97.0%) | 23 (3.0%) |
| 10 to 14 Year Olds | 965 (94.8%) | 53 (5.2%) |
| 15 to 17 Year Olds | 415 (96.1%) | 17 (3.9%) |
| 18 to 19 Year Olds | 267 (100.0%) | 0 (0.0%) |
| 20 to 24 Year Olds | 331 (89.2%) | 40 (10.8%) |
| 25 to 34 Year Olds | 128 (65.0%) | 69 (35.0%) |
| 35 Years and over | 20 (23.0%) | 67 (77.0%) |
| Total | 2,881 (91.3%) | 274 (8.7%) |
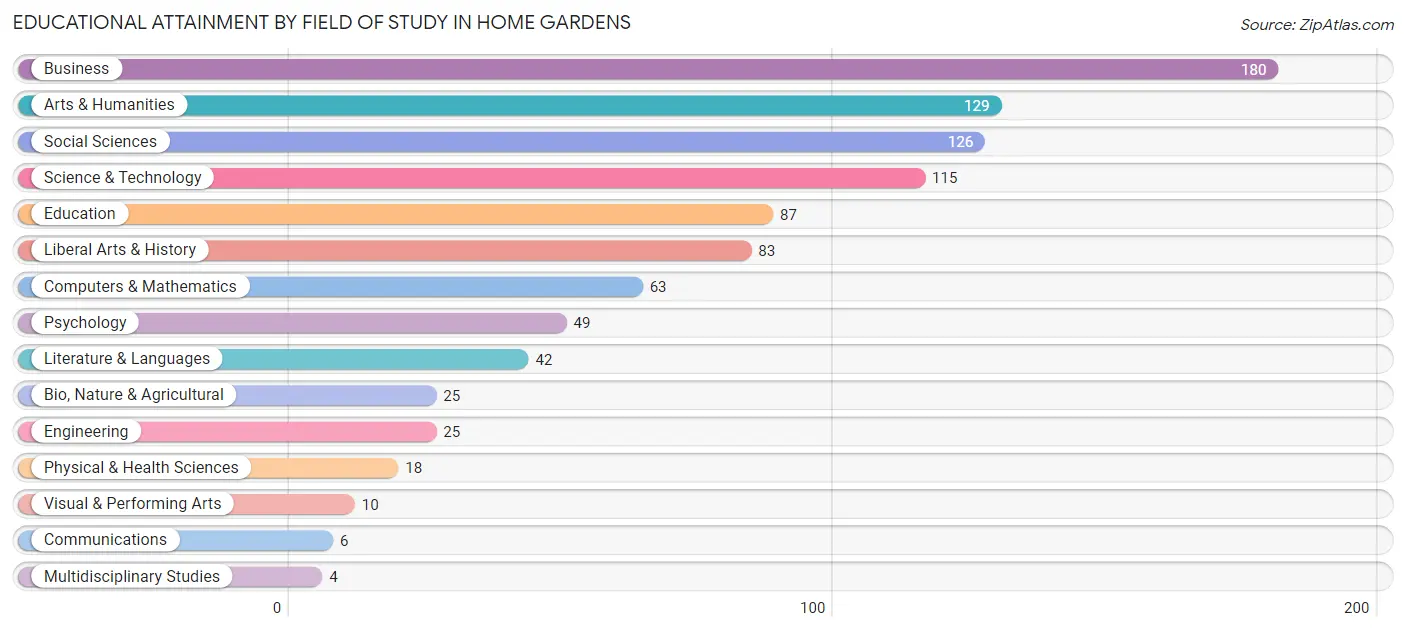
Educational Attainment by Field of Study in Home Gardens
Business (180 | 18.7%), arts & humanities (129 | 13.4%), social sciences (126 | 13.1%), science & technology (115 | 11.9%), and education (87 | 9.0%) are the most common fields of study among 962 individuals in Home Gardens who have obtained a bachelor's degree or higher.
| Field of Study | # Graduates | % Graduates |
| Computers & Mathematics | 63 | 6.6% |
| Bio, Nature & Agricultural | 25 | 2.6% |
| Physical & Health Sciences | 18 | 1.9% |
| Psychology | 49 | 5.1% |
| Social Sciences | 126 | 13.1% |
| Engineering | 25 | 2.6% |
| Multidisciplinary Studies | 4 | 0.4% |
| Science & Technology | 115 | 11.9% |
| Business | 180 | 18.7% |
| Education | 87 | 9.0% |
| Literature & Languages | 42 | 4.4% |
| Liberal Arts & History | 83 | 8.6% |
| Visual & Performing Arts | 10 | 1.0% |
| Communications | 6 | 0.6% |
| Arts & Humanities | 129 | 13.4% |
| Total | 962 | 100.0% |
Transportation & Commute in Home Gardens
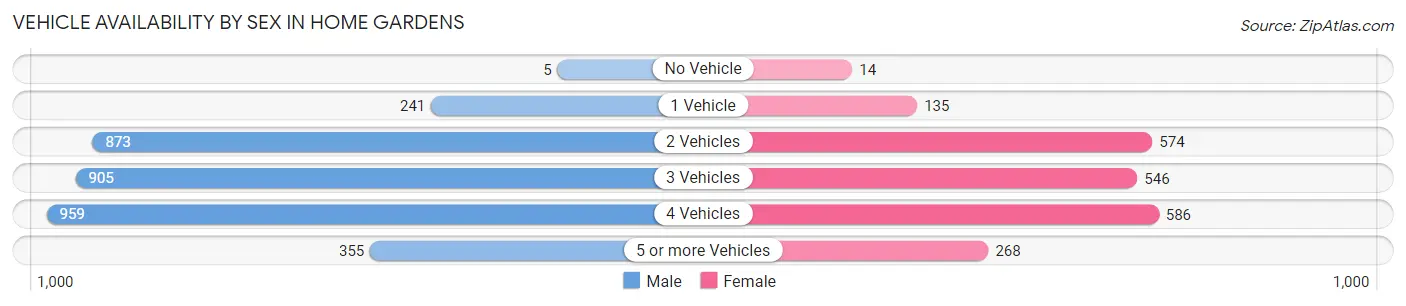
Vehicle Availability by Sex in Home Gardens
The most prevalent vehicle ownership categories in Home Gardens are males with 4 vehicles (959, accounting for 28.7%) and females with 4 vehicles (586, making up 45.2%).
| Vehicles Available | Male | Female |
| No Vehicle | 5 (0.2%) | 14 (0.7%) |
| 1 Vehicle | 241 (7.2%) | 135 (6.4%) |
| 2 Vehicles | 873 (26.2%) | 574 (27.0%) |
| 3 Vehicles | 905 (27.1%) | 546 (25.7%) |
| 4 Vehicles | 959 (28.7%) | 586 (27.6%) |
| 5 or more Vehicles | 355 (10.6%) | 268 (12.6%) |
| Total | 3,338 (100.0%) | 2,123 (100.0%) |
Commute Time in Home Gardens
The most frequently occuring commute durations in Home Gardens are 30 to 34 minutes (910 commuters, 17.8%), 60 to 89 minutes (882 commuters, 17.3%), and 20 to 24 minutes (717 commuters, 14.1%).
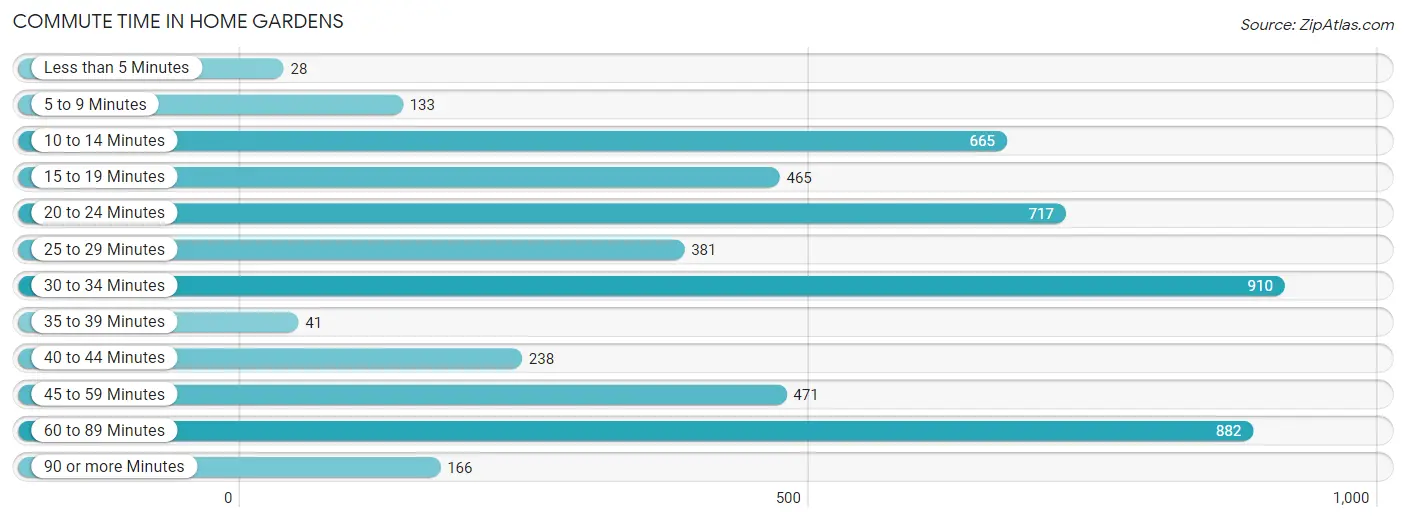
| Commute Time | # Commuters | % Commuters |
| Less than 5 Minutes | 28 | 0.5% |
| 5 to 9 Minutes | 133 | 2.6% |
| 10 to 14 Minutes | 665 | 13.1% |
| 15 to 19 Minutes | 465 | 9.1% |
| 20 to 24 Minutes | 717 | 14.1% |
| 25 to 29 Minutes | 381 | 7.5% |
| 30 to 34 Minutes | 910 | 17.8% |
| 35 to 39 Minutes | 41 | 0.8% |
| 40 to 44 Minutes | 238 | 4.7% |
| 45 to 59 Minutes | 471 | 9.2% |
| 60 to 89 Minutes | 882 | 17.3% |
| 90 or more Minutes | 166 | 3.3% |
Commute Time by Sex in Home Gardens
The most common commute times in Home Gardens are 60 to 89 minutes (716 commuters, 22.3%) for males and 20 to 24 minutes (411 commuters, 21.8%) for females.
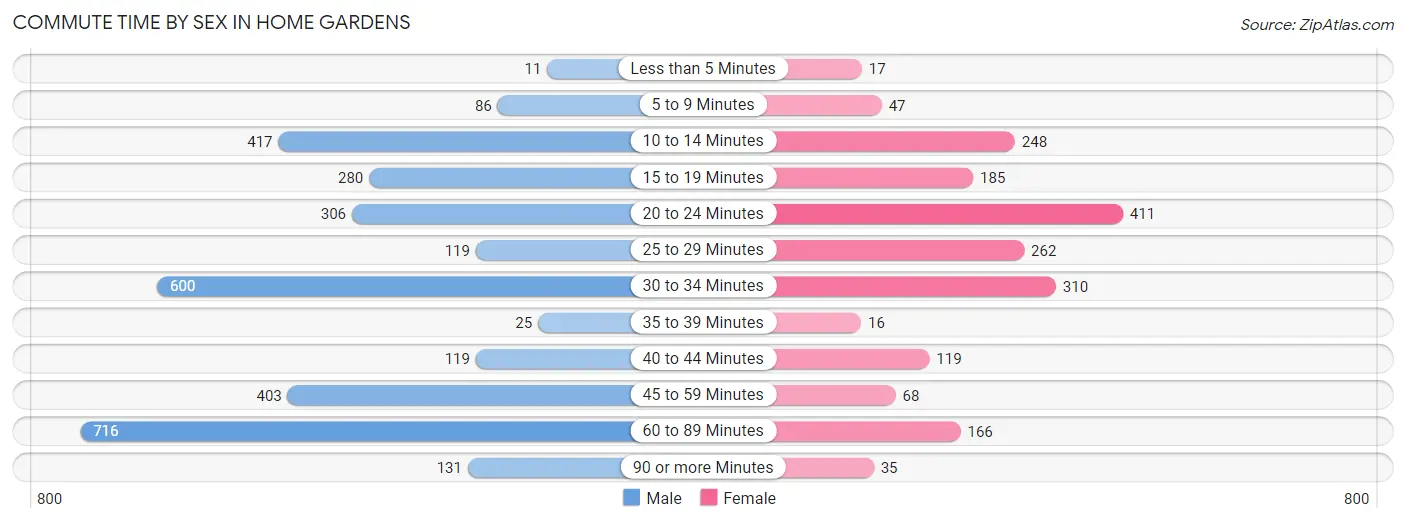
| Commute Time | Male | Female |
| Less than 5 Minutes | 11 (0.3%) | 17 (0.9%) |
| 5 to 9 Minutes | 86 (2.7%) | 47 (2.5%) |
| 10 to 14 Minutes | 417 (13.0%) | 248 (13.2%) |
| 15 to 19 Minutes | 280 (8.7%) | 185 (9.8%) |
| 20 to 24 Minutes | 306 (9.5%) | 411 (21.8%) |
| 25 to 29 Minutes | 119 (3.7%) | 262 (13.9%) |
| 30 to 34 Minutes | 600 (18.7%) | 310 (16.5%) |
| 35 to 39 Minutes | 25 (0.8%) | 16 (0.9%) |
| 40 to 44 Minutes | 119 (3.7%) | 119 (6.3%) |
| 45 to 59 Minutes | 403 (12.5%) | 68 (3.6%) |
| 60 to 89 Minutes | 716 (22.3%) | 166 (8.8%) |
| 90 or more Minutes | 131 (4.1%) | 35 (1.9%) |
Time of Departure to Work by Sex in Home Gardens
The most frequent times of departure to work in Home Gardens are 12:00 AM to 4:59 AM (783, 24.4%) for males and 12:00 PM to 3:59 PM (316, 16.8%) for females.
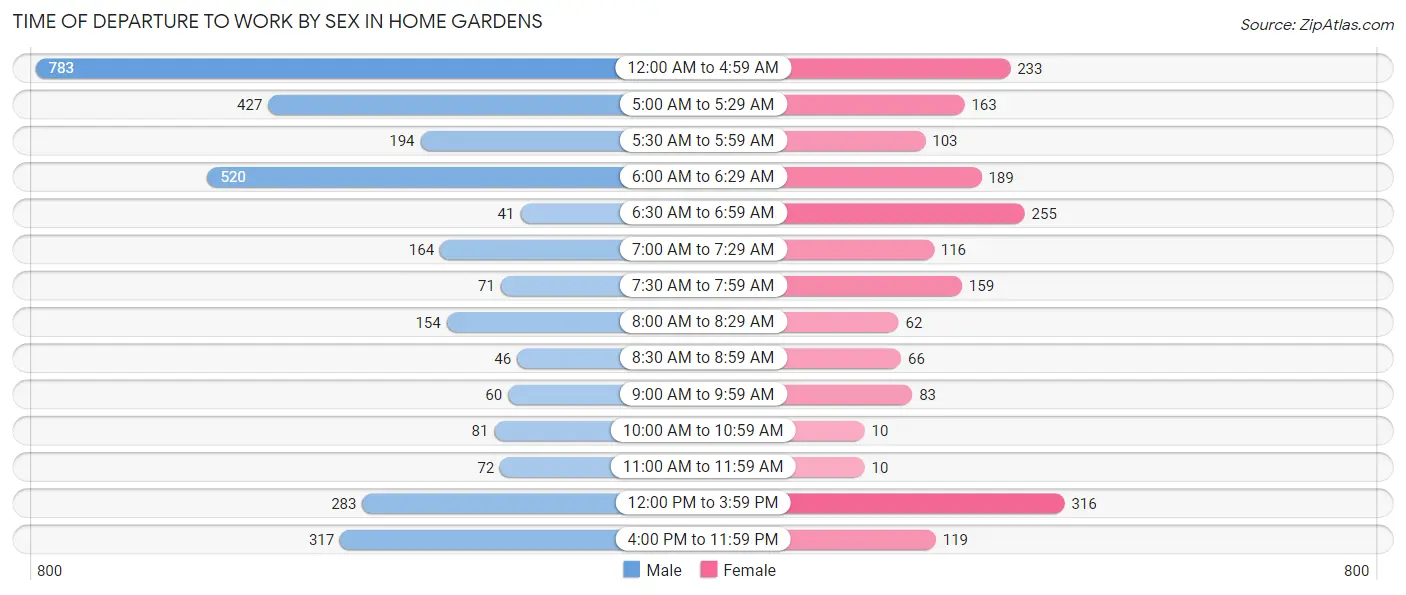
| Time of Departure | Male | Female |
| 12:00 AM to 4:59 AM | 783 (24.4%) | 233 (12.4%) |
| 5:00 AM to 5:29 AM | 427 (13.3%) | 163 (8.6%) |
| 5:30 AM to 5:59 AM | 194 (6.0%) | 103 (5.5%) |
| 6:00 AM to 6:29 AM | 520 (16.2%) | 189 (10.0%) |
| 6:30 AM to 6:59 AM | 41 (1.3%) | 255 (13.5%) |
| 7:00 AM to 7:29 AM | 164 (5.1%) | 116 (6.2%) |
| 7:30 AM to 7:59 AM | 71 (2.2%) | 159 (8.4%) |
| 8:00 AM to 8:29 AM | 154 (4.8%) | 62 (3.3%) |
| 8:30 AM to 8:59 AM | 46 (1.4%) | 66 (3.5%) |
| 9:00 AM to 9:59 AM | 60 (1.9%) | 83 (4.4%) |
| 10:00 AM to 10:59 AM | 81 (2.5%) | 10 (0.5%) |
| 11:00 AM to 11:59 AM | 72 (2.2%) | 10 (0.5%) |
| 12:00 PM to 3:59 PM | 283 (8.8%) | 316 (16.8%) |
| 4:00 PM to 11:59 PM | 317 (9.9%) | 119 (6.3%) |
| Total | 3,213 (100.0%) | 1,884 (100.0%) |
Housing Occupancy in Home Gardens
Occupancy by Ownership in Home Gardens
Of the total 2,986 dwellings in Home Gardens, owner-occupied units account for 2,340 (78.4%), while renter-occupied units make up 646 (21.6%).
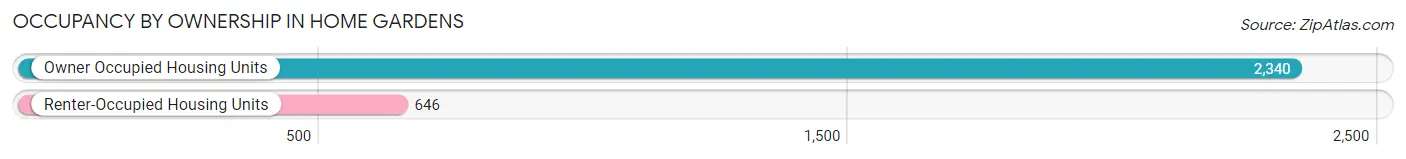
| Occupancy | # Housing Units | % Housing Units |
| Owner Occupied Housing Units | 2,340 | 78.4% |
| Renter-Occupied Housing Units | 646 | 21.6% |
| Total Occupied Housing Units | 2,986 | 100.0% |
Occupancy by Household Size in Home Gardens
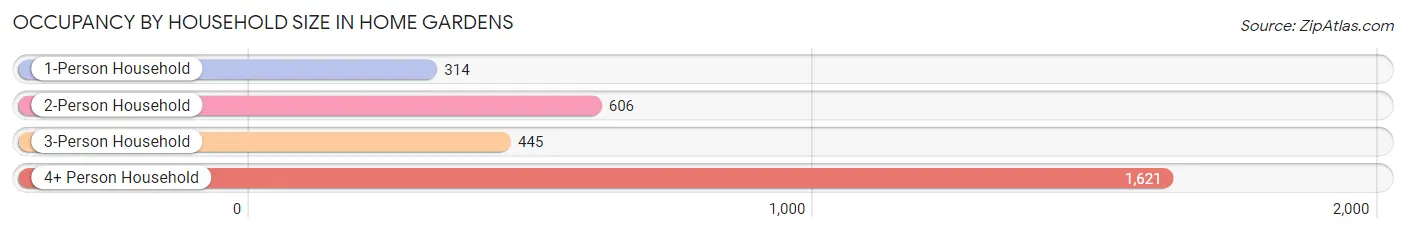
| Household Size | # Housing Units | % Housing Units |
| 1-Person Household | 314 | 10.5% |
| 2-Person Household | 606 | 20.3% |
| 3-Person Household | 445 | 14.9% |
| 4+ Person Household | 1,621 | 54.3% |
| Total Housing Units | 2,986 | 100.0% |
Occupancy by Ownership by Household Size in Home Gardens
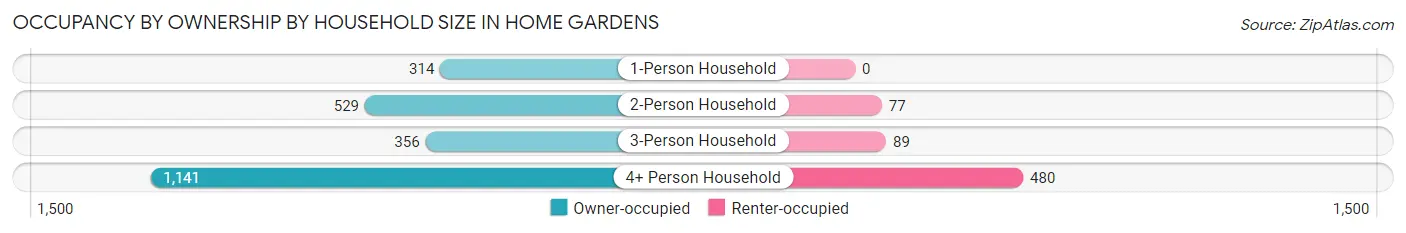
| Household Size | Owner-occupied | Renter-occupied |
| 1-Person Household | 314 (100.0%) | 0 (0.0%) |
| 2-Person Household | 529 (87.3%) | 77 (12.7%) |
| 3-Person Household | 356 (80.0%) | 89 (20.0%) |
| 4+ Person Household | 1,141 (70.4%) | 480 (29.6%) |
| Total Housing Units | 2,340 (78.4%) | 646 (21.6%) |
Occupancy by Educational Attainment in Home Gardens
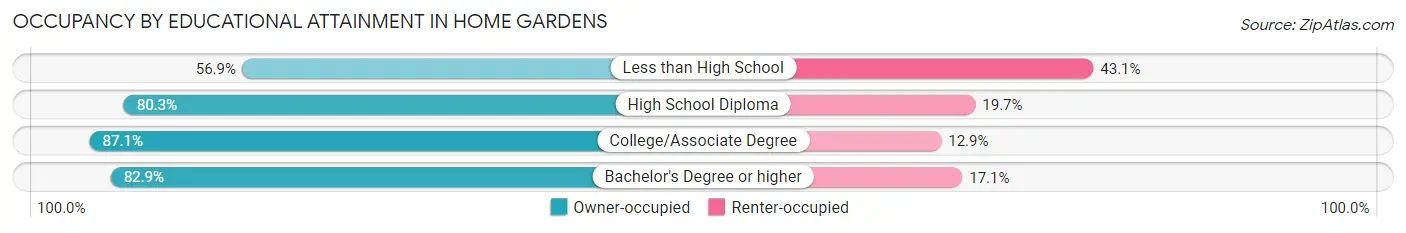
| Household Size | Owner-occupied | Renter-occupied |
| Less than High School | 353 (56.9%) | 267 (43.1%) |
| High School Diploma | 674 (80.3%) | 165 (19.7%) |
| College/Associate Degree | 978 (87.1%) | 145 (12.9%) |
| Bachelor's Degree or higher | 335 (82.9%) | 69 (17.1%) |
Occupancy by Age of Householder in Home Gardens
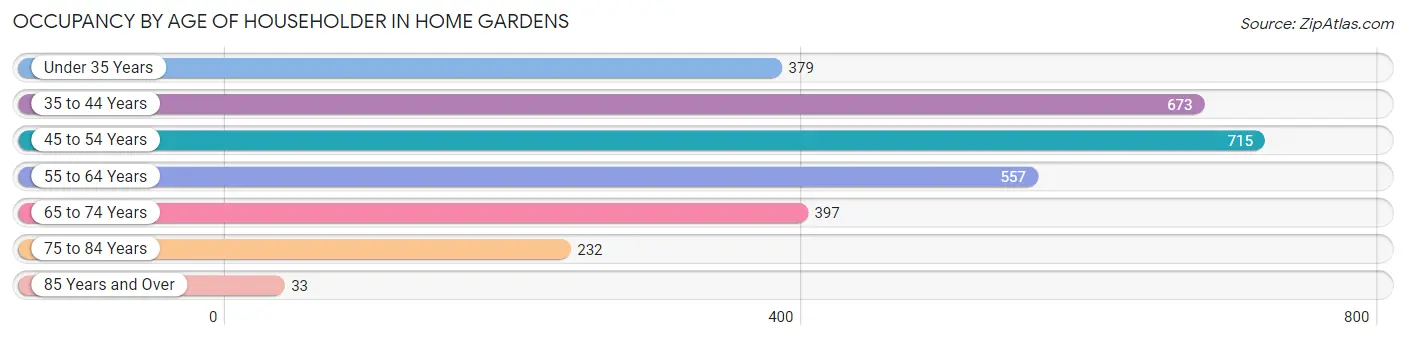
| Age Bracket | # Households | % Households |
| Under 35 Years | 379 | 12.7% |
| 35 to 44 Years | 673 | 22.5% |
| 45 to 54 Years | 715 | 23.9% |
| 55 to 64 Years | 557 | 18.6% |
| 65 to 74 Years | 397 | 13.3% |
| 75 to 84 Years | 232 | 7.8% |
| 85 Years and Over | 33 | 1.1% |
| Total | 2,986 | 100.0% |
Housing Finances in Home Gardens
Median Income by Occupancy in Home Gardens
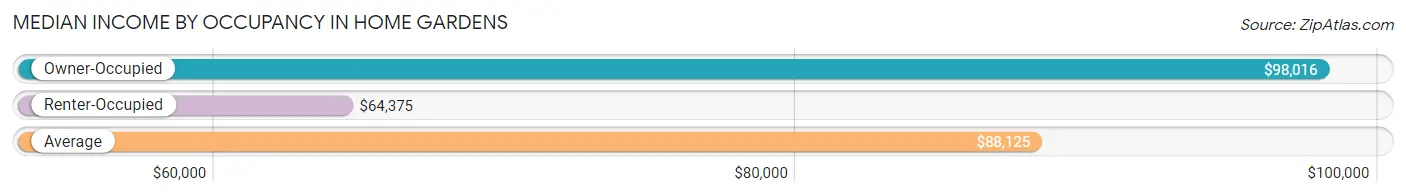
| Occupancy Type | # Households | Median Income |
| Owner-Occupied | 2,340 (78.4%) | $98,016 |
| Renter-Occupied | 646 (21.6%) | $64,375 |
| Average | 2,986 (100.0%) | $88,125 |
Occupancy by Householder Income Bracket in Home Gardens
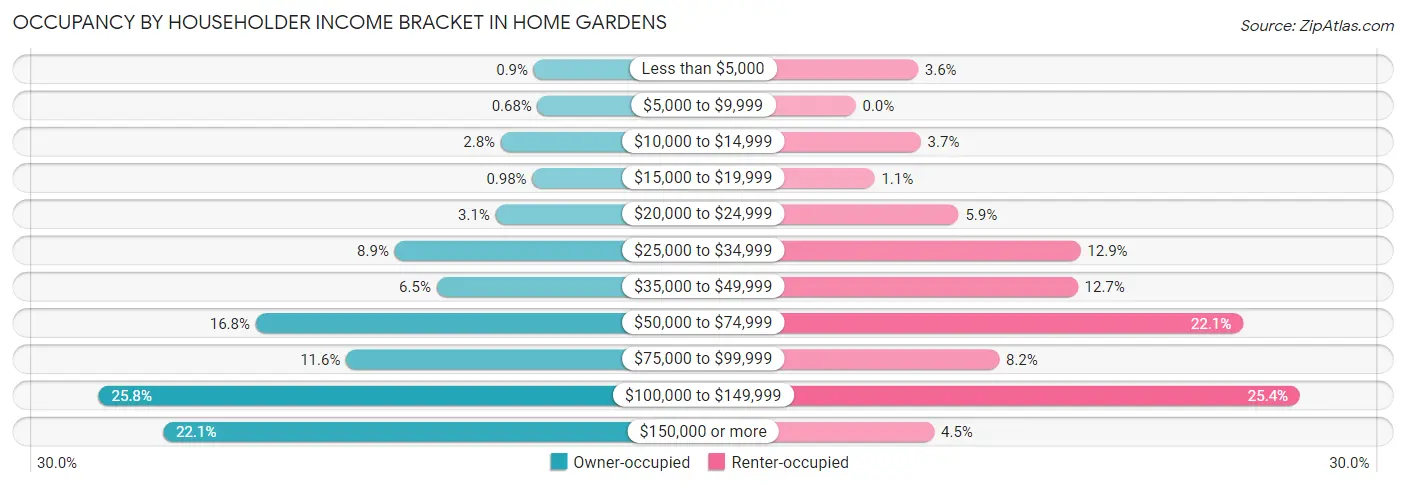
| Income Bracket | Owner-occupied | Renter-occupied |
| Less than $5,000 | 21 (0.9%) | 23 (3.6%) |
| $5,000 to $9,999 | 16 (0.7%) | 0 (0.0%) |
| $10,000 to $14,999 | 65 (2.8%) | 24 (3.7%) |
| $15,000 to $19,999 | 23 (1.0%) | 7 (1.1%) |
| $20,000 to $24,999 | 72 (3.1%) | 38 (5.9%) |
| $25,000 to $34,999 | 207 (8.8%) | 83 (12.9%) |
| $35,000 to $49,999 | 151 (6.5%) | 82 (12.7%) |
| $50,000 to $74,999 | 393 (16.8%) | 143 (22.1%) |
| $75,000 to $99,999 | 272 (11.6%) | 53 (8.2%) |
| $100,000 to $149,999 | 603 (25.8%) | 164 (25.4%) |
| $150,000 or more | 517 (22.1%) | 29 (4.5%) |
| Total | 2,340 (100.0%) | 646 (100.0%) |
Monthly Housing Cost Tiers in Home Gardens
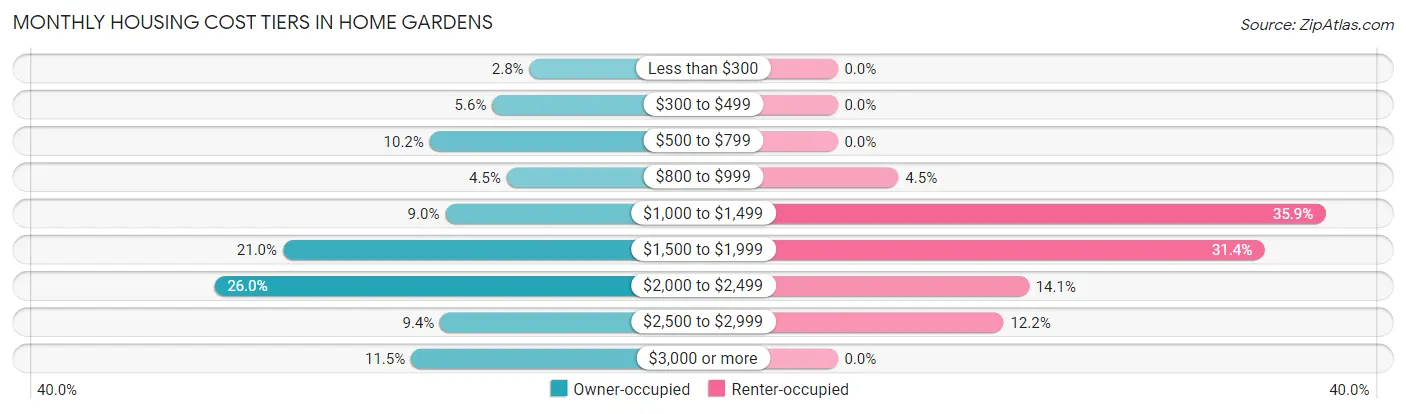
| Monthly Cost | Owner-occupied | Renter-occupied |
| Less than $300 | 66 (2.8%) | 0 (0.0%) |
| $300 to $499 | 130 (5.6%) | 0 (0.0%) |
| $500 to $799 | 238 (10.2%) | 0 (0.0%) |
| $800 to $999 | 105 (4.5%) | 29 (4.5%) |
| $1,000 to $1,499 | 211 (9.0%) | 232 (35.9%) |
| $1,500 to $1,999 | 491 (21.0%) | 203 (31.4%) |
| $2,000 to $2,499 | 609 (26.0%) | 91 (14.1%) |
| $2,500 to $2,999 | 220 (9.4%) | 79 (12.2%) |
| $3,000 or more | 270 (11.5%) | 0 (0.0%) |
| Total | 2,340 (100.0%) | 646 (100.0%) |
Physical Housing Characteristics in Home Gardens
Housing Structures in Home Gardens
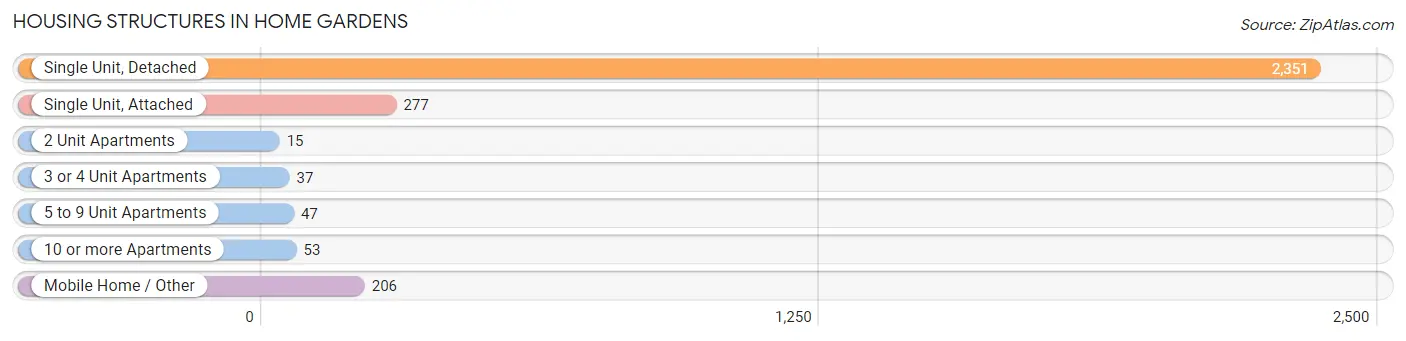
| Structure Type | # Housing Units | % Housing Units |
| Single Unit, Detached | 2,351 | 78.7% |
| Single Unit, Attached | 277 | 9.3% |
| 2 Unit Apartments | 15 | 0.5% |
| 3 or 4 Unit Apartments | 37 | 1.2% |
| 5 to 9 Unit Apartments | 47 | 1.6% |
| 10 or more Apartments | 53 | 1.8% |
| Mobile Home / Other | 206 | 6.9% |
| Total | 2,986 | 100.0% |
Housing Structures by Occupancy in Home Gardens
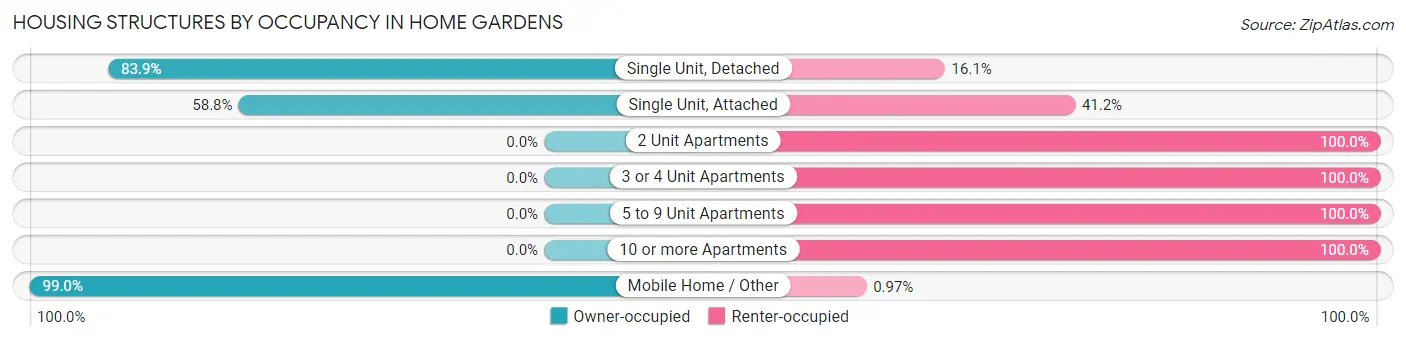
| Structure Type | Owner-occupied | Renter-occupied |
| Single Unit, Detached | 1,973 (83.9%) | 378 (16.1%) |
| Single Unit, Attached | 163 (58.8%) | 114 (41.2%) |
| 2 Unit Apartments | 0 (0.0%) | 15 (100.0%) |
| 3 or 4 Unit Apartments | 0 (0.0%) | 37 (100.0%) |
| 5 to 9 Unit Apartments | 0 (0.0%) | 47 (100.0%) |
| 10 or more Apartments | 0 (0.0%) | 53 (100.0%) |
| Mobile Home / Other | 204 (99.0%) | 2 (1.0%) |
| Total | 2,340 (78.4%) | 646 (21.6%) |
Housing Structures by Number of Rooms in Home Gardens
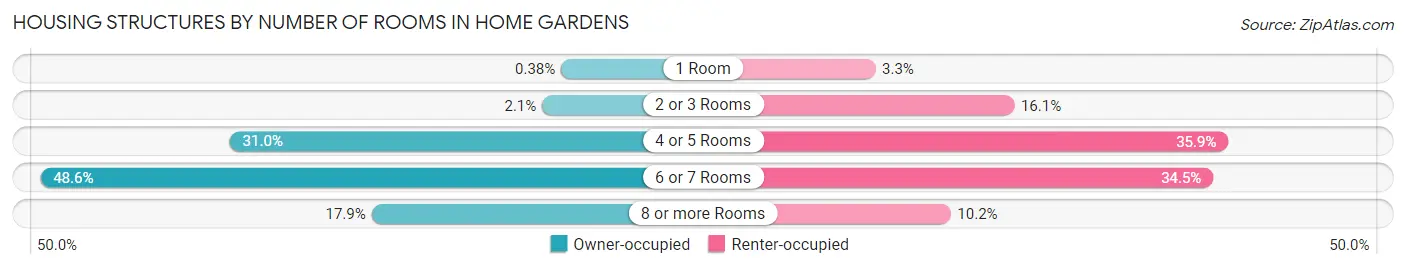
| Number of Rooms | Owner-occupied | Renter-occupied |
| 1 Room | 9 (0.4%) | 21 (3.3%) |
| 2 or 3 Rooms | 50 (2.1%) | 104 (16.1%) |
| 4 or 5 Rooms | 726 (31.0%) | 232 (35.9%) |
| 6 or 7 Rooms | 1,136 (48.5%) | 223 (34.5%) |
| 8 or more Rooms | 419 (17.9%) | 66 (10.2%) |
| Total | 2,340 (100.0%) | 646 (100.0%) |
Housing Structure by Heating Type in Home Gardens
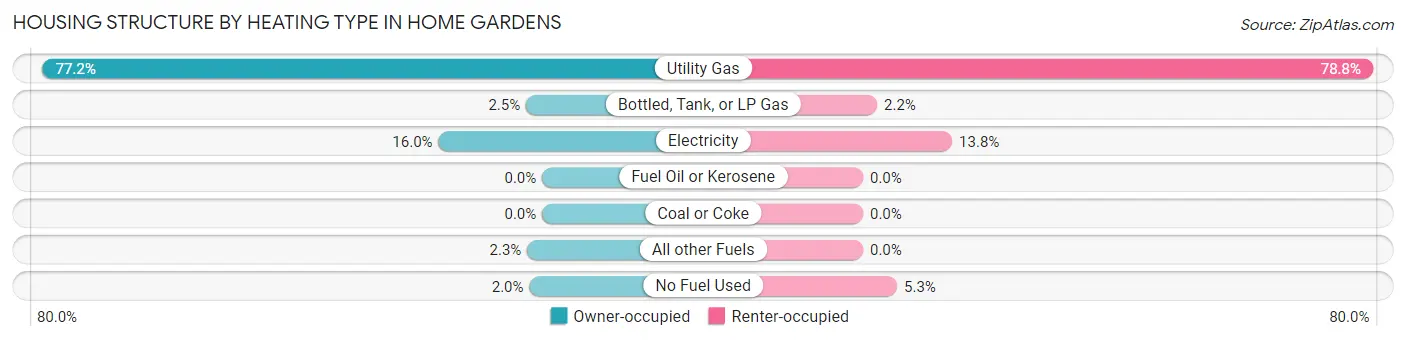
| Heating Type | Owner-occupied | Renter-occupied |
| Utility Gas | 1,807 (77.2%) | 509 (78.8%) |
| Bottled, Tank, or LP Gas | 58 (2.5%) | 14 (2.2%) |
| Electricity | 375 (16.0%) | 89 (13.8%) |
| Fuel Oil or Kerosene | 0 (0.0%) | 0 (0.0%) |
| Coal or Coke | 0 (0.0%) | 0 (0.0%) |
| All other Fuels | 54 (2.3%) | 0 (0.0%) |
| No Fuel Used | 46 (2.0%) | 34 (5.3%) |
| Total | 2,340 (100.0%) | 646 (100.0%) |
Household Vehicle Usage in Home Gardens
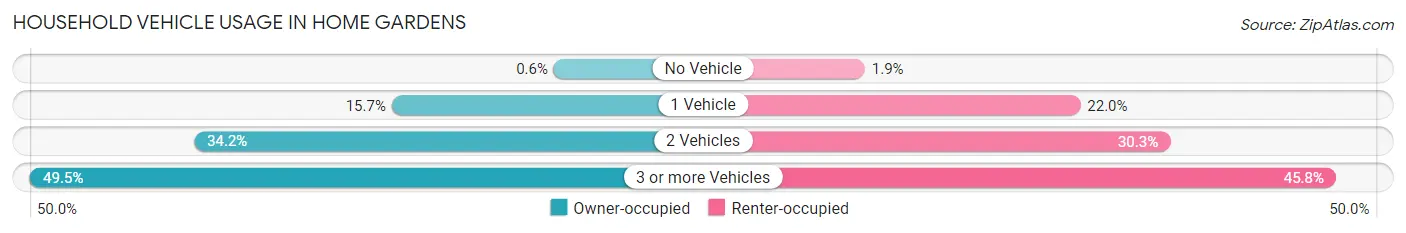
| Vehicles per Household | Owner-occupied | Renter-occupied |
| No Vehicle | 14 (0.6%) | 12 (1.9%) |
| 1 Vehicle | 368 (15.7%) | 142 (22.0%) |
| 2 Vehicles | 800 (34.2%) | 196 (30.3%) |
| 3 or more Vehicles | 1,158 (49.5%) | 296 (45.8%) |
| Total | 2,340 (100.0%) | 646 (100.0%) |
Real Estate & Mortgages in Home Gardens
Real Estate and Mortgage Overview in Home Gardens
| Characteristic | Without Mortgage | With Mortgage |
| Housing Units | 656 | 1,684 |
| Median Property Value | $445,600 | $488,900 |
| Median Household Income | $83,333 | $395 |
| Monthly Housing Costs | $564 | $252 |
| Real Estate Taxes | $2,274 | $10 |
Property Value by Mortgage Status in Home Gardens
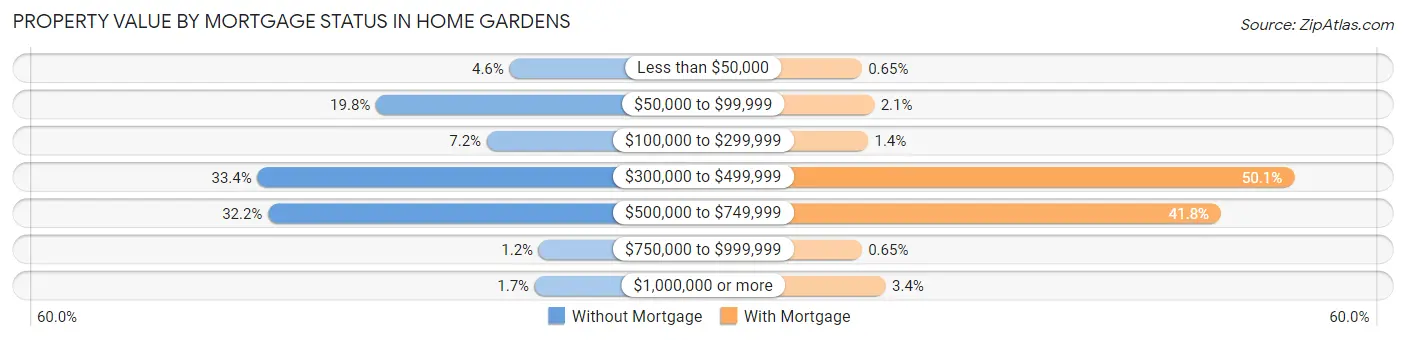
| Property Value | Without Mortgage | With Mortgage |
| Less than $50,000 | 30 (4.6%) | 11 (0.6%) |
| $50,000 to $99,999 | 130 (19.8%) | 35 (2.1%) |
| $100,000 to $299,999 | 47 (7.2%) | 23 (1.4%) |
| $300,000 to $499,999 | 219 (33.4%) | 844 (50.1%) |
| $500,000 to $749,999 | 211 (32.2%) | 703 (41.7%) |
| $750,000 to $999,999 | 8 (1.2%) | 11 (0.6%) |
| $1,000,000 or more | 11 (1.7%) | 57 (3.4%) |
| Total | 656 (100.0%) | 1,684 (100.0%) |
Household Income by Mortgage Status in Home Gardens
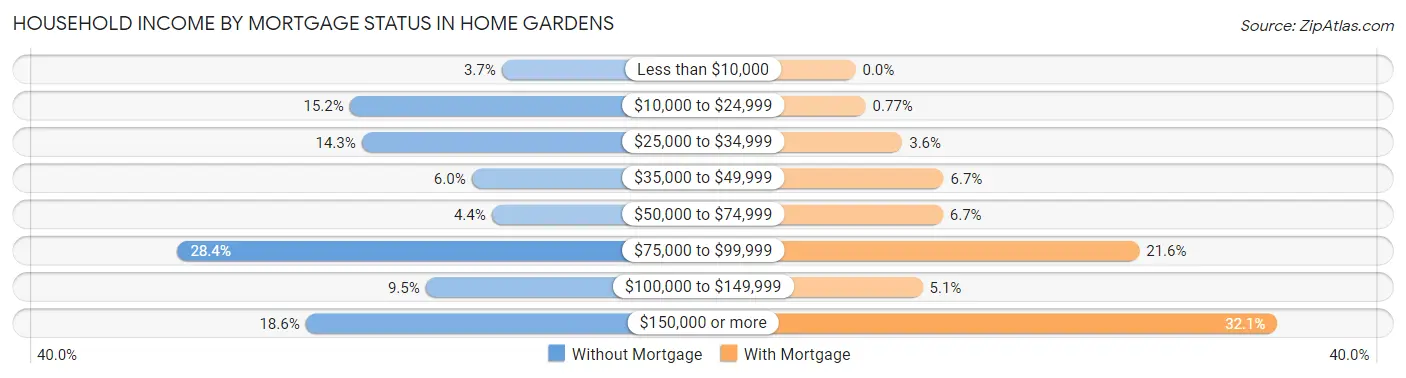
| Household Income | Without Mortgage | With Mortgage |
| Less than $10,000 | 24 (3.7%) | 0 (0.0%) |
| $10,000 to $24,999 | 100 (15.2%) | 13 (0.8%) |
| $25,000 to $34,999 | 94 (14.3%) | 60 (3.6%) |
| $35,000 to $49,999 | 39 (5.9%) | 113 (6.7%) |
| $50,000 to $74,999 | 29 (4.4%) | 112 (6.7%) |
| $75,000 to $99,999 | 186 (28.3%) | 364 (21.6%) |
| $100,000 to $149,999 | 62 (9.5%) | 86 (5.1%) |
| $150,000 or more | 122 (18.6%) | 541 (32.1%) |
| Total | 656 (100.0%) | 1,684 (100.0%) |
Property Value to Household Income Ratio in Home Gardens
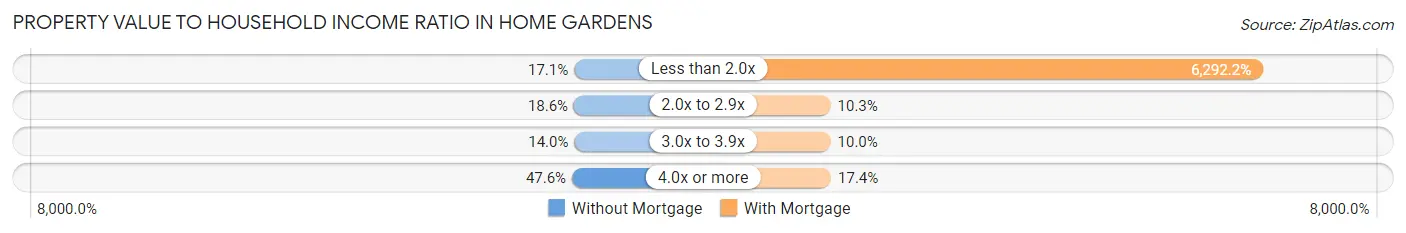
| Value-to-Income Ratio | Without Mortgage | With Mortgage |
| Less than 2.0x | 112 (17.1%) | 105,960 (6,292.2%) |
| 2.0x to 2.9x | 122 (18.6%) | 173 (10.3%) |
| 3.0x to 3.9x | 92 (14.0%) | 168 (10.0%) |
| 4.0x or more | 312 (47.6%) | 293 (17.4%) |
| Total | 656 (100.0%) | 1,684 (100.0%) |
Real Estate Taxes by Mortgage Status in Home Gardens
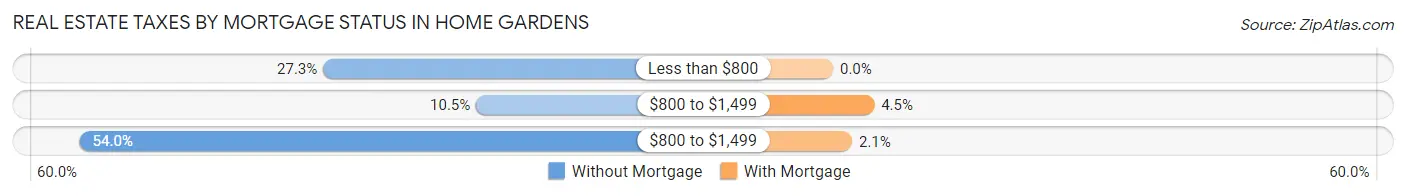
| Property Taxes | Without Mortgage | With Mortgage |
| Less than $800 | 179 (27.3%) | 0 (0.0%) |
| $800 to $1,499 | 69 (10.5%) | 76 (4.5%) |
| $800 to $1,499 | 354 (54.0%) | 35 (2.1%) |
| Total | 656 (100.0%) | 1,684 (100.0%) |
Health & Disability in Home Gardens
Health Insurance Coverage by Age in Home Gardens
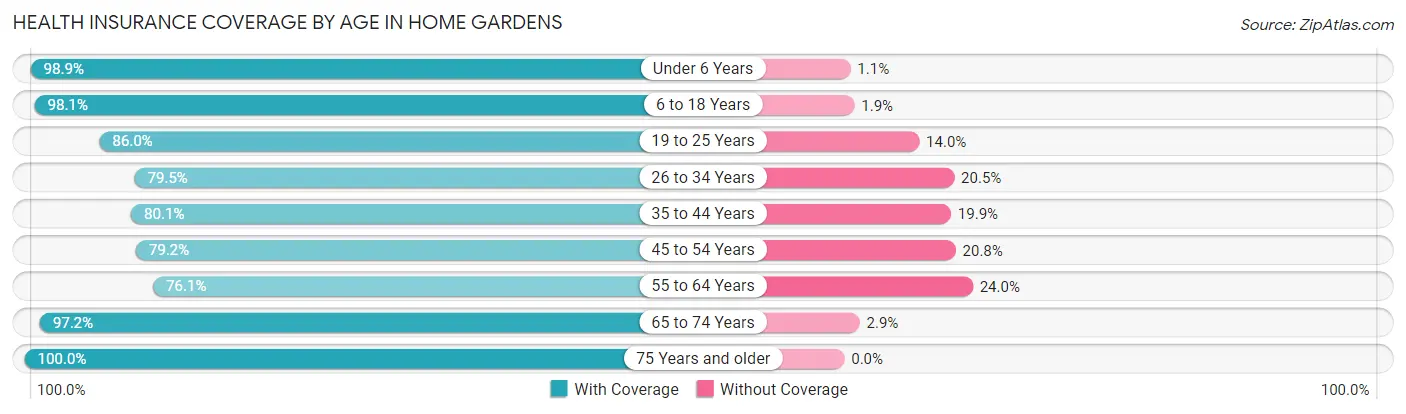
| Age Bracket | With Coverage | Without Coverage |
| Under 6 Years | 1,124 (98.9%) | 13 (1.1%) |
| 6 to 18 Years | 2,094 (98.1%) | 40 (1.9%) |
| 19 to 25 Years | 1,042 (86.0%) | 169 (14.0%) |
| 26 to 34 Years | 1,269 (79.5%) | 327 (20.5%) |
| 35 to 44 Years | 1,463 (80.1%) | 363 (19.9%) |
| 45 to 54 Years | 1,168 (79.2%) | 306 (20.8%) |
| 55 to 64 Years | 978 (76.0%) | 308 (23.9%) |
| 65 to 74 Years | 819 (97.2%) | 24 (2.9%) |
| 75 Years and older | 759 (100.0%) | 0 (0.0%) |
| Total | 10,716 (87.4%) | 1,550 (12.6%) |
Health Insurance Coverage by Citizenship Status in Home Gardens
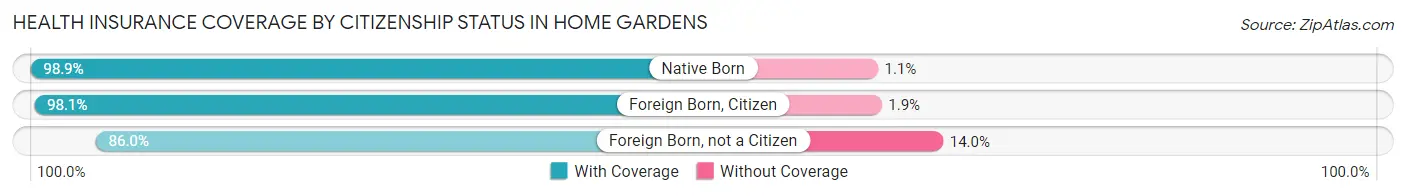
| Citizenship Status | With Coverage | Without Coverage |
| Native Born | 1,124 (98.9%) | 13 (1.1%) |
| Foreign Born, Citizen | 2,094 (98.1%) | 40 (1.9%) |
| Foreign Born, not a Citizen | 1,042 (86.0%) | 169 (14.0%) |
Health Insurance Coverage by Household Income in Home Gardens
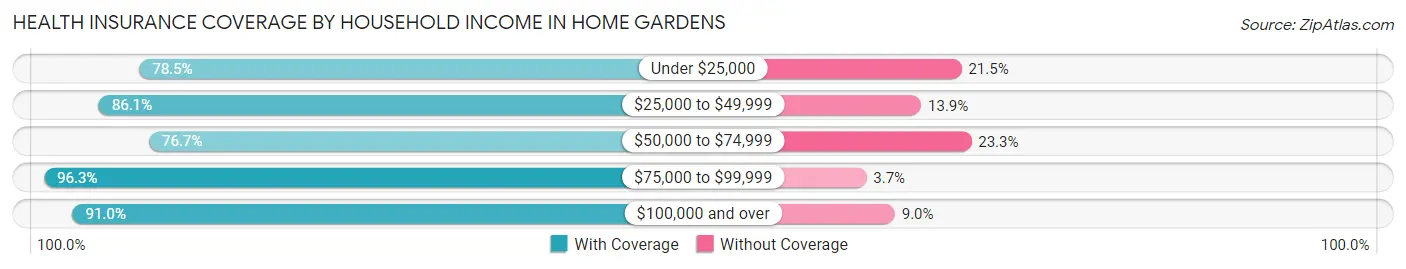
| Household Income | With Coverage | Without Coverage |
| Under $25,000 | 687 (78.5%) | 188 (21.5%) |
| $25,000 to $49,999 | 1,360 (86.1%) | 220 (13.9%) |
| $50,000 to $74,999 | 1,692 (76.7%) | 515 (23.3%) |
| $75,000 to $99,999 | 1,001 (96.3%) | 38 (3.7%) |
| $100,000 and over | 5,966 (91.0%) | 589 (9.0%) |
Public vs Private Health Insurance Coverage by Age in Home Gardens
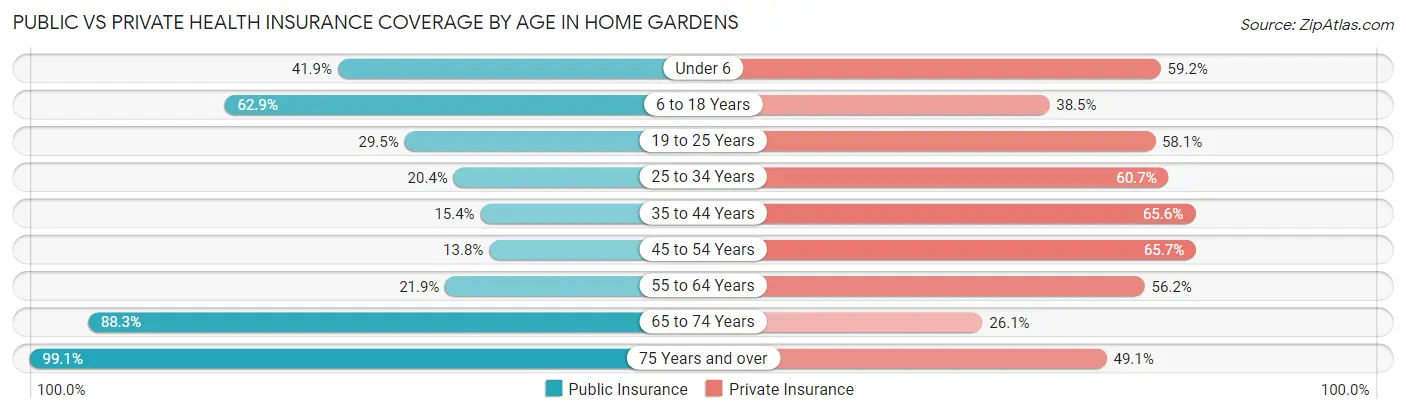
| Age Bracket | Public Insurance | Private Insurance |
| Under 6 | 476 (41.9%) | 673 (59.2%) |
| 6 to 18 Years | 1,342 (62.9%) | 822 (38.5%) |
| 19 to 25 Years | 357 (29.5%) | 704 (58.1%) |
| 25 to 34 Years | 325 (20.4%) | 968 (60.7%) |
| 35 to 44 Years | 281 (15.4%) | 1,197 (65.5%) |
| 45 to 54 Years | 203 (13.8%) | 969 (65.7%) |
| 55 to 64 Years | 282 (21.9%) | 723 (56.2%) |
| 65 to 74 Years | 744 (88.3%) | 220 (26.1%) |
| 75 Years and over | 752 (99.1%) | 373 (49.1%) |
| Total | 4,762 (38.8%) | 6,649 (54.2%) |
Disability Status by Sex by Age in Home Gardens
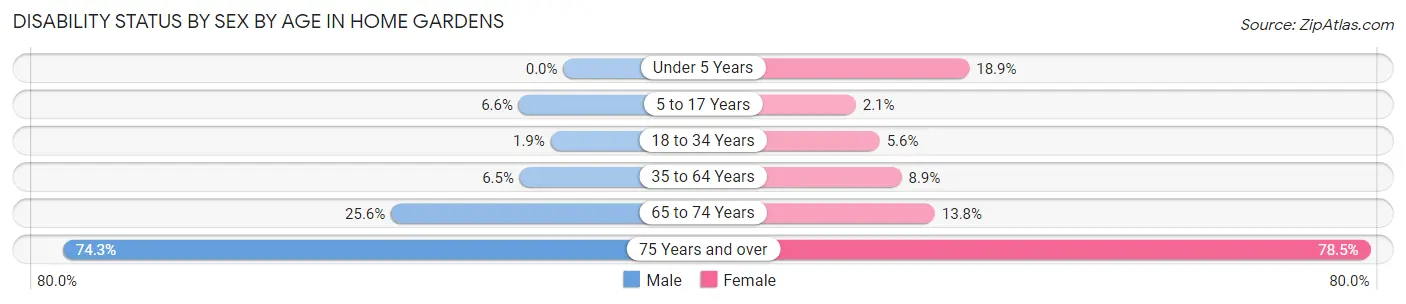
| Age Bracket | Male | Female |
| Under 5 Years | 0 (0.0%) | 74 (18.9%) |
| 5 to 17 Years | 64 (6.6%) | 27 (2.1%) |
| 18 to 34 Years | 29 (1.9%) | 82 (5.6%) |
| 35 to 64 Years | 156 (6.5%) | 193 (8.9%) |
| 65 to 74 Years | 99 (25.6%) | 63 (13.8%) |
| 75 Years and over | 298 (74.3%) | 281 (78.5%) |
Disability Class by Sex by Age in Home Gardens
Disability Class: Hearing Difficulty
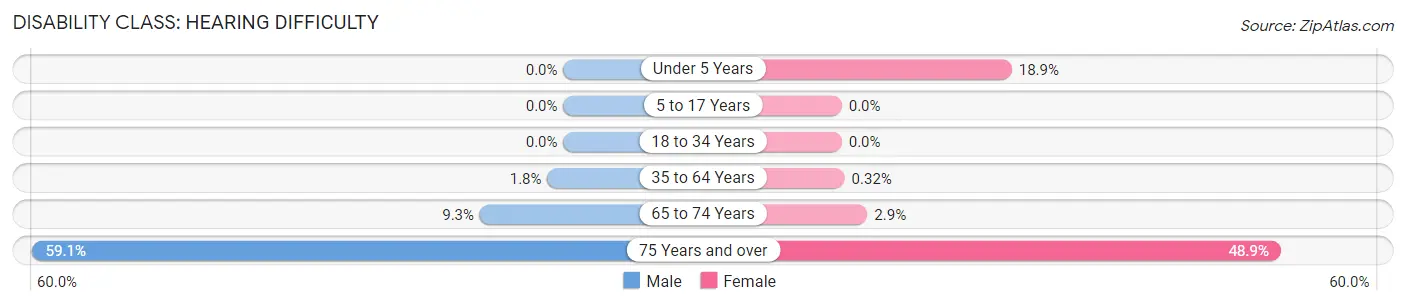
| Age Bracket | Male | Female |
| Under 5 Years | 0 (0.0%) | 74 (18.9%) |
| 5 to 17 Years | 0 (0.0%) | 0 (0.0%) |
| 18 to 34 Years | 0 (0.0%) | 0 (0.0%) |
| 35 to 64 Years | 43 (1.8%) | 7 (0.3%) |
| 65 to 74 Years | 36 (9.3%) | 13 (2.9%) |
| 75 Years and over | 237 (59.1%) | 175 (48.9%) |
Disability Class: Vision Difficulty
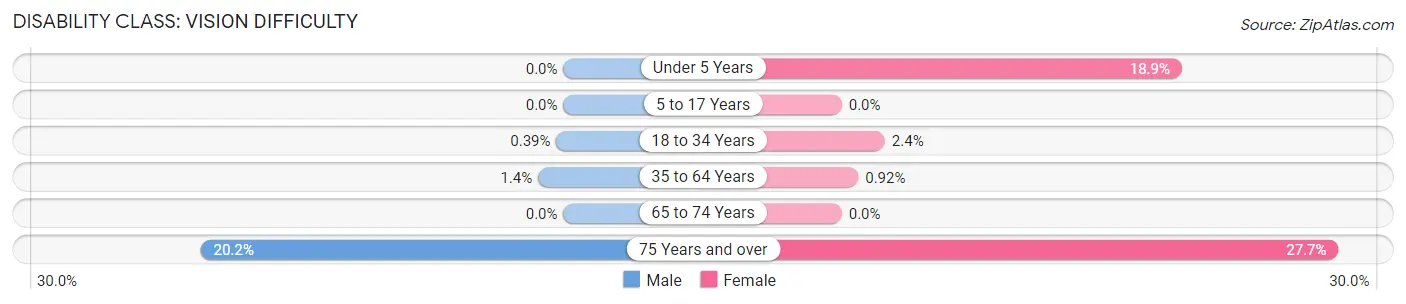
| Age Bracket | Male | Female |
| Under 5 Years | 0 (0.0%) | 74 (18.9%) |
| 5 to 17 Years | 0 (0.0%) | 0 (0.0%) |
| 18 to 34 Years | 6 (0.4%) | 35 (2.4%) |
| 35 to 64 Years | 34 (1.4%) | 20 (0.9%) |
| 65 to 74 Years | 0 (0.0%) | 0 (0.0%) |
| 75 Years and over | 81 (20.2%) | 99 (27.7%) |
Disability Class: Cognitive Difficulty
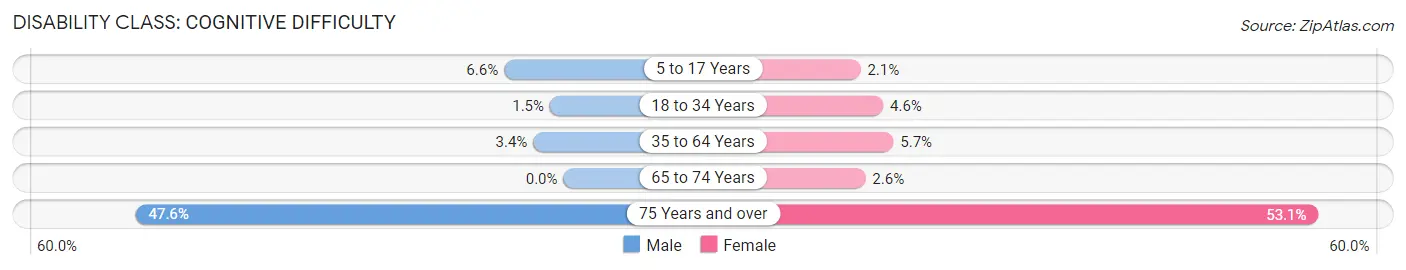
| Age Bracket | Male | Female |
| 5 to 17 Years | 64 (6.6%) | 27 (2.1%) |
| 18 to 34 Years | 23 (1.5%) | 67 (4.6%) |
| 35 to 64 Years | 81 (3.4%) | 125 (5.7%) |
| 65 to 74 Years | 0 (0.0%) | 12 (2.6%) |
| 75 Years and over | 191 (47.6%) | 190 (53.1%) |
Disability Class: Ambulatory Difficulty
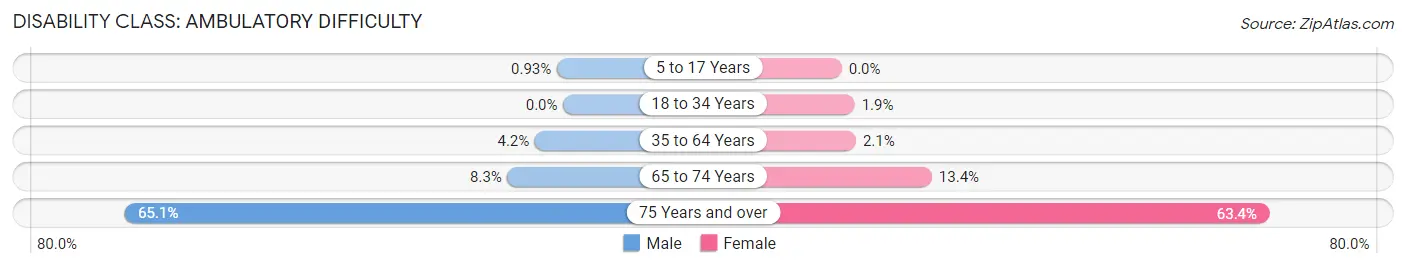
| Age Bracket | Male | Female |
| 5 to 17 Years | 9 (0.9%) | 0 (0.0%) |
| 18 to 34 Years | 0 (0.0%) | 28 (1.9%) |
| 35 to 64 Years | 101 (4.2%) | 46 (2.1%) |
| 65 to 74 Years | 32 (8.3%) | 61 (13.4%) |
| 75 Years and over | 261 (65.1%) | 227 (63.4%) |
Disability Class: Self-Care Difficulty
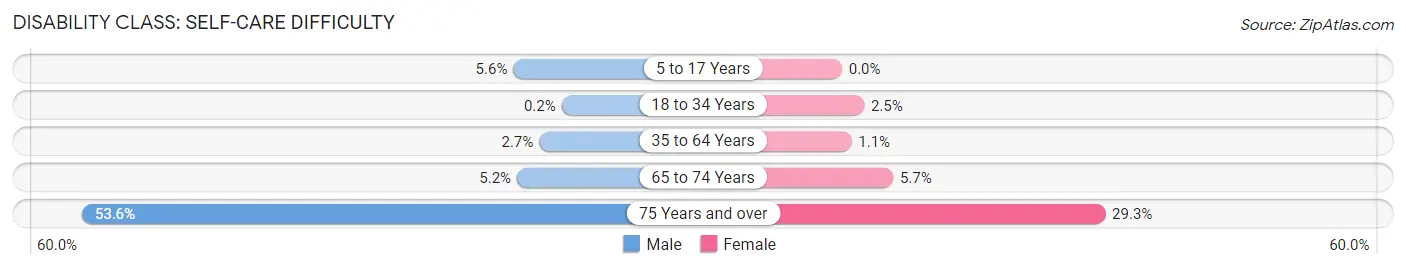
| Age Bracket | Male | Female |
| 5 to 17 Years | 54 (5.6%) | 0 (0.0%) |
| 18 to 34 Years | 3 (0.2%) | 36 (2.5%) |
| 35 to 64 Years | 65 (2.7%) | 23 (1.1%) |
| 65 to 74 Years | 20 (5.2%) | 26 (5.7%) |
| 75 Years and over | 215 (53.6%) | 105 (29.3%) |
Technology Access in Home Gardens
Computing Device Access in Home Gardens
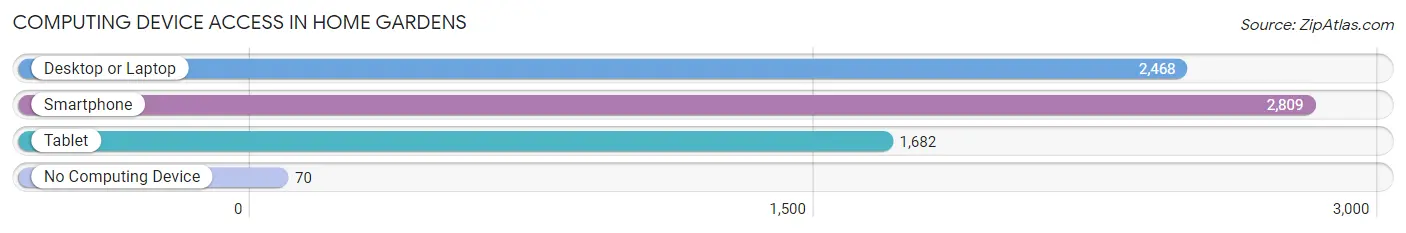
| Device Type | # Households | % Households |
| Desktop or Laptop | 2,468 | 82.7% |
| Smartphone | 2,809 | 94.1% |
| Tablet | 1,682 | 56.3% |
| No Computing Device | 70 | 2.3% |
| Total | 2,986 | 100.0% |
Internet Access in Home Gardens
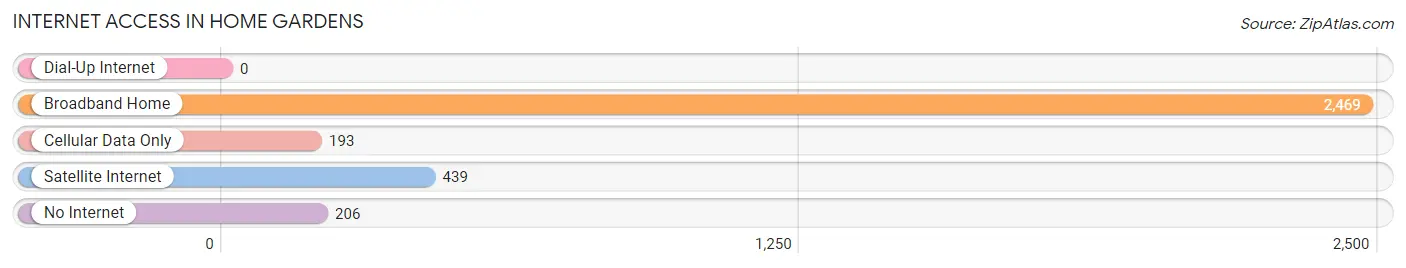
| Internet Type | # Households | % Households |
| Dial-Up Internet | 0 | 0.0% |
| Broadband Home | 2,469 | 82.7% |
| Cellular Data Only | 193 | 6.5% |
| Satellite Internet | 439 | 14.7% |
| No Internet | 206 | 6.9% |
| Total | 2,986 | 100.0% |
Home Gardens Summary
History
Home Gardens is an unincorporated community located in Riverside County, California. It is situated in the San Jacinto Valley, and is part of the Riverside-San Bernardino-Ontario metropolitan area. Home Gardens was established in the early 1900s as a farming community. The area was originally inhabited by the Cahuilla Indians, who were the first to cultivate the land.
The first settlers in Home Gardens were the Spanish, who arrived in the area in the late 1700s. They established several ranches and farms in the area, and the community began to grow. In the early 1900s, the area was known as Home Gardens, and it was home to a variety of crops, including citrus, grapes, and olives.
In the 1920s, the area began to experience a population boom, as more people moved to the area to take advantage of the fertile soil and mild climate. The population continued to grow throughout the 20th century, and by the 2000 census, Home Gardens had a population of 8,845.
Geography
Home Gardens is located in the San Jacinto Valley, in Riverside County, California. It is situated at an elevation of 1,000 feet, and is bordered by the cities of Perris, Moreno Valley, and San Jacinto. The area is characterized by rolling hills and valleys, and is home to a variety of wildlife, including deer, coyotes, and bobcats.
The climate in Home Gardens is mild and temperate, with hot summers and mild winters. The average annual temperature is around 70 degrees Fahrenheit, and the average annual precipitation is around 10 inches.
Economy
Home Gardens is primarily a residential community, and the majority of its residents are employed in the service industry. The area is home to a variety of businesses, including restaurants, retail stores, and auto repair shops.
The area is also home to several agricultural operations, including citrus and olive farms. The citrus industry is the largest employer in the area, and the area is home to several packing houses and processing plants.
Demographics
As of the 2000 census, Home Gardens had a population of 8,845. The racial makeup of the area was 57.3% White, 28.2% Hispanic, 8.2% African American, and 6.3% Asian. The median household income was $45,845, and the median home value was $179,000.
Conclusion
Home Gardens is an unincorporated community located in Riverside County, California. It is situated in the San Jacinto Valley, and is part of the Riverside-San Bernardino-Ontario metropolitan area. Home Gardens was established in the early 1900s as a farming community, and has since grown into a residential community. The area is characterized by rolling hills and valleys, and is home to a variety of businesses, including restaurants, retail stores, and auto repair shops. As of the 2000 census, Home Gardens had a population of 8,845, and the median household income was $45,845.
Common Questions
What is Per Capita Income in Home Gardens?
Per Capita income in Home Gardens is $27,763.
What is the Median Family Income in Home Gardens?
Median Family Income in Home Gardens is $84,207.
What is the Median Household income in Home Gardens?
Median Household Income in Home Gardens is $88,125.
What is Income or Wage Gap in Home Gardens?
Income or Wage Gap in Home Gardens is 24.8%.
Women in Home Gardens earn 75.2 cents for every dollar earned by a man.
What is Family Income Deficit in Home Gardens?
Family Income Deficit in Home Gardens is $12,162.
Families that are below poverty line in Home Gardens earn $12,162 less on average than the poverty threshold level.
What is Inequality or Gini Index in Home Gardens?
Inequality or Gini Index in Home Gardens is 0.40.
What is the Total Population of Home Gardens?
Total Population of Home Gardens is 12,278.
What is the Total Male Population of Home Gardens?
Total Male Population of Home Gardens is 6,143.
What is the Total Female Population of Home Gardens?
Total Female Population of Home Gardens is 6,135.
What is the Ratio of Males per 100 Females in Home Gardens?
There are 100.13 Males per 100 Females in Home Gardens.
What is the Ratio of Females per 100 Males in Home Gardens?
There are 99.87 Females per 100 Males in Home Gardens.
What is the Median Population Age in Home Gardens?
Median Population Age in Home Gardens is 35.2 Years.
What is the Average Family Size in Home Gardens
Average Family Size in Home Gardens is 4.3 People.
What is the Average Household Size in Home Gardens
Average Household Size in Home Gardens is 4.1 People.
How Large is the Labor Force in Home Gardens?
There are 5,805 People in the Labor Forcein in Home Gardens.
What is the Percentage of People in the Labor Force in Home Gardens?
61.4% of People are in the Labor Force in Home Gardens.
What is the Unemployment Rate in Home Gardens?
Unemployment Rate in Home Gardens is 4.1%.