Coronita, CA Map & Demographics
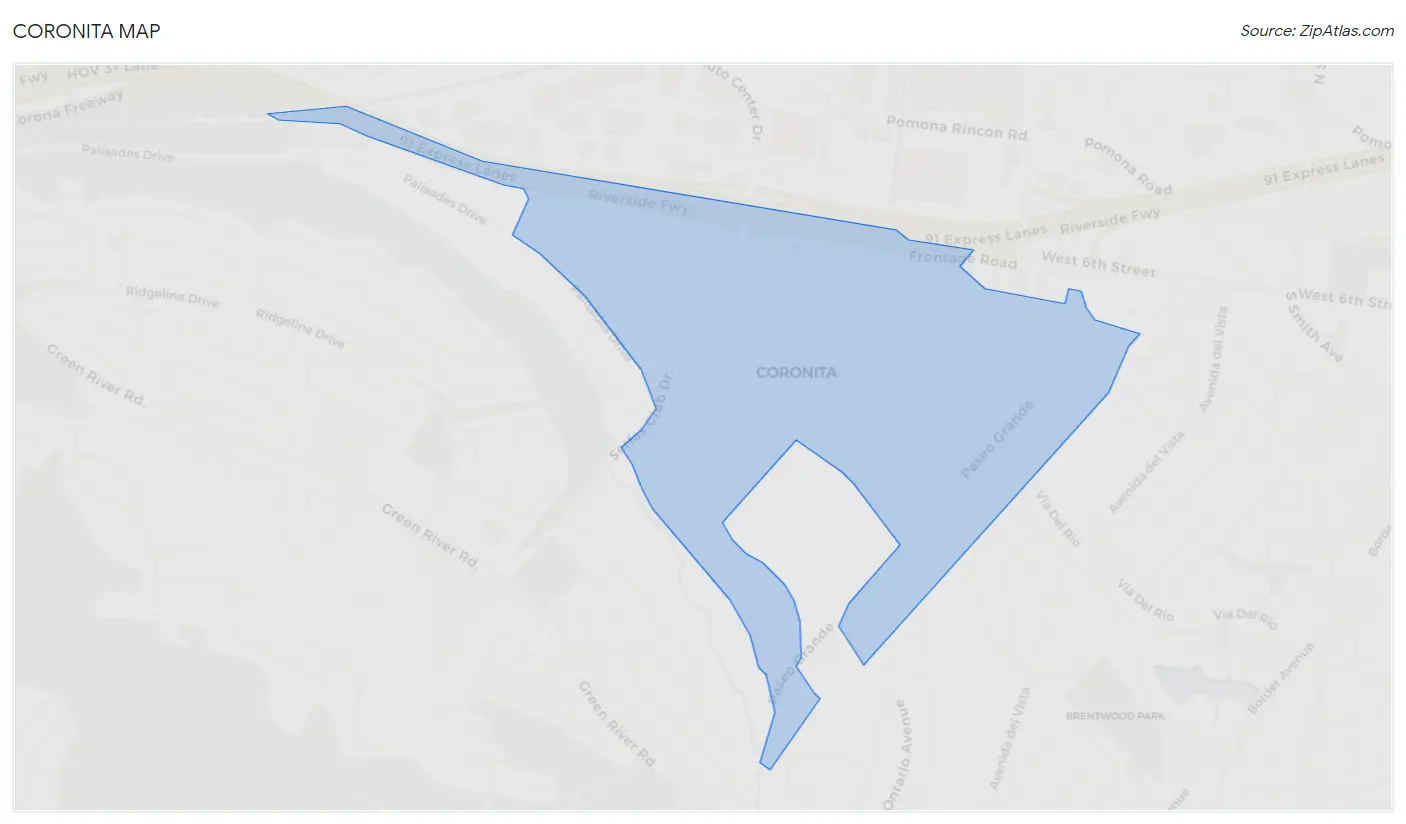
Coronita Map
Coronita Overview
$34,015
PER CAPITA INCOME
$110,833
AVG FAMILY INCOME
$110,625
AVG HOUSEHOLD INCOME
22.8%
WAGE / INCOME GAP [ % ]
77.2¢/ $1
WAGE / INCOME GAP [ $ ]
0.36
INEQUALITY / GINI INDEX
3,235
TOTAL POPULATION
1,753
MALE POPULATION
1,482
FEMALE POPULATION
118.29
MALES / 100 FEMALES
84.54
FEMALES / 100 MALES
34.2
MEDIAN AGE
4.0
AVG FAMILY SIZE
3.7
AVG HOUSEHOLD SIZE
1,660
LABOR FORCE [ PEOPLE ]
60.2%
PERCENT IN LABOR FORCE
1.6%
UNEMPLOYMENT RATE
Income in Coronita
Income Overview in Coronita
Per Capita Income in Coronita is $34,015, while median incomes of families and households are $110,833 and $110,625 respectively.
| Characteristic | Number | Measure |
| Per Capita Income | 3,235 | $34,015 |
| Median Family Income | 746 | $110,833 |
| Mean Family Income | 746 | $129,704 |
| Median Household Income | 865 | $110,625 |
| Mean Household Income | 865 | $124,376 |
| Income Deficit | 746 | $0 |
| Wage / Income Gap (%) | 3,235 | 22.81% |
| Wage / Income Gap ($) | 3,235 | 77.19¢ per $1 |
| Gini / Inequality Index | 3,235 | 0.36 |
Earnings by Sex in Coronita
Average Earnings in Coronita are $46,972, $52,321 for men and $40,385 for women, a difference of 22.8%.
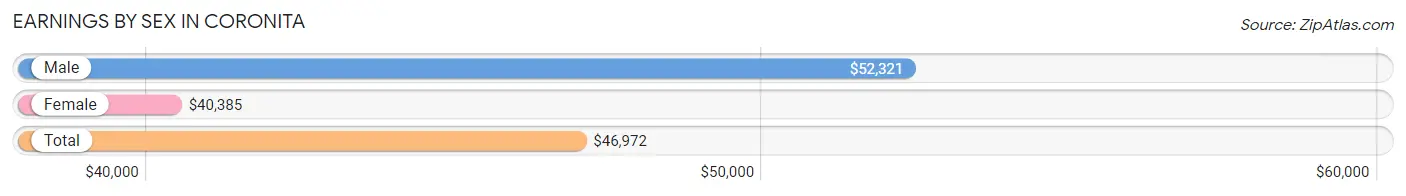
| Sex | Number | Average Earnings |
| Male | 976 (58.2%) | $52,321 |
| Female | 700 (41.8%) | $40,385 |
| Total | 1,676 (100.0%) | $46,972 |
Earnings by Sex by Income Bracket in Coronita
The most common earnings brackets in Coronita are $100,000+ for men (187 | 19.2%) and $75,000 to $99,999 for women (107 | 15.3%).
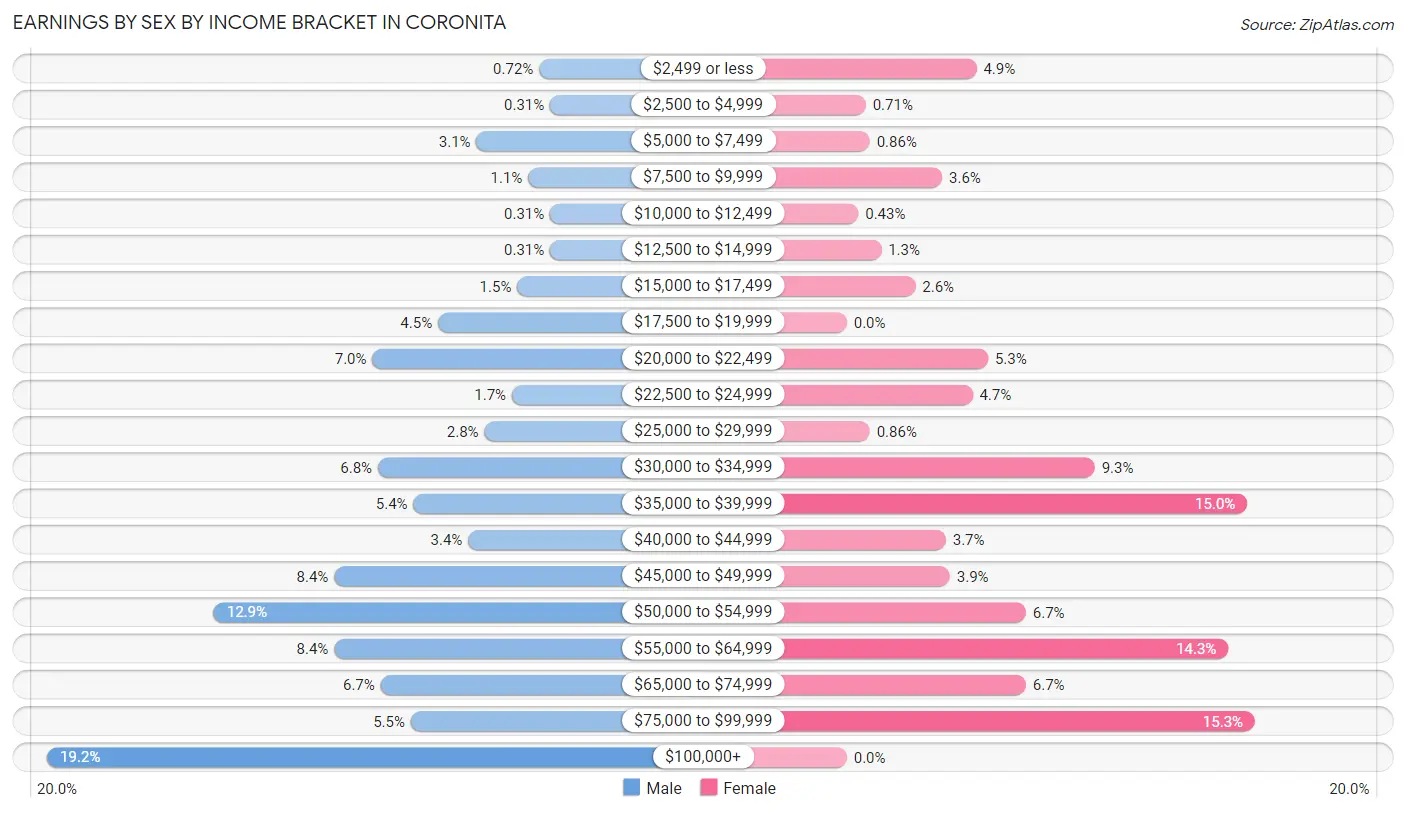
| Income | Male | Female |
| $2,499 or less | 7 (0.7%) | 34 (4.9%) |
| $2,500 to $4,999 | 3 (0.3%) | 5 (0.7%) |
| $5,000 to $7,499 | 30 (3.1%) | 6 (0.9%) |
| $7,500 to $9,999 | 11 (1.1%) | 25 (3.6%) |
| $10,000 to $12,499 | 3 (0.3%) | 3 (0.4%) |
| $12,500 to $14,999 | 3 (0.3%) | 9 (1.3%) |
| $15,000 to $17,499 | 15 (1.5%) | 18 (2.6%) |
| $17,500 to $19,999 | 44 (4.5%) | 0 (0.0%) |
| $20,000 to $22,499 | 68 (7.0%) | 37 (5.3%) |
| $22,500 to $24,999 | 17 (1.7%) | 33 (4.7%) |
| $25,000 to $29,999 | 27 (2.8%) | 6 (0.9%) |
| $30,000 to $34,999 | 66 (6.8%) | 65 (9.3%) |
| $35,000 to $39,999 | 53 (5.4%) | 105 (15.0%) |
| $40,000 to $44,999 | 33 (3.4%) | 26 (3.7%) |
| $45,000 to $49,999 | 82 (8.4%) | 27 (3.9%) |
| $50,000 to $54,999 | 126 (12.9%) | 47 (6.7%) |
| $55,000 to $64,999 | 82 (8.4%) | 100 (14.3%) |
| $65,000 to $74,999 | 65 (6.7%) | 47 (6.7%) |
| $75,000 to $99,999 | 54 (5.5%) | 107 (15.3%) |
| $100,000+ | 187 (19.2%) | 0 (0.0%) |
| Total | 976 (100.0%) | 700 (100.0%) |
Earnings by Sex by Educational Attainment in Coronita
Average earnings in Coronita are $55,333 for men and $45,648 for women, a difference of 17.5%. Men with an educational attainment of graduate degree enjoy the highest average annual earnings of $113,250, while those with less than high school education earn the least with $50,179. Women with an educational attainment of bachelor's degree earn the most with the average annual earnings of $77,545, while those with less than high school education have the smallest earnings of $30,472.
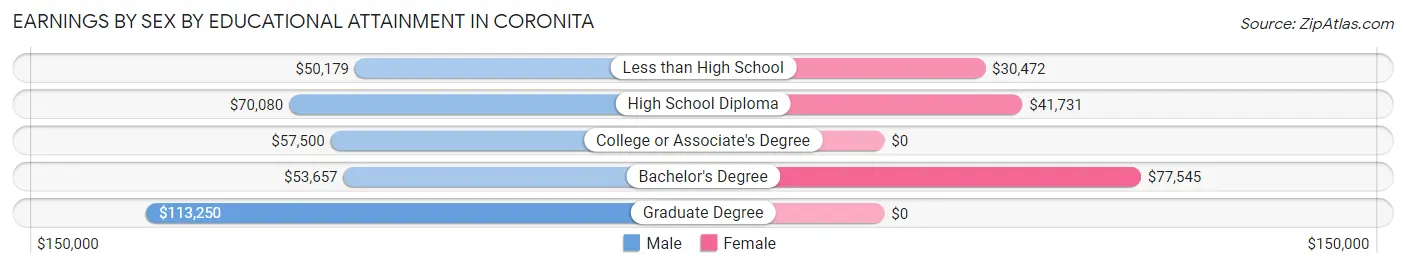
| Educational Attainment | Male Income | Female Income |
| Less than High School | $50,179 | $30,472 |
| High School Diploma | $70,080 | $41,731 |
| College or Associate's Degree | $57,500 | $0 |
| Bachelor's Degree | $53,657 | $77,545 |
| Graduate Degree | $113,250 | $0 |
| Total | $55,333 | $45,648 |
Family Income in Coronita
Family Income Brackets in Coronita
According to the Coronita family income data, there are 255 families falling into the $100,000 to $149,999 income range, which is the most common income bracket and makes up 34.2% of all families.
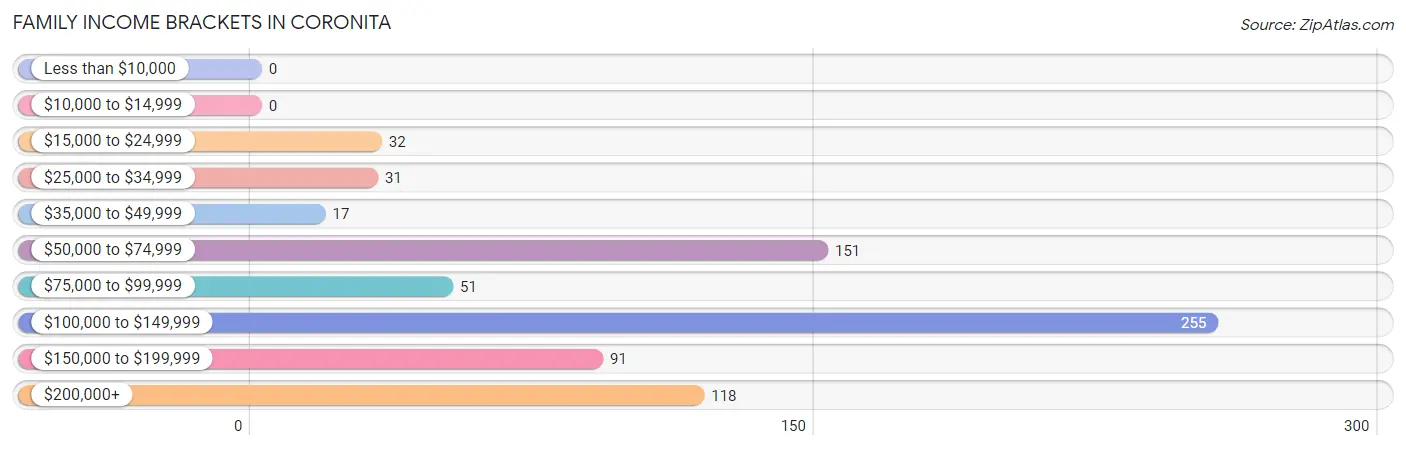
| Income Bracket | # Families | % Families |
| Less than $10,000 | 0 | 0.0% |
| $10,000 to $14,999 | 0 | 0.0% |
| $15,000 to $24,999 | 32 | 4.3% |
| $25,000 to $34,999 | 31 | 4.2% |
| $35,000 to $49,999 | 17 | 2.3% |
| $50,000 to $74,999 | 151 | 20.2% |
| $75,000 to $99,999 | 51 | 6.8% |
| $100,000 to $149,999 | 255 | 34.2% |
| $150,000 to $199,999 | 91 | 12.2% |
| $200,000+ | 118 | 15.8% |
Family Income by Famaliy Size in Coronita
6-person families (81 | 10.9%) account for the highest median family income in Coronita with $125,559 per family, while 2-person families (207 | 27.8%) have the highest median income of $53,052 per family member.
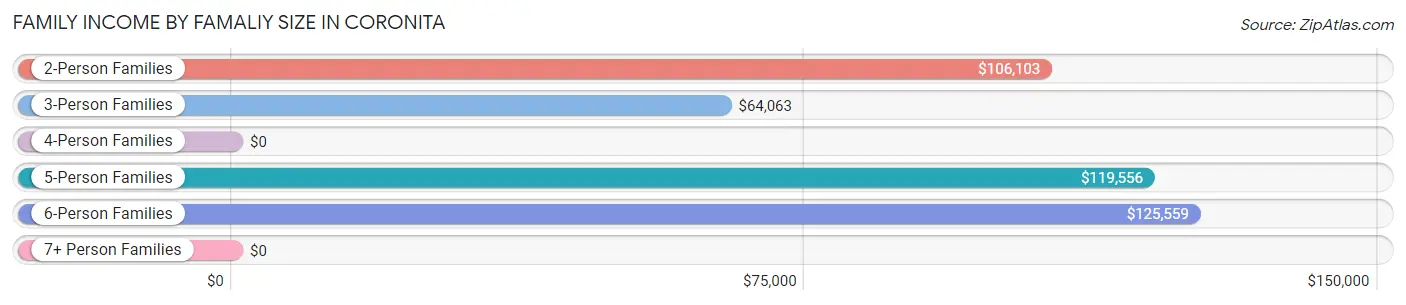
| Income Bracket | # Families | Median Income |
| 2-Person Families | 207 (27.8%) | $106,103 |
| 3-Person Families | 181 (24.3%) | $64,063 |
| 4-Person Families | 125 (16.8%) | $0 |
| 5-Person Families | 122 (16.4%) | $119,556 |
| 6-Person Families | 81 (10.9%) | $125,559 |
| 7+ Person Families | 30 (4.0%) | $0 |
| Total | 746 (100.0%) | $110,833 |
Family Income by Number of Earners in Coronita
The median family income in Coronita is $110,833, with families comprising 2 earners (250) having the highest median family income of $126,436, while families with 1 earner (161) have the lowest median family income of $63,557, accounting for 33.5% and 21.6% of families, respectively.
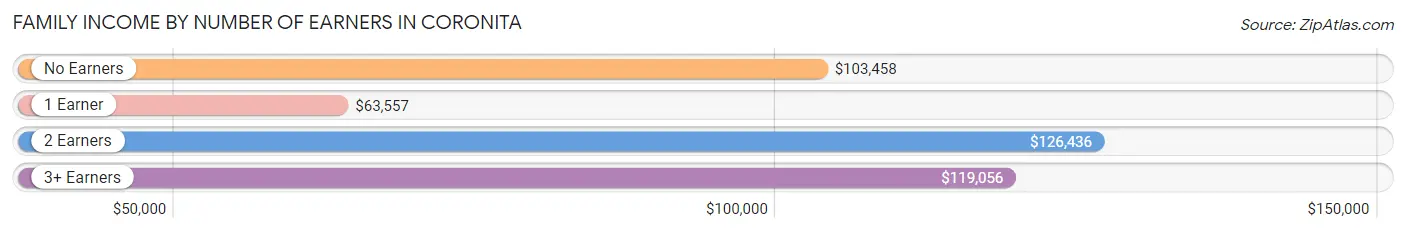
| Number of Earners | # Families | Median Income |
| No Earners | 99 (13.3%) | $103,458 |
| 1 Earner | 161 (21.6%) | $63,557 |
| 2 Earners | 250 (33.5%) | $126,436 |
| 3+ Earners | 236 (31.6%) | $119,056 |
| Total | 746 (100.0%) | $110,833 |
Household Income in Coronita
Household Income Brackets in Coronita
With 299 households falling in the category, the $100,000 to $149,999 income range is the most frequent in Coronita, accounting for 34.6% of all households.
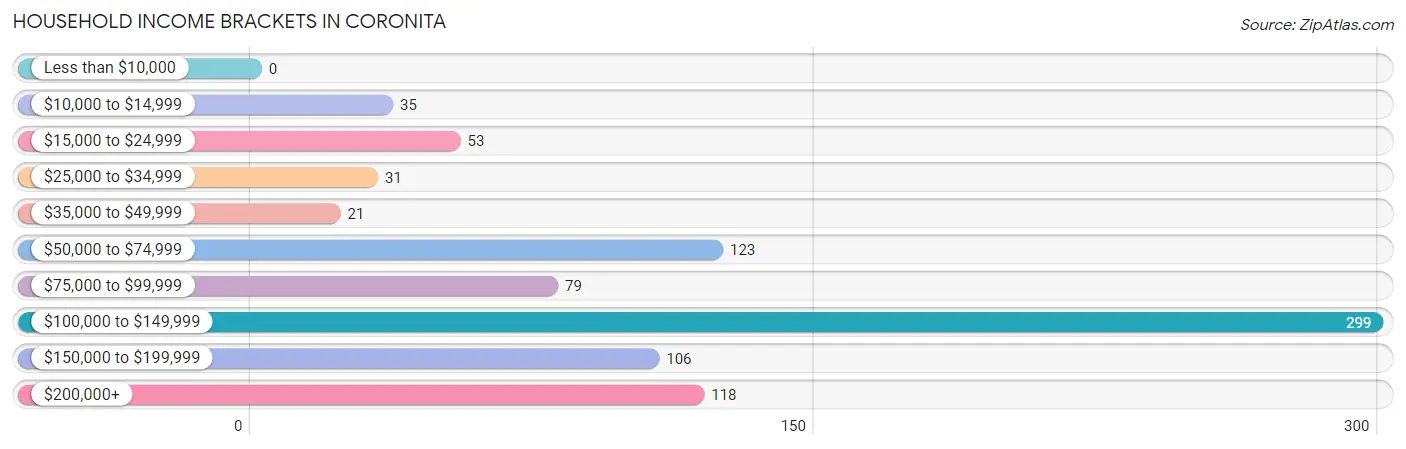
| Income Bracket | # Households | % Households |
| Less than $10,000 | 0 | 0.0% |
| $10,000 to $14,999 | 35 | 4.0% |
| $15,000 to $24,999 | 53 | 6.1% |
| $25,000 to $34,999 | 31 | 3.6% |
| $35,000 to $49,999 | 21 | 2.4% |
| $50,000 to $74,999 | 123 | 14.2% |
| $75,000 to $99,999 | 79 | 9.1% |
| $100,000 to $149,999 | 299 | 34.6% |
| $150,000 to $199,999 | 106 | 12.3% |
| $200,000+ | 118 | 13.6% |
Household Income by Householder Age in Coronita
The median household income in Coronita is $110,625, with the highest median household income of $146,379 found in the 25 to 44 years age bracket for the primary householder. A total of 210 households (24.3%) fall into this category. Meanwhile, the 15 to 24 years age bracket for the primary householder has the lowest median household income of $0, with 45 households (5.2%) in this group.
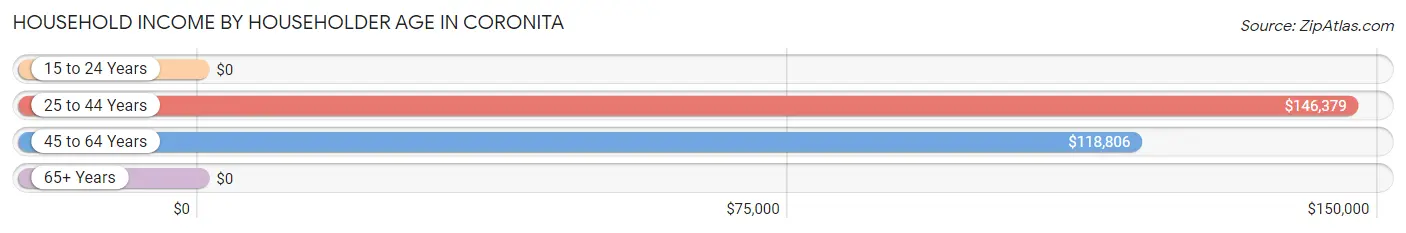
| Income Bracket | # Households | Median Income |
| 15 to 24 Years | 45 (5.2%) | $0 |
| 25 to 44 Years | 210 (24.3%) | $146,379 |
| 45 to 64 Years | 403 (46.6%) | $118,806 |
| 65+ Years | 207 (23.9%) | $0 |
| Total | 865 (100.0%) | $110,625 |
Poverty in Coronita
Income Below Poverty by Sex and Age in Coronita
With 2.5% poverty level for males and 4.3% for females among the residents of Coronita, 45 to 54 year old males and 65 to 74 year old females are the most vulnerable to poverty, with 32 males (17.6%) and 28 females (23.1%) in their respective age groups living below the poverty level.
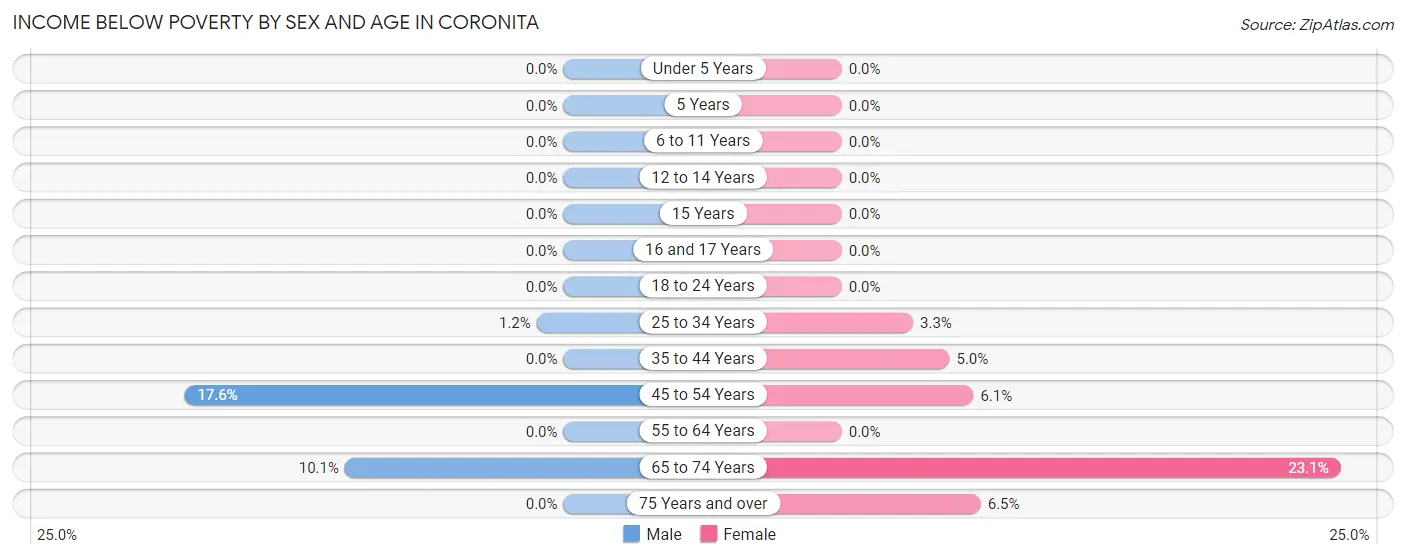
| Age Bracket | Male | Female |
| Under 5 Years | 0 (0.0%) | 0 (0.0%) |
| 5 Years | 0 (0.0%) | 0 (0.0%) |
| 6 to 11 Years | 0 (0.0%) | 0 (0.0%) |
| 12 to 14 Years | 0 (0.0%) | 0 (0.0%) |
| 15 Years | 0 (0.0%) | 0 (0.0%) |
| 16 and 17 Years | 0 (0.0%) | 0 (0.0%) |
| 18 to 24 Years | 0 (0.0%) | 0 (0.0%) |
| 25 to 34 Years | 4 (1.2%) | 6 (3.3%) |
| 35 to 44 Years | 0 (0.0%) | 10 (5.0%) |
| 45 to 54 Years | 32 (17.6%) | 14 (6.1%) |
| 55 to 64 Years | 0 (0.0%) | 0 (0.0%) |
| 65 to 74 Years | 7 (10.1%) | 28 (23.1%) |
| 75 Years and over | 0 (0.0%) | 6 (6.5%) |
| Total | 43 (2.5%) | 64 (4.3%) |
Income Above Poverty by Sex and Age in Coronita
According to the poverty statistics in Coronita, males aged under 5 years and females aged under 5 years are the age groups that are most secure financially, with 100.0% of males and 100.0% of females in these age groups living above the poverty line.
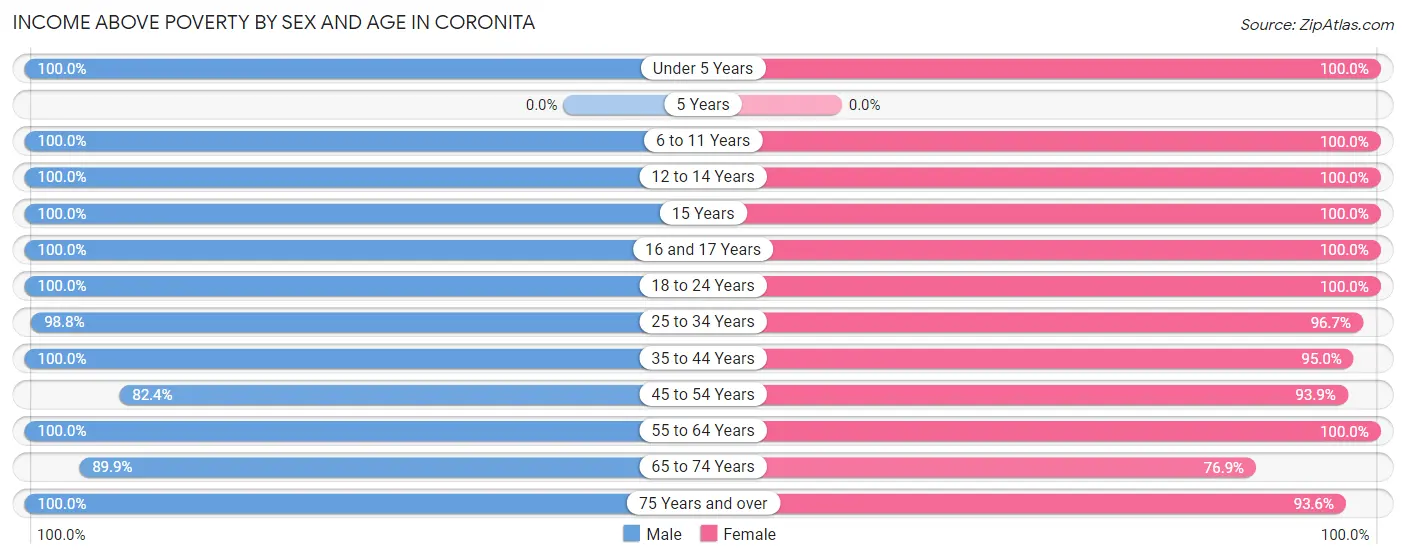
| Age Bracket | Male | Female |
| Under 5 Years | 32 (100.0%) | 83 (100.0%) |
| 5 Years | 0 (0.0%) | 0 (0.0%) |
| 6 to 11 Years | 98 (100.0%) | 49 (100.0%) |
| 12 to 14 Years | 24 (100.0%) | 120 (100.0%) |
| 15 Years | 41 (100.0%) | 30 (100.0%) |
| 16 and 17 Years | 165 (100.0%) | 58 (100.0%) |
| 18 to 24 Years | 310 (100.0%) | 130 (100.0%) |
| 25 to 34 Years | 319 (98.8%) | 175 (96.7%) |
| 35 to 44 Years | 143 (100.0%) | 190 (95.0%) |
| 45 to 54 Years | 150 (82.4%) | 215 (93.9%) |
| 55 to 64 Years | 268 (100.0%) | 188 (100.0%) |
| 65 to 74 Years | 62 (89.9%) | 93 (76.9%) |
| 75 Years and over | 98 (100.0%) | 87 (93.5%) |
| Total | 1,710 (97.6%) | 1,418 (95.7%) |
Income Below Poverty Among Married-Couple Families in Coronita
The poverty statistics for married-couple families in Coronita show that 2.3% or 15 of the total 640 families live below the poverty line. Families with no children have the highest poverty rate of 4.9%, comprising of 15 families. On the other hand, families with 1 or 2 children have the lowest poverty rate of 0.0%, which includes 0 families.
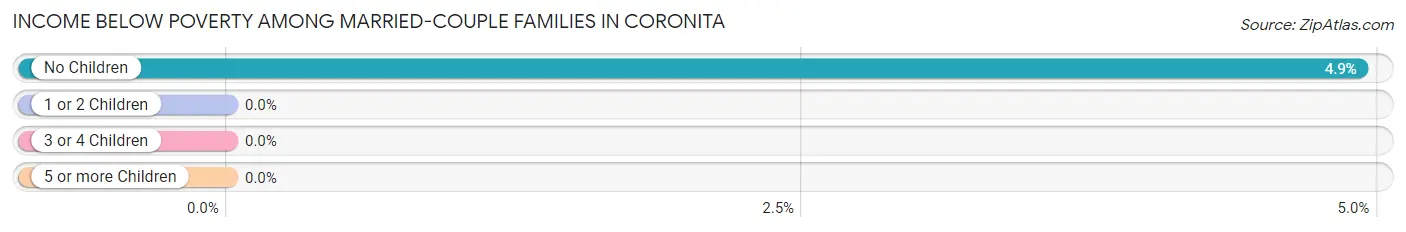
| Children | Above Poverty | Below Poverty |
| No Children | 290 (95.1%) | 15 (4.9%) |
| 1 or 2 Children | 301 (100.0%) | 0 (0.0%) |
| 3 or 4 Children | 34 (100.0%) | 0 (0.0%) |
| 5 or more Children | 0 (0.0%) | 0 (0.0%) |
| Total | 625 (97.7%) | 15 (2.3%) |
Income Below Poverty Among Single-Parent Households in Coronita
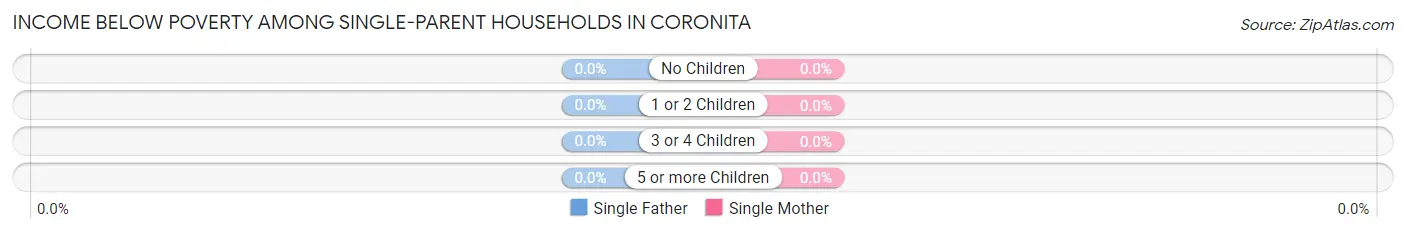
| Children | Single Father | Single Mother |
| No Children | 0 (0.0%) | 0 (0.0%) |
| 1 or 2 Children | 0 (0.0%) | 0 (0.0%) |
| 3 or 4 Children | 0 (0.0%) | 0 (0.0%) |
| 5 or more Children | 0 (0.0%) | 0 (0.0%) |
| Total | 0 (0.0%) | 0 (0.0%) |
Income Below Poverty Among Married-Couple vs Single-Parent Households in Coronita
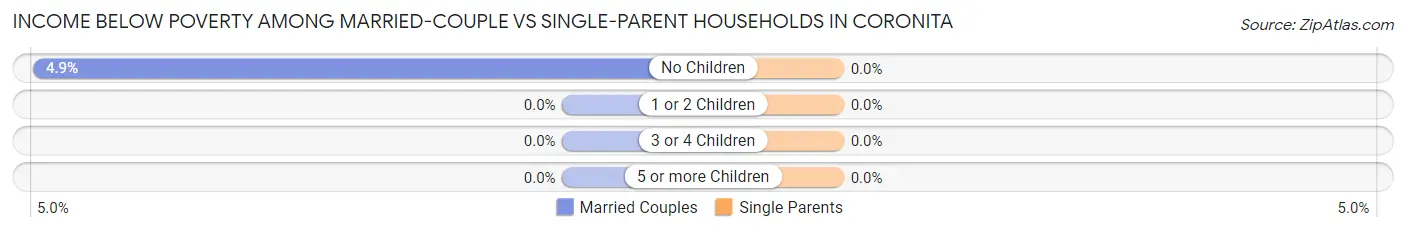
| Children | Married-Couple Families | Single-Parent Households |
| No Children | 15 (4.9%) | 0 (0.0%) |
| 1 or 2 Children | 0 (0.0%) | 0 (0.0%) |
| 3 or 4 Children | 0 (0.0%) | 0 (0.0%) |
| 5 or more Children | 0 (0.0%) | 0 (0.0%) |
| Total | 15 (2.3%) | 0 (0.0%) |
Race in Coronita
The most populous races in Coronita are Hispanic or Latino (1,946 | 60.2%), White / Caucasian (1,569 | 48.5%), and Some other Race (1,318 | 40.7%).
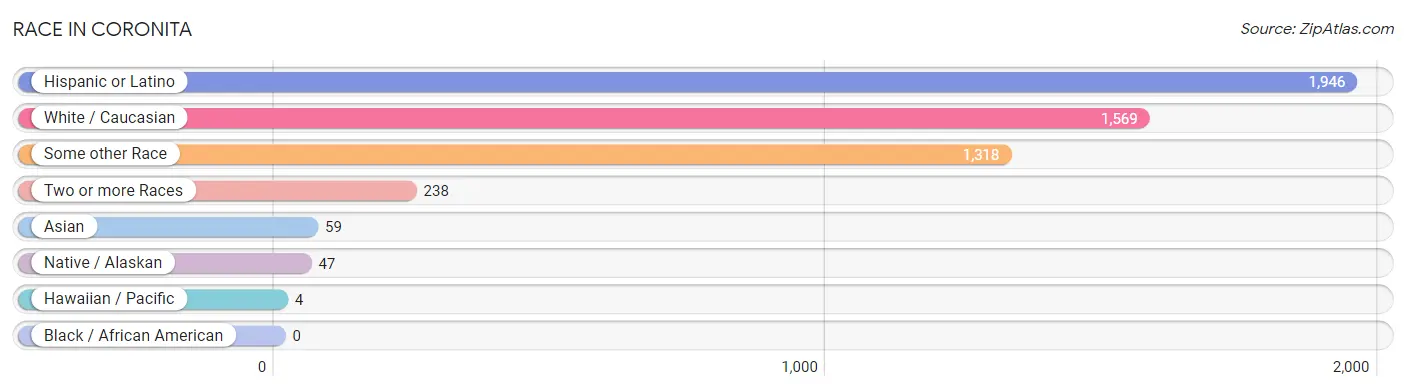
| Race | # Population | % Population |
| Asian | 59 | 1.8% |
| Black / African American | 0 | 0.0% |
| Hawaiian / Pacific | 4 | 0.1% |
| Hispanic or Latino | 1,946 | 60.2% |
| Native / Alaskan | 47 | 1.5% |
| White / Caucasian | 1,569 | 48.5% |
| Two or more Races | 238 | 7.4% |
| Some other Race | 1,318 | 40.7% |
| Total | 3,235 | 100.0% |
Ancestry in Coronita
The most populous ancestries reported in Coronita are Mexican (1,799 | 55.6%), European (250 | 7.7%), Italian (204 | 6.3%), German (200 | 6.2%), and English (115 | 3.5%), together accounting for 79.4% of all Coronita residents.
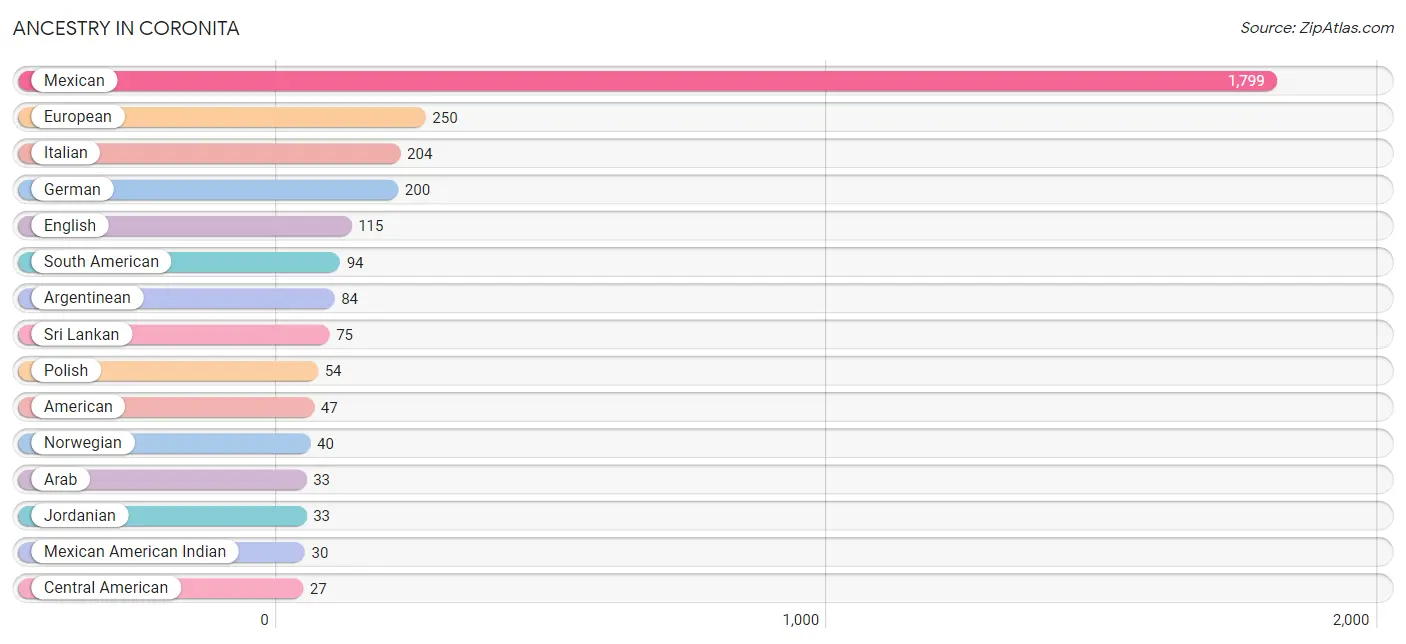
| Ancestry | # Population | % Population |
| American | 47 | 1.5% |
| Arab | 33 | 1.0% |
| Argentinean | 84 | 2.6% |
| Austrian | 2 | 0.1% |
| Bhutanese | 22 | 0.7% |
| British | 10 | 0.3% |
| Central American | 27 | 0.8% |
| Danish | 12 | 0.4% |
| Dutch | 17 | 0.5% |
| English | 115 | 3.5% |
| European | 250 | 7.7% |
| German | 200 | 6.2% |
| Guatemalan | 11 | 0.3% |
| Indian (Asian) | 13 | 0.4% |
| Italian | 204 | 6.3% |
| Jordanian | 33 | 1.0% |
| Mexican | 1,799 | 55.6% |
| Mexican American Indian | 30 | 0.9% |
| Norwegian | 40 | 1.2% |
| Polish | 54 | 1.7% |
| Puerto Rican | 18 | 0.6% |
| Salvadoran | 16 | 0.5% |
| Samoan | 4 | 0.1% |
| Scandinavian | 12 | 0.4% |
| Scottish | 12 | 0.4% |
| South American | 94 | 2.9% |
| Spaniard | 8 | 0.3% |
| Sri Lankan | 75 | 2.3% |
| Swedish | 16 | 0.5% |
| Venezuelan | 10 | 0.3% | View All 30 Rows |
Immigrants in Coronita
The most numerous immigrant groups reported in Coronita came from Latin America (572 | 17.7%), Central America (488 | 15.1%), Mexico (477 | 14.7%), Argentina (84 | 2.6%), and South America (84 | 2.6%), together accounting for 52.7% of all Coronita residents.
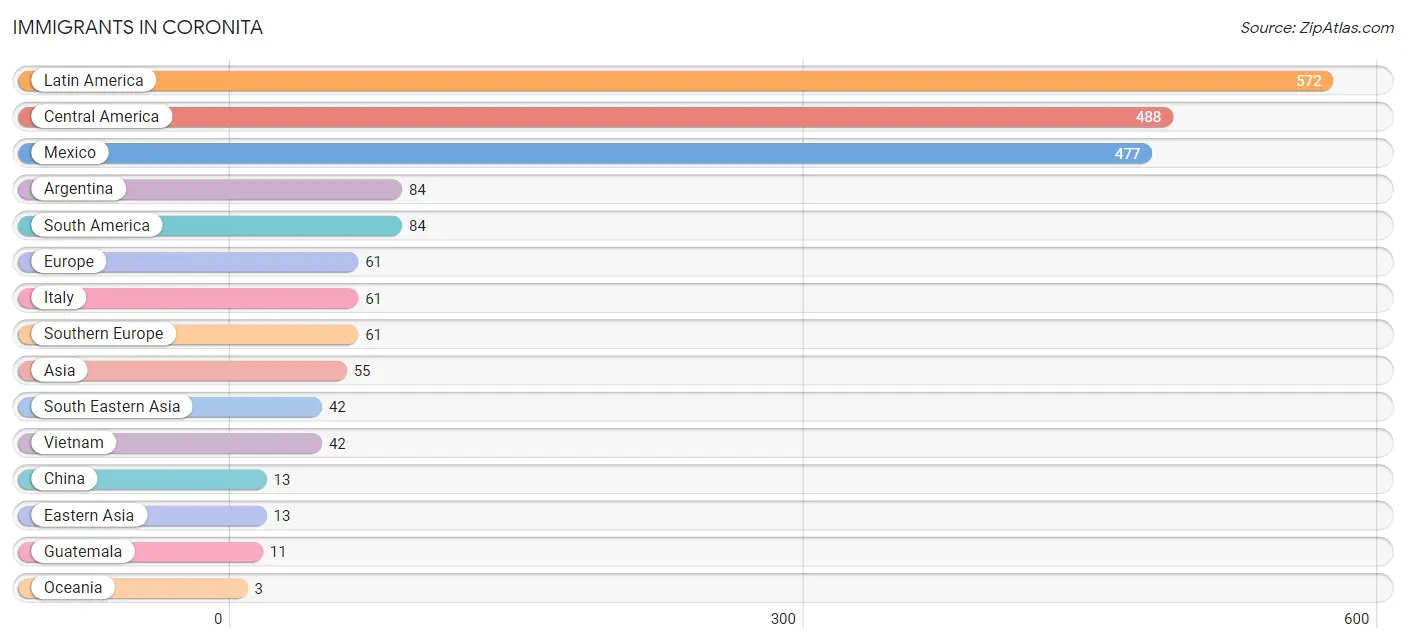
| Immigration Origin | # Population | % Population |
| Argentina | 84 | 2.6% |
| Asia | 55 | 1.7% |
| Central America | 488 | 15.1% |
| China | 13 | 0.4% |
| Eastern Asia | 13 | 0.4% |
| Europe | 61 | 1.9% |
| Guatemala | 11 | 0.3% |
| Italy | 61 | 1.9% |
| Latin America | 572 | 17.7% |
| Mexico | 477 | 14.7% |
| Oceania | 3 | 0.1% |
| South America | 84 | 2.6% |
| South Eastern Asia | 42 | 1.3% |
| Southern Europe | 61 | 1.9% |
| Vietnam | 42 | 1.3% | View All 15 Rows |
Sex and Age in Coronita
Sex and Age in Coronita
The most populous age groups in Coronita are 15 to 19 Years (274 | 15.6%) for men and 45 to 49 Years (133 | 9.0%) for women.
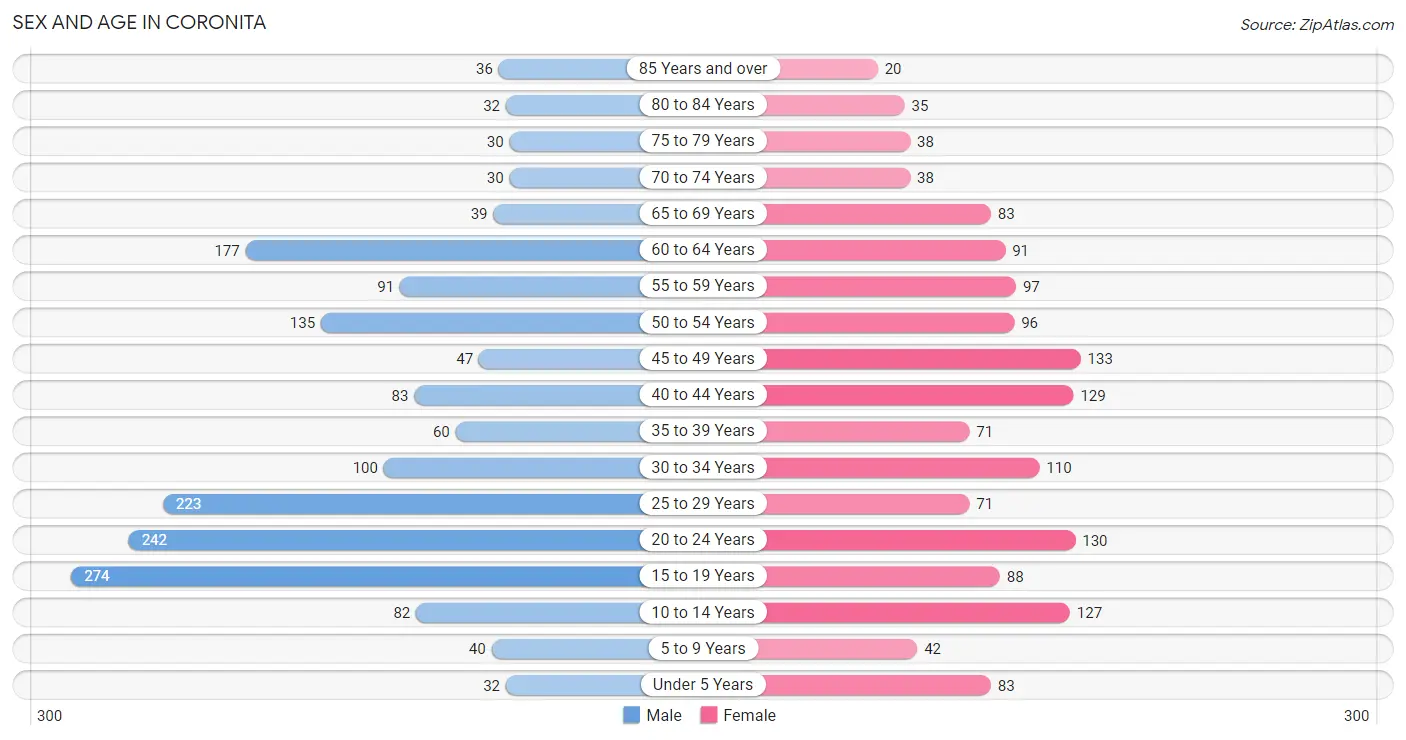
| Age Bracket | Male | Female |
| Under 5 Years | 32 (1.8%) | 83 (5.6%) |
| 5 to 9 Years | 40 (2.3%) | 42 (2.8%) |
| 10 to 14 Years | 82 (4.7%) | 127 (8.6%) |
| 15 to 19 Years | 274 (15.6%) | 88 (5.9%) |
| 20 to 24 Years | 242 (13.8%) | 130 (8.8%) |
| 25 to 29 Years | 223 (12.7%) | 71 (4.8%) |
| 30 to 34 Years | 100 (5.7%) | 110 (7.4%) |
| 35 to 39 Years | 60 (3.4%) | 71 (4.8%) |
| 40 to 44 Years | 83 (4.7%) | 129 (8.7%) |
| 45 to 49 Years | 47 (2.7%) | 133 (9.0%) |
| 50 to 54 Years | 135 (7.7%) | 96 (6.5%) |
| 55 to 59 Years | 91 (5.2%) | 97 (6.6%) |
| 60 to 64 Years | 177 (10.1%) | 91 (6.1%) |
| 65 to 69 Years | 39 (2.2%) | 83 (5.6%) |
| 70 to 74 Years | 30 (1.7%) | 38 (2.6%) |
| 75 to 79 Years | 30 (1.7%) | 38 (2.6%) |
| 80 to 84 Years | 32 (1.8%) | 35 (2.4%) |
| 85 Years and over | 36 (2.1%) | 20 (1.3%) |
| Total | 1,753 (100.0%) | 1,482 (100.0%) |
Families and Households in Coronita
Median Family Size in Coronita
The median family size in Coronita is 3.95 persons per family, with single male/father families (68 | 9.1%) accounting for the largest median family size of 5.29 persons per family. On the other hand, single female/mother families (38 | 5.1%) represent the smallest median family size with 3.45 persons per family.
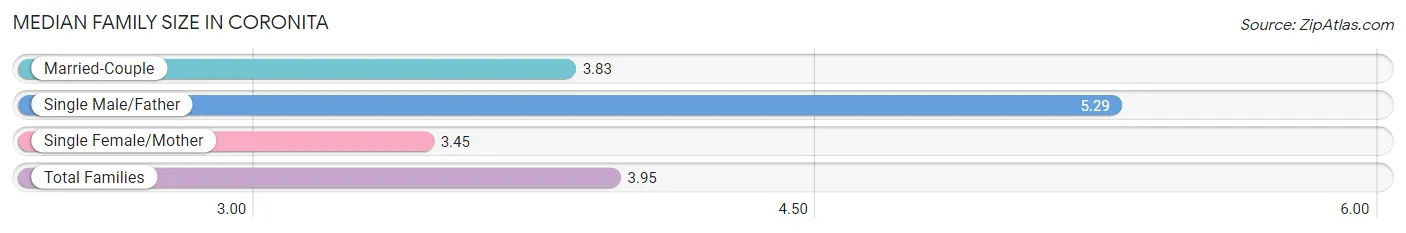
| Family Type | # Families | Family Size |
| Married-Couple | 640 (85.8%) | 3.83 |
| Single Male/Father | 68 (9.1%) | 5.29 |
| Single Female/Mother | 38 (5.1%) | 3.45 |
| Total Families | 746 (100.0%) | 3.95 |
Median Household Size in Coronita
The median household size in Coronita is 3.70 persons per household, with single male/father households (68 | 7.9%) accounting for the largest median household size of 5.93 persons per household. non-family households (119 | 13.8%) represent the smallest median household size with 1.36 persons per household.
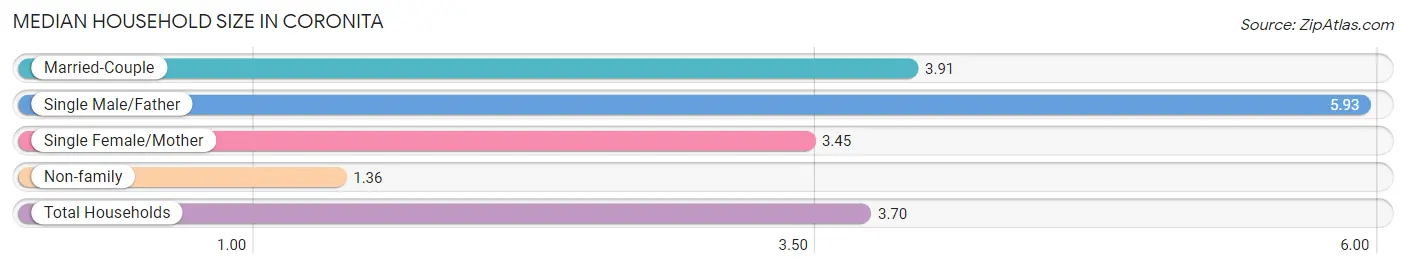
| Household Type | # Households | Household Size |
| Married-Couple | 640 (74.0%) | 3.91 |
| Single Male/Father | 68 (7.9%) | 5.93 |
| Single Female/Mother | 38 (4.4%) | 3.45 |
| Non-family | 119 (13.8%) | 1.36 |
| Total Households | 865 (100.0%) | 3.70 |
Household Size by Marriage Status in Coronita
Out of a total of 865 households in Coronita, 746 (86.2%) are family households, while 119 (13.8%) are nonfamily households. The most numerous type of family households are 2-person households, comprising 192, and the most common type of nonfamily households are 1-person households, comprising 75.
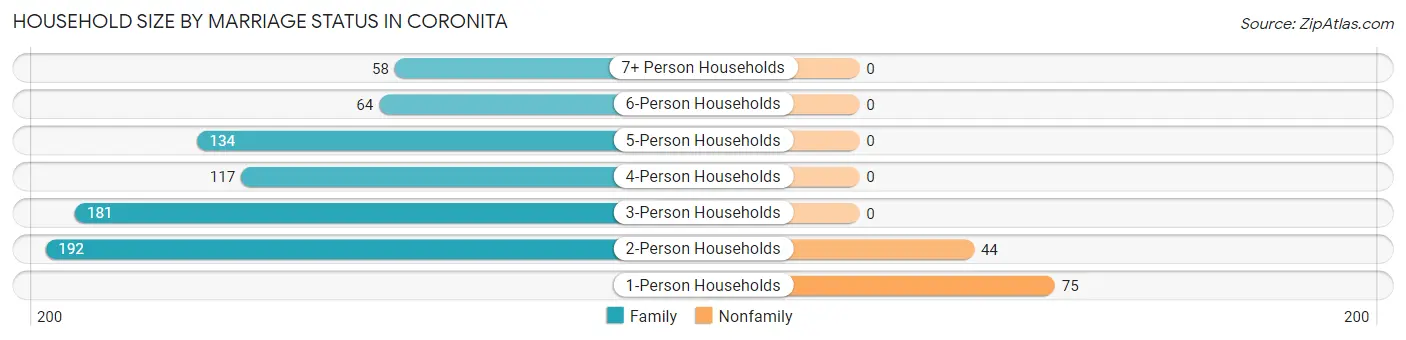
| Household Size | Family Households | Nonfamily Households |
| 1-Person Households | - | 75 (8.7%) |
| 2-Person Households | 192 (22.2%) | 44 (5.1%) |
| 3-Person Households | 181 (20.9%) | 0 (0.0%) |
| 4-Person Households | 117 (13.5%) | 0 (0.0%) |
| 5-Person Households | 134 (15.5%) | 0 (0.0%) |
| 6-Person Households | 64 (7.4%) | 0 (0.0%) |
| 7+ Person Households | 58 (6.7%) | 0 (0.0%) |
| Total | 746 (86.2%) | 119 (13.8%) |
Female Fertility in Coronita
Fertility by Age in Coronita
Average fertility rate in Coronita is 56.0 births per 1,000 women. Women in the age bracket of 35 to 50 years have the highest fertility rate with 78.0 births per 1,000 women. Women in the age bracket of 35 to 50 years acount for 63.4% of all women with births.
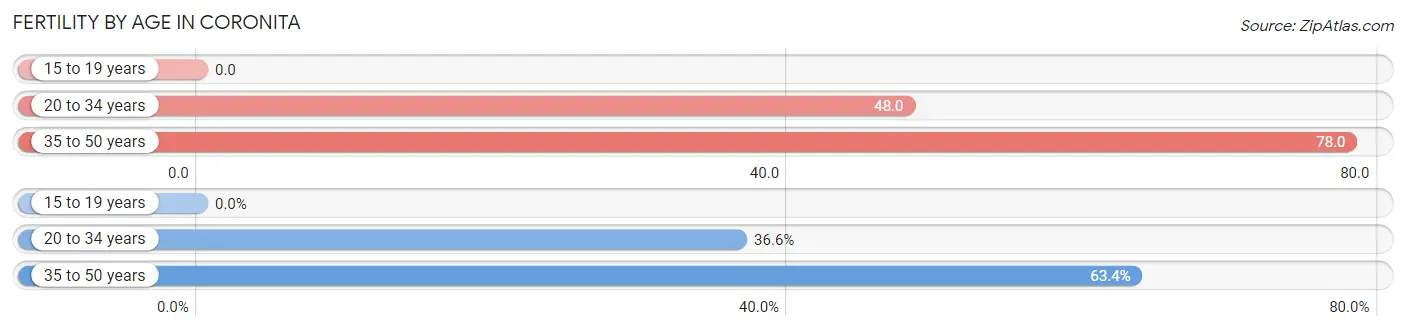
| Age Bracket | Women with Births | Births / 1,000 Women |
| 15 to 19 years | 0 (0.0%) | 0.0 |
| 20 to 34 years | 15 (36.6%) | 48.0 |
| 35 to 50 years | 26 (63.4%) | 78.0 |
| Total | 41 (100.0%) | 56.0 |
Fertility by Age by Marriage Status in Coronita
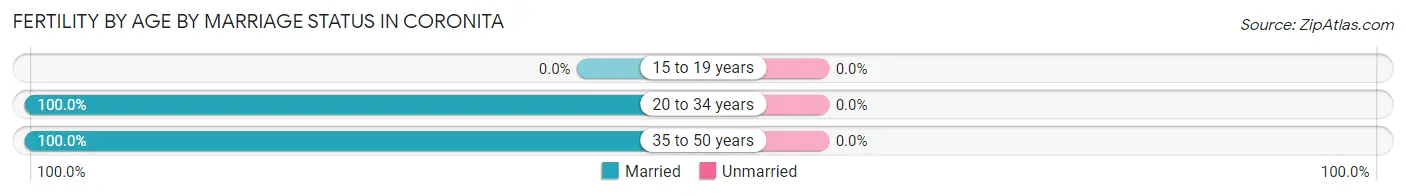
| Age Bracket | Married | Unmarried |
| 15 to 19 years | 0 (0.0%) | 0 (0.0%) |
| 20 to 34 years | 15 (100.0%) | 0 (0.0%) |
| 35 to 50 years | 26 (100.0%) | 0 (0.0%) |
| Total | 41 (100.0%) | 0 (0.0%) |
Fertility by Education in Coronita
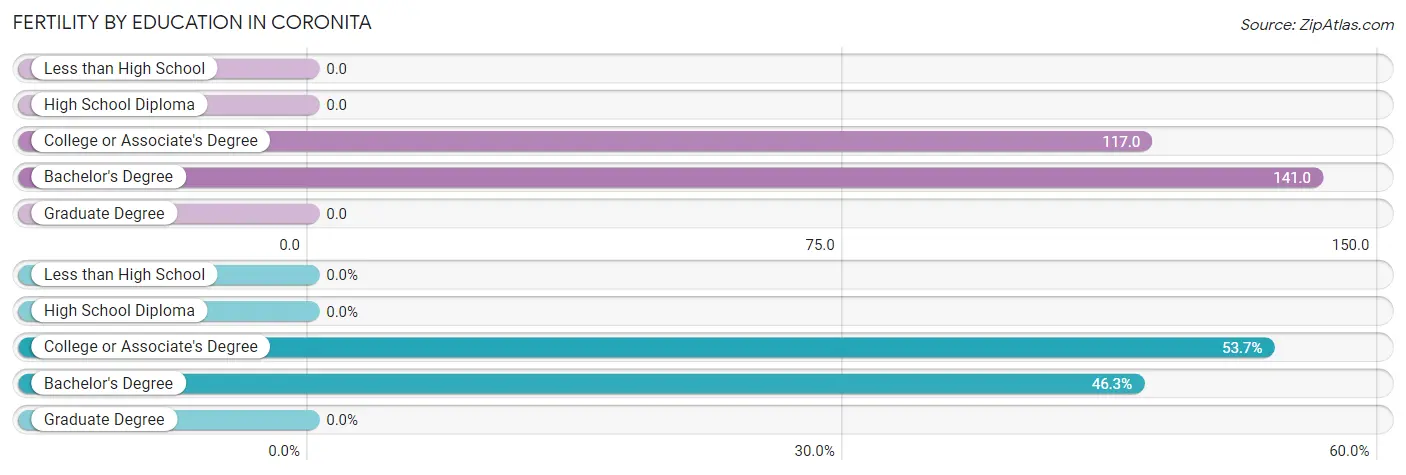
| Educational Attainment | Women with Births | Births / 1,000 Women |
| Less than High School | 0 (0.0%) | 0.0 |
| High School Diploma | 0 (0.0%) | 0.0 |
| College or Associate's Degree | 22 (53.7%) | 117.0 |
| Bachelor's Degree | 19 (46.3%) | 141.0 |
| Graduate Degree | 0 (0.0%) | 0.0 |
| Total | 41 (100.0%) | 56.0 |
Fertility by Education by Marriage Status in Coronita
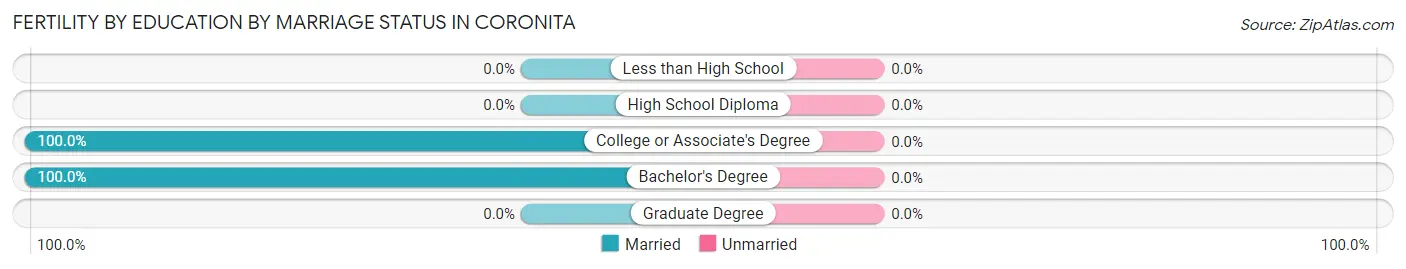
| Educational Attainment | Married | Unmarried |
| Less than High School | 0 (0.0%) | 0 (0.0%) |
| High School Diploma | 0 (0.0%) | 0 (0.0%) |
| College or Associate's Degree | 22 (100.0%) | 0 (0.0%) |
| Bachelor's Degree | 19 (100.0%) | 0 (0.0%) |
| Graduate Degree | 0 (0.0%) | 0 (0.0%) |
| Total | 41 (100.0%) | 0 (0.0%) |
Employment Characteristics in Coronita
Employment by Class of Employer in Coronita
Among the 1,506 employed individuals in Coronita, private company employees (1,078 | 71.6%), local government employees (122 | 8.1%), and not-for-profit organizations (121 | 8.0%) make up the most common classes of employment.
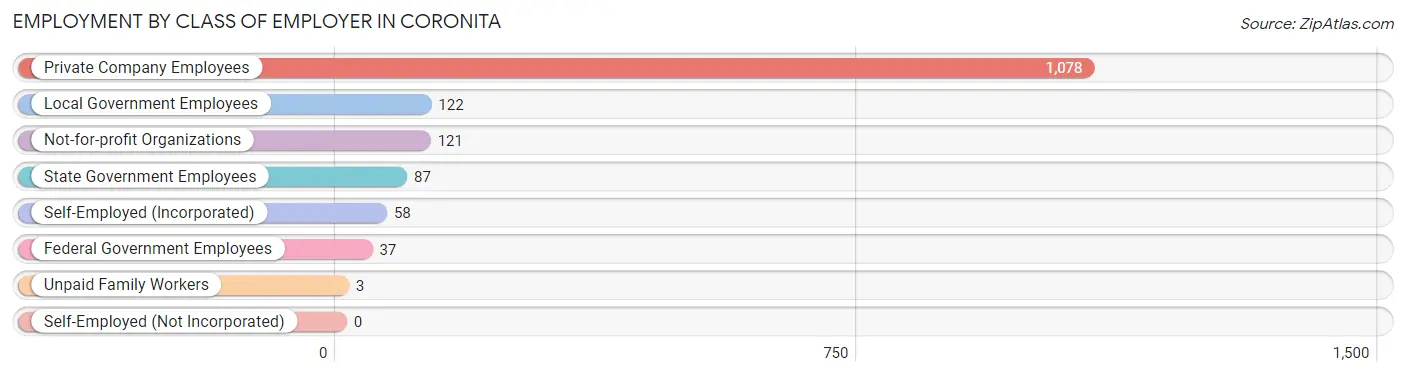
| Employer Class | # Employees | % Employees |
| Private Company Employees | 1,078 | 71.6% |
| Self-Employed (Incorporated) | 58 | 3.8% |
| Self-Employed (Not Incorporated) | 0 | 0.0% |
| Not-for-profit Organizations | 121 | 8.0% |
| Local Government Employees | 122 | 8.1% |
| State Government Employees | 87 | 5.8% |
| Federal Government Employees | 37 | 2.5% |
| Unpaid Family Workers | 3 | 0.2% |
| Total | 1,506 | 100.0% |
Employment Status by Age in Coronita
According to the labor force statistics for Coronita, out of the total population over 16 years of age (2,758), 60.2% or 1,660 individuals are in the labor force, with 1.6% or 27 of them unemployed. The age group with the highest labor force participation rate is 30 to 34 years, with 100.0% or 210 individuals in the labor force. Within the labor force, the 16 to 19 years age range has the highest percentage of unemployed individuals, with 82.4% or 14 of them being unemployed.
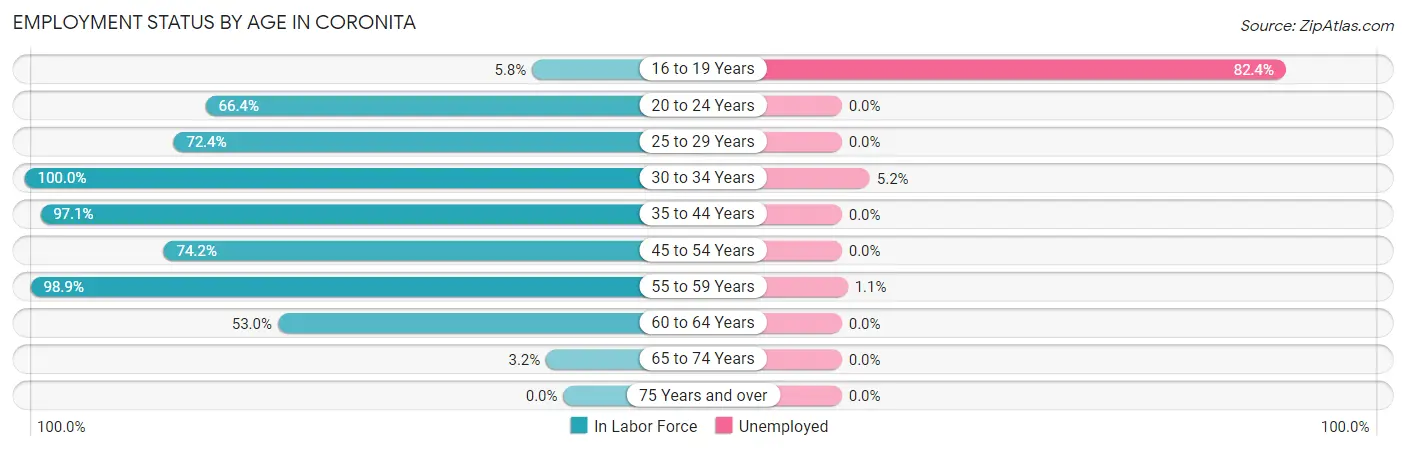
| Age Bracket | In Labor Force | Unemployed |
| 16 to 19 Years | 17 (5.8%) | 14 (82.4%) |
| 20 to 24 Years | 247 (66.4%) | 0 (0.0%) |
| 25 to 29 Years | 213 (72.4%) | 0 (0.0%) |
| 30 to 34 Years | 210 (100.0%) | 11 (5.2%) |
| 35 to 44 Years | 333 (97.1%) | 0 (0.0%) |
| 45 to 54 Years | 305 (74.2%) | 0 (0.0%) |
| 55 to 59 Years | 186 (98.9%) | 2 (1.1%) |
| 60 to 64 Years | 142 (53.0%) | 0 (0.0%) |
| 65 to 74 Years | 6 (3.2%) | 0 (0.0%) |
| 75 Years and over | 0 (0.0%) | 0 (0.0%) |
| Total | 1,660 (60.2%) | 27 (1.6%) |
Employment Status by Educational Attainment in Coronita
According to labor force statistics for Coronita, 81.0% of individuals (1,388) out of the total population between 25 and 64 years of age (1,714) are in the labor force, with 0.9% or 12 of them being unemployed. The group with the highest labor force participation rate are those with the educational attainment of bachelor's degree or higher, with 100.0% or 355 individuals in the labor force. Within the labor force, individuals with college / associate degree education have the highest percentage of unemployment, with 2.5% or 9 of them being unemployed.
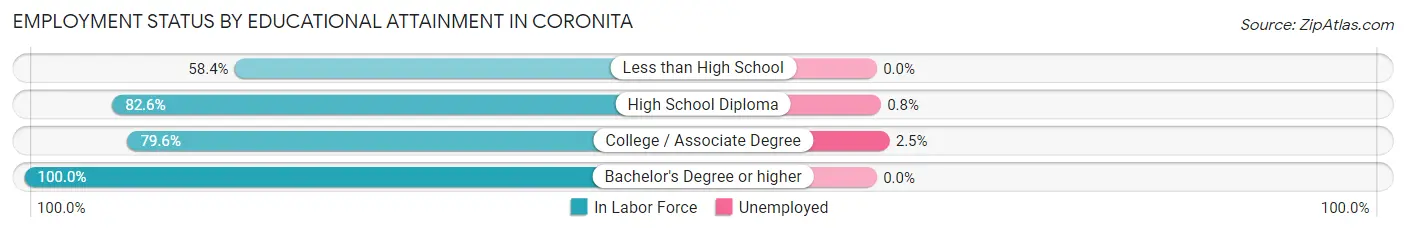
| Educational Attainment | In Labor Force | Unemployed |
| Less than High School | 181 (58.4%) | 0 (0.0%) |
| High School Diploma | 489 (82.6%) | 5 (0.8%) |
| College / Associate Degree | 364 (79.6%) | 11 (2.5%) |
| Bachelor's Degree or higher | 355 (100.0%) | 0 (0.0%) |
| Total | 1,388 (81.0%) | 15 (0.9%) |
Employment Occupations by Sex in Coronita
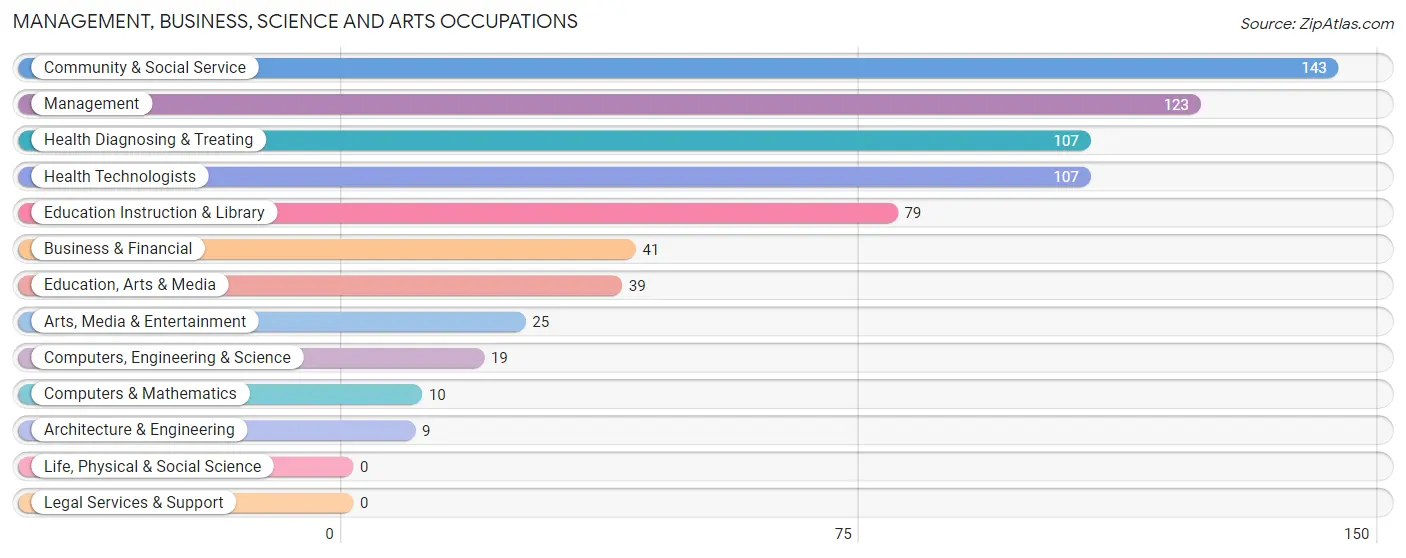
Management, Business, Science and Arts Occupations
The most common Management, Business, Science and Arts occupations in Coronita are Community & Social Service (143 | 8.8%), Management (123 | 7.6%), Health Diagnosing & Treating (107 | 6.6%), Health Technologists (107 | 6.6%), and Education Instruction & Library (79 | 4.9%).
Management, Business, Science and Arts Occupations by Sex
Within the Management, Business, Science and Arts occupations in Coronita, the most male-oriented occupations are Architecture & Engineering (100.0%), Arts, Media & Entertainment (100.0%), and Education Instruction & Library (68.3%), while the most female-oriented occupations are Computers & Mathematics (100.0%), Education, Arts & Media (94.9%), and Health Diagnosing & Treating (72.9%).
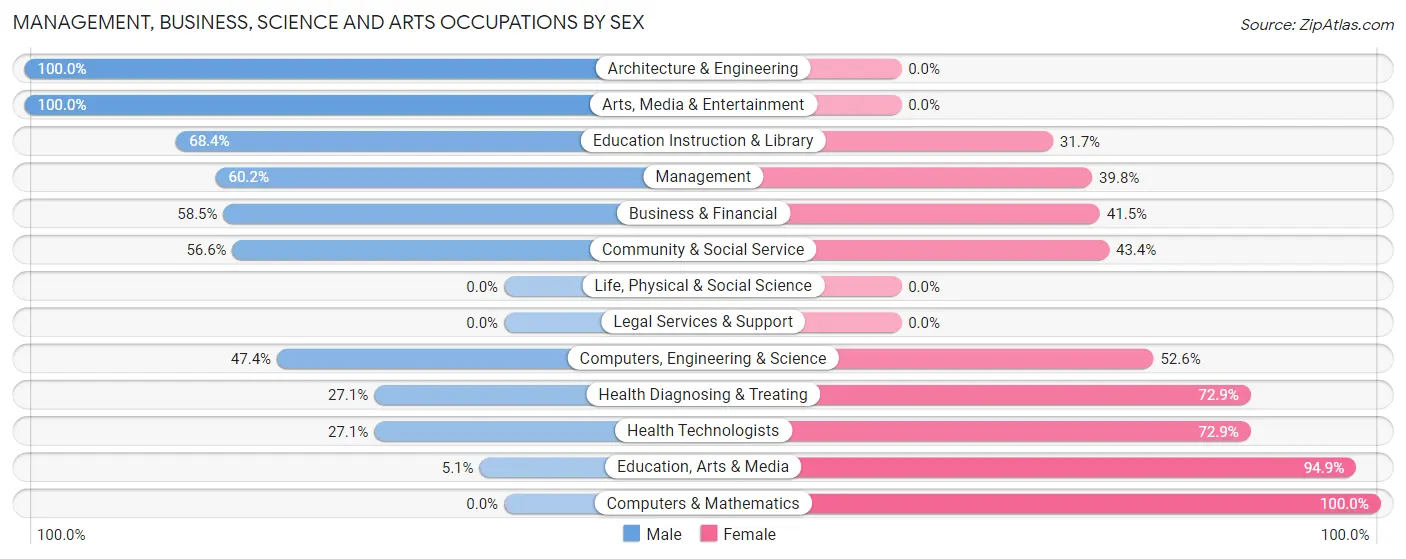
| Occupation | Male | Female |
| Management | 74 (60.2%) | 49 (39.8%) |
| Business & Financial | 24 (58.5%) | 17 (41.5%) |
| Computers, Engineering & Science | 9 (47.4%) | 10 (52.6%) |
| Computers & Mathematics | 0 (0.0%) | 10 (100.0%) |
| Architecture & Engineering | 9 (100.0%) | 0 (0.0%) |
| Life, Physical & Social Science | 0 (0.0%) | 0 (0.0%) |
| Community & Social Service | 81 (56.6%) | 62 (43.4%) |
| Education, Arts & Media | 2 (5.1%) | 37 (94.9%) |
| Legal Services & Support | 0 (0.0%) | 0 (0.0%) |
| Education Instruction & Library | 54 (68.3%) | 25 (31.7%) |
| Arts, Media & Entertainment | 25 (100.0%) | 0 (0.0%) |
| Health Diagnosing & Treating | 29 (27.1%) | 78 (72.9%) |
| Health Technologists | 29 (27.1%) | 78 (72.9%) |
| Total (Category) | 217 (50.1%) | 216 (49.9%) |
| Total (Overall) | 924 (56.9%) | 700 (43.1%) |
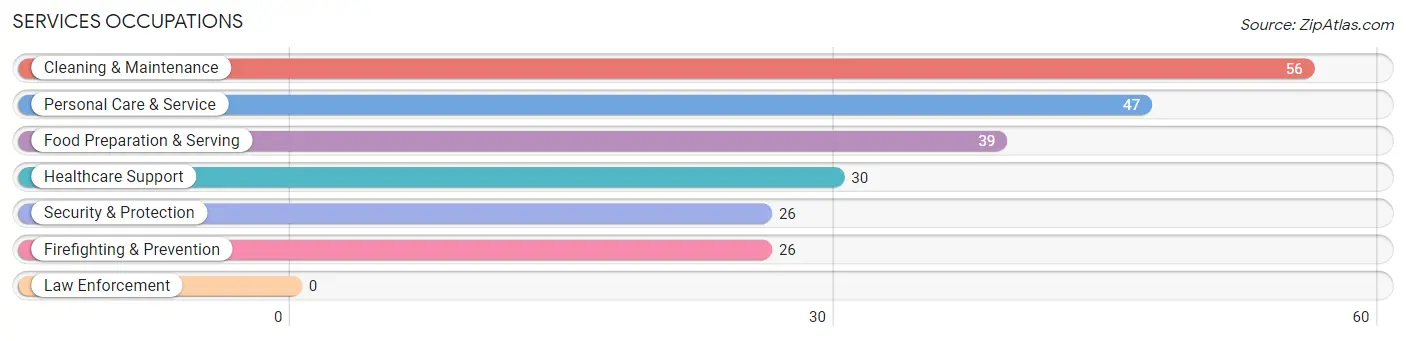
Services Occupations
The most common Services occupations in Coronita are Cleaning & Maintenance (56 | 3.5%), Personal Care & Service (47 | 2.9%), Food Preparation & Serving (39 | 2.4%), Healthcare Support (30 | 1.8%), and Security & Protection (26 | 1.6%).
Services Occupations by Sex
Within the Services occupations in Coronita, the most male-oriented occupations are Security & Protection (100.0%), Firefighting & Prevention (100.0%), and Cleaning & Maintenance (32.1%), while the most female-oriented occupations are Healthcare Support (100.0%), Personal Care & Service (100.0%), and Food Preparation & Serving (76.9%).
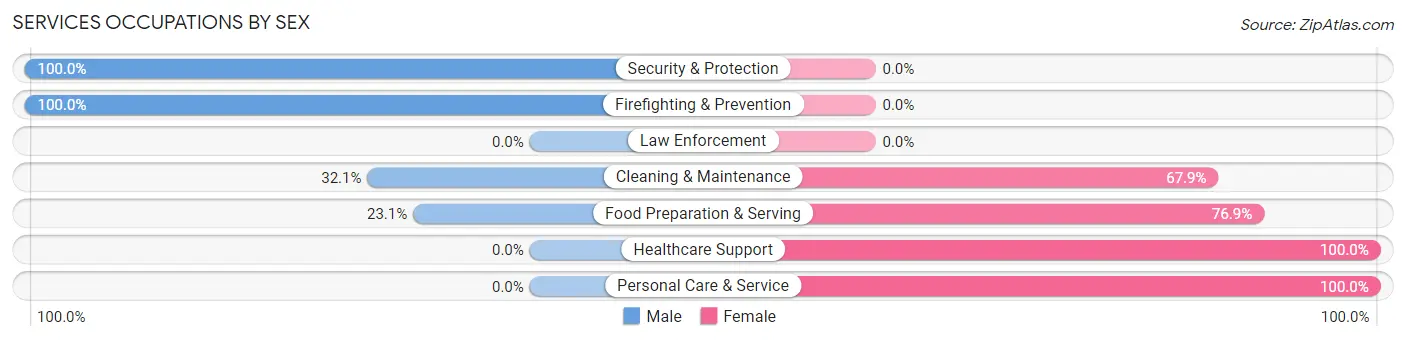
| Occupation | Male | Female |
| Healthcare Support | 0 (0.0%) | 30 (100.0%) |
| Security & Protection | 26 (100.0%) | 0 (0.0%) |
| Firefighting & Prevention | 26 (100.0%) | 0 (0.0%) |
| Law Enforcement | 0 (0.0%) | 0 (0.0%) |
| Food Preparation & Serving | 9 (23.1%) | 30 (76.9%) |
| Cleaning & Maintenance | 18 (32.1%) | 38 (67.9%) |
| Personal Care & Service | 0 (0.0%) | 47 (100.0%) |
| Total (Category) | 53 (26.8%) | 145 (73.2%) |
| Total (Overall) | 924 (56.9%) | 700 (43.1%) |
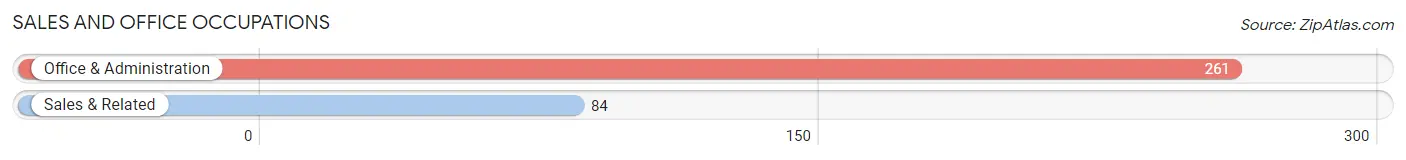
Sales and Office Occupations
The most common Sales and Office occupations in Coronita are Office & Administration (261 | 16.1%), and Sales & Related (84 | 5.2%).
Sales and Office Occupations by Sex
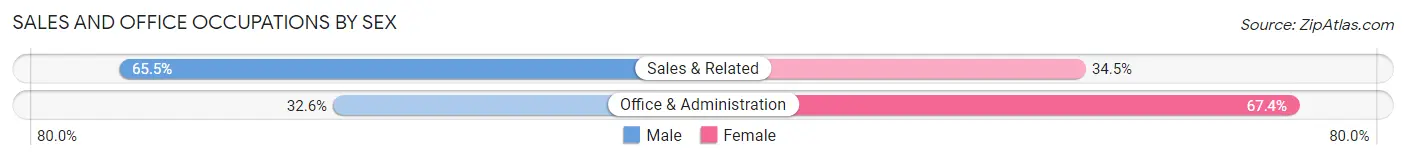
| Occupation | Male | Female |
| Sales & Related | 55 (65.5%) | 29 (34.5%) |
| Office & Administration | 85 (32.6%) | 176 (67.4%) |
| Total (Category) | 140 (40.6%) | 205 (59.4%) |
| Total (Overall) | 924 (56.9%) | 700 (43.1%) |
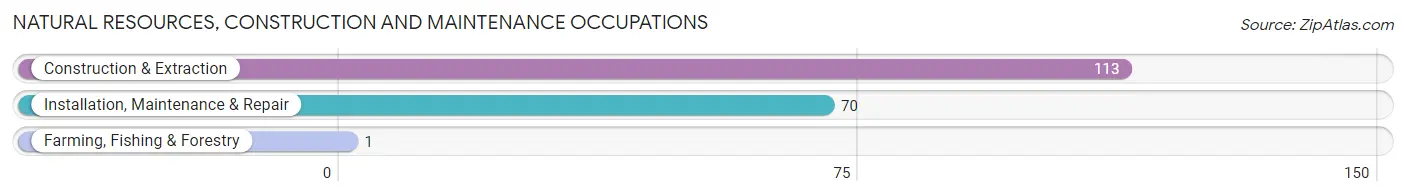
Natural Resources, Construction and Maintenance Occupations
The most common Natural Resources, Construction and Maintenance occupations in Coronita are Construction & Extraction (113 | 7.0%), Installation, Maintenance & Repair (70 | 4.3%), and Farming, Fishing & Forestry (1 | 0.1%).
Natural Resources, Construction and Maintenance Occupations by Sex
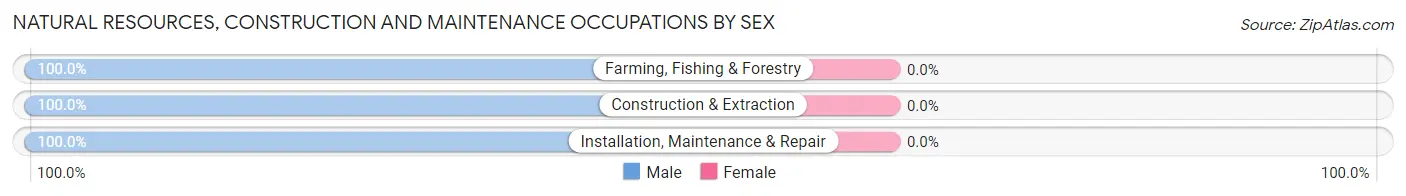
| Occupation | Male | Female |
| Farming, Fishing & Forestry | 1 (100.0%) | 0 (0.0%) |
| Construction & Extraction | 113 (100.0%) | 0 (0.0%) |
| Installation, Maintenance & Repair | 70 (100.0%) | 0 (0.0%) |
| Total (Category) | 184 (100.0%) | 0 (0.0%) |
| Total (Overall) | 924 (56.9%) | 700 (43.1%) |
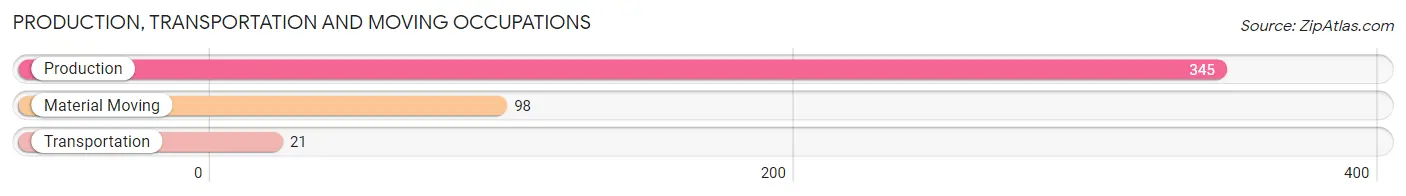
Production, Transportation and Moving Occupations
The most common Production, Transportation and Moving occupations in Coronita are Production (345 | 21.2%), Material Moving (98 | 6.0%), and Transportation (21 | 1.3%).
Production, Transportation and Moving Occupations by Sex
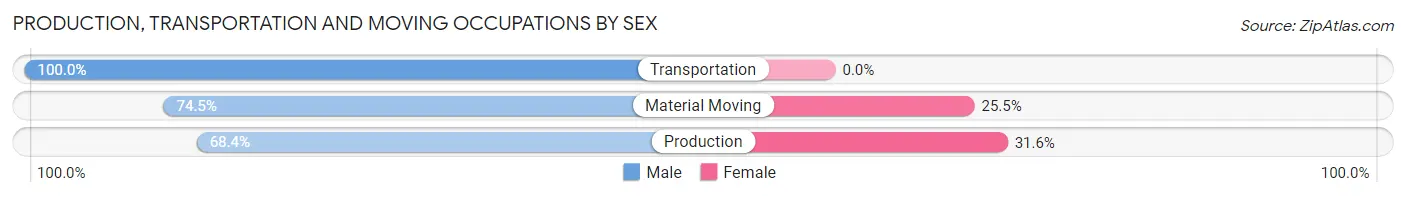
| Occupation | Male | Female |
| Production | 236 (68.4%) | 109 (31.6%) |
| Transportation | 21 (100.0%) | 0 (0.0%) |
| Material Moving | 73 (74.5%) | 25 (25.5%) |
| Total (Category) | 330 (71.1%) | 134 (28.9%) |
| Total (Overall) | 924 (56.9%) | 700 (43.1%) |
Employment Industries by Sex in Coronita
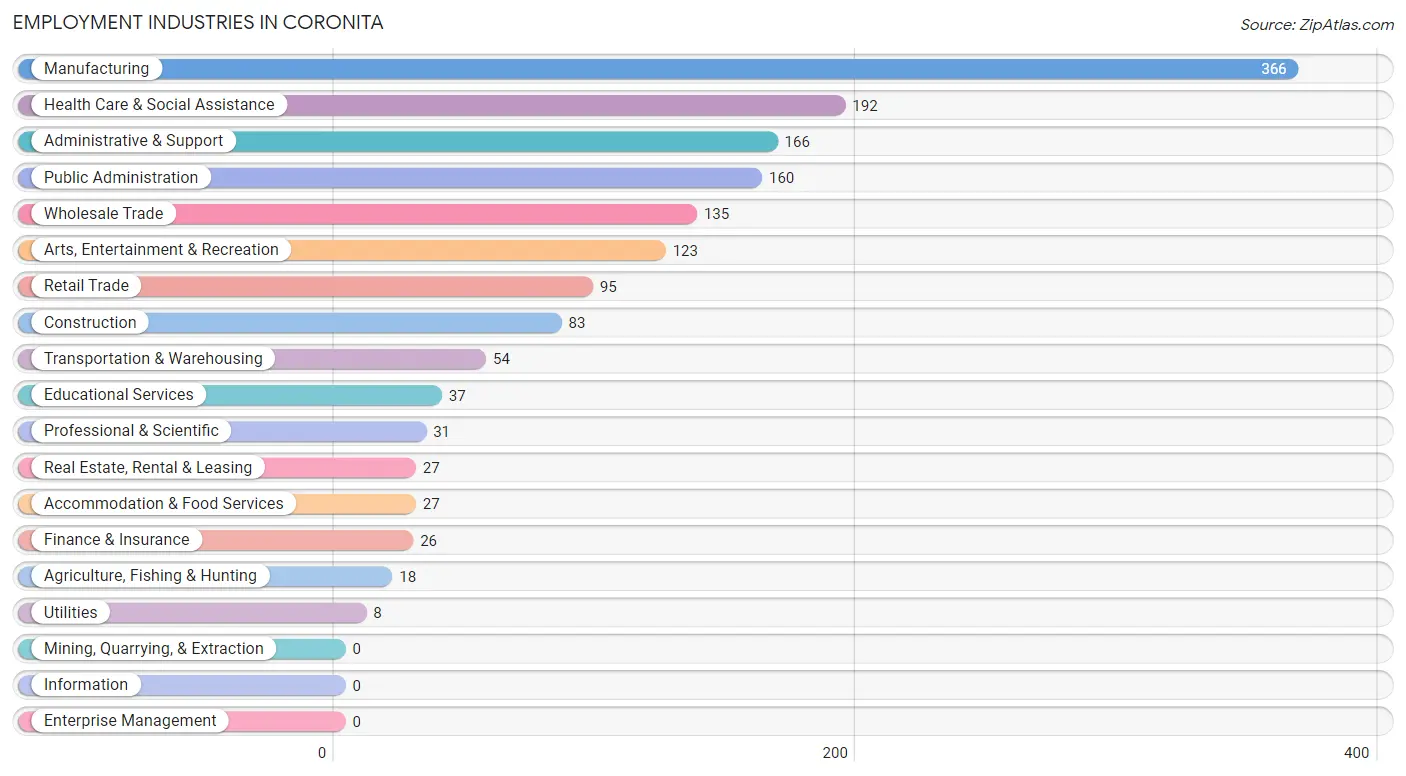
Employment Industries in Coronita
The major employment industries in Coronita include Manufacturing (366 | 22.5%), Health Care & Social Assistance (192 | 11.8%), Administrative & Support (166 | 10.2%), Public Administration (160 | 9.9%), and Wholesale Trade (135 | 8.3%).
Employment Industries by Sex in Coronita
The Coronita industries that see more men than women are Agriculture, Fishing & Hunting (100.0%), Construction (100.0%), and Utilities (100.0%), whereas the industries that tend to have a higher number of women are Finance & Insurance (100.0%), Professional & Scientific (100.0%), and Educational Services (100.0%).
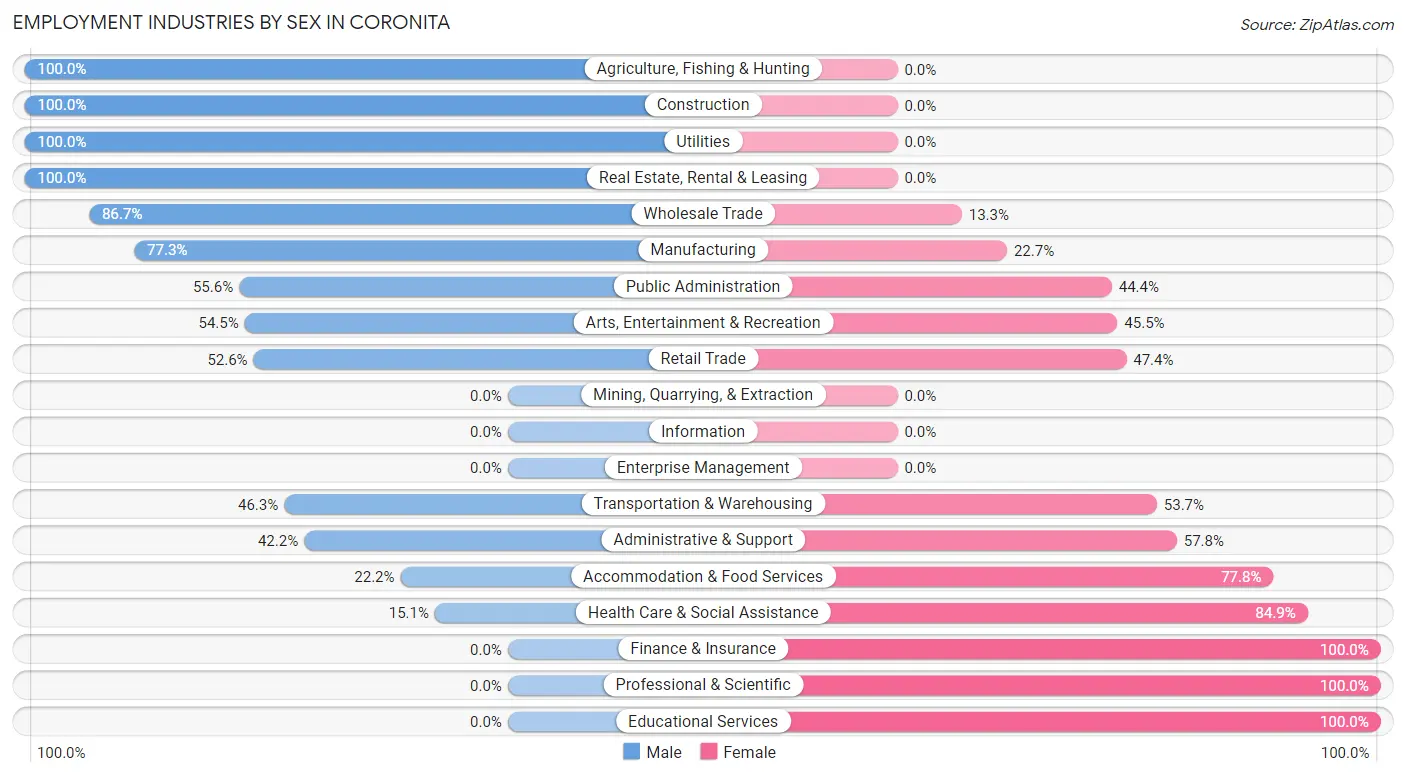
| Industry | Male | Female |
| Agriculture, Fishing & Hunting | 18 (100.0%) | 0 (0.0%) |
| Mining, Quarrying, & Extraction | 0 (0.0%) | 0 (0.0%) |
| Construction | 83 (100.0%) | 0 (0.0%) |
| Manufacturing | 283 (77.3%) | 83 (22.7%) |
| Wholesale Trade | 117 (86.7%) | 18 (13.3%) |
| Retail Trade | 50 (52.6%) | 45 (47.4%) |
| Transportation & Warehousing | 25 (46.3%) | 29 (53.7%) |
| Utilities | 8 (100.0%) | 0 (0.0%) |
| Information | 0 (0.0%) | 0 (0.0%) |
| Finance & Insurance | 0 (0.0%) | 26 (100.0%) |
| Real Estate, Rental & Leasing | 27 (100.0%) | 0 (0.0%) |
| Professional & Scientific | 0 (0.0%) | 31 (100.0%) |
| Enterprise Management | 0 (0.0%) | 0 (0.0%) |
| Administrative & Support | 70 (42.2%) | 96 (57.8%) |
| Educational Services | 0 (0.0%) | 37 (100.0%) |
| Health Care & Social Assistance | 29 (15.1%) | 163 (84.9%) |
| Arts, Entertainment & Recreation | 67 (54.5%) | 56 (45.5%) |
| Accommodation & Food Services | 6 (22.2%) | 21 (77.8%) |
| Public Administration | 89 (55.6%) | 71 (44.4%) |
| Total | 924 (56.9%) | 700 (43.1%) |
Education in Coronita
School Enrollment in Coronita
The most common levels of schooling among the 1,175 students in Coronita are high school (418 | 35.6%), college / undergraduate (406 | 34.5%), and middle school (123 | 10.5%).
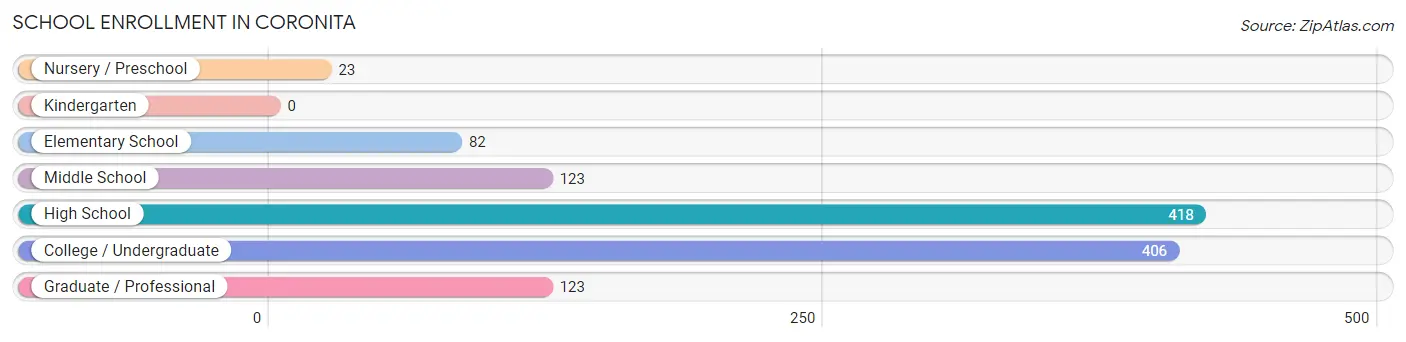
| School Level | # Students | % Students |
| Nursery / Preschool | 23 | 2.0% |
| Kindergarten | 0 | 0.0% |
| Elementary School | 82 | 7.0% |
| Middle School | 123 | 10.5% |
| High School | 418 | 35.6% |
| College / Undergraduate | 406 | 34.5% |
| Graduate / Professional | 123 | 10.5% |
| Total | 1,175 | 100.0% |
School Enrollment by Age by Funding Source in Coronita
Out of a total of 1,175 students who are enrolled in schools in Coronita, 148 (12.6%) attend a private institution, while the remaining 1,027 (87.4%) are enrolled in public schools. The age group of 35 years and over has the highest likelihood of being enrolled in private schools, with 80 (56.7% in the age bracket) enrolled. Conversely, the age group of 3 to 4 year olds has the lowest likelihood of being enrolled in a private school, with 23 (100.0% in the age bracket) attending a public institution.
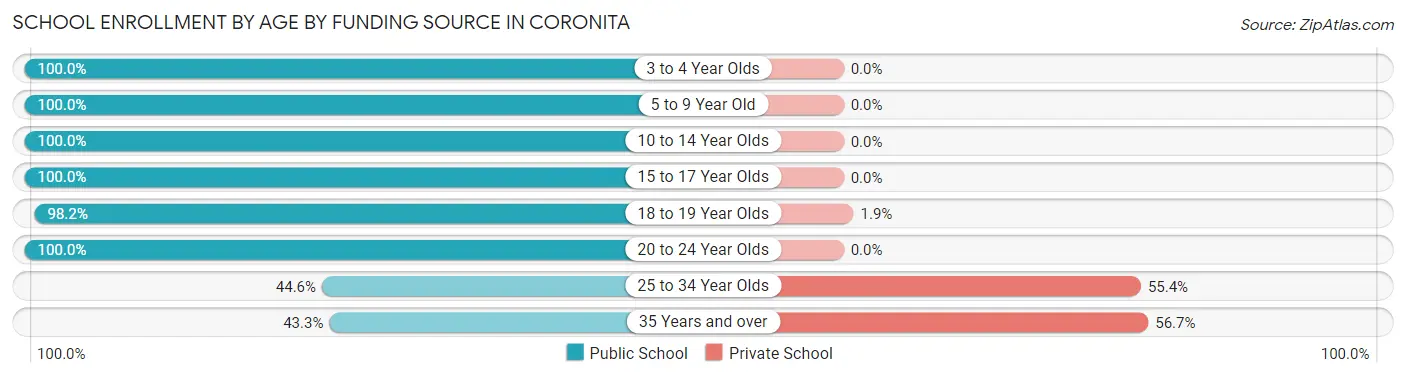
| Age Bracket | Public School | Private School |
| 3 to 4 Year Olds | 23 (100.0%) | 0 (0.0%) |
| 5 to 9 Year Old | 82 (100.0%) | 0 (0.0%) |
| 10 to 14 Year Olds | 203 (100.0%) | 0 (0.0%) |
| 15 to 17 Year Olds | 287 (100.0%) | 0 (0.0%) |
| 18 to 19 Year Olds | 53 (98.2%) | 1 (1.8%) |
| 20 to 24 Year Olds | 264 (100.0%) | 0 (0.0%) |
| 25 to 34 Year Olds | 54 (44.6%) | 67 (55.4%) |
| 35 Years and over | 61 (43.3%) | 80 (56.7%) |
| Total | 1,027 (87.4%) | 148 (12.6%) |
Educational Attainment by Field of Study in Coronita
Science & technology (128 | 26.1%), engineering (103 | 21.0%), business (91 | 18.5%), visual & performing arts (44 | 9.0%), and education (38 | 7.7%) are the most common fields of study among 491 individuals in Coronita who have obtained a bachelor's degree or higher.
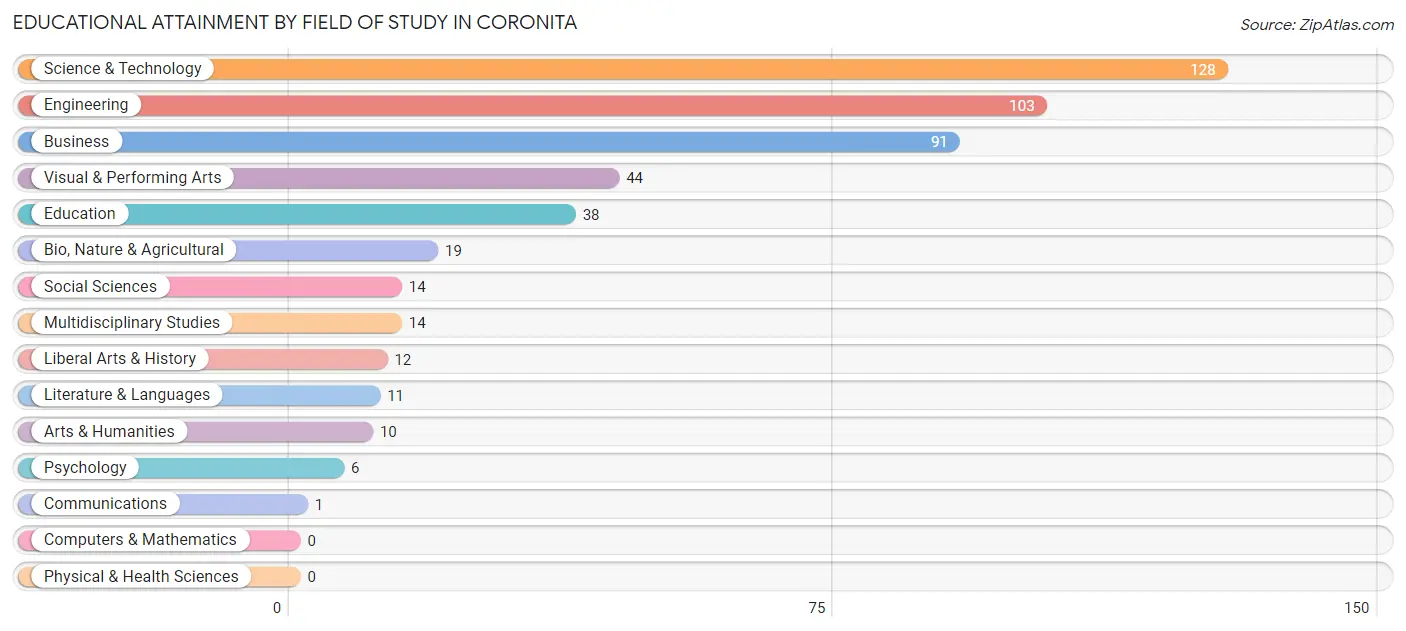
| Field of Study | # Graduates | % Graduates |
| Computers & Mathematics | 0 | 0.0% |
| Bio, Nature & Agricultural | 19 | 3.9% |
| Physical & Health Sciences | 0 | 0.0% |
| Psychology | 6 | 1.2% |
| Social Sciences | 14 | 2.9% |
| Engineering | 103 | 21.0% |
| Multidisciplinary Studies | 14 | 2.9% |
| Science & Technology | 128 | 26.1% |
| Business | 91 | 18.5% |
| Education | 38 | 7.7% |
| Literature & Languages | 11 | 2.2% |
| Liberal Arts & History | 12 | 2.4% |
| Visual & Performing Arts | 44 | 9.0% |
| Communications | 1 | 0.2% |
| Arts & Humanities | 10 | 2.0% |
| Total | 491 | 100.0% |
Transportation & Commute in Coronita
Vehicle Availability by Sex in Coronita
The most prevalent vehicle ownership categories in Coronita are males with 4 vehicles (377, accounting for 40.6%) and females with 4 vehicles (101, making up 66.6%).
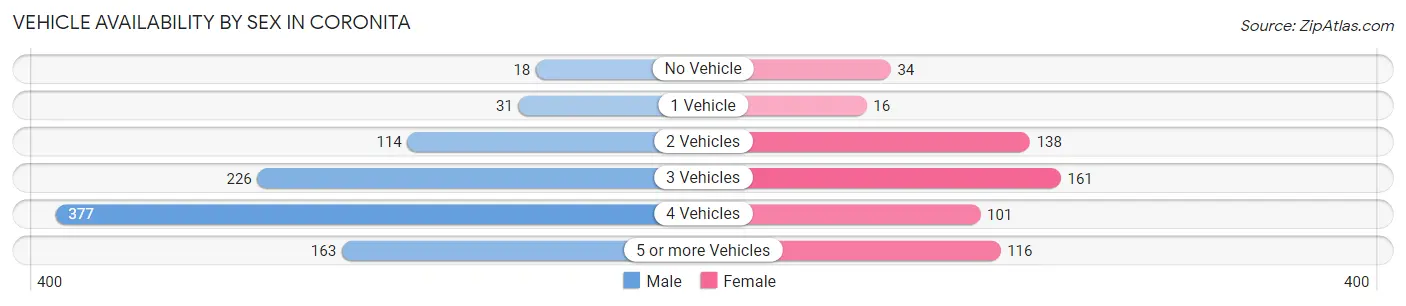
| Vehicles Available | Male | Female |
| No Vehicle | 18 (1.9%) | 34 (6.0%) |
| 1 Vehicle | 31 (3.3%) | 16 (2.8%) |
| 2 Vehicles | 114 (12.3%) | 138 (24.4%) |
| 3 Vehicles | 226 (24.3%) | 161 (28.4%) |
| 4 Vehicles | 377 (40.6%) | 101 (17.8%) |
| 5 or more Vehicles | 163 (17.5%) | 116 (20.5%) |
| Total | 929 (100.0%) | 566 (100.0%) |
Commute Time in Coronita
The most frequently occuring commute durations in Coronita are 60 to 89 minutes (334 commuters, 25.9%), 30 to 34 minutes (247 commuters, 19.2%), and 20 to 24 minutes (133 commuters, 10.3%).
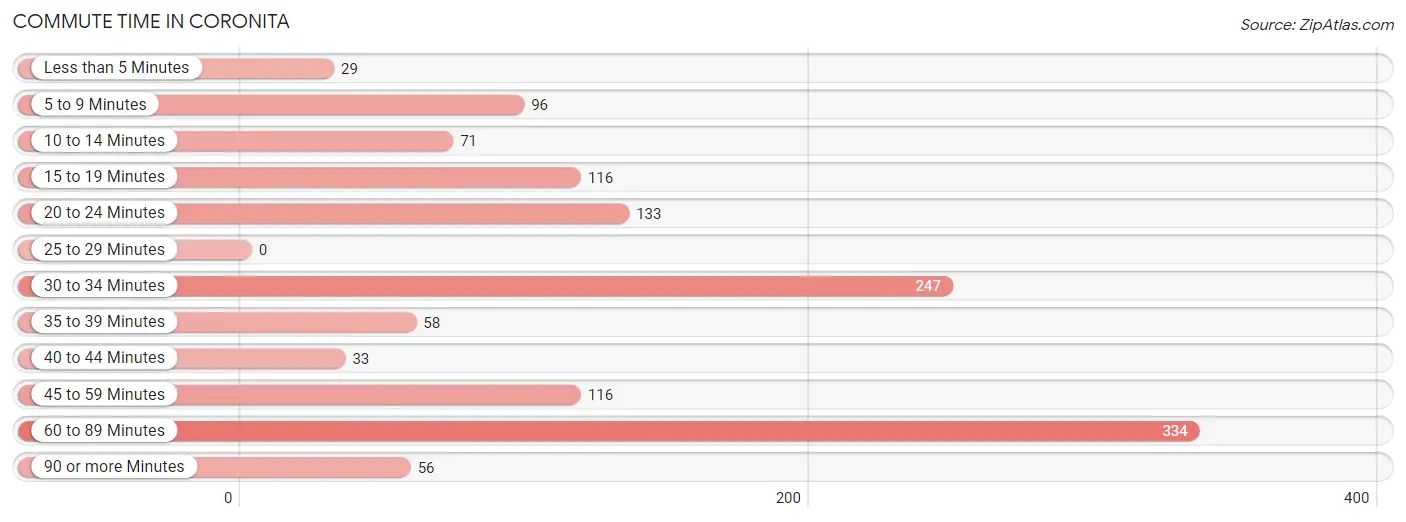
| Commute Time | # Commuters | % Commuters |
| Less than 5 Minutes | 29 | 2.2% |
| 5 to 9 Minutes | 96 | 7.4% |
| 10 to 14 Minutes | 71 | 5.5% |
| 15 to 19 Minutes | 116 | 9.0% |
| 20 to 24 Minutes | 133 | 10.3% |
| 25 to 29 Minutes | 0 | 0.0% |
| 30 to 34 Minutes | 247 | 19.2% |
| 35 to 39 Minutes | 58 | 4.5% |
| 40 to 44 Minutes | 33 | 2.6% |
| 45 to 59 Minutes | 116 | 9.0% |
| 60 to 89 Minutes | 334 | 25.9% |
| 90 or more Minutes | 56 | 4.3% |
Commute Time by Sex in Coronita
The most common commute times in Coronita are 60 to 89 minutes (259 commuters, 32.3%) for males and 20 to 24 minutes (132 commuters, 27.1%) for females.
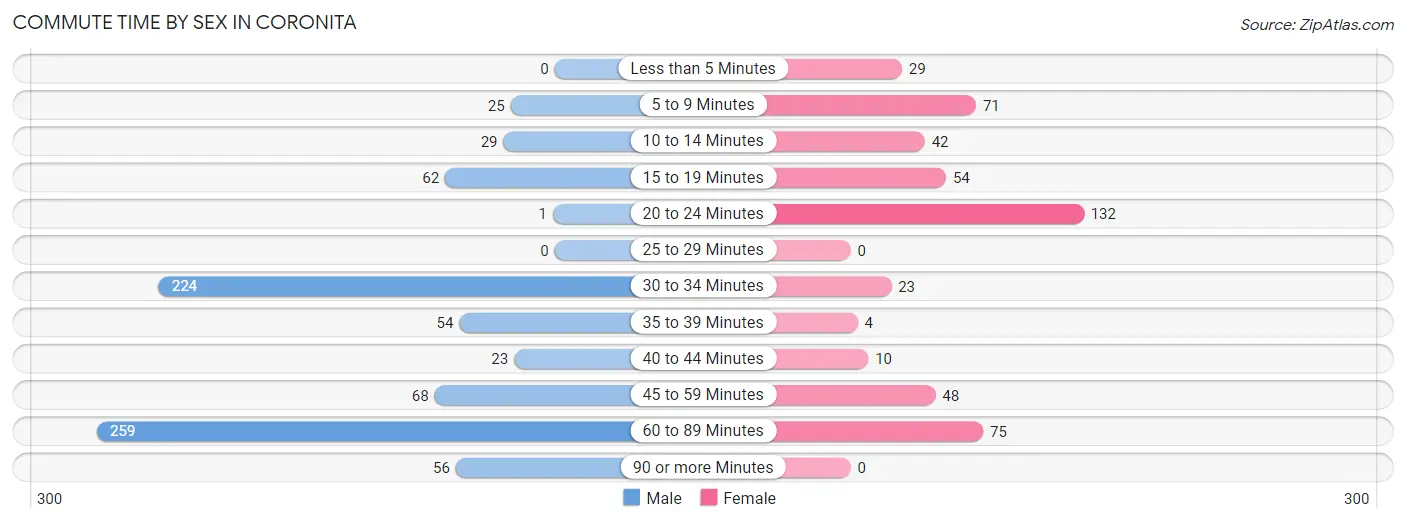
| Commute Time | Male | Female |
| Less than 5 Minutes | 0 (0.0%) | 29 (5.9%) |
| 5 to 9 Minutes | 25 (3.1%) | 71 (14.5%) |
| 10 to 14 Minutes | 29 (3.6%) | 42 (8.6%) |
| 15 to 19 Minutes | 62 (7.7%) | 54 (11.1%) |
| 20 to 24 Minutes | 1 (0.1%) | 132 (27.1%) |
| 25 to 29 Minutes | 0 (0.0%) | 0 (0.0%) |
| 30 to 34 Minutes | 224 (28.0%) | 23 (4.7%) |
| 35 to 39 Minutes | 54 (6.7%) | 4 (0.8%) |
| 40 to 44 Minutes | 23 (2.9%) | 10 (2.1%) |
| 45 to 59 Minutes | 68 (8.5%) | 48 (9.8%) |
| 60 to 89 Minutes | 259 (32.3%) | 75 (15.4%) |
| 90 or more Minutes | 56 (7.0%) | 0 (0.0%) |
Time of Departure to Work by Sex in Coronita
The most frequent times of departure to work in Coronita are 7:00 AM to 7:29 AM (144, 18.0%) for males and 7:00 AM to 7:29 AM (129, 26.4%) for females.
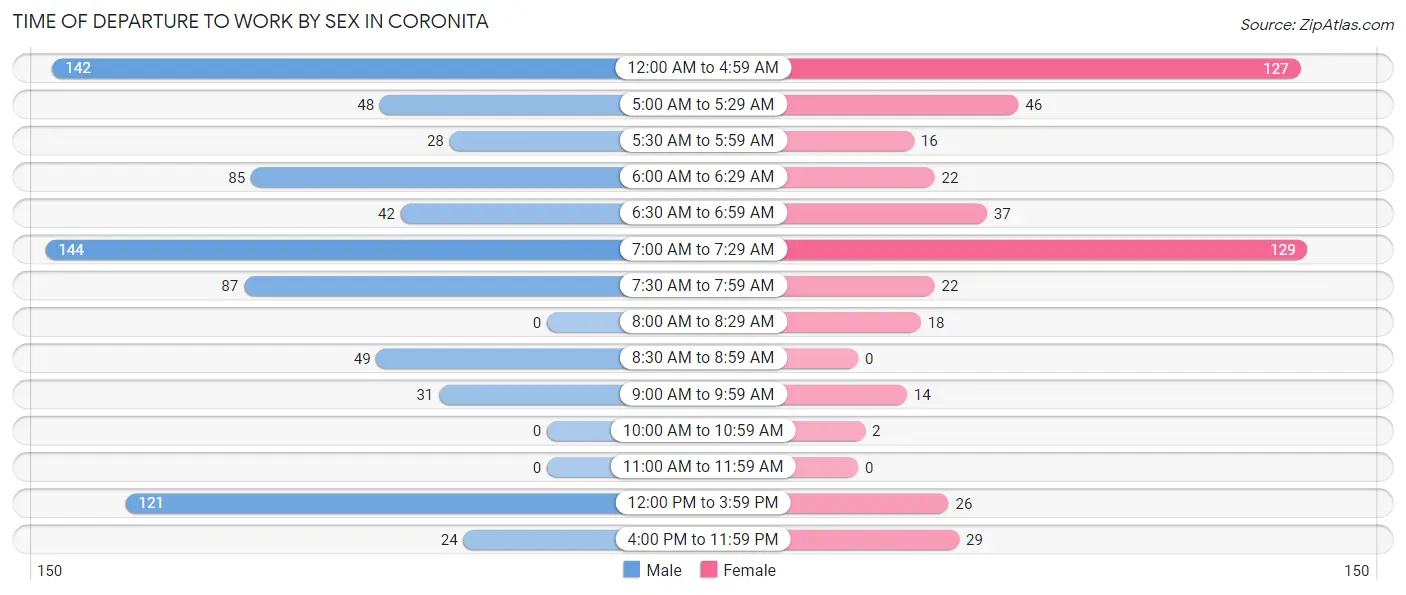
| Time of Departure | Male | Female |
| 12:00 AM to 4:59 AM | 142 (17.7%) | 127 (26.0%) |
| 5:00 AM to 5:29 AM | 48 (6.0%) | 46 (9.4%) |
| 5:30 AM to 5:59 AM | 28 (3.5%) | 16 (3.3%) |
| 6:00 AM to 6:29 AM | 85 (10.6%) | 22 (4.5%) |
| 6:30 AM to 6:59 AM | 42 (5.2%) | 37 (7.6%) |
| 7:00 AM to 7:29 AM | 144 (18.0%) | 129 (26.4%) |
| 7:30 AM to 7:59 AM | 87 (10.9%) | 22 (4.5%) |
| 8:00 AM to 8:29 AM | 0 (0.0%) | 18 (3.7%) |
| 8:30 AM to 8:59 AM | 49 (6.1%) | 0 (0.0%) |
| 9:00 AM to 9:59 AM | 31 (3.9%) | 14 (2.9%) |
| 10:00 AM to 10:59 AM | 0 (0.0%) | 2 (0.4%) |
| 11:00 AM to 11:59 AM | 0 (0.0%) | 0 (0.0%) |
| 12:00 PM to 3:59 PM | 121 (15.1%) | 26 (5.3%) |
| 4:00 PM to 11:59 PM | 24 (3.0%) | 29 (5.9%) |
| Total | 801 (100.0%) | 488 (100.0%) |
Housing Occupancy in Coronita
Occupancy by Ownership in Coronita
Of the total 865 dwellings in Coronita, owner-occupied units account for 744 (86.0%), while renter-occupied units make up 121 (14.0%).
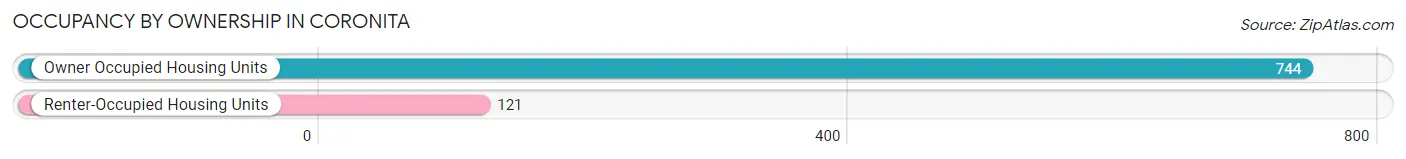
| Occupancy | # Housing Units | % Housing Units |
| Owner Occupied Housing Units | 744 | 86.0% |
| Renter-Occupied Housing Units | 121 | 14.0% |
| Total Occupied Housing Units | 865 | 100.0% |
Occupancy by Household Size in Coronita
| Household Size | # Housing Units | % Housing Units |
| 1-Person Household | 75 | 8.7% |
| 2-Person Household | 236 | 27.3% |
| 3-Person Household | 181 | 20.9% |
| 4+ Person Household | 373 | 43.1% |
| Total Housing Units | 865 | 100.0% |
Occupancy by Ownership by Household Size in Coronita
| Household Size | Owner-occupied | Renter-occupied |
| 1-Person Household | 75 (100.0%) | 0 (0.0%) |
| 2-Person Household | 198 (83.9%) | 38 (16.1%) |
| 3-Person Household | 135 (74.6%) | 46 (25.4%) |
| 4+ Person Household | 336 (90.1%) | 37 (9.9%) |
| Total Housing Units | 744 (86.0%) | 121 (14.0%) |
Occupancy by Educational Attainment in Coronita
| Household Size | Owner-occupied | Renter-occupied |
| Less than High School | 188 (78.7%) | 51 (21.3%) |
| High School Diploma | 212 (78.5%) | 58 (21.5%) |
| College/Associate Degree | 184 (95.8%) | 8 (4.2%) |
| Bachelor's Degree or higher | 160 (97.6%) | 4 (2.4%) |
Occupancy by Age of Householder in Coronita
| Age Bracket | # Households | % Households |
| Under 35 Years | 139 | 16.1% |
| 35 to 44 Years | 116 | 13.4% |
| 45 to 54 Years | 223 | 25.8% |
| 55 to 64 Years | 180 | 20.8% |
| 65 to 74 Years | 117 | 13.5% |
| 75 to 84 Years | 43 | 5.0% |
| 85 Years and Over | 47 | 5.4% |
| Total | 865 | 100.0% |
Housing Finances in Coronita
Median Income by Occupancy in Coronita
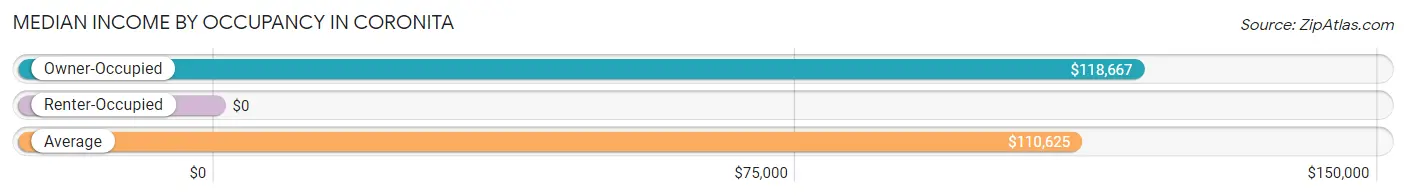
| Occupancy Type | # Households | Median Income |
| Owner-Occupied | 744 (86.0%) | $118,667 |
| Renter-Occupied | 121 (14.0%) | $0 |
| Average | 865 (100.0%) | $110,625 |
Occupancy by Householder Income Bracket in Coronita
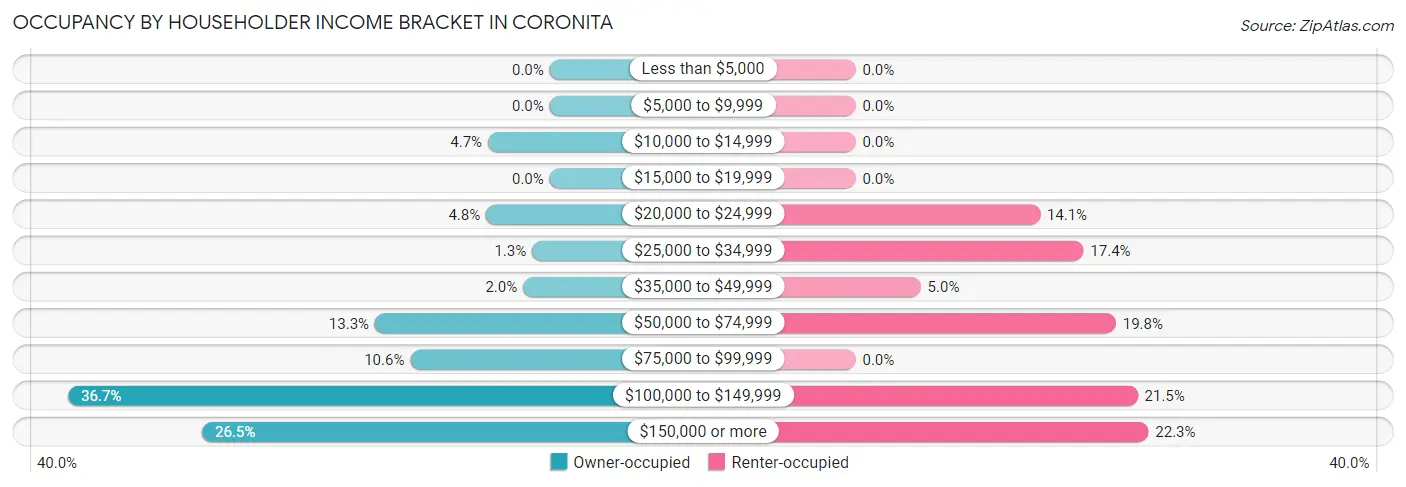
| Income Bracket | Owner-occupied | Renter-occupied |
| Less than $5,000 | 0 (0.0%) | 0 (0.0%) |
| $5,000 to $9,999 | 0 (0.0%) | 0 (0.0%) |
| $10,000 to $14,999 | 35 (4.7%) | 0 (0.0%) |
| $15,000 to $19,999 | 0 (0.0%) | 0 (0.0%) |
| $20,000 to $24,999 | 36 (4.8%) | 17 (14.1%) |
| $25,000 to $34,999 | 10 (1.3%) | 21 (17.4%) |
| $35,000 to $49,999 | 15 (2.0%) | 6 (5.0%) |
| $50,000 to $74,999 | 99 (13.3%) | 24 (19.8%) |
| $75,000 to $99,999 | 79 (10.6%) | 0 (0.0%) |
| $100,000 to $149,999 | 273 (36.7%) | 26 (21.5%) |
| $150,000 or more | 197 (26.5%) | 27 (22.3%) |
| Total | 744 (100.0%) | 121 (100.0%) |
Monthly Housing Cost Tiers in Coronita
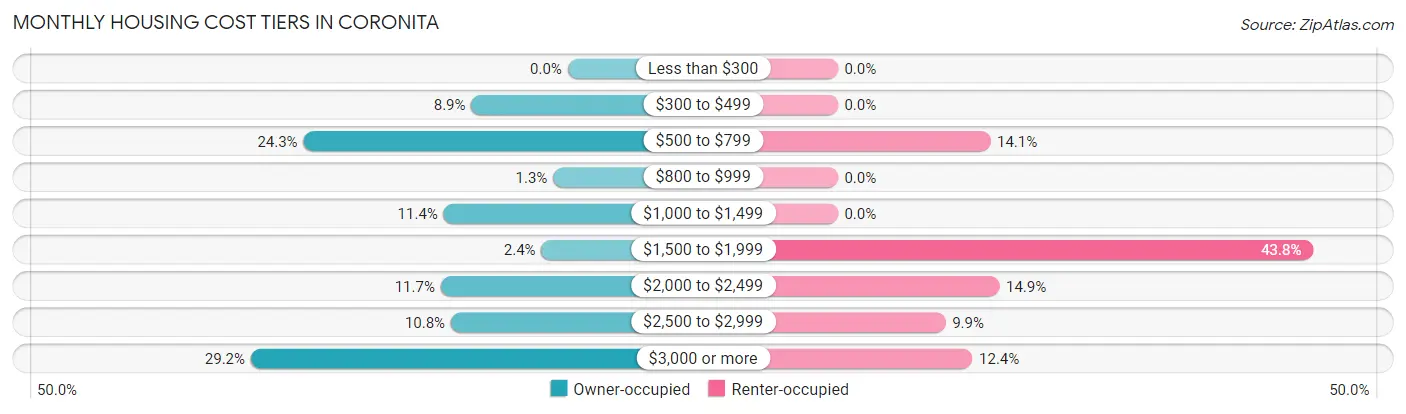
| Monthly Cost | Owner-occupied | Renter-occupied |
| Less than $300 | 0 (0.0%) | 0 (0.0%) |
| $300 to $499 | 66 (8.9%) | 0 (0.0%) |
| $500 to $799 | 181 (24.3%) | 17 (14.1%) |
| $800 to $999 | 10 (1.3%) | 0 (0.0%) |
| $1,000 to $1,499 | 85 (11.4%) | 0 (0.0%) |
| $1,500 to $1,999 | 18 (2.4%) | 53 (43.8%) |
| $2,000 to $2,499 | 87 (11.7%) | 18 (14.9%) |
| $2,500 to $2,999 | 80 (10.7%) | 12 (9.9%) |
| $3,000 or more | 217 (29.2%) | 15 (12.4%) |
| Total | 744 (100.0%) | 121 (100.0%) |
Physical Housing Characteristics in Coronita
Housing Structures in Coronita
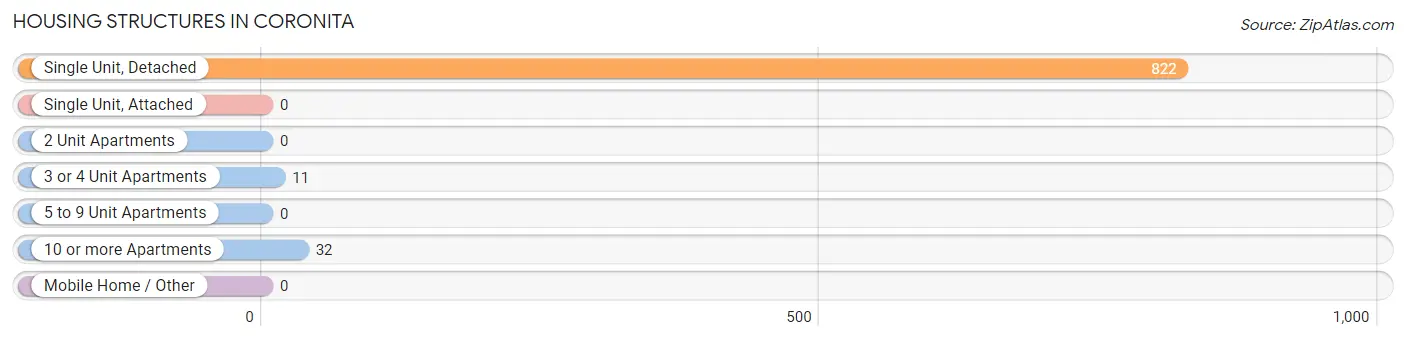
| Structure Type | # Housing Units | % Housing Units |
| Single Unit, Detached | 822 | 95.0% |
| Single Unit, Attached | 0 | 0.0% |
| 2 Unit Apartments | 0 | 0.0% |
| 3 or 4 Unit Apartments | 11 | 1.3% |
| 5 to 9 Unit Apartments | 0 | 0.0% |
| 10 or more Apartments | 32 | 3.7% |
| Mobile Home / Other | 0 | 0.0% |
| Total | 865 | 100.0% |
Housing Structures by Occupancy in Coronita
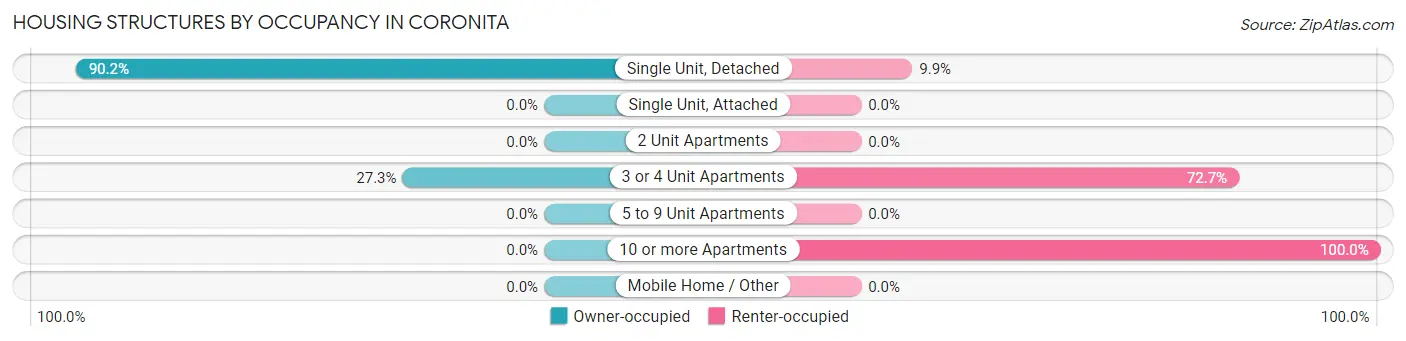
| Structure Type | Owner-occupied | Renter-occupied |
| Single Unit, Detached | 741 (90.1%) | 81 (9.9%) |
| Single Unit, Attached | 0 (0.0%) | 0 (0.0%) |
| 2 Unit Apartments | 0 (0.0%) | 0 (0.0%) |
| 3 or 4 Unit Apartments | 3 (27.3%) | 8 (72.7%) |
| 5 to 9 Unit Apartments | 0 (0.0%) | 0 (0.0%) |
| 10 or more Apartments | 0 (0.0%) | 32 (100.0%) |
| Mobile Home / Other | 0 (0.0%) | 0 (0.0%) |
| Total | 744 (86.0%) | 121 (14.0%) |
Housing Structures by Number of Rooms in Coronita
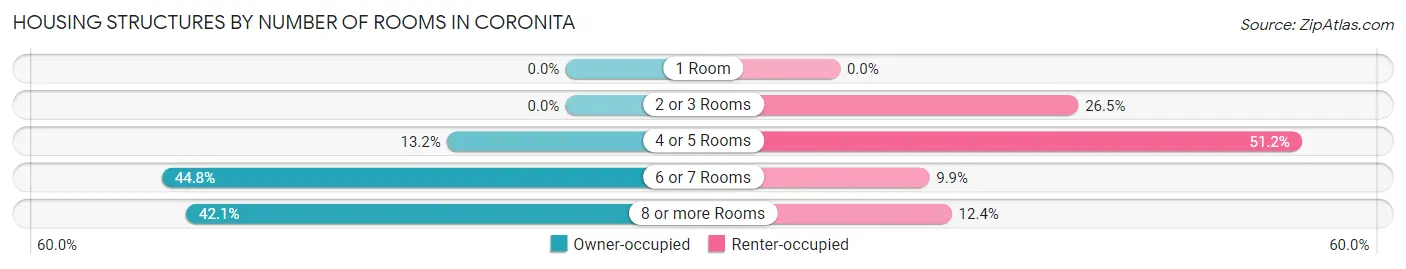
| Number of Rooms | Owner-occupied | Renter-occupied |
| 1 Room | 0 (0.0%) | 0 (0.0%) |
| 2 or 3 Rooms | 0 (0.0%) | 32 (26.5%) |
| 4 or 5 Rooms | 98 (13.2%) | 62 (51.2%) |
| 6 or 7 Rooms | 333 (44.8%) | 12 (9.9%) |
| 8 or more Rooms | 313 (42.1%) | 15 (12.4%) |
| Total | 744 (100.0%) | 121 (100.0%) |
Housing Structure by Heating Type in Coronita
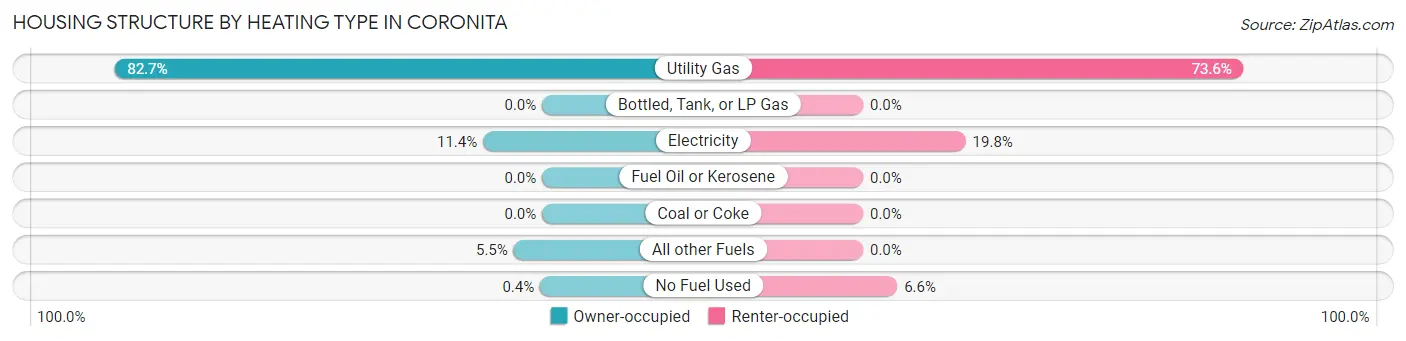
| Heating Type | Owner-occupied | Renter-occupied |
| Utility Gas | 615 (82.7%) | 89 (73.6%) |
| Bottled, Tank, or LP Gas | 0 (0.0%) | 0 (0.0%) |
| Electricity | 85 (11.4%) | 24 (19.8%) |
| Fuel Oil or Kerosene | 0 (0.0%) | 0 (0.0%) |
| Coal or Coke | 0 (0.0%) | 0 (0.0%) |
| All other Fuels | 41 (5.5%) | 0 (0.0%) |
| No Fuel Used | 3 (0.4%) | 8 (6.6%) |
| Total | 744 (100.0%) | 121 (100.0%) |
Household Vehicle Usage in Coronita
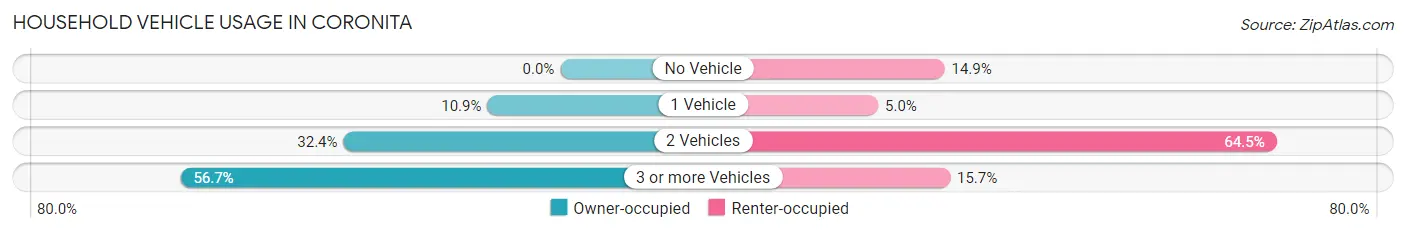
| Vehicles per Household | Owner-occupied | Renter-occupied |
| No Vehicle | 0 (0.0%) | 18 (14.9%) |
| 1 Vehicle | 81 (10.9%) | 6 (5.0%) |
| 2 Vehicles | 241 (32.4%) | 78 (64.5%) |
| 3 or more Vehicles | 422 (56.7%) | 19 (15.7%) |
| Total | 744 (100.0%) | 121 (100.0%) |
Real Estate & Mortgages in Coronita
Real Estate and Mortgage Overview in Coronita
| Characteristic | Without Mortgage | With Mortgage |
| Housing Units | 263 | 481 |
| Median Property Value | $457,800 | $632,000 |
| Median Household Income | $63,824 | $197 |
| Monthly Housing Costs | $558 | $217 |
| Real Estate Taxes | $2,712 | $0 |
Property Value by Mortgage Status in Coronita
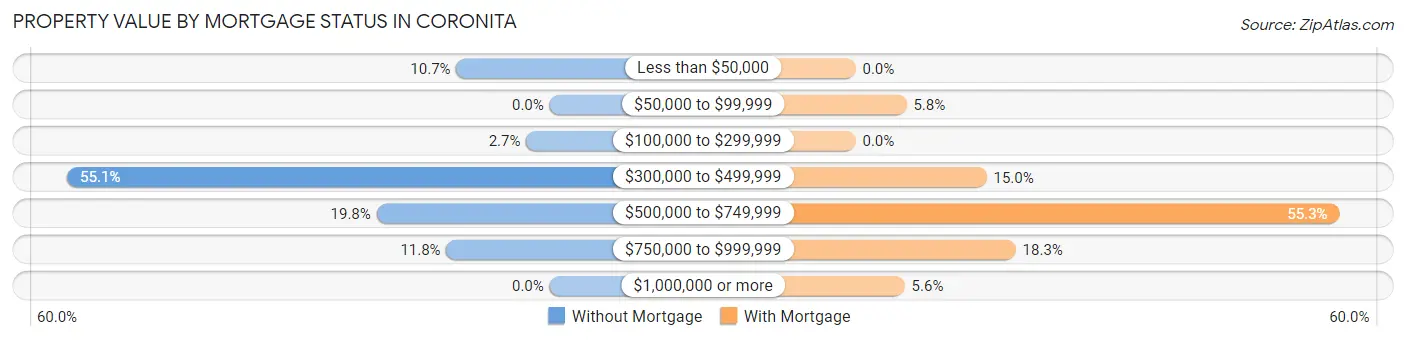
| Property Value | Without Mortgage | With Mortgage |
| Less than $50,000 | 28 (10.6%) | 0 (0.0%) |
| $50,000 to $99,999 | 0 (0.0%) | 28 (5.8%) |
| $100,000 to $299,999 | 7 (2.7%) | 0 (0.0%) |
| $300,000 to $499,999 | 145 (55.1%) | 72 (15.0%) |
| $500,000 to $749,999 | 52 (19.8%) | 266 (55.3%) |
| $750,000 to $999,999 | 31 (11.8%) | 88 (18.3%) |
| $1,000,000 or more | 0 (0.0%) | 27 (5.6%) |
| Total | 263 (100.0%) | 481 (100.0%) |
Household Income by Mortgage Status in Coronita
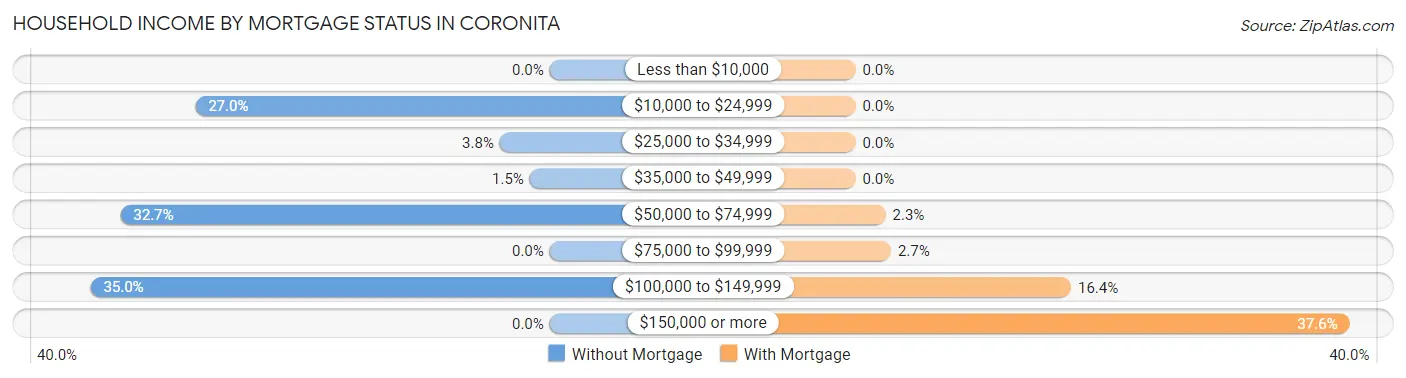
| Household Income | Without Mortgage | With Mortgage |
| Less than $10,000 | 0 (0.0%) | 0 (0.0%) |
| $10,000 to $24,999 | 71 (27.0%) | 0 (0.0%) |
| $25,000 to $34,999 | 10 (3.8%) | 0 (0.0%) |
| $35,000 to $49,999 | 4 (1.5%) | 0 (0.0%) |
| $50,000 to $74,999 | 86 (32.7%) | 11 (2.3%) |
| $75,000 to $99,999 | 0 (0.0%) | 13 (2.7%) |
| $100,000 to $149,999 | 92 (35.0%) | 79 (16.4%) |
| $150,000 or more | 0 (0.0%) | 181 (37.6%) |
| Total | 263 (100.0%) | 481 (100.0%) |
Property Value to Household Income Ratio in Coronita
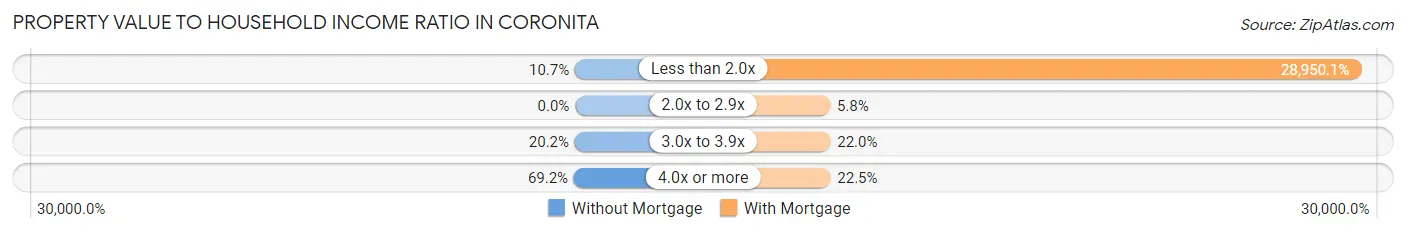
| Value-to-Income Ratio | Without Mortgage | With Mortgage |
| Less than 2.0x | 28 (10.6%) | 139,250 (28,950.1%) |
| 2.0x to 2.9x | 0 (0.0%) | 28 (5.8%) |
| 3.0x to 3.9x | 53 (20.2%) | 106 (22.0%) |
| 4.0x or more | 182 (69.2%) | 108 (22.5%) |
| Total | 263 (100.0%) | 481 (100.0%) |
Real Estate Taxes by Mortgage Status in Coronita
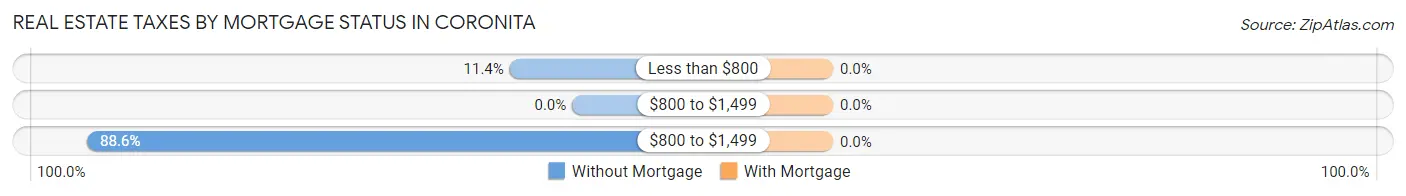
| Property Taxes | Without Mortgage | With Mortgage |
| Less than $800 | 30 (11.4%) | 0 (0.0%) |
| $800 to $1,499 | 0 (0.0%) | 0 (0.0%) |
| $800 to $1,499 | 233 (88.6%) | 0 (0.0%) |
| Total | 263 (100.0%) | 481 (100.0%) |
Health & Disability in Coronita
Health Insurance Coverage by Age in Coronita
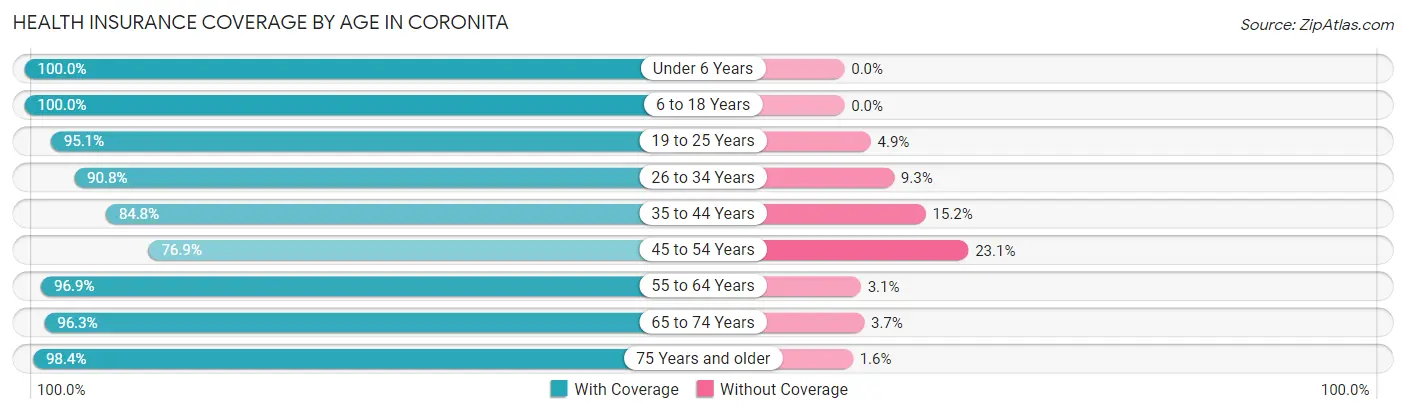
| Age Bracket | With Coverage | Without Coverage |
| Under 6 Years | 115 (100.0%) | 0 (0.0%) |
| 6 to 18 Years | 652 (100.0%) | 0 (0.0%) |
| 19 to 25 Years | 446 (95.1%) | 23 (4.9%) |
| 26 to 34 Years | 363 (90.7%) | 37 (9.2%) |
| 35 to 44 Years | 291 (84.8%) | 52 (15.2%) |
| 45 to 54 Years | 316 (76.9%) | 95 (23.1%) |
| 55 to 64 Years | 442 (96.9%) | 14 (3.1%) |
| 65 to 74 Years | 183 (96.3%) | 7 (3.7%) |
| 75 Years and older | 188 (98.4%) | 3 (1.6%) |
| Total | 2,996 (92.8%) | 231 (7.2%) |
Health Insurance Coverage by Citizenship Status in Coronita
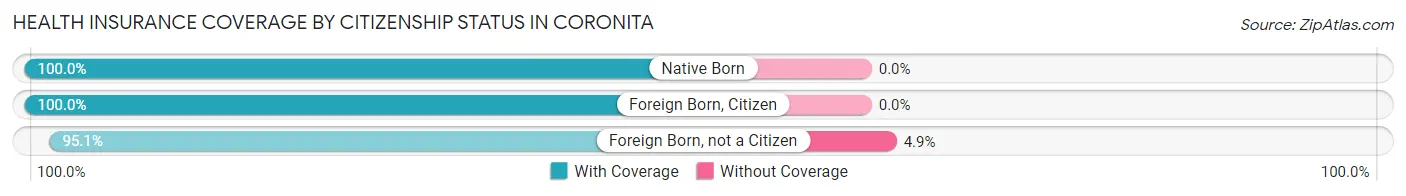
| Citizenship Status | With Coverage | Without Coverage |
| Native Born | 115 (100.0%) | 0 (0.0%) |
| Foreign Born, Citizen | 652 (100.0%) | 0 (0.0%) |
| Foreign Born, not a Citizen | 446 (95.1%) | 23 (4.9%) |
Health Insurance Coverage by Household Income in Coronita
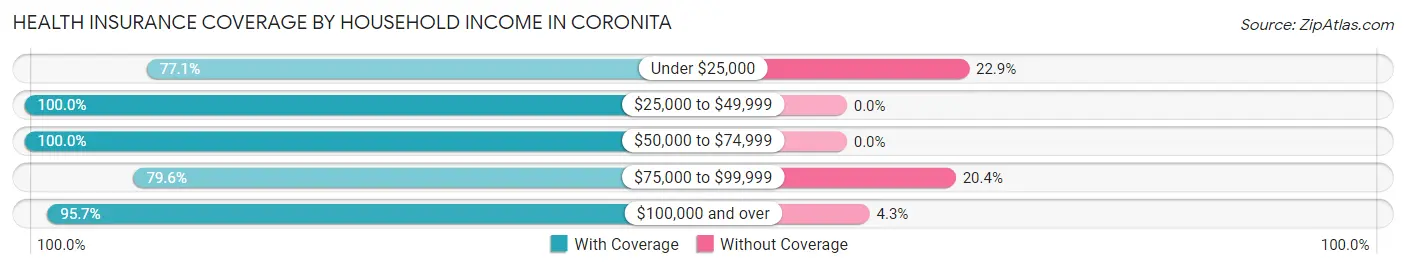
| Household Income | With Coverage | Without Coverage |
| Under $25,000 | 101 (77.1%) | 30 (22.9%) |
| $25,000 to $49,999 | 129 (100.0%) | 0 (0.0%) |
| $50,000 to $74,999 | 332 (100.0%) | 0 (0.0%) |
| $75,000 to $99,999 | 429 (79.6%) | 110 (20.4%) |
| $100,000 and over | 1,974 (95.7%) | 88 (4.3%) |
Public vs Private Health Insurance Coverage by Age in Coronita
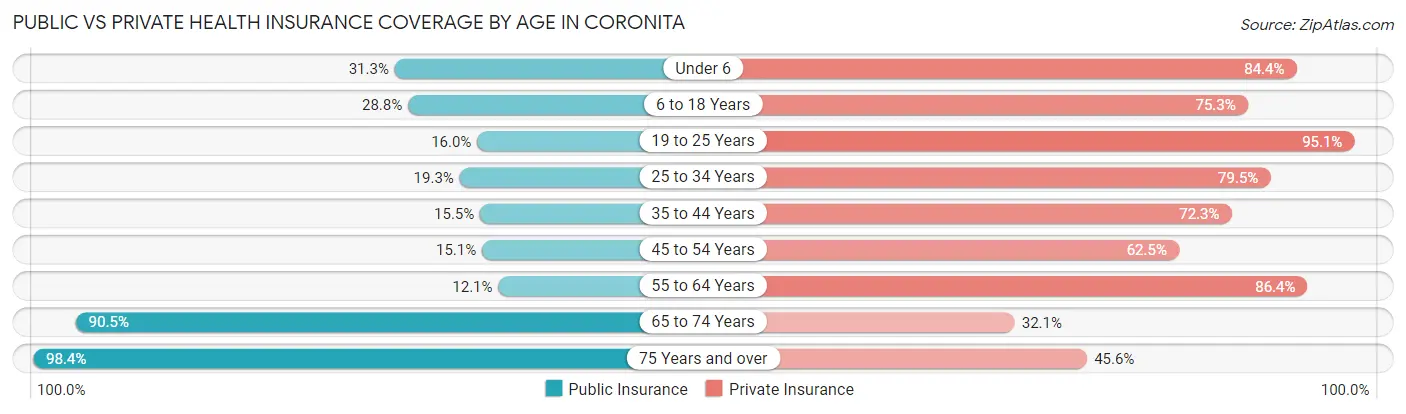
| Age Bracket | Public Insurance | Private Insurance |
| Under 6 | 36 (31.3%) | 97 (84.4%) |
| 6 to 18 Years | 188 (28.8%) | 491 (75.3%) |
| 19 to 25 Years | 75 (16.0%) | 446 (95.1%) |
| 25 to 34 Years | 77 (19.3%) | 318 (79.5%) |
| 35 to 44 Years | 53 (15.4%) | 248 (72.3%) |
| 45 to 54 Years | 62 (15.1%) | 257 (62.5%) |
| 55 to 64 Years | 55 (12.1%) | 394 (86.4%) |
| 65 to 74 Years | 172 (90.5%) | 61 (32.1%) |
| 75 Years and over | 188 (98.4%) | 87 (45.6%) |
| Total | 906 (28.1%) | 2,399 (74.3%) |
Disability Status by Sex by Age in Coronita
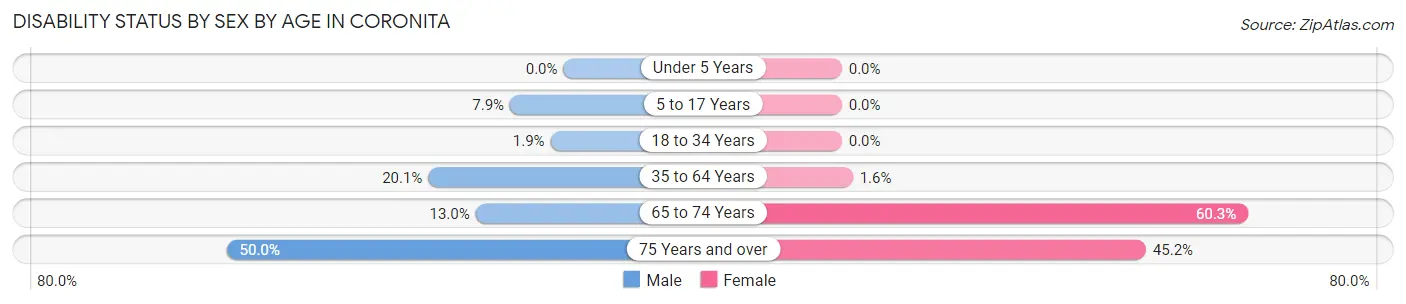
| Age Bracket | Male | Female |
| Under 5 Years | 0 (0.0%) | 0 (0.0%) |
| 5 to 17 Years | 26 (7.9%) | 0 (0.0%) |
| 18 to 34 Years | 12 (1.9%) | 0 (0.0%) |
| 35 to 64 Years | 119 (20.1%) | 10 (1.6%) |
| 65 to 74 Years | 9 (13.0%) | 73 (60.3%) |
| 75 Years and over | 49 (50.0%) | 42 (45.2%) |
Disability Class by Sex by Age in Coronita
Disability Class: Hearing Difficulty
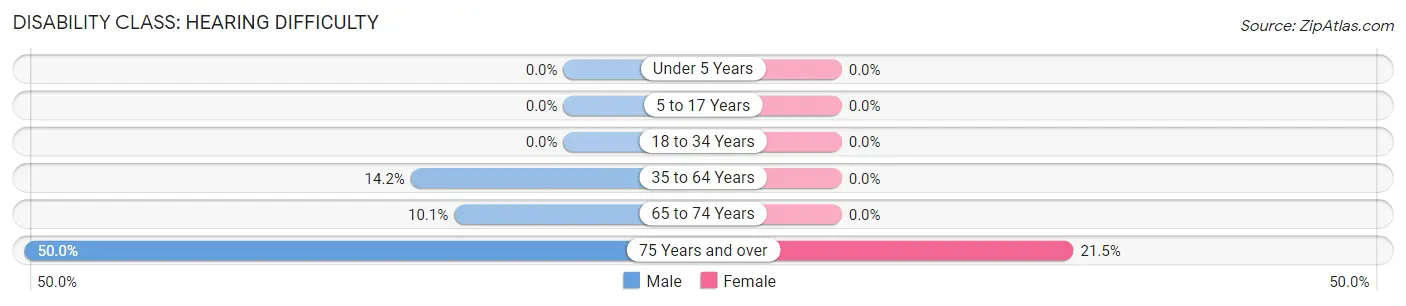
| Age Bracket | Male | Female |
| Under 5 Years | 0 (0.0%) | 0 (0.0%) |
| 5 to 17 Years | 0 (0.0%) | 0 (0.0%) |
| 18 to 34 Years | 0 (0.0%) | 0 (0.0%) |
| 35 to 64 Years | 84 (14.2%) | 0 (0.0%) |
| 65 to 74 Years | 7 (10.1%) | 0 (0.0%) |
| 75 Years and over | 49 (50.0%) | 20 (21.5%) |
Disability Class: Vision Difficulty
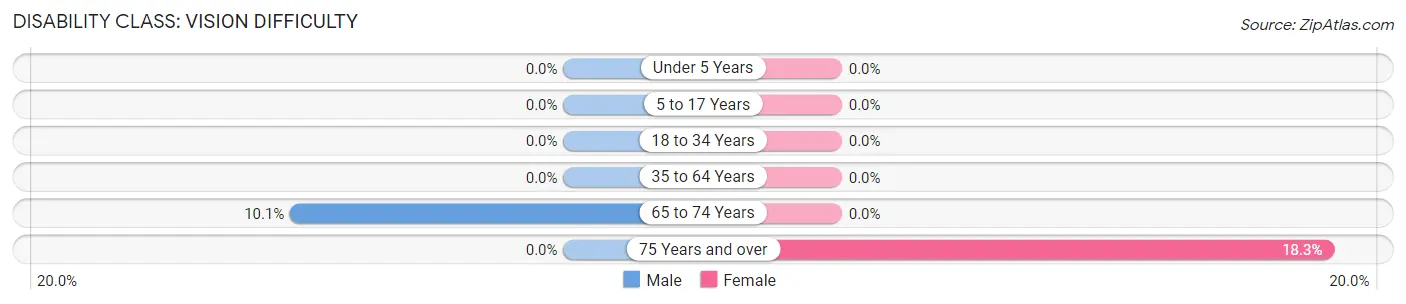
| Age Bracket | Male | Female |
| Under 5 Years | 0 (0.0%) | 0 (0.0%) |
| 5 to 17 Years | 0 (0.0%) | 0 (0.0%) |
| 18 to 34 Years | 0 (0.0%) | 0 (0.0%) |
| 35 to 64 Years | 0 (0.0%) | 0 (0.0%) |
| 65 to 74 Years | 7 (10.1%) | 0 (0.0%) |
| 75 Years and over | 0 (0.0%) | 17 (18.3%) |
Disability Class: Cognitive Difficulty
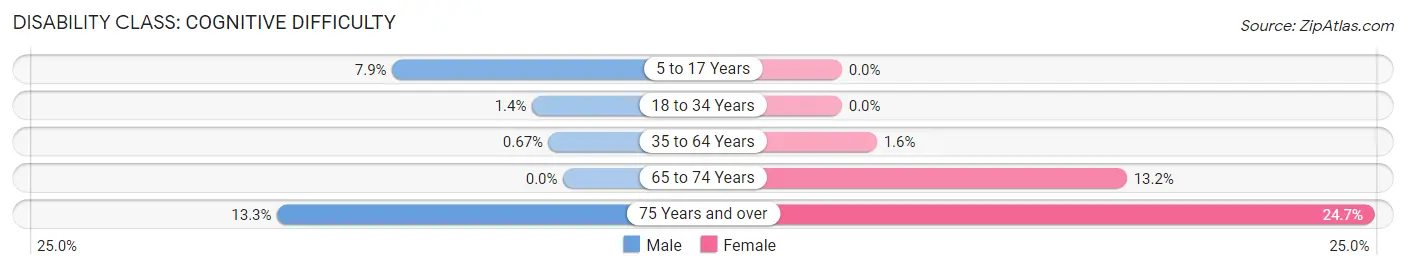
| Age Bracket | Male | Female |
| 5 to 17 Years | 26 (7.9%) | 0 (0.0%) |
| 18 to 34 Years | 9 (1.4%) | 0 (0.0%) |
| 35 to 64 Years | 4 (0.7%) | 10 (1.6%) |
| 65 to 74 Years | 0 (0.0%) | 16 (13.2%) |
| 75 Years and over | 13 (13.3%) | 23 (24.7%) |
Disability Class: Ambulatory Difficulty
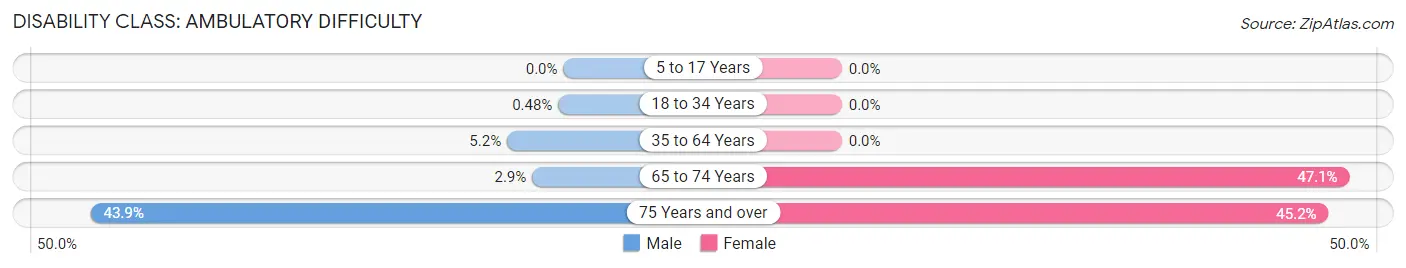
| Age Bracket | Male | Female |
| 5 to 17 Years | 0 (0.0%) | 0 (0.0%) |
| 18 to 34 Years | 3 (0.5%) | 0 (0.0%) |
| 35 to 64 Years | 31 (5.2%) | 0 (0.0%) |
| 65 to 74 Years | 2 (2.9%) | 57 (47.1%) |
| 75 Years and over | 43 (43.9%) | 42 (45.2%) |
Disability Class: Self-Care Difficulty
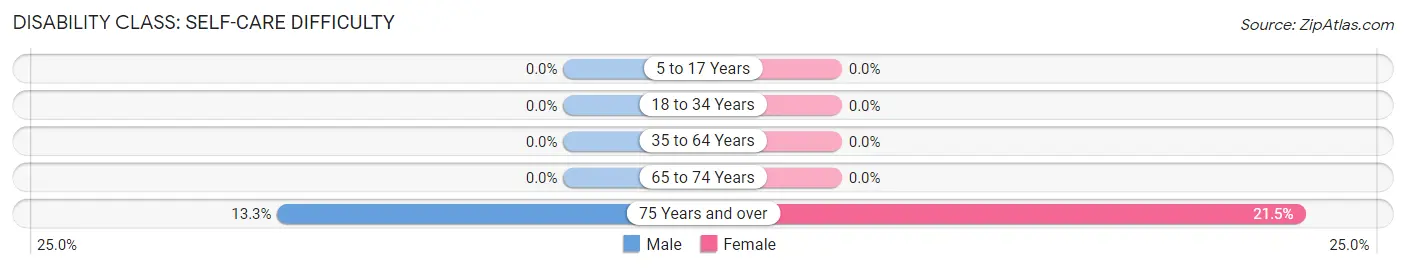
| Age Bracket | Male | Female |
| 5 to 17 Years | 0 (0.0%) | 0 (0.0%) |
| 18 to 34 Years | 0 (0.0%) | 0 (0.0%) |
| 35 to 64 Years | 0 (0.0%) | 0 (0.0%) |
| 65 to 74 Years | 0 (0.0%) | 0 (0.0%) |
| 75 Years and over | 13 (13.3%) | 20 (21.5%) |
Technology Access in Coronita
Computing Device Access in Coronita
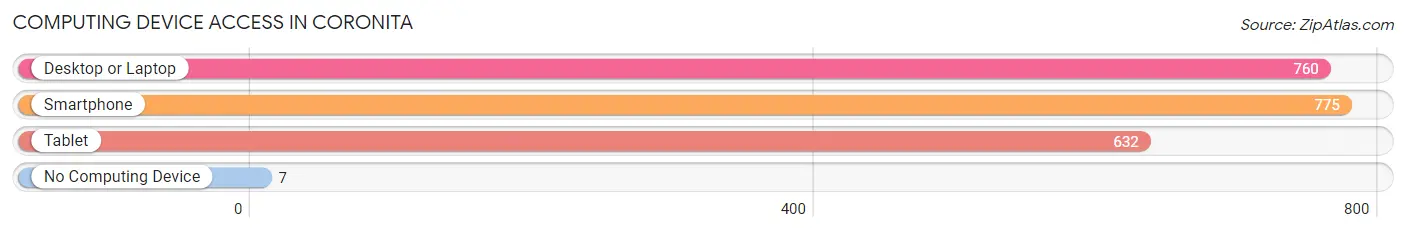
| Device Type | # Households | % Households |
| Desktop or Laptop | 760 | 87.9% |
| Smartphone | 775 | 89.6% |
| Tablet | 632 | 73.1% |
| No Computing Device | 7 | 0.8% |
| Total | 865 | 100.0% |
Internet Access in Coronita
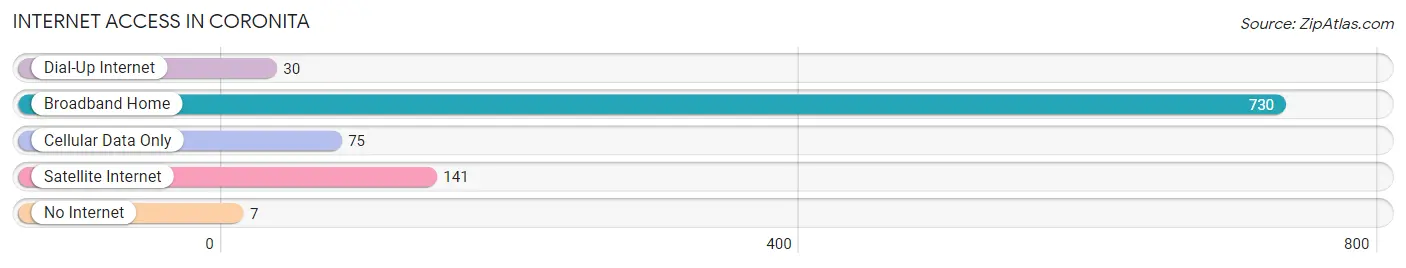
| Internet Type | # Households | % Households |
| Dial-Up Internet | 30 | 3.5% |
| Broadband Home | 730 | 84.4% |
| Cellular Data Only | 75 | 8.7% |
| Satellite Internet | 141 | 16.3% |
| No Internet | 7 | 0.8% |
| Total | 865 | 100.0% |
Coronita Summary
Coronita, California is a small unincorporated community located in Riverside County, California. It is situated in the foothills of the San Jacinto Mountains, approximately 10 miles east of the city of Temecula. The population of Coronita was estimated to be around 1,000 in 2020.
History
Coronita was originally inhabited by the Cahuilla Indians, who were the original inhabitants of the area. The first European settlers arrived in the area in the late 1800s, and the town was officially established in 1891. The town was named after the nearby Coronita Ranch, which was owned by the prominent Coronita family.
The town grew slowly over the years, and by the mid-1900s, it had become a popular destination for tourists and vacationers. The town was known for its beautiful scenery and its proximity to the nearby Temecula Valley wine country.
Geography
Coronita is located in the foothills of the San Jacinto Mountains, approximately 10 miles east of the city of Temecula. The town is situated at an elevation of 1,400 feet above sea level. The climate in Coronita is generally mild, with temperatures ranging from the mid-50s in the winter to the mid-90s in the summer.
The town is surrounded by rolling hills and is home to a variety of wildlife, including deer, coyotes, and bobcats. The nearby Santa Margarita River provides a source of water for the town and its surrounding areas.
Economy
The economy of Coronita is largely based on tourism and agriculture. The town is home to several wineries and vineyards, as well as a variety of restaurants and shops. The nearby Temecula Valley wine country is a popular destination for tourists and vacationers.
Agriculture is also an important part of the local economy. The town is home to several farms and ranches, which produce a variety of crops, including grapes, olives, and citrus fruits.
Demographics
The population of Coronita was estimated to be around 1,000 in 2020. The town is predominantly white, with a small Hispanic population. The median household income in Coronita is around $50,000, and the median home value is around $400,000.
The town is served by the Temecula Valley Unified School District, which includes several elementary, middle, and high schools. The town is also home to a branch of the Riverside County Library System.
Conclusion
Coronita, California is a small unincorporated community located in Riverside County, California. It is situated in the foothills of the San Jacinto Mountains, approximately 10 miles east of the city of Temecula. The population of Coronita was estimated to be around 1,000 in 2020. The town is known for its beautiful scenery and its proximity to the nearby Temecula Valley wine country. The economy of Coronita is largely based on tourism and agriculture, and the town is served by the Temecula Valley Unified School District.
Common Questions
What is Per Capita Income in Coronita?
Per Capita income in Coronita is $34,015.
What is the Median Family Income in Coronita?
Median Family Income in Coronita is $110,833.
What is the Median Household income in Coronita?
Median Household Income in Coronita is $110,625.
What is Income or Wage Gap in Coronita?
Income or Wage Gap in Coronita is 22.8%.
Women in Coronita earn 77.2 cents for every dollar earned by a man.
What is Inequality or Gini Index in Coronita?
Inequality or Gini Index in Coronita is 0.36.
What is the Total Population of Coronita?
Total Population of Coronita is 3,235.
What is the Total Male Population of Coronita?
Total Male Population of Coronita is 1,753.
What is the Total Female Population of Coronita?
Total Female Population of Coronita is 1,482.
What is the Ratio of Males per 100 Females in Coronita?
There are 118.29 Males per 100 Females in Coronita.
What is the Ratio of Females per 100 Males in Coronita?
There are 84.54 Females per 100 Males in Coronita.
What is the Median Population Age in Coronita?
Median Population Age in Coronita is 34.2 Years.
What is the Average Family Size in Coronita
Average Family Size in Coronita is 4.0 People.
What is the Average Household Size in Coronita
Average Household Size in Coronita is 3.7 People.
How Large is the Labor Force in Coronita?
There are 1,660 People in the Labor Forcein in Coronita.
What is the Percentage of People in the Labor Force in Coronita?
60.2% of People are in the Labor Force in Coronita.
What is the Unemployment Rate in Coronita?
Unemployment Rate in Coronita is 1.6%.