Cities with the Lowest Poverty Level Among Seniors Over the Age of 75 in Georgia
RELATED REPORTS & OPTIONS
Lowest Poverty | Seniors 75+
Georgia
Compare Cities
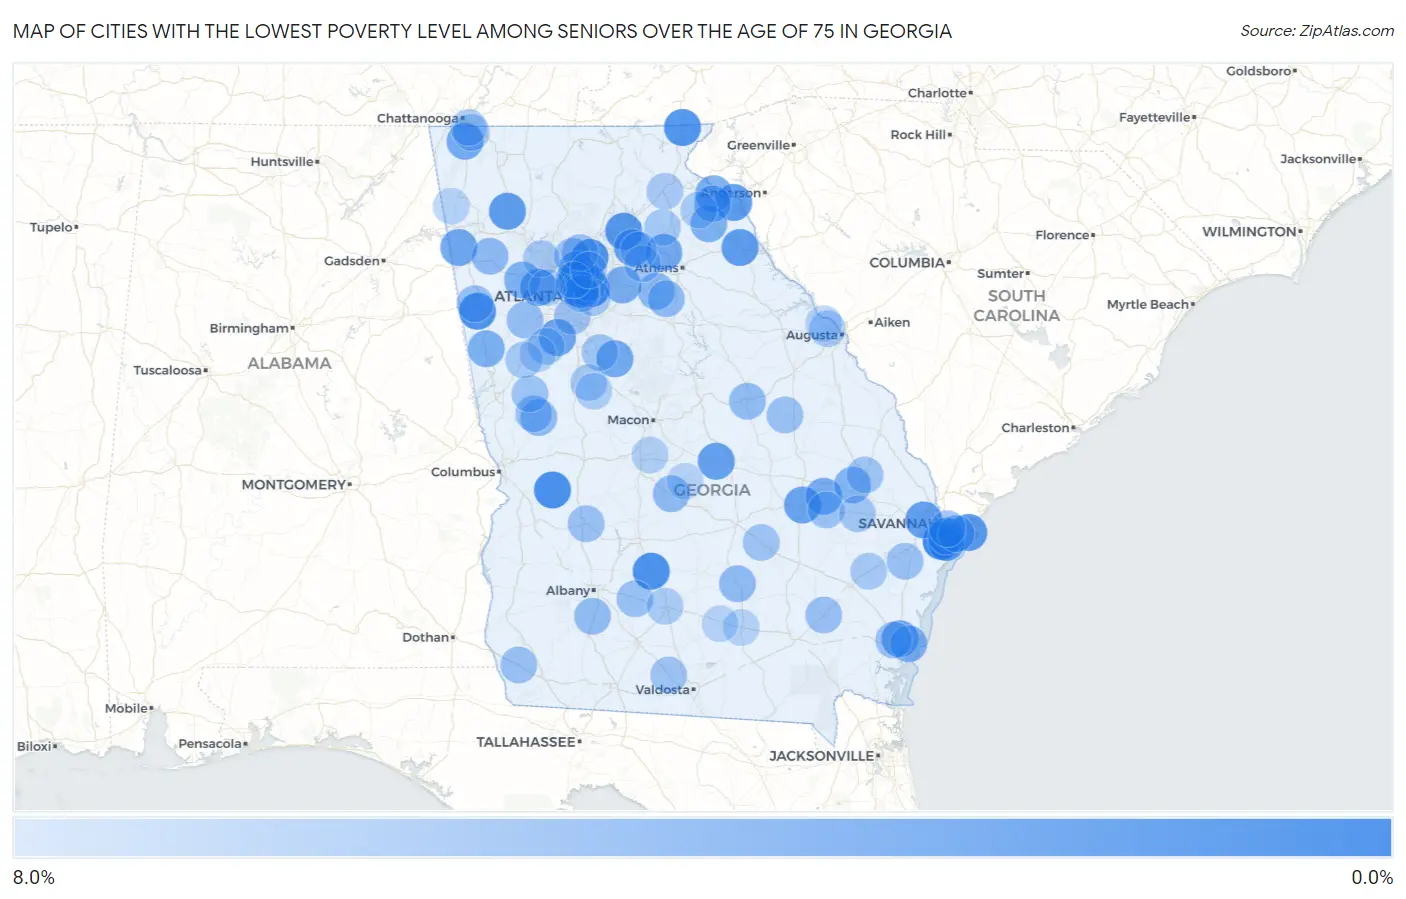
Map of Cities with the Lowest Poverty Level Among Seniors Over the Age of 75 in Georgia
8.0%
0.0%
Cities with the Lowest Poverty Level Among Seniors Over the Age of 75 in Georgia
| City | Senior Poverty | vs State | vs National | |
| 1. | Montgomery | 0.34% | 11.0%(-10.6)#1 | 11.1%(-10.7)#30 |
| 2. | Buena Vista | 1.2% | 11.0%(-9.74)#2 | 11.1%(-9.83)#192 |
| 3. | Ashburn | 1.4% | 11.0%(-9.53)#3 | 11.1%(-9.62)#272 |
| 4. | Stone Mountain | 1.5% | 11.0%(-9.51)#4 | 11.1%(-9.60)#281 |
| 5. | Mount Zion | 1.5% | 11.0%(-9.44)#5 | 11.1%(-9.53)#310 |
| 6. | Johns Creek | 1.5% | 11.0%(-9.44)#6 | 11.1%(-9.52)#313 |
| 7. | Dillard | 1.6% | 11.0%(-9.37)#7 | 11.1%(-9.45)#349 |
| 8. | Oakwood | 2.0% | 11.0%(-9.03)#8 | 11.1%(-9.12)#489 |
| 9. | Tybee Island | 2.0% | 11.0%(-8.96)#9 | 11.1%(-9.05)#530 |
| 10. | Skidaway Island | 2.1% | 11.0%(-8.85)#10 | 11.1%(-8.94)#607 |
| 11. | Adairsville | 2.3% | 11.0%(-8.71)#11 | 11.1%(-8.79)#697 |
| 12. | Reed Creek | 2.3% | 11.0%(-8.68)#12 | 11.1%(-8.77)#718 |
| 13. | Elberton | 2.3% | 11.0%(-8.64)#13 | 11.1%(-8.73)#743 |
| 14. | Doraville | 2.5% | 11.0%(-8.52)#14 | 11.1%(-8.61)#819 |
| 15. | Pooler | 2.5% | 11.0%(-8.52)#15 | 11.1%(-8.61)#820 |
| 16. | Braselton | 2.6% | 11.0%(-8.39)#16 | 11.1%(-8.48)#917 |
| 17. | Austell | 2.6% | 11.0%(-8.33)#17 | 11.1%(-8.42)#963 |
| 18. | Dudley | 2.7% | 11.0%(-8.24)#18 | 11.1%(-8.33)#1,041 |
| 19. | North Druid Hills | 2.8% | 11.0%(-8.18)#19 | 11.1%(-8.27)#1,081 |
| 20. | Lyons | 2.9% | 11.0%(-8.09)#20 | 11.1%(-8.18)#1,154 |
| 21. | Isle Of Hope | 2.9% | 11.0%(-8.04)#21 | 11.1%(-8.13)#1,186 |
| 22. | Chamblee | 3.0% | 11.0%(-7.96)#22 | 11.1%(-8.05)#1,253 |
| 23. | Fayetteville | 3.1% | 11.0%(-7.84)#23 | 11.1%(-7.93)#1,360 |
| 24. | Cave Spring | 3.2% | 11.0%(-7.82)#24 | 11.1%(-7.91)#1,375 |
| 25. | Country Club Estates | 3.2% | 11.0%(-7.76)#25 | 11.1%(-7.85)#1,413 |
| 26. | Arcade | 3.2% | 11.0%(-7.75)#26 | 11.1%(-7.84)#1,424 |
| 27. | Dunwoody | 3.4% | 11.0%(-7.63)#27 | 11.1%(-7.71)#1,549 |
| 28. | Jackson | 3.4% | 11.0%(-7.60)#28 | 11.1%(-7.69)#1,578 |
| 29. | Chickamauga | 3.5% | 11.0%(-7.51)#29 | 11.1%(-7.60)#1,656 |
| 30. | Cobbtown | 3.6% | 11.0%(-7.41)#30 | 11.1%(-7.50)#1,749 |
| 31. | Gumlog | 3.7% | 11.0%(-7.32)#31 | 11.1%(-7.41)#1,823 |
| 32. | Loganville | 3.7% | 11.0%(-7.27)#32 | 11.1%(-7.36)#1,884 |
| 33. | Franklin Springs | 3.9% | 11.0%(-7.08)#33 | 11.1%(-7.17)#2,068 |
| 34. | Centralhatchee | 3.9% | 11.0%(-7.06)#34 | 11.1%(-7.15)#2,101 |
| 35. | Wilmington Island | 4.0% | 11.0%(-6.97)#35 | 11.1%(-7.06)#2,194 |
| 36. | North Decatur | 4.0% | 11.0%(-6.97)#36 | 11.1%(-7.06)#2,195 |
| 37. | St Simons | 4.0% | 11.0%(-6.94)#37 | 11.1%(-7.03)#2,215 |
| 38. | Hiram | 4.1% | 11.0%(-6.92)#38 | 11.1%(-7.01)#2,240 |
| 39. | Register | 4.3% | 11.0%(-6.63)#39 | 11.1%(-6.72)#2,544 |
| 40. | Lavonia | 4.4% | 11.0%(-6.60)#40 | 11.1%(-6.69)#2,569 |
| 41. | Good Hope | 4.5% | 11.0%(-6.43)#41 | 11.1%(-6.52)#2,750 |
| 42. | Aragon | 4.8% | 11.0%(-6.22)#42 | 11.1%(-6.31)#2,933 |
| 43. | Hawkinsville | 4.8% | 11.0%(-6.20)#43 | 11.1%(-6.29)#2,986 |
| 44. | Manchester | 4.8% | 11.0%(-6.16)#44 | 11.1%(-6.25)#3,011 |
| 45. | Bostwick | 4.8% | 11.0%(-6.14)#45 | 11.1%(-6.23)#3,043 |
| 46. | Broxton | 4.9% | 11.0%(-6.06)#46 | 11.1%(-6.15)#3,112 |
| 47. | Sandersville | 5.0% | 11.0%(-5.98)#47 | 11.1%(-6.07)#3,185 |
| 48. | Baconton | 5.0% | 11.0%(-5.98)#48 | 11.1%(-6.07)#3,196 |
| 49. | Tucker | 5.1% | 11.0%(-5.88)#49 | 11.1%(-5.97)#3,306 |
| 50. | Echols County Consolidated Government | 5.2% | 11.0%(-5.82)#50 | 11.1%(-5.91)#3,361 |
| 51. | Chattahoochee Hills | 5.2% | 11.0%(-5.82)#51 | 11.1%(-5.91)#3,363 |
| 52. | Waco | 5.3% | 11.0%(-5.72)#52 | 11.1%(-5.80)#3,467 |
| 53. | Patterson | 5.3% | 11.0%(-5.72)#53 | 11.1%(-5.80)#3,470 |
| 54. | Roswell | 5.4% | 11.0%(-5.63)#54 | 11.1%(-5.71)#3,564 |
| 55. | Iron City | 5.4% | 11.0%(-5.62)#55 | 11.1%(-5.71)#3,576 |
| 56. | Midway | 5.4% | 11.0%(-5.57)#56 | 11.1%(-5.66)#3,596 |
| 57. | Poulan | 5.4% | 11.0%(-5.57)#57 | 11.1%(-5.66)#3,603 |
| 58. | Warm Springs | 5.4% | 11.0%(-5.57)#58 | 11.1%(-5.66)#3,610 |
| 59. | Bartow | 5.4% | 11.0%(-5.57)#59 | 11.1%(-5.66)#3,617 |
| 60. | Americus | 5.4% | 11.0%(-5.56)#60 | 11.1%(-5.65)#3,623 |
| 61. | Thunderbolt | 5.4% | 11.0%(-5.56)#61 | 11.1%(-5.65)#3,624 |
| 62. | Dock Junction | 5.5% | 11.0%(-5.53)#62 | 11.1%(-5.61)#3,650 |
| 63. | Alpharetta | 5.6% | 11.0%(-5.42)#63 | 11.1%(-5.51)#3,740 |
| 64. | Lake City | 5.6% | 11.0%(-5.42)#64 | 11.1%(-5.51)#3,745 |
| 65. | Greenville | 5.6% | 11.0%(-5.42)#65 | 11.1%(-5.51)#3,755 |
| 66. | Collins | 5.6% | 11.0%(-5.42)#66 | 11.1%(-5.51)#3,765 |
| 67. | Statesboro | 5.6% | 11.0%(-5.36)#67 | 11.1%(-5.45)#3,839 |
| 68. | Lumber City | 5.6% | 11.0%(-5.36)#68 | 11.1%(-5.45)#3,843 |
| 69. | Morven | 5.7% | 11.0%(-5.32)#69 | 11.1%(-5.41)#3,890 |
| 70. | Locust Grove | 5.7% | 11.0%(-5.24)#70 | 11.1%(-5.33)#3,962 |
| 71. | Winder | 5.8% | 11.0%(-5.20)#71 | 11.1%(-5.29)#4,008 |
| 72. | Fort Oglethorpe | 5.9% | 11.0%(-5.10)#72 | 11.1%(-5.19)#4,093 |
| 73. | Peachtree City | 5.9% | 11.0%(-5.10)#73 | 11.1%(-5.19)#4,094 |
| 74. | Daisy | 5.9% | 11.0%(-5.10)#74 | 11.1%(-5.18)#4,133 |
| 75. | Redan | 5.9% | 11.0%(-5.05)#75 | 11.1%(-5.14)#4,178 |
| 76. | Kennesaw | 6.0% | 11.0%(-5.01)#76 | 11.1%(-5.09)#4,224 |
| 77. | Ludowici | 6.0% | 11.0%(-4.95)#77 | 11.1%(-5.04)#4,279 |
| 78. | Milner | 6.1% | 11.0%(-4.92)#78 | 11.1%(-5.01)#4,322 |
| 79. | Moreland | 6.1% | 11.0%(-4.92)#79 | 11.1%(-5.01)#4,323 |
| 80. | Maysville | 6.1% | 11.0%(-4.90)#80 | 11.1%(-4.99)#4,347 |
| 81. | Martinez | 6.1% | 11.0%(-4.90)#81 | 11.1%(-4.98)#4,349 |
| 82. | Scottdale | 6.1% | 11.0%(-4.89)#82 | 11.1%(-4.98)#4,351 |
| 83. | Cornelia | 6.1% | 11.0%(-4.86)#83 | 11.1%(-4.94)#4,385 |
| 84. | Lakeview | 6.1% | 11.0%(-4.84)#84 | 11.1%(-4.93)#4,405 |
| 85. | Avondale Estates | 6.1% | 11.0%(-4.84)#85 | 11.1%(-4.93)#4,413 |
| 86. | Tifton | 6.2% | 11.0%(-4.75)#86 | 11.1%(-4.84)#4,486 |
| 87. | Carnesville | 6.2% | 11.0%(-4.73)#87 | 11.1%(-4.82)#4,528 |
| 88. | Brookhaven | 6.3% | 11.0%(-4.66)#88 | 11.1%(-4.75)#4,607 |
| 89. | Barnesville | 6.4% | 11.0%(-4.61)#89 | 11.1%(-4.70)#4,671 |
| 90. | Norcross | 6.4% | 11.0%(-4.55)#90 | 11.1%(-4.64)#4,729 |
| 91. | Fairfield Plantation | 6.5% | 11.0%(-4.53)#91 | 11.1%(-4.62)#4,743 |
| 92. | Hoschton | 6.5% | 11.0%(-4.50)#92 | 11.1%(-4.59)#4,802 |
| 93. | Warner Robins | 6.5% | 11.0%(-4.45)#93 | 11.1%(-4.54)#4,849 |
| 94. | Mableton | 6.6% | 11.0%(-4.38)#94 | 11.1%(-4.47)#4,904 |
| 95. | Evans | 6.6% | 11.0%(-4.37)#95 | 11.1%(-4.45)#4,918 |
| 96. | Lyerly | 6.7% | 11.0%(-4.31)#96 | 11.1%(-4.40)#4,981 |
| 97. | Sharpsburg | 6.7% | 11.0%(-4.31)#97 | 11.1%(-4.40)#4,995 |
| 98. | Pearson | 6.7% | 11.0%(-4.24)#98 | 11.1%(-4.33)#5,071 |
| 99. | Willacoochee | 6.8% | 11.0%(-4.20)#99 | 11.1%(-4.29)#5,101 |
| 100. | Cochran | 6.8% | 11.0%(-4.16)#100 | 11.1%(-4.25)#5,128 |
Common Questions
What are the Top 10 Cities with the Lowest Poverty Level Among Seniors Over the Age of 75 in Georgia?
Top 10 Cities with the Lowest Poverty Level Among Seniors Over the Age of 75 in Georgia are:
#1
0.34%
#2
1.2%
#3
1.4%
#4
1.5%
#5
1.5%
#6
1.5%
#7
1.6%
#8
2.0%
#9
2.0%
#10
2.1%
What city has the Lowest Poverty Level Among Seniors Over the Age of 75 in Georgia?
Montgomery has the Lowest Poverty Level Among Seniors Over the Age of 75 in Georgia with 0.34%.
What is the Poverty Level Among Seniors Over the Age of 75 in the State of Georgia?
Poverty Level Among Seniors Over the Age of 75 in Georgia is 11.0%.
What is the Poverty Level Among Seniors Over the Age of 75 in the United States?
Poverty Level Among Seniors Over the Age of 75 in the United States is 11.1%.