Cities with the Lowest Poverty Level Among Seniors Over the Age of 75 in Indiana
RELATED REPORTS & OPTIONS
Lowest Poverty | Seniors 75+
Indiana
Compare Cities
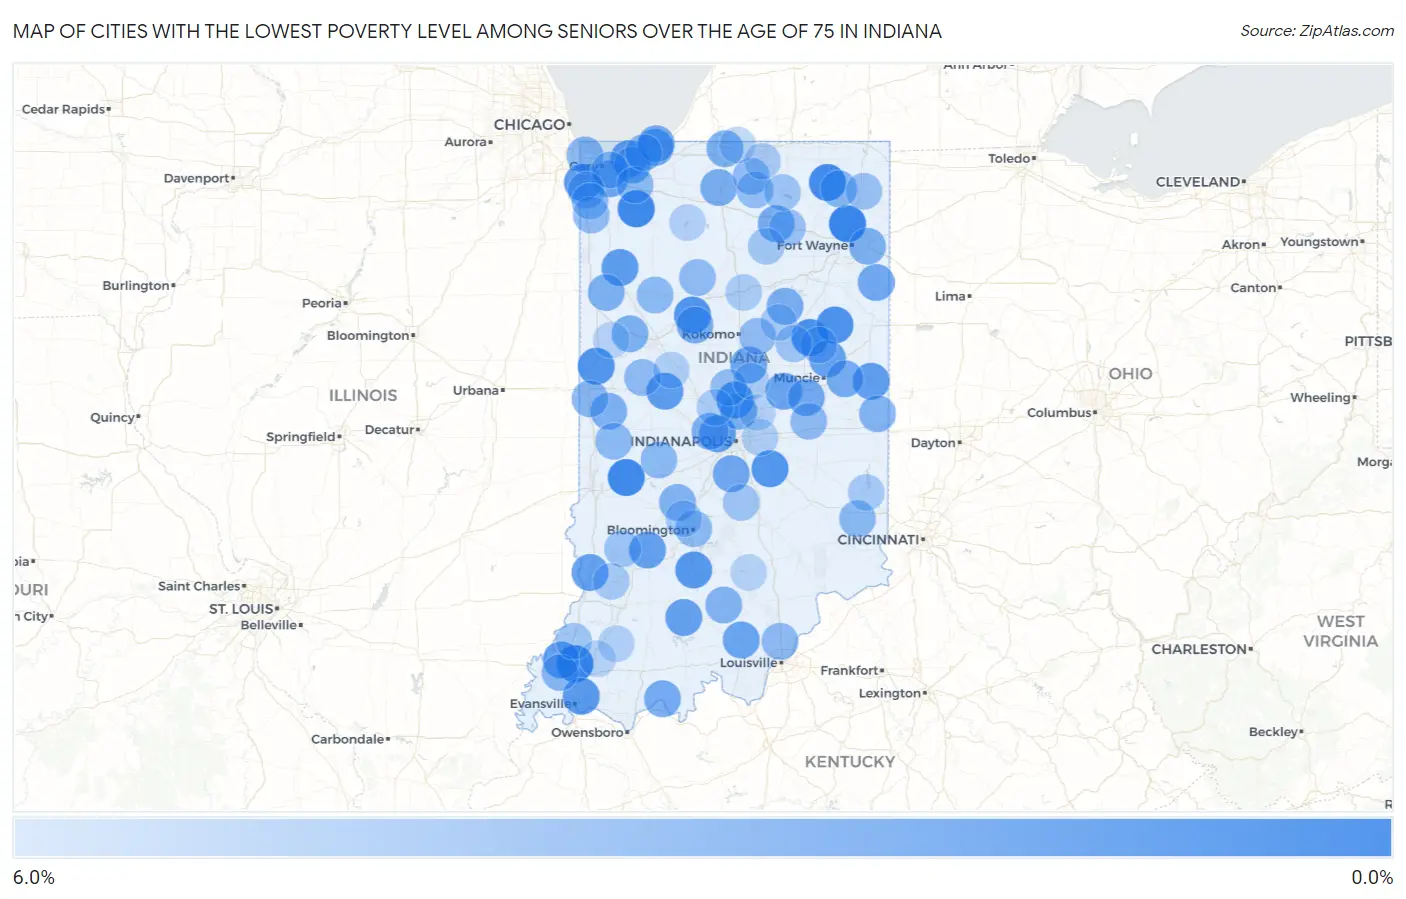
Map of Cities with the Lowest Poverty Level Among Seniors Over the Age of 75 in Indiana
6.0%
0.0%
Cities with the Lowest Poverty Level Among Seniors Over the Age of 75 in Indiana
| City | Senior Poverty | vs State | vs National | |
| 1. | Huntertown | 0.54% | 9.0%(-8.46)#1 | 11.1%(-10.5)#59 |
| 2. | Fort Branch | 0.63% | 9.0%(-8.38)#2 | 11.1%(-10.4)#71 |
| 3. | Kouts | 0.76% | 9.0%(-8.24)#3 | 11.1%(-10.3)#97 |
| 4. | Brazil | 0.88% | 9.0%(-8.13)#4 | 11.1%(-10.2)#119 |
| 5. | Rome City | 0.96% | 9.0%(-8.04)#5 | 11.1%(-10.1)#136 |
| 6. | Upland | 1.3% | 9.0%(-7.70)#6 | 11.1%(-9.76)#220 |
| 7. | Montpelier | 1.4% | 9.0%(-7.64)#7 | 11.1%(-9.71)#240 |
| 8. | Westfield | 1.5% | 9.0%(-7.48)#8 | 11.1%(-9.54)#302 |
| 9. | West Lebanon | 1.6% | 9.0%(-7.43)#9 | 11.1%(-9.49)#326 |
| 10. | Camden | 1.6% | 9.0%(-7.39)#10 | 11.1%(-9.45)#346 |
| 11. | Fairland | 1.7% | 9.0%(-7.35)#11 | 11.1%(-9.41)#359 |
| 12. | Dyer | 1.8% | 9.0%(-7.18)#12 | 11.1%(-9.24)#434 |
| 13. | Oolitic | 1.8% | 9.0%(-7.17)#13 | 11.1%(-9.23)#438 |
| 14. | Melody Hill | 1.9% | 9.0%(-7.14)#14 | 11.1%(-9.20)#457 |
| 15. | Darlington | 1.9% | 9.0%(-7.08)#15 | 11.1%(-9.14)#482 |
| 16. | Dune Acres | 2.0% | 9.0%(-7.04)#16 | 11.1%(-9.11)#502 |
| 17. | Rensselaer | 2.0% | 9.0%(-7.00)#17 | 11.1%(-9.06)#524 |
| 18. | Winchester | 2.1% | 9.0%(-6.90)#18 | 11.1%(-8.97)#591 |
| 19. | Clermont | 2.1% | 9.0%(-6.90)#19 | 11.1%(-8.96)#594 |
| 20. | Bloomfield | 2.3% | 9.0%(-6.71)#20 | 11.1%(-8.77)#720 |
| 21. | Oaktown | 2.4% | 9.0%(-6.62)#21 | 11.1%(-8.69)#764 |
| 22. | West Baden Springs | 2.4% | 9.0%(-6.62)#22 | 11.1%(-8.69)#766 |
| 23. | Eaton | 2.4% | 9.0%(-6.60)#23 | 11.1%(-8.67)#777 |
| 24. | Owensville | 2.4% | 9.0%(-6.58)#24 | 11.1%(-8.65)#796 |
| 25. | Edgewood | 2.5% | 9.0%(-6.48)#25 | 11.1%(-8.55)#870 |
| 26. | Palmyra | 2.5% | 9.0%(-6.48)#26 | 11.1%(-8.55)#873 |
| 27. | Hobart | 2.6% | 9.0%(-6.44)#27 | 11.1%(-8.51)#893 |
| 28. | Pottawattamie Park | 2.6% | 9.0%(-6.44)#28 | 11.1%(-8.50)#905 |
| 29. | Tipton | 2.7% | 9.0%(-6.28)#29 | 11.1%(-8.35)#1,021 |
| 30. | Decatur | 2.8% | 9.0%(-6.21)#30 | 11.1%(-8.27)#1,078 |
| 31. | Middletown | 2.8% | 9.0%(-6.19)#31 | 11.1%(-8.26)#1,091 |
| 32. | Bargersville | 2.8% | 9.0%(-6.19)#32 | 11.1%(-8.25)#1,092 |
| 33. | Chesterton | 2.9% | 9.0%(-6.15)#33 | 11.1%(-8.21)#1,122 |
| 34. | Troy | 2.9% | 9.0%(-6.06)#34 | 11.1%(-8.13)#1,193 |
| 35. | Long Beach | 3.0% | 9.0%(-6.04)#35 | 11.1%(-8.10)#1,214 |
| 36. | Winona Lake | 3.0% | 9.0%(-6.00)#36 | 11.1%(-8.06)#1,244 |
| 37. | Parker City | 3.1% | 9.0%(-5.93)#37 | 11.1%(-7.99)#1,301 |
| 38. | Flora | 3.1% | 9.0%(-5.91)#38 | 11.1%(-7.97)#1,317 |
| 39. | La Fontaine | 3.1% | 9.0%(-5.88)#39 | 11.1%(-7.94)#1,344 |
| 40. | La Paz | 3.1% | 9.0%(-5.88)#40 | 11.1%(-7.94)#1,348 |
| 41. | Carmel | 3.2% | 9.0%(-5.78)#41 | 11.1%(-7.85)#1,416 |
| 42. | Roseland | 3.2% | 9.0%(-5.78)#42 | 11.1%(-7.84)#1,430 |
| 43. | Otterbein | 3.3% | 9.0%(-5.67)#43 | 11.1%(-7.73)#1,519 |
| 44. | Goodland | 3.3% | 9.0%(-5.67)#44 | 11.1%(-7.73)#1,522 |
| 45. | New Haven | 3.3% | 9.0%(-5.67)#45 | 11.1%(-7.73)#1,538 |
| 46. | Kingman | 3.4% | 9.0%(-5.63)#46 | 11.1%(-7.70)#1,566 |
| 47. | Brownsburg | 3.4% | 9.0%(-5.62)#47 | 11.1%(-7.68)#1,580 |
| 48. | Gosport | 3.4% | 9.0%(-5.56)#48 | 11.1%(-7.62)#1,634 |
| 49. | Campbellsburg | 3.4% | 9.0%(-5.56)#49 | 11.1%(-7.62)#1,638 |
| 50. | Fountain City | 3.5% | 9.0%(-5.50)#50 | 11.1%(-7.56)#1,681 |
| 51. | Whiting | 3.6% | 9.0%(-5.43)#51 | 11.1%(-7.50)#1,732 |
| 52. | Kendallville | 3.6% | 9.0%(-5.39)#52 | 11.1%(-7.45)#1,794 |
| 53. | Cynthiana | 3.7% | 9.0%(-5.30)#53 | 11.1%(-7.36)#1,873 |
| 54. | Perrysville | 3.7% | 9.0%(-5.30)#54 | 11.1%(-7.36)#1,875 |
| 55. | Sunman | 3.8% | 9.0%(-5.21)#55 | 11.1%(-7.27)#1,972 |
| 56. | Lake Station | 3.8% | 9.0%(-5.17)#56 | 11.1%(-7.23)#2,001 |
| 57. | Reynolds | 3.8% | 9.0%(-5.16)#57 | 11.1%(-7.22)#2,014 |
| 58. | St John | 3.9% | 9.0%(-5.15)#58 | 11.1%(-7.21)#2,036 |
| 59. | Bloomington | 3.9% | 9.0%(-5.13)#59 | 11.1%(-7.19)#2,051 |
| 60. | Rockville | 3.9% | 9.0%(-5.12)#60 | 11.1%(-7.19)#2,055 |
| 61. | Valparaiso | 3.9% | 9.0%(-5.12)#61 | 11.1%(-7.18)#2,057 |
| 62. | Beverly Shores | 3.9% | 9.0%(-5.12)#62 | 11.1%(-7.18)#2,060 |
| 63. | Greencastle | 3.9% | 9.0%(-5.10)#63 | 11.1%(-7.16)#2,086 |
| 64. | Sellersburg | 4.0% | 9.0%(-5.01)#64 | 11.1%(-7.08)#2,160 |
| 65. | Kennard | 4.0% | 9.0%(-5.00)#65 | 11.1%(-7.07)#2,181 |
| 66. | New Richmond | 4.0% | 9.0%(-5.00)#66 | 11.1%(-7.07)#2,187 |
| 67. | Floyds Knobs | 4.0% | 9.0%(-4.97)#67 | 11.1%(-7.03)#2,209 |
| 68. | Wakarusa | 4.0% | 9.0%(-4.96)#68 | 11.1%(-7.03)#2,212 |
| 69. | Lowell | 4.0% | 9.0%(-4.96)#69 | 11.1%(-7.02)#2,216 |
| 70. | Royal Center | 4.1% | 9.0%(-4.95)#70 | 11.1%(-7.01)#2,230 |
| 71. | Greentown | 4.1% | 9.0%(-4.92)#71 | 11.1%(-6.99)#2,256 |
| 72. | Sheridan | 4.1% | 9.0%(-4.87)#72 | 11.1%(-6.93)#2,309 |
| 73. | Nappanee | 4.2% | 9.0%(-4.81)#73 | 11.1%(-6.88)#2,375 |
| 74. | Cedar Lake | 4.3% | 9.0%(-4.69)#74 | 11.1%(-6.75)#2,489 |
| 75. | Waterloo | 4.4% | 9.0%(-4.61)#75 | 11.1%(-6.67)#2,581 |
| 76. | Pierceton | 4.4% | 9.0%(-4.58)#76 | 11.1%(-6.64)#2,615 |
| 77. | Linton | 4.5% | 9.0%(-4.46)#77 | 11.1%(-6.52)#2,719 |
| 78. | Shamrock Lakes | 4.5% | 9.0%(-4.46)#78 | 11.1%(-6.52)#2,751 |
| 79. | Syracuse | 4.6% | 9.0%(-4.44)#79 | 11.1%(-6.50)#2,769 |
| 80. | Fairmount | 4.6% | 9.0%(-4.41)#80 | 11.1%(-6.47)#2,801 |
| 81. | Prince S Lakes | 4.6% | 9.0%(-4.39)#81 | 11.1%(-6.45)#2,816 |
| 82. | Patoka | 4.8% | 9.0%(-4.24)#82 | 11.1%(-6.31)#2,939 |
| 83. | Silver Lake | 4.8% | 9.0%(-4.18)#83 | 11.1%(-6.25)#3,015 |
| 84. | Ellettsville | 5.0% | 9.0%(-4.01)#84 | 11.1%(-6.08)#3,181 |
| 85. | Brookville | 5.0% | 9.0%(-4.00)#85 | 11.1%(-6.07)#3,188 |
| 86. | Sweetser | 5.0% | 9.0%(-4.00)#86 | 11.1%(-6.07)#3,195 |
| 87. | Edwardsport | 5.0% | 9.0%(-4.00)#87 | 11.1%(-6.07)#3,220 |
| 88. | Dunlap | 5.0% | 9.0%(-3.96)#88 | 11.1%(-6.02)#3,261 |
| 89. | Peru | 5.2% | 9.0%(-3.85)#89 | 11.1%(-5.91)#3,367 |
| 90. | Zionsville | 5.2% | 9.0%(-3.85)#90 | 11.1%(-5.91)#3,368 |
| 91. | Arcadia | 5.2% | 9.0%(-3.83)#91 | 11.1%(-5.89)#3,380 |
| 92. | Cumberland | 5.2% | 9.0%(-3.80)#92 | 11.1%(-5.86)#3,411 |
| 93. | Clarks Hill | 5.3% | 9.0%(-3.74)#93 | 11.1%(-5.80)#3,472 |
| 94. | Bass Lake | 5.4% | 9.0%(-3.60)#94 | 11.1%(-5.66)#3,598 |
| 95. | Winslow | 5.4% | 9.0%(-3.60)#95 | 11.1%(-5.66)#3,604 |
| 96. | Brownstown | 5.5% | 9.0%(-3.51)#96 | 11.1%(-5.58)#3,684 |
| 97. | Fishers | 5.5% | 9.0%(-3.50)#97 | 11.1%(-5.56)#3,700 |
| 98. | Granger | 5.5% | 9.0%(-3.46)#98 | 11.1%(-5.52)#3,735 |
| 99. | Pine Village | 5.6% | 9.0%(-3.45)#99 | 11.1%(-5.51)#3,791 |
| 100. | Somerville | 5.6% | 9.0%(-3.45)#100 | 11.1%(-5.51)#3,793 |
Common Questions
What are the Top 10 Cities with the Lowest Poverty Level Among Seniors Over the Age of 75 in Indiana?
Top 10 Cities with the Lowest Poverty Level Among Seniors Over the Age of 75 in Indiana are:
#1
0.54%
#2
0.63%
#3
0.76%
#4
0.88%
#5
0.96%
#6
1.3%
#7
1.4%
#8
1.5%
#9
1.6%
#10
1.6%
What city has the Lowest Poverty Level Among Seniors Over the Age of 75 in Indiana?
Huntertown has the Lowest Poverty Level Among Seniors Over the Age of 75 in Indiana with 0.54%.
What is the Poverty Level Among Seniors Over the Age of 75 in the State of Indiana?
Poverty Level Among Seniors Over the Age of 75 in Indiana is 9.0%.
What is the Poverty Level Among Seniors Over the Age of 75 in the United States?
Poverty Level Among Seniors Over the Age of 75 in the United States is 11.1%.