Cities with the Lowest Poverty Level Among Seniors Over the Age of 75 in Oregon
RELATED REPORTS & OPTIONS
Lowest Poverty | Seniors 75+
Oregon
Compare Cities
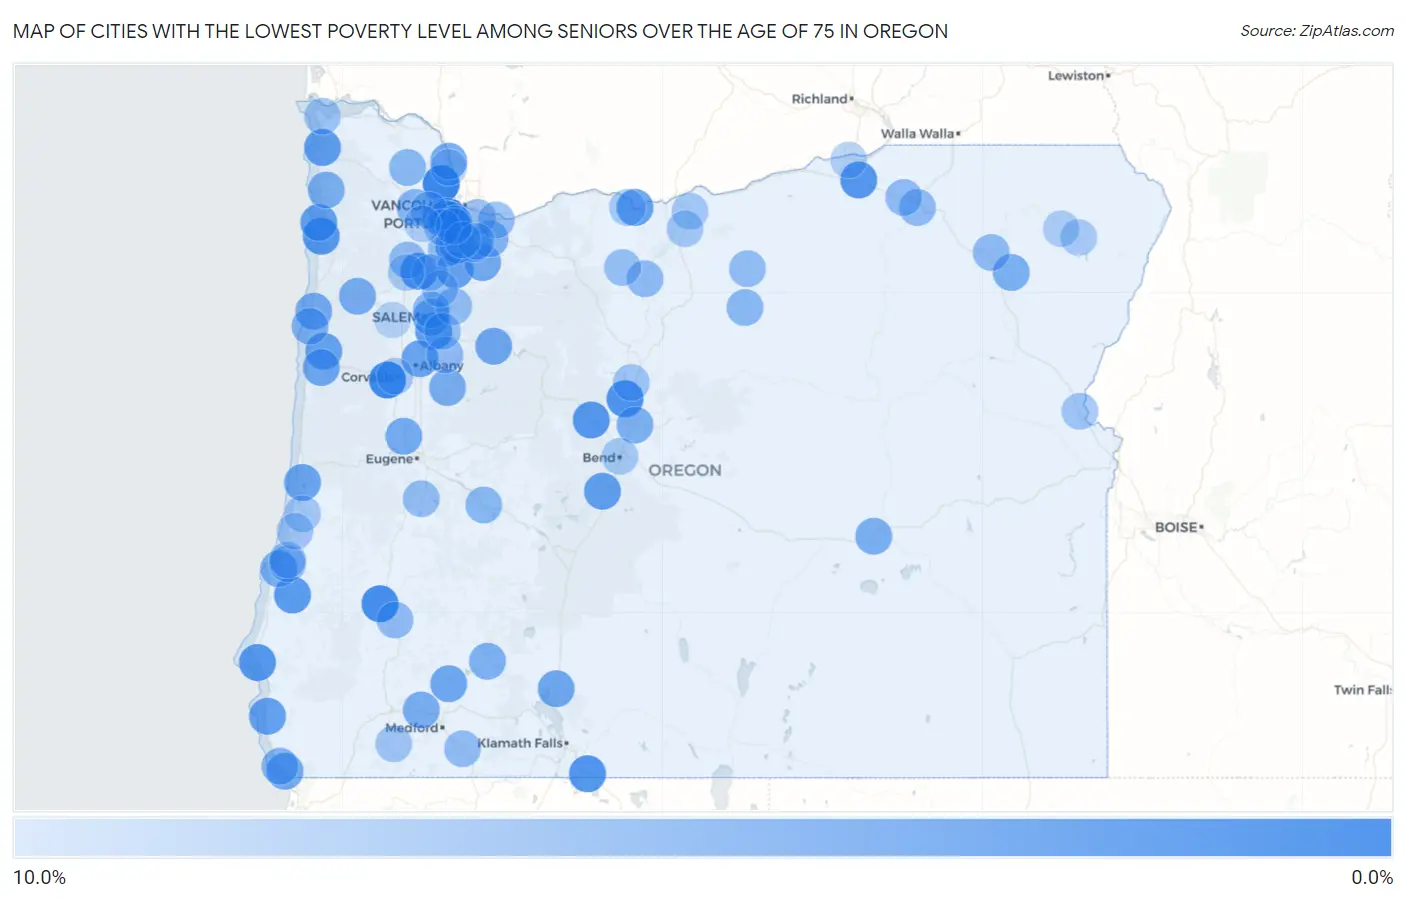
Map of Cities with the Lowest Poverty Level Among Seniors Over the Age of 75 in Oregon
10.0%
0.0%
Cities with the Lowest Poverty Level Among Seniors Over the Age of 75 in Oregon
| City | Senior Poverty | vs State | vs National | |
| 1. | Scappoose | 0.25% | 9.6%(-9.34)#1 | 11.1%(-10.8)#16 |
| 2. | Philomath | 0.60% | 9.6%(-8.98)#2 | 11.1%(-10.5)#69 |
| 3. | Winston | 1.2% | 9.6%(-8.34)#3 | 11.1%(-9.83)#196 |
| 4. | Crooked River Ranch | 1.6% | 9.6%(-7.94)#4 | 11.1%(-9.42)#358 |
| 5. | Merrill | 1.9% | 9.6%(-7.66)#5 | 11.1%(-9.14)#481 |
| 6. | Dayton | 2.1% | 9.6%(-7.52)#6 | 11.1%(-9.01)#560 |
| 7. | Stanfield | 2.1% | 9.6%(-7.47)#7 | 11.1%(-8.95)#599 |
| 8. | Sisters | 2.2% | 9.6%(-7.41)#8 | 11.1%(-8.89)#633 |
| 9. | Netarts | 2.2% | 9.6%(-7.41)#9 | 11.1%(-8.89)#641 |
| 10. | Port Orford | 2.3% | 9.6%(-7.32)#10 | 11.1%(-8.81)#693 |
| 11. | Coquille | 2.5% | 9.6%(-7.13)#11 | 11.1%(-8.62)#815 |
| 12. | Turner | 2.7% | 9.6%(-6.83)#12 | 11.1%(-8.32)#1,043 |
| 13. | Seaside | 2.8% | 9.6%(-6.77)#13 | 11.1%(-8.26)#1,090 |
| 14. | Rockcreek | 2.8% | 9.6%(-6.76)#14 | 11.1%(-8.24)#1,107 |
| 15. | Three Rivers | 3.0% | 9.6%(-6.61)#15 | 11.1%(-8.10)#1,213 |
| 16. | Cape Meares | 3.0% | 9.6%(-6.58)#16 | 11.1%(-8.07)#1,243 |
| 17. | Tualatin | 3.0% | 9.6%(-6.57)#17 | 11.1%(-8.05)#1,249 |
| 18. | Gold Beach | 3.1% | 9.6%(-6.47)#18 | 11.1%(-7.95)#1,330 |
| 19. | The Dalles | 3.2% | 9.6%(-6.43)#19 | 11.1%(-7.91)#1,369 |
| 20. | Siletz | 3.2% | 9.6%(-6.36)#20 | 11.1%(-7.84)#1,428 |
| 21. | Aurora | 3.2% | 9.6%(-6.36)#21 | 11.1%(-7.84)#1,429 |
| 22. | Raleigh Hills | 3.3% | 9.6%(-6.29)#22 | 11.1%(-7.78)#1,488 |
| 23. | Bethany | 3.4% | 9.6%(-6.20)#23 | 11.1%(-7.69)#1,575 |
| 24. | Cedar Mill | 3.4% | 9.6%(-6.17)#24 | 11.1%(-7.65)#1,608 |
| 25. | Millersburg | 3.4% | 9.6%(-6.13)#25 | 11.1%(-7.62)#1,627 |
| 26. | Dunes City | 3.4% | 9.6%(-6.13)#26 | 11.1%(-7.62)#1,633 |
| 27. | Toledo | 3.7% | 9.6%(-5.88)#27 | 11.1%(-7.36)#1,862 |
| 28. | Gates | 3.7% | 9.6%(-5.88)#28 | 11.1%(-7.36)#1,876 |
| 29. | Shady Cove | 3.8% | 9.6%(-5.83)#29 | 11.1%(-7.31)#1,917 |
| 30. | Chiloquin | 3.8% | 9.6%(-5.81)#30 | 11.1%(-7.29)#1,949 |
| 31. | Beavercreek | 4.0% | 9.6%(-5.62)#31 | 11.1%(-7.10)#2,144 |
| 32. | Harbor | 4.0% | 9.6%(-5.60)#32 | 11.1%(-7.09)#2,155 |
| 33. | Columbia City | 4.0% | 9.6%(-5.53)#33 | 11.1%(-7.02)#2,220 |
| 34. | Lincoln City | 4.1% | 9.6%(-5.49)#34 | 11.1%(-6.98)#2,272 |
| 35. | Junction City | 4.1% | 9.6%(-5.49)#35 | 11.1%(-6.97)#2,276 |
| 36. | Waterloo | 4.3% | 9.6%(-5.23)#36 | 11.1%(-6.72)#2,543 |
| 37. | Gold Hill | 4.4% | 9.6%(-5.17)#37 | 11.1%(-6.66)#2,598 |
| 38. | Grand Ronde | 4.5% | 9.6%(-5.10)#38 | 11.1%(-6.59)#2,661 |
| 39. | Hines | 4.5% | 9.6%(-5.09)#39 | 11.1%(-6.58)#2,669 |
| 40. | Union | 4.5% | 9.6%(-5.07)#40 | 11.1%(-6.56)#2,688 |
| 41. | Nehalem | 4.5% | 9.6%(-5.04)#41 | 11.1%(-6.52)#2,759 |
| 42. | Four Corners | 4.6% | 9.6%(-5.02)#42 | 11.1%(-6.51)#2,763 |
| 43. | Barview | 4.6% | 9.6%(-5.01)#43 | 11.1%(-6.49)#2,775 |
| 44. | Redmond | 4.7% | 9.6%(-4.91)#44 | 11.1%(-6.39)#2,877 |
| 45. | Prospect | 4.8% | 9.6%(-4.82)#45 | 11.1%(-6.31)#2,946 |
| 46. | Lincoln Beach | 4.8% | 9.6%(-4.76)#46 | 11.1%(-6.25)#3,009 |
| 47. | Brookings | 5.1% | 9.6%(-4.46)#47 | 11.1%(-5.95)#3,322 |
| 48. | Damascus | 5.2% | 9.6%(-4.40)#48 | 11.1%(-5.89)#3,388 |
| 49. | Banks | 5.3% | 9.6%(-4.32)#49 | 11.1%(-5.80)#3,455 |
| 50. | Vernonia | 5.5% | 9.6%(-4.09)#50 | 11.1%(-5.57)#3,690 |
| 51. | Hayesville | 5.5% | 9.6%(-4.06)#51 | 11.1%(-5.54)#3,714 |
| 52. | Fossil | 5.6% | 9.6%(-4.03)#52 | 11.1%(-5.51)#3,773 |
| 53. | Westfir | 5.6% | 9.6%(-4.03)#53 | 11.1%(-5.51)#3,783 |
| 54. | Tutuilla | 5.7% | 9.6%(-3.87)#54 | 11.1%(-5.35)#3,944 |
| 55. | Myrtle Creek | 5.7% | 9.6%(-3.85)#55 | 11.1%(-5.33)#3,959 |
| 56. | Oak Hills | 5.7% | 9.6%(-3.83)#56 | 11.1%(-5.32)#3,972 |
| 57. | Island City | 5.8% | 9.6%(-3.78)#57 | 11.1%(-5.27)#4,023 |
| 58. | Gladstone | 5.8% | 9.6%(-3.76)#58 | 11.1%(-5.25)#4,041 |
| 59. | Coos Bay | 5.9% | 9.6%(-3.70)#59 | 11.1%(-5.18)#4,097 |
| 60. | Carlton | 5.9% | 9.6%(-3.70)#60 | 11.1%(-5.18)#4,102 |
| 61. | Scio | 5.9% | 9.6%(-3.70)#61 | 11.1%(-5.18)#4,112 |
| 62. | Maupin | 5.9% | 9.6%(-3.70)#62 | 11.1%(-5.18)#4,137 |
| 63. | Pendleton | 5.9% | 9.6%(-3.65)#63 | 11.1%(-5.13)#4,184 |
| 64. | Condon | 6.1% | 9.6%(-3.52)#64 | 11.1%(-5.01)#4,320 |
| 65. | Silverton | 6.1% | 9.6%(-3.50)#65 | 11.1%(-4.98)#4,352 |
| 66. | Ashland | 6.1% | 9.6%(-3.49)#66 | 11.1%(-4.98)#4,355 |
| 67. | Maywood Park | 6.1% | 9.6%(-3.46)#67 | 11.1%(-4.94)#4,390 |
| 68. | Troutdale | 6.1% | 9.6%(-3.45)#68 | 11.1%(-4.94)#4,400 |
| 69. | Rivergrove | 6.2% | 9.6%(-3.43)#69 | 11.1%(-4.91)#4,431 |
| 70. | West Haven Sylvan | 6.2% | 9.6%(-3.40)#70 | 11.1%(-4.88)#4,451 |
| 71. | Sherwood | 6.2% | 9.6%(-3.39)#71 | 11.1%(-4.88)#4,455 |
| 72. | Cottage Grove | 6.2% | 9.6%(-3.38)#72 | 11.1%(-4.87)#4,463 |
| 73. | Aumsville | 6.2% | 9.6%(-3.33)#73 | 11.1%(-4.82)#4,503 |
| 74. | Pine Hollow | 6.2% | 9.6%(-3.33)#74 | 11.1%(-4.82)#4,547 |
| 75. | Johnson City | 6.2% | 9.6%(-3.33)#75 | 11.1%(-4.82)#4,550 |
| 76. | North Plains | 6.4% | 9.6%(-3.21)#76 | 11.1%(-4.70)#4,674 |
| 77. | Aloha | 6.5% | 9.6%(-3.13)#77 | 11.1%(-4.62)#4,742 |
| 78. | Gervais | 6.7% | 9.6%(-2.91)#78 | 11.1%(-4.40)#4,951 |
| 79. | Huntington | 6.7% | 9.6%(-2.91)#79 | 11.1%(-4.40)#4,973 |
| 80. | St Paul | 6.7% | 9.6%(-2.91)#80 | 11.1%(-4.40)#4,992 |
| 81. | North Bend | 6.7% | 9.6%(-2.90)#81 | 11.1%(-4.38)#5,029 |
| 82. | Culver | 6.8% | 9.6%(-2.82)#82 | 11.1%(-4.31)#5,079 |
| 83. | Warrenton | 6.8% | 9.6%(-2.82)#83 | 11.1%(-4.31)#5,085 |
| 84. | Williams | 6.8% | 9.6%(-2.81)#84 | 11.1%(-4.30)#5,092 |
| 85. | Reedsport | 6.9% | 9.6%(-2.65)#85 | 11.1%(-4.14)#5,262 |
| 86. | Lakeside | 7.0% | 9.6%(-2.62)#86 | 11.1%(-4.10)#5,295 |
| 87. | Corvallis | 7.0% | 9.6%(-2.55)#87 | 11.1%(-4.03)#5,363 |
| 88. | Lake Oswego | 7.0% | 9.6%(-2.54)#88 | 11.1%(-4.03)#5,364 |
| 89. | Wasco | 7.0% | 9.6%(-2.54)#89 | 11.1%(-4.02)#5,370 |
| 90. | Moro | 7.1% | 9.6%(-2.44)#90 | 11.1%(-3.92)#5,470 |
| 91. | West Slope | 7.2% | 9.6%(-2.39)#91 | 11.1%(-3.88)#5,518 |
| 92. | Bend | 7.2% | 9.6%(-2.35)#92 | 11.1%(-3.83)#5,560 |
| 93. | Chenoweth | 7.2% | 9.6%(-2.33)#93 | 11.1%(-3.82)#5,572 |
| 94. | Enterprise | 7.3% | 9.6%(-2.24)#94 | 11.1%(-3.72)#5,658 |
| 95. | Mcminnville | 7.4% | 9.6%(-2.16)#95 | 11.1%(-3.65)#5,748 |
| 96. | Cornelius | 7.7% | 9.6%(-1.91)#96 | 11.1%(-3.40)#5,939 |
| 97. | Lostine | 7.7% | 9.6%(-1.89)#97 | 11.1%(-3.37)#6,011 |
| 98. | Umatilla | 7.8% | 9.6%(-1.81)#98 | 11.1%(-3.29)#6,082 |
| 99. | St Helens | 8.0% | 9.6%(-1.55)#99 | 11.1%(-3.04)#6,318 |
| 100. | Dallas | 8.3% | 9.6%(-1.27)#100 | 11.1%(-2.75)#6,557 |
Common Questions
What are the Top 10 Cities with the Lowest Poverty Level Among Seniors Over the Age of 75 in Oregon?
Top 10 Cities with the Lowest Poverty Level Among Seniors Over the Age of 75 in Oregon are:
#1
0.25%
#2
0.60%
#3
1.2%
#4
1.6%
#5
1.9%
#6
2.1%
#7
2.1%
#8
2.2%
#9
2.2%
#10
2.3%
What city has the Lowest Poverty Level Among Seniors Over the Age of 75 in Oregon?
Scappoose has the Lowest Poverty Level Among Seniors Over the Age of 75 in Oregon with 0.25%.
What is the Poverty Level Among Seniors Over the Age of 75 in the State of Oregon?
Poverty Level Among Seniors Over the Age of 75 in Oregon is 9.6%.
What is the Poverty Level Among Seniors Over the Age of 75 in the United States?
Poverty Level Among Seniors Over the Age of 75 in the United States is 11.1%.