Hermosa Beach, CA Map & Demographics
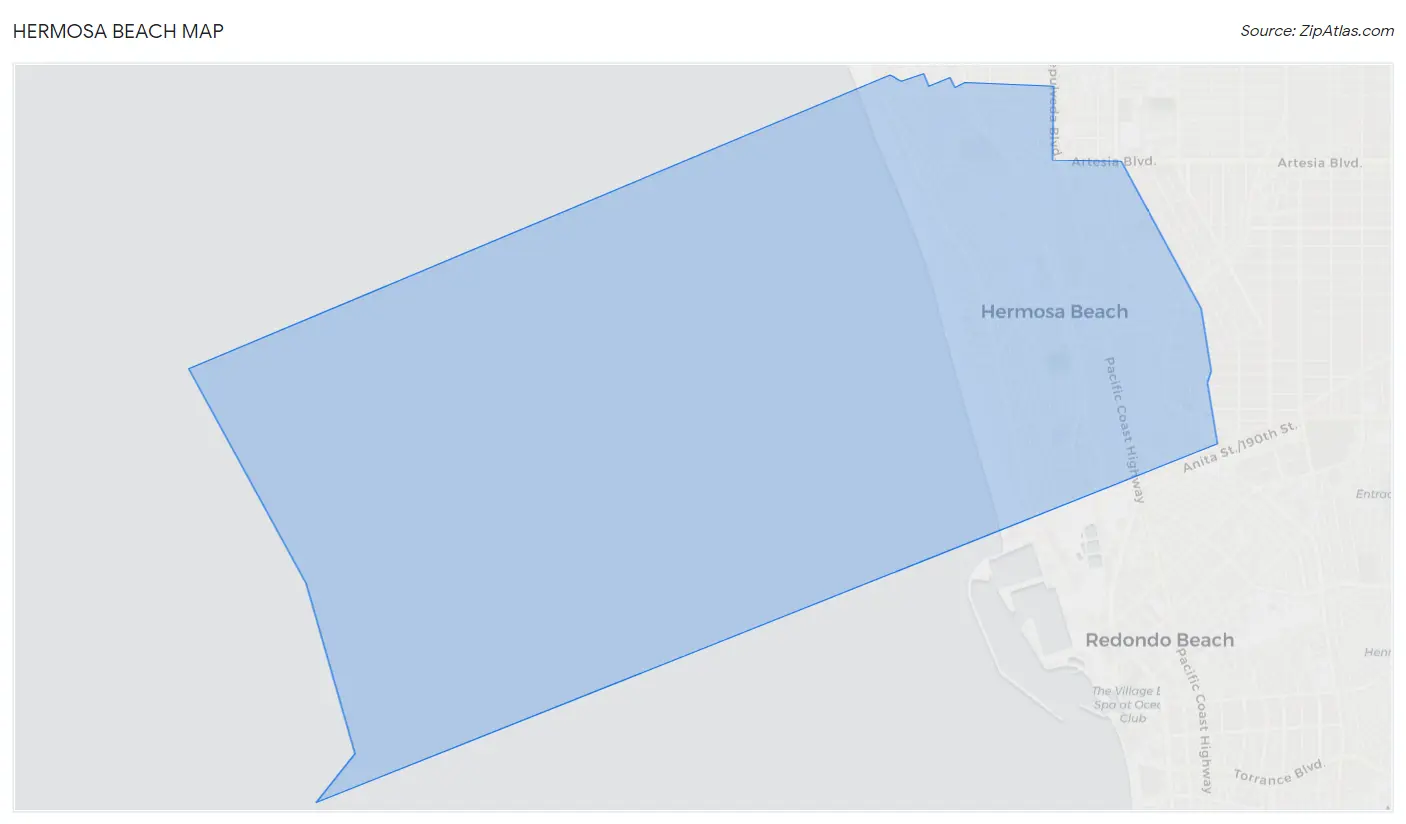
Hermosa Beach Map
Hermosa Beach Overview
$106,731
PER CAPITA INCOME
$226,970
AVG FAMILY INCOME
$149,500
AVG HOUSEHOLD INCOME
24.4%
WAGE / INCOME GAP [ % ]
75.6¢/ $1
WAGE / INCOME GAP [ $ ]
0.49
INEQUALITY / GINI INDEX
19,551
TOTAL POPULATION
10,553
MALE POPULATION
8,998
FEMALE POPULATION
117.28
MALES / 100 FEMALES
85.26
FEMALES / 100 MALES
40.2
MEDIAN AGE
2.9
AVG FAMILY SIZE
2.2
AVG HOUSEHOLD SIZE
11,597
LABOR FORCE [ PEOPLE ]
71.1%
PERCENT IN LABOR FORCE
4.9%
UNEMPLOYMENT RATE
Hermosa Beach Zip Codes
Income in Hermosa Beach
Income Overview in Hermosa Beach
Per Capita Income in Hermosa Beach is $106,731, while median incomes of families and households are $226,970 and $149,500 respectively.
| Characteristic | Number | Measure |
| Per Capita Income | 19,551 | $106,731 |
| Median Family Income | 4,516 | $226,970 |
| Mean Family Income | 4,516 | $300,899 |
| Median Household Income | 8,882 | $149,500 |
| Mean Household Income | 8,882 | $231,463 |
| Income Deficit | 4,516 | $0 |
| Wage / Income Gap (%) | 19,551 | 24.44% |
| Wage / Income Gap ($) | 19,551 | 75.56¢ per $1 |
| Gini / Inequality Index | 19,551 | 0.49 |
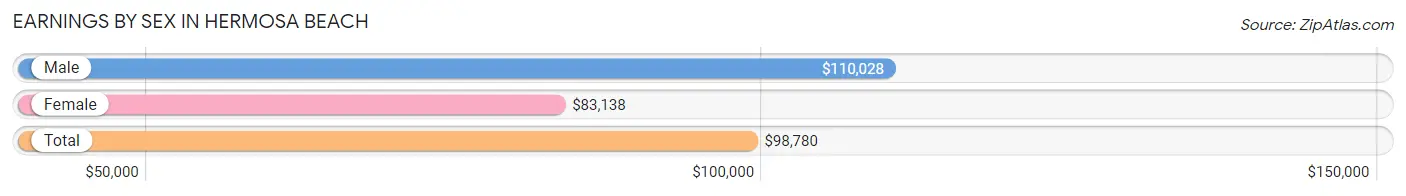
Earnings by Sex in Hermosa Beach
Average Earnings in Hermosa Beach are $98,780, $110,028 for men and $83,138 for women, a difference of 24.4%.
| Sex | Number | Average Earnings |
| Male | 7,071 (57.9%) | $110,028 |
| Female | 5,137 (42.1%) | $83,138 |
| Total | 12,208 (100.0%) | $98,780 |
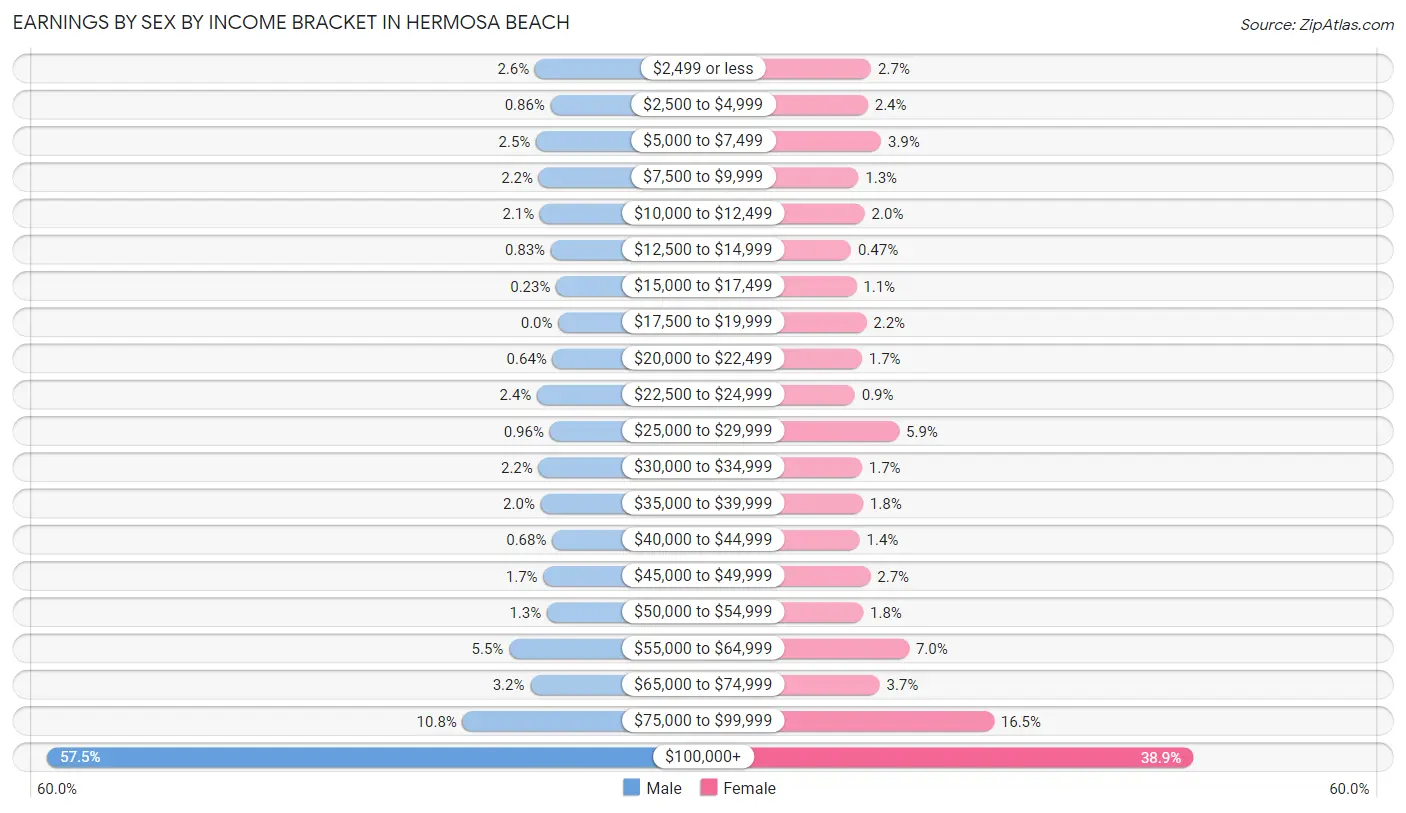
Earnings by Sex by Income Bracket in Hermosa Beach
The most common earnings brackets in Hermosa Beach are $100,000+ for men (4,064 | 57.5%) and $100,000+ for women (1,999 | 38.9%).
| Income | Male | Female |
| $2,499 or less | 185 (2.6%) | 141 (2.7%) |
| $2,500 to $4,999 | 61 (0.9%) | 121 (2.4%) |
| $5,000 to $7,499 | 176 (2.5%) | 198 (3.8%) |
| $7,500 to $9,999 | 155 (2.2%) | 67 (1.3%) |
| $10,000 to $12,499 | 145 (2.1%) | 103 (2.0%) |
| $12,500 to $14,999 | 59 (0.8%) | 24 (0.5%) |
| $15,000 to $17,499 | 16 (0.2%) | 55 (1.1%) |
| $17,500 to $19,999 | 0 (0.0%) | 113 (2.2%) |
| $20,000 to $22,499 | 45 (0.6%) | 87 (1.7%) |
| $22,500 to $24,999 | 168 (2.4%) | 46 (0.9%) |
| $25,000 to $29,999 | 68 (1.0%) | 302 (5.9%) |
| $30,000 to $34,999 | 157 (2.2%) | 87 (1.7%) |
| $35,000 to $39,999 | 140 (2.0%) | 93 (1.8%) |
| $40,000 to $44,999 | 48 (0.7%) | 74 (1.4%) |
| $45,000 to $49,999 | 119 (1.7%) | 136 (2.6%) |
| $50,000 to $54,999 | 90 (1.3%) | 94 (1.8%) |
| $55,000 to $64,999 | 391 (5.5%) | 359 (7.0%) |
| $65,000 to $74,999 | 223 (3.2%) | 189 (3.7%) |
| $75,000 to $99,999 | 761 (10.8%) | 849 (16.5%) |
| $100,000+ | 4,064 (57.5%) | 1,999 (38.9%) |
| Total | 7,071 (100.0%) | 5,137 (100.0%) |
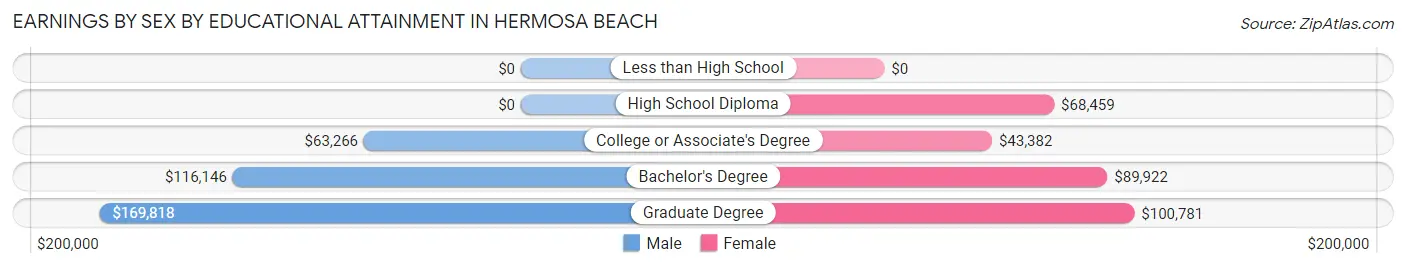
Earnings by Sex by Educational Attainment in Hermosa Beach
Average earnings in Hermosa Beach are $117,580 for men and $86,743 for women, a difference of 26.2%. Men with an educational attainment of graduate degree enjoy the highest average annual earnings of $169,818, while those with college or associate's degree education earn the least with $63,266. Women with an educational attainment of graduate degree earn the most with the average annual earnings of $100,781, while those with college or associate's degree education have the smallest earnings of $43,382.
| Educational Attainment | Male Income | Female Income |
| Less than High School | - | - |
| High School Diploma | - | - |
| College or Associate's Degree | $63,266 | $43,382 |
| Bachelor's Degree | $116,146 | $89,922 |
| Graduate Degree | $169,818 | $100,781 |
| Total | $117,580 | $86,743 |
Family Income in Hermosa Beach
Family Income Brackets in Hermosa Beach
According to the Hermosa Beach family income data, there are 2,538 families falling into the $200,000+ income range, which is the most common income bracket and makes up 56.2% of all families. Conversely, the $15,000 to $24,999 income bracket is the least frequent group with only 5 families (0.1%) belonging to this category.
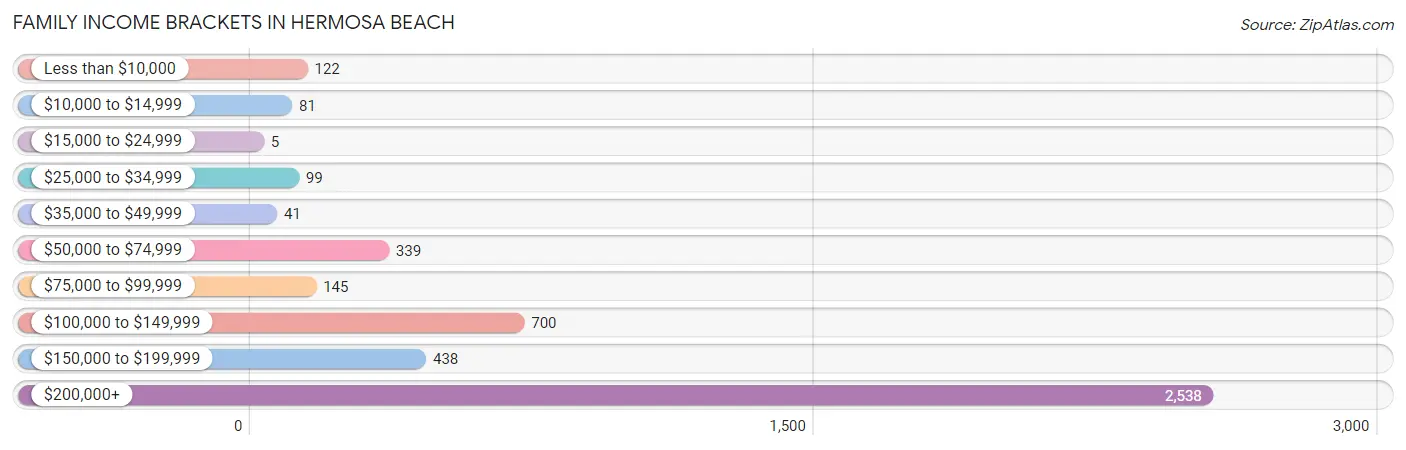
| Income Bracket | # Families | % Families |
| Less than $10,000 | 122 | 2.7% |
| $10,000 to $14,999 | 81 | 1.8% |
| $15,000 to $24,999 | 5 | 0.1% |
| $25,000 to $34,999 | 99 | 2.2% |
| $35,000 to $49,999 | 41 | 0.9% |
| $50,000 to $74,999 | 339 | 7.5% |
| $75,000 to $99,999 | 145 | 3.2% |
| $100,000 to $149,999 | 700 | 15.5% |
| $150,000 to $199,999 | 438 | 9.7% |
| $200,000+ | 2,538 | 56.2% |
Family Income by Famaliy Size in Hermosa Beach
4-person families (699 | 15.5%) account for the highest median family income in Hermosa Beach with $250,001 per family, while 2-person families (2,447 | 54.2%) have the highest median income of $102,388 per family member.
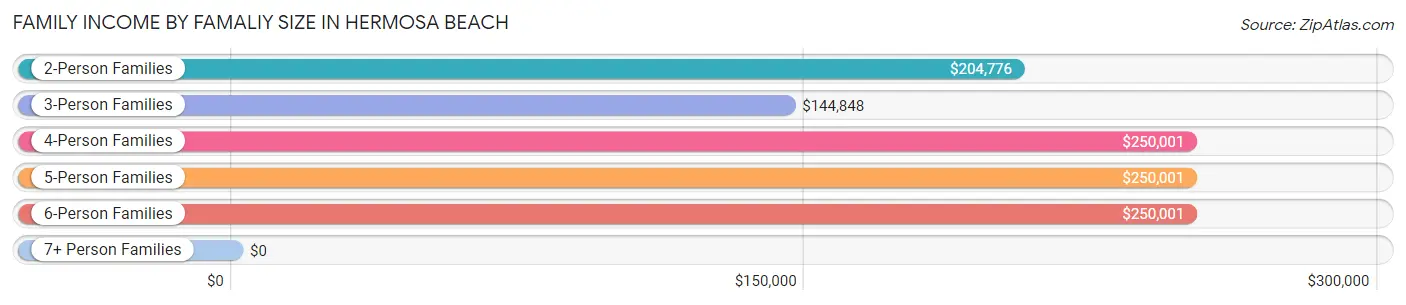
| Income Bracket | # Families | Median Income |
| 2-Person Families | 2,447 (54.2%) | $204,776 |
| 3-Person Families | 1,019 (22.6%) | $144,848 |
| 4-Person Families | 699 (15.5%) | $250,001 |
| 5-Person Families | 290 (6.4%) | $250,001 |
| 6-Person Families | 47 (1.0%) | $250,001 |
| 7+ Person Families | 14 (0.3%) | $0 |
| Total | 4,516 (100.0%) | $226,970 |
Family Income by Number of Earners in Hermosa Beach
The median family income in Hermosa Beach is $226,970, with families comprising 2 earners (2,324) having the highest median family income of $250,001, while families with no earners (767) have the lowest median family income of $82,604, accounting for 51.5% and 17.0% of families, respectively.
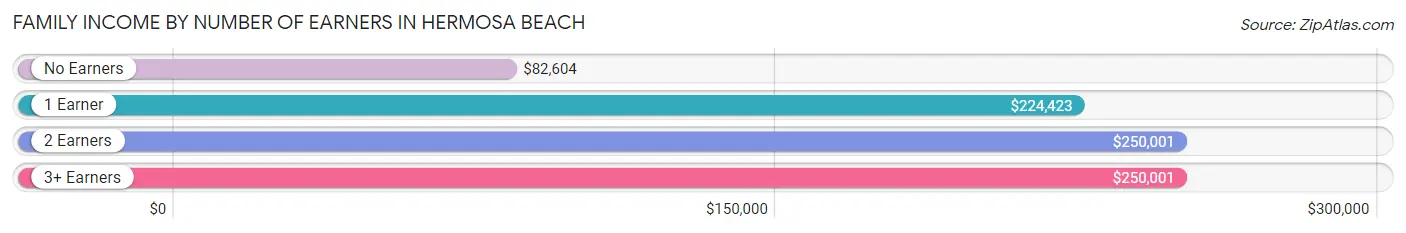
| Number of Earners | # Families | Median Income |
| No Earners | 767 (17.0%) | $82,604 |
| 1 Earner | 1,110 (24.6%) | $224,423 |
| 2 Earners | 2,324 (51.5%) | $250,001 |
| 3+ Earners | 315 (7.0%) | $250,001 |
| Total | 4,516 (100.0%) | $226,970 |
Household Income in Hermosa Beach
Household Income Brackets in Hermosa Beach
With 3,508 households falling in the category, the $200,000+ income range is the most frequent in Hermosa Beach, accounting for 39.5% of all households. In contrast, only 169 households (1.9%) fall into the $10,000 to $14,999 income bracket, making it the least populous group.
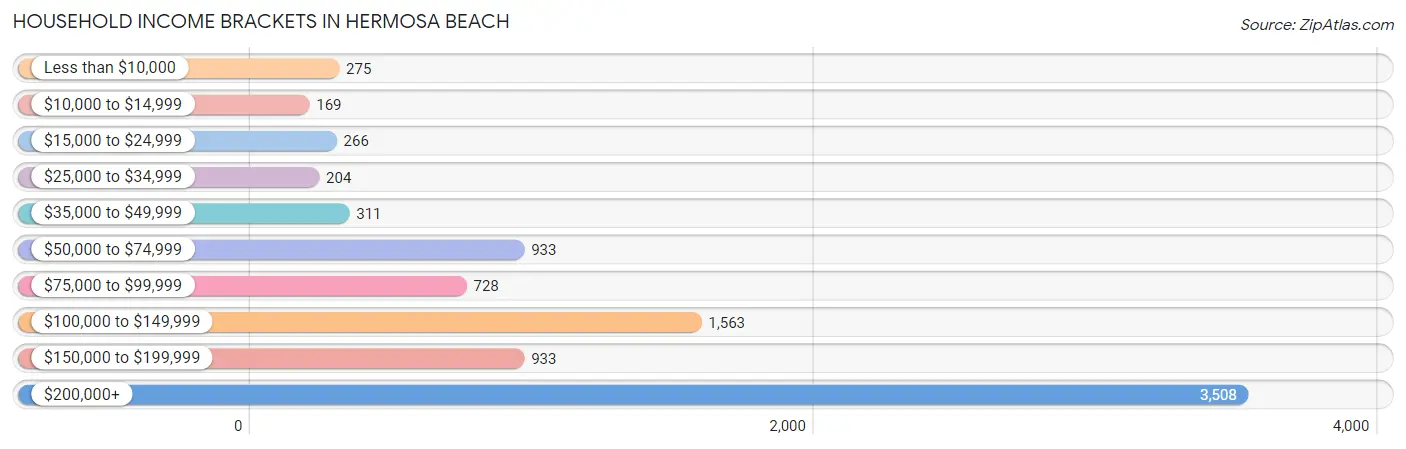
| Income Bracket | # Households | % Households |
| Less than $10,000 | 275 | 3.1% |
| $10,000 to $14,999 | 169 | 1.9% |
| $15,000 to $24,999 | 266 | 3.0% |
| $25,000 to $34,999 | 204 | 2.3% |
| $35,000 to $49,999 | 311 | 3.5% |
| $50,000 to $74,999 | 933 | 10.5% |
| $75,000 to $99,999 | 728 | 8.2% |
| $100,000 to $149,999 | 1,563 | 17.6% |
| $150,000 to $199,999 | 933 | 10.5% |
| $200,000+ | 3,508 | 39.5% |
Household Income by Householder Age in Hermosa Beach
The median household income in Hermosa Beach is $149,500, with the highest median household income of $185,625 found in the 45 to 64 years age bracket for the primary householder. A total of 3,419 households (38.5%) fall into this category. Meanwhile, the 65+ years age bracket for the primary householder has the lowest median household income of $100,852, with 1,809 households (20.4%) in this group.
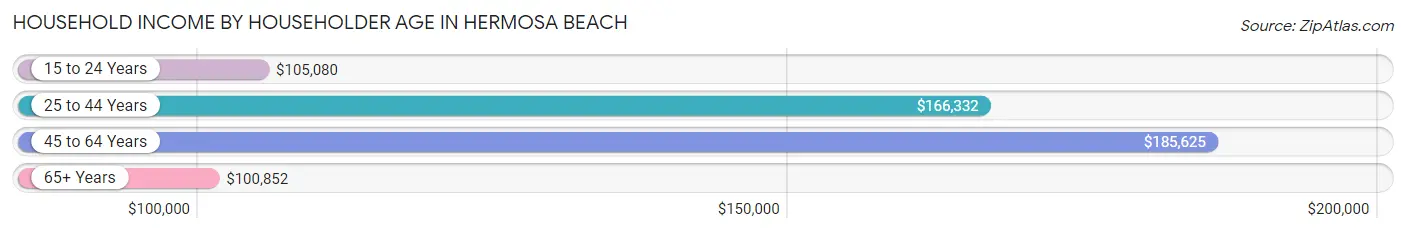
| Income Bracket | # Households | Median Income |
| 15 to 24 Years | 137 (1.5%) | $105,080 |
| 25 to 44 Years | 3,517 (39.6%) | $166,332 |
| 45 to 64 Years | 3,419 (38.5%) | $185,625 |
| 65+ Years | 1,809 (20.4%) | $100,852 |
| Total | 8,882 (100.0%) | $149,500 |
Poverty in Hermosa Beach
Income Below Poverty by Sex and Age in Hermosa Beach
With 4.7% poverty level for males and 7.0% for females among the residents of Hermosa Beach, 15 year old males and 18 to 24 year old females are the most vulnerable to poverty, with 29 males (34.9%) and 66 females (18.0%) in their respective age groups living below the poverty level.
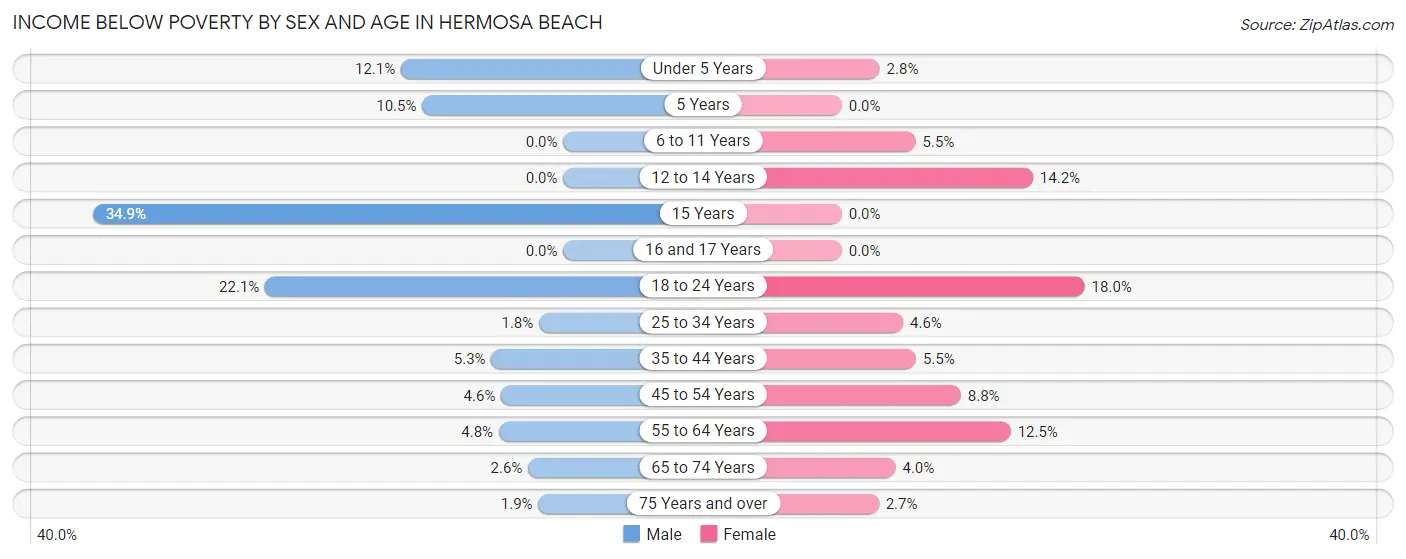
| Age Bracket | Male | Female |
| Under 5 Years | 70 (12.0%) | 11 (2.8%) |
| 5 Years | 18 (10.5%) | 0 (0.0%) |
| 6 to 11 Years | 0 (0.0%) | 39 (5.5%) |
| 12 to 14 Years | 0 (0.0%) | 43 (14.2%) |
| 15 Years | 29 (34.9%) | 0 (0.0%) |
| 16 and 17 Years | 0 (0.0%) | 0 (0.0%) |
| 18 to 24 Years | 89 (22.1%) | 66 (18.0%) |
| 25 to 34 Years | 41 (1.8%) | 79 (4.5%) |
| 35 to 44 Years | 73 (5.3%) | 73 (5.5%) |
| 45 to 54 Years | 73 (4.6%) | 121 (8.8%) |
| 55 to 64 Years | 63 (4.8%) | 161 (12.5%) |
| 65 to 74 Years | 28 (2.6%) | 28 (4.0%) |
| 75 Years and over | 9 (1.8%) | 13 (2.7%) |
| Total | 493 (4.7%) | 634 (7.0%) |
Income Above Poverty by Sex and Age in Hermosa Beach
According to the poverty statistics in Hermosa Beach, males aged 6 to 11 years and females aged 5 years are the age groups that are most secure financially, with 100.0% of males and 100.0% of females in these age groups living above the poverty line.
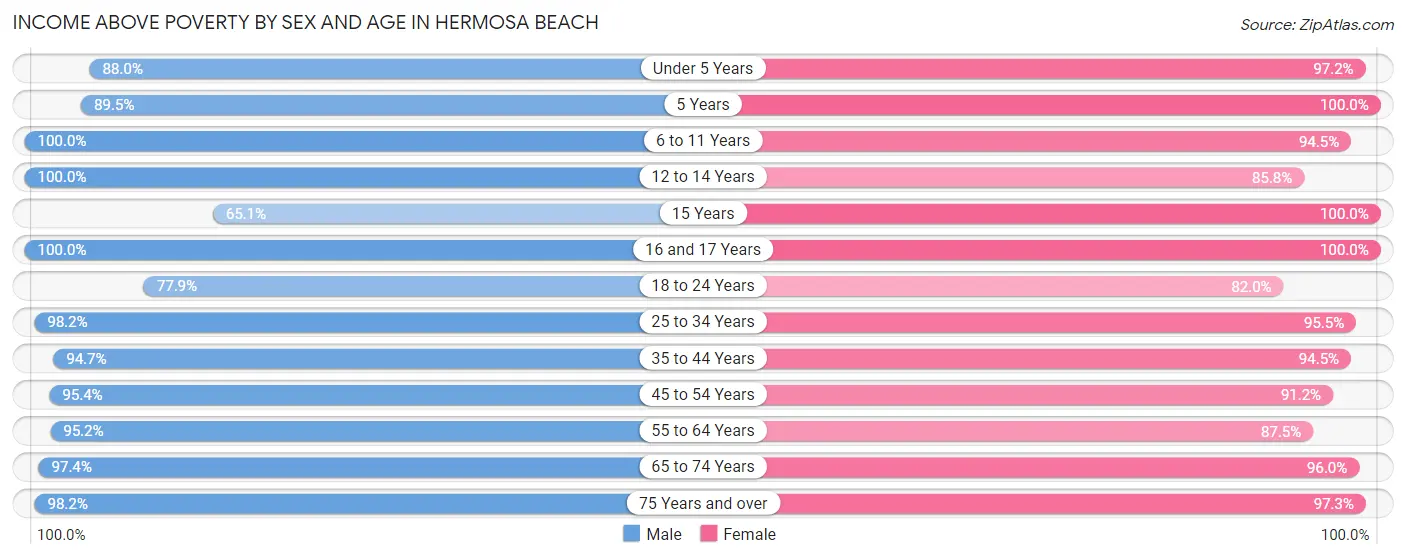
| Age Bracket | Male | Female |
| Under 5 Years | 511 (87.9%) | 380 (97.2%) |
| 5 Years | 154 (89.5%) | 106 (100.0%) |
| 6 to 11 Years | 573 (100.0%) | 673 (94.5%) |
| 12 to 14 Years | 229 (100.0%) | 260 (85.8%) |
| 15 Years | 54 (65.1%) | 87 (100.0%) |
| 16 and 17 Years | 398 (100.0%) | 136 (100.0%) |
| 18 to 24 Years | 313 (77.9%) | 300 (82.0%) |
| 25 to 34 Years | 2,239 (98.2%) | 1,659 (95.5%) |
| 35 to 44 Years | 1,293 (94.7%) | 1,253 (94.5%) |
| 45 to 54 Years | 1,510 (95.4%) | 1,248 (91.2%) |
| 55 to 64 Years | 1,256 (95.2%) | 1,123 (87.5%) |
| 65 to 74 Years | 1,044 (97.4%) | 674 (96.0%) |
| 75 Years and over | 478 (98.2%) | 462 (97.3%) |
| Total | 10,052 (95.3%) | 8,361 (92.9%) |
Income Below Poverty Among Married-Couple Families in Hermosa Beach
The poverty statistics for married-couple families in Hermosa Beach show that 2.1% or 80 of the total 3,791 families live below the poverty line. Families with no children have the highest poverty rate of 3.2%, comprising of 75 families. On the other hand, families with 3 or 4 children have the lowest poverty rate of 0.0%, which includes 0 families.
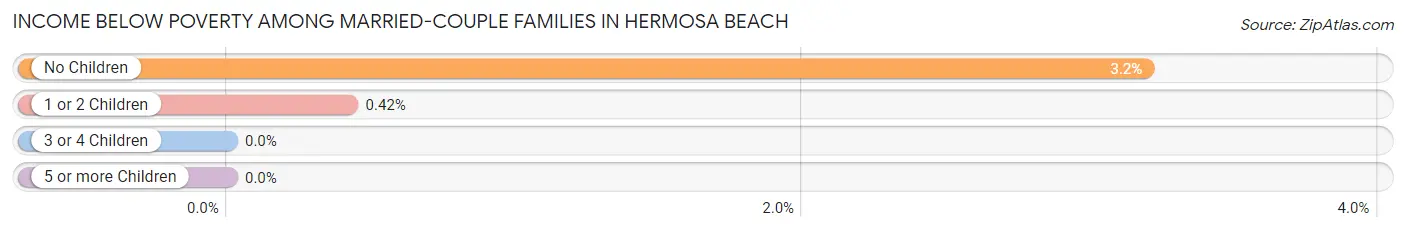
| Children | Above Poverty | Below Poverty |
| No Children | 2,277 (96.8%) | 75 (3.2%) |
| 1 or 2 Children | 1,187 (99.6%) | 5 (0.4%) |
| 3 or 4 Children | 233 (100.0%) | 0 (0.0%) |
| 5 or more Children | 14 (100.0%) | 0 (0.0%) |
| Total | 3,711 (97.9%) | 80 (2.1%) |
Income Below Poverty Among Single-Parent Households in Hermosa Beach
According to the poverty data in Hermosa Beach, 6.5% or 17 single-father households and 24.6% or 114 single-mother households are living below the poverty line. Among single-father households, those with 1 or 2 children have the highest poverty rate, with 17 households (11.1%) experiencing poverty. Likewise, among single-mother households, those with 3 or 4 children have the highest poverty rate, with 14 households (100.0%) falling below the poverty line.
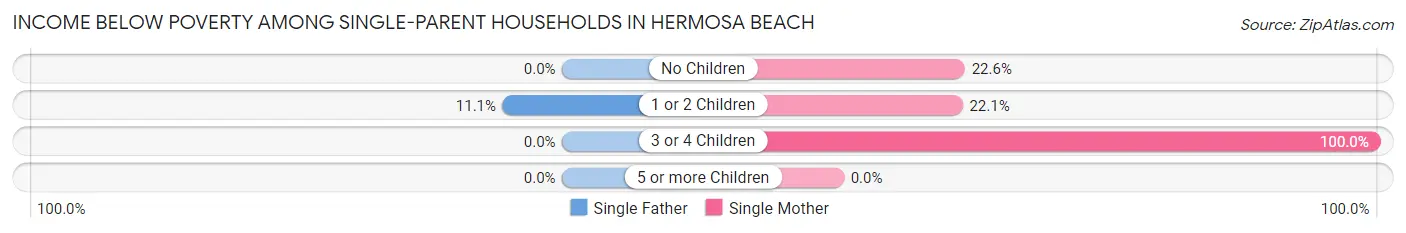
| Children | Single Father | Single Mother |
| No Children | 0 (0.0%) | 23 (22.6%) |
| 1 or 2 Children | 17 (11.1%) | 77 (22.1%) |
| 3 or 4 Children | 0 (0.0%) | 14 (100.0%) |
| 5 or more Children | 0 (0.0%) | 0 (0.0%) |
| Total | 17 (6.5%) | 114 (24.6%) |
Income Below Poverty Among Married-Couple vs Single-Parent Households in Hermosa Beach
The poverty data for Hermosa Beach shows that 80 of the married-couple family households (2.1%) and 131 of the single-parent households (18.1%) are living below the poverty level. Within the married-couple family households, those with no children have the highest poverty rate, with 75 households (3.2%) falling below the poverty line. Among the single-parent households, those with 3 or 4 children have the highest poverty rate, with 14 household (48.3%) living below poverty.
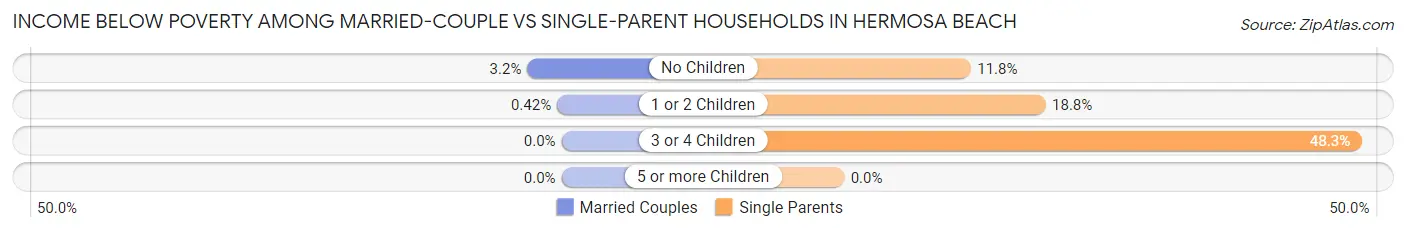
| Children | Married-Couple Families | Single-Parent Households |
| No Children | 75 (3.2%) | 23 (11.8%) |
| 1 or 2 Children | 5 (0.4%) | 94 (18.8%) |
| 3 or 4 Children | 0 (0.0%) | 14 (48.3%) |
| 5 or more Children | 0 (0.0%) | 0 (0.0%) |
| Total | 80 (2.1%) | 131 (18.1%) |
Race in Hermosa Beach
The most populous races in Hermosa Beach are White / Caucasian (15,228 | 77.9%), Two or more Races (2,269 | 11.6%), and Hispanic or Latino (2,228 | 11.4%).
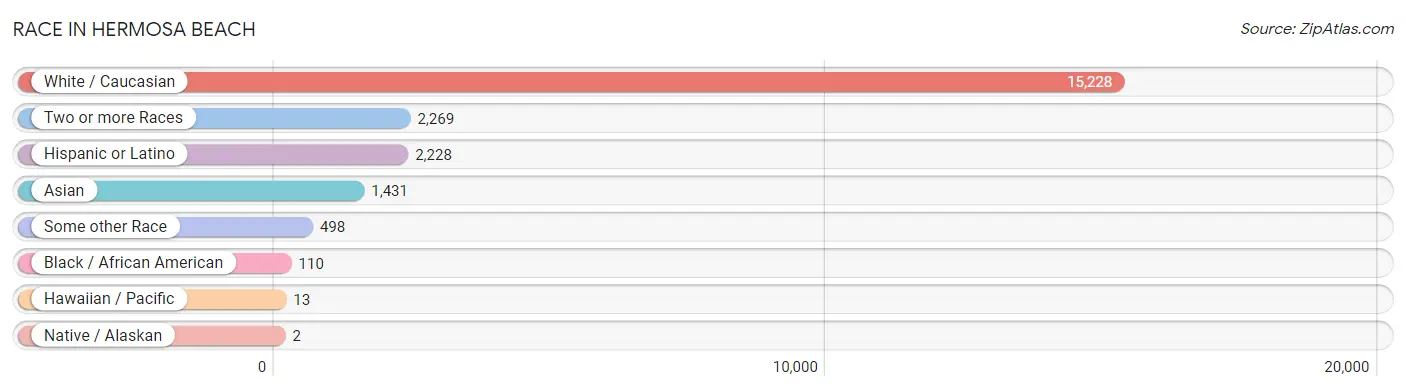
| Race | # Population | % Population |
| Asian | 1,431 | 7.3% |
| Black / African American | 110 | 0.6% |
| Hawaiian / Pacific | 13 | 0.1% |
| Hispanic or Latino | 2,228 | 11.4% |
| Native / Alaskan | 2 | 0.0% |
| White / Caucasian | 15,228 | 77.9% |
| Two or more Races | 2,269 | 11.6% |
| Some other Race | 498 | 2.5% |
| Total | 19,551 | 100.0% |
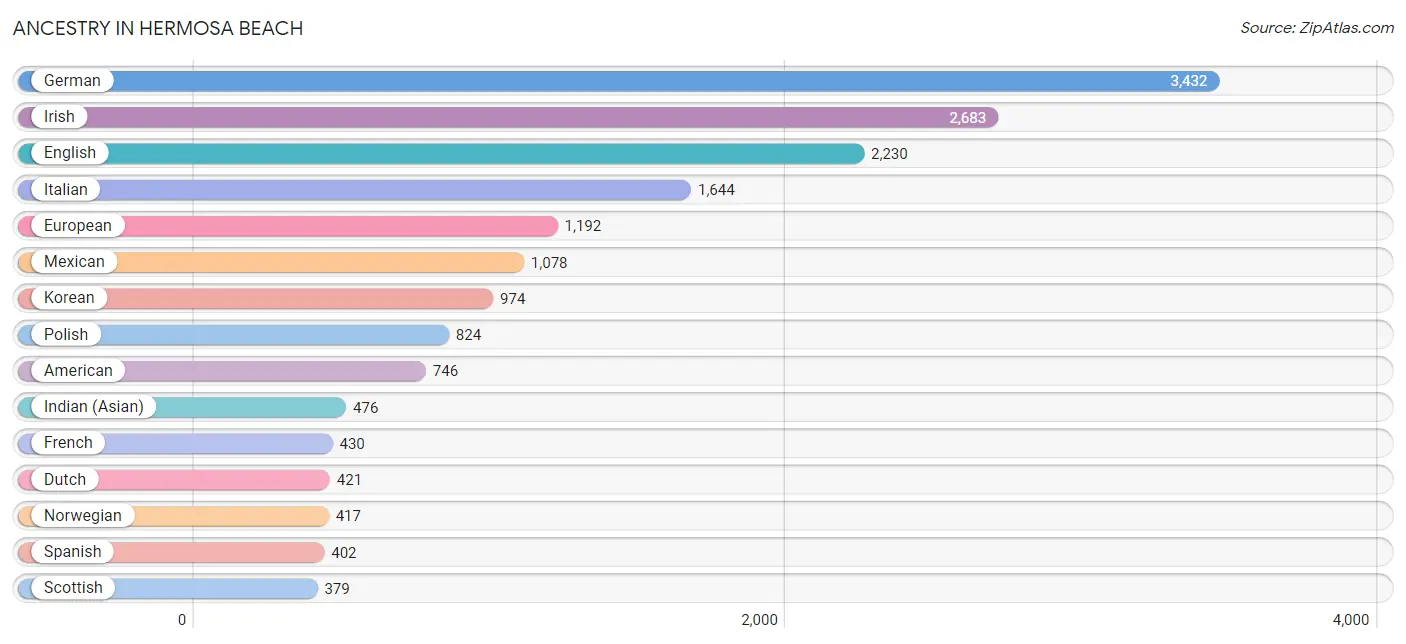
Ancestry in Hermosa Beach
The most populous ancestries reported in Hermosa Beach are German (3,432 | 17.5%), Irish (2,683 | 13.7%), English (2,230 | 11.4%), Italian (1,644 | 8.4%), and European (1,192 | 6.1%), together accounting for 57.2% of all Hermosa Beach residents.
| Ancestry | # Population | % Population |
| Afghan | 38 | 0.2% |
| African | 37 | 0.2% |
| American | 746 | 3.8% |
| Arab | 311 | 1.6% |
| Argentinean | 77 | 0.4% |
| Armenian | 61 | 0.3% |
| Australian | 110 | 0.6% |
| Austrian | 73 | 0.4% |
| Belgian | 71 | 0.4% |
| Bhutanese | 281 | 1.4% |
| Brazilian | 169 | 0.9% |
| British | 196 | 1.0% |
| Burmese | 275 | 1.4% |
| Canadian | 109 | 0.6% |
| Central American | 71 | 0.4% |
| Cherokee | 58 | 0.3% |
| Chinese | 22 | 0.1% |
| Choctaw | 31 | 0.2% |
| Colombian | 127 | 0.6% |
| Costa Rican | 7 | 0.0% |
| Croatian | 45 | 0.2% |
| Cuban | 87 | 0.4% |
| Czech | 137 | 0.7% |
| Czechoslovakian | 9 | 0.1% |
| Danish | 145 | 0.7% |
| Dutch | 421 | 2.1% |
| Eastern European | 144 | 0.7% |
| Ecuadorian | 54 | 0.3% |
| Egyptian | 15 | 0.1% |
| English | 2,230 | 11.4% |
| Estonian | 85 | 0.4% |
| Ethiopian | 54 | 0.3% |
| European | 1,192 | 6.1% |
| Filipino | 87 | 0.4% |
| Finnish | 87 | 0.4% |
| French | 430 | 2.2% |
| French Canadian | 99 | 0.5% |
| German | 3,432 | 17.5% |
| Greek | 151 | 0.8% |
| Guatemalan | 28 | 0.1% |
| Hungarian | 60 | 0.3% |
| Icelander | 36 | 0.2% |
| Indian (Asian) | 476 | 2.4% |
| Iranian | 322 | 1.7% |
| Iraqi | 7 | 0.0% |
| Irish | 2,683 | 13.7% |
| Israeli | 8 | 0.0% |
| Italian | 1,644 | 8.4% |
| Jamaican | 7 | 0.0% |
| Korean | 974 | 5.0% |
| Laotian | 39 | 0.2% |
| Latvian | 13 | 0.1% |
| Lebanese | 113 | 0.6% |
| Lithuanian | 58 | 0.3% |
| Macedonian | 38 | 0.2% |
| Malaysian | 48 | 0.3% |
| Mexican | 1,078 | 5.5% |
| Mexican American Indian | 1 | 0.0% |
| Moroccan | 92 | 0.5% |
| Native Hawaiian | 90 | 0.5% |
| Navajo | 1 | 0.0% |
| New Zealander | 22 | 0.1% |
| Nicaraguan | 10 | 0.1% |
| Nigerian | 17 | 0.1% |
| Northern European | 190 | 1.0% |
| Norwegian | 417 | 2.1% |
| Pakistani | 32 | 0.2% |
| Palestinian | 65 | 0.3% |
| Peruvian | 12 | 0.1% |
| Polish | 824 | 4.2% |
| Portuguese | 92 | 0.5% |
| Puerto Rican | 152 | 0.8% |
| Romanian | 60 | 0.3% |
| Russian | 253 | 1.3% |
| Salvadoran | 26 | 0.1% |
| Scandinavian | 111 | 0.6% |
| Scotch-Irish | 81 | 0.4% |
| Scottish | 379 | 1.9% |
| Serbian | 53 | 0.3% |
| Slovak | 13 | 0.1% |
| Slovene | 18 | 0.1% |
| South American | 270 | 1.4% |
| Spaniard | 143 | 0.7% |
| Spanish | 402 | 2.1% |
| Sri Lankan | 246 | 1.3% |
| Subsaharan African | 108 | 0.5% |
| Swedish | 313 | 1.6% |
| Swiss | 93 | 0.5% |
| Syrian | 77 | 0.4% |
| Thai | 293 | 1.5% |
| Tongan | 13 | 0.1% |
| Turkish | 11 | 0.1% |
| Ukrainian | 204 | 1.0% |
| Welsh | 75 | 0.4% |
| Yaqui | 1 | 0.0% | View All 95 Rows |
Immigrants in Hermosa Beach
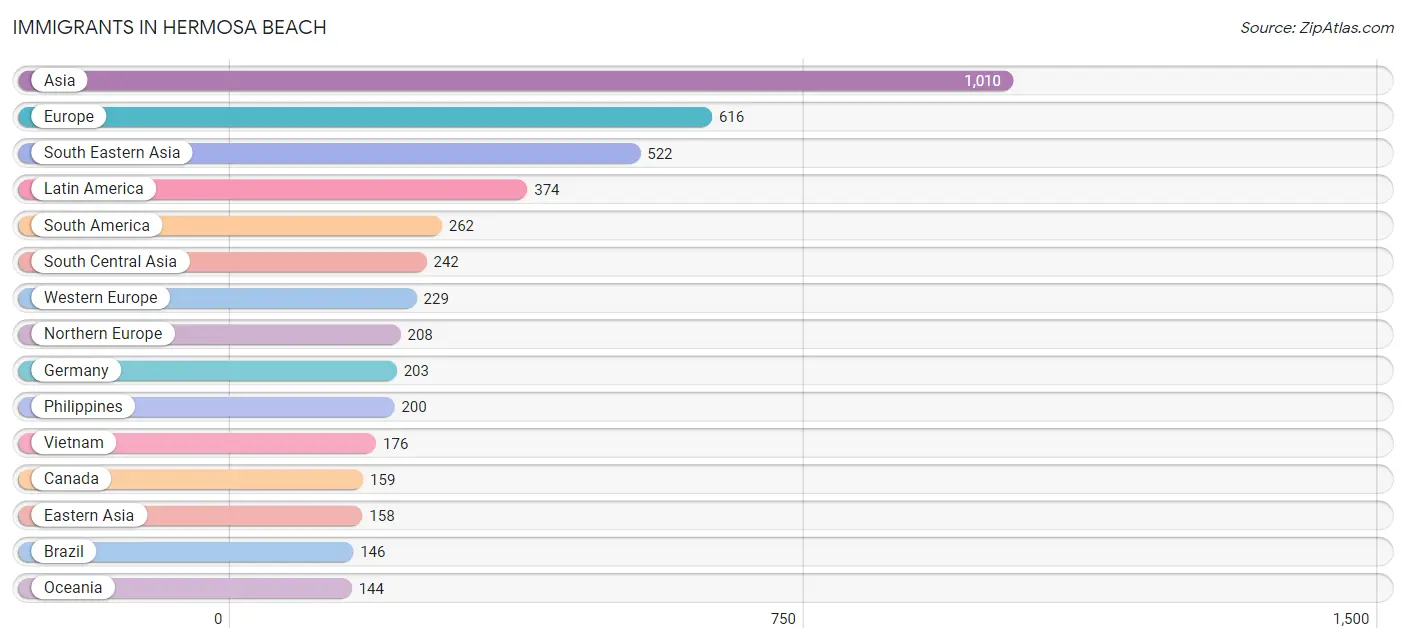
The most numerous immigrant groups reported in Hermosa Beach came from Asia (1,010 | 5.2%), Europe (616 | 3.2%), South Eastern Asia (522 | 2.7%), Latin America (374 | 1.9%), and South America (262 | 1.3%), together accounting for 14.2% of all Hermosa Beach residents.
| Immigration Origin | # Population | % Population |
| Africa | 28 | 0.1% |
| Argentina | 41 | 0.2% |
| Asia | 1,010 | 5.2% |
| Australia | 102 | 0.5% |
| Brazil | 146 | 0.7% |
| Canada | 159 | 0.8% |
| Central America | 112 | 0.6% |
| China | 112 | 0.6% |
| Colombia | 37 | 0.2% |
| Costa Rica | 7 | 0.0% |
| Denmark | 15 | 0.1% |
| Eastern Africa | 5 | 0.0% |
| Eastern Asia | 158 | 0.8% |
| Eastern Europe | 121 | 0.6% |
| Ecuador | 26 | 0.1% |
| England | 24 | 0.1% |
| Europe | 616 | 3.2% |
| France | 19 | 0.1% |
| Germany | 203 | 1.0% |
| Greece | 34 | 0.2% |
| Guatemala | 20 | 0.1% |
| India | 107 | 0.5% |
| Indonesia | 104 | 0.5% |
| Iran | 135 | 0.7% |
| Israel | 7 | 0.0% |
| Italy | 16 | 0.1% |
| Japan | 25 | 0.1% |
| Korea | 21 | 0.1% |
| Latin America | 374 | 1.9% |
| Lebanon | 45 | 0.2% |
| Mexico | 85 | 0.4% |
| Moldova | 11 | 0.1% |
| Netherlands | 7 | 0.0% |
| Northern Africa | 23 | 0.1% |
| Northern Europe | 208 | 1.1% |
| Oceania | 144 | 0.7% |
| Peru | 12 | 0.1% |
| Philippines | 200 | 1.0% |
| Poland | 51 | 0.3% |
| Romania | 22 | 0.1% |
| Russia | 23 | 0.1% |
| Singapore | 42 | 0.2% |
| South America | 262 | 1.3% |
| South Central Asia | 242 | 1.2% |
| South Eastern Asia | 522 | 2.7% |
| Southern Europe | 58 | 0.3% |
| Spain | 8 | 0.0% |
| Sudan | 23 | 0.1% |
| Taiwan | 69 | 0.4% |
| Uganda | 5 | 0.0% |
| Ukraine | 14 | 0.1% |
| Vietnam | 176 | 0.9% |
| Western Asia | 69 | 0.4% |
| Western Europe | 229 | 1.2% | View All 54 Rows |
Sex and Age in Hermosa Beach
Sex and Age in Hermosa Beach
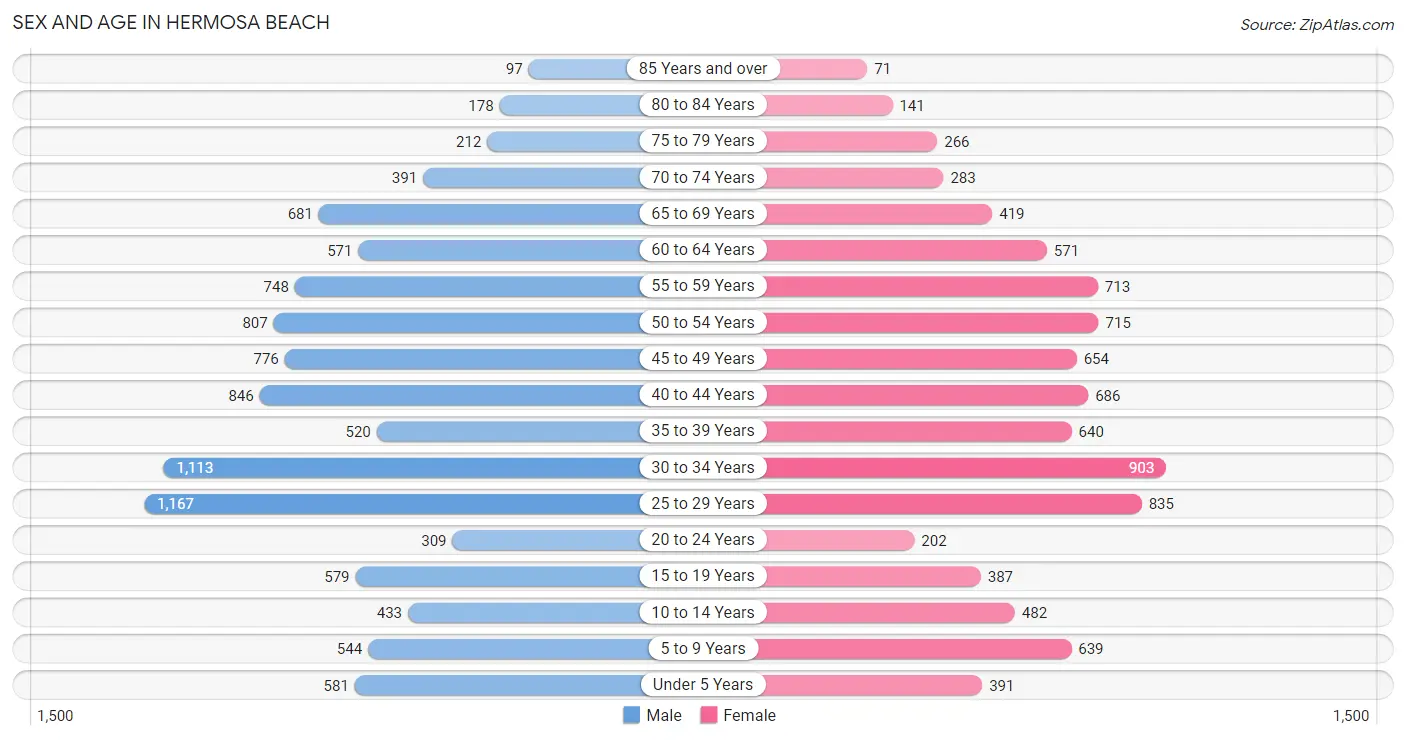
The most populous age groups in Hermosa Beach are 25 to 29 Years (1,167 | 11.1%) for men and 30 to 34 Years (903 | 10.0%) for women.
| Age Bracket | Male | Female |
| Under 5 Years | 581 (5.5%) | 391 (4.3%) |
| 5 to 9 Years | 544 (5.1%) | 639 (7.1%) |
| 10 to 14 Years | 433 (4.1%) | 482 (5.4%) |
| 15 to 19 Years | 579 (5.5%) | 387 (4.3%) |
| 20 to 24 Years | 309 (2.9%) | 202 (2.2%) |
| 25 to 29 Years | 1,167 (11.1%) | 835 (9.3%) |
| 30 to 34 Years | 1,113 (10.5%) | 903 (10.0%) |
| 35 to 39 Years | 520 (4.9%) | 640 (7.1%) |
| 40 to 44 Years | 846 (8.0%) | 686 (7.6%) |
| 45 to 49 Years | 776 (7.3%) | 654 (7.3%) |
| 50 to 54 Years | 807 (7.6%) | 715 (8.0%) |
| 55 to 59 Years | 748 (7.1%) | 713 (7.9%) |
| 60 to 64 Years | 571 (5.4%) | 571 (6.4%) |
| 65 to 69 Years | 681 (6.5%) | 419 (4.7%) |
| 70 to 74 Years | 391 (3.7%) | 283 (3.2%) |
| 75 to 79 Years | 212 (2.0%) | 266 (3.0%) |
| 80 to 84 Years | 178 (1.7%) | 141 (1.6%) |
| 85 Years and over | 97 (0.9%) | 71 (0.8%) |
| Total | 10,553 (100.0%) | 8,998 (100.0%) |
Families and Households in Hermosa Beach
Median Family Size in Hermosa Beach
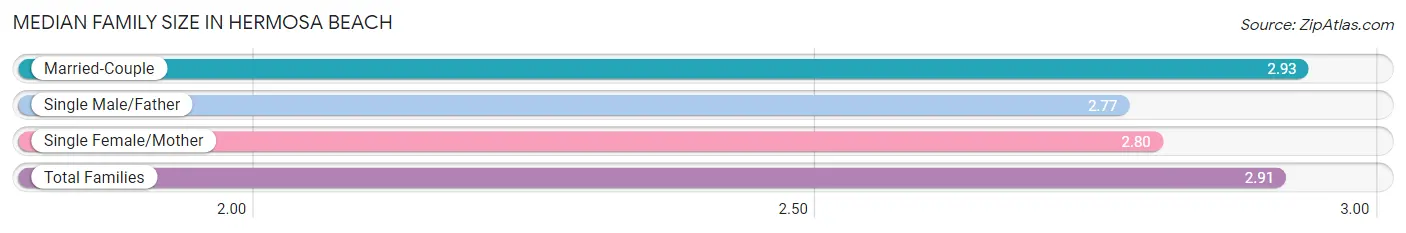
The median family size in Hermosa Beach is 2.91 persons per family, with married-couple families (3,791 | 84.0%) accounting for the largest median family size of 2.93 persons per family. On the other hand, single male/father families (261 | 5.8%) represent the smallest median family size with 2.77 persons per family.
| Family Type | # Families | Family Size |
| Married-Couple | 3,791 (84.0%) | 2.93 |
| Single Male/Father | 261 (5.8%) | 2.77 |
| Single Female/Mother | 464 (10.3%) | 2.80 |
| Total Families | 4,516 (100.0%) | 2.91 |
Median Household Size in Hermosa Beach
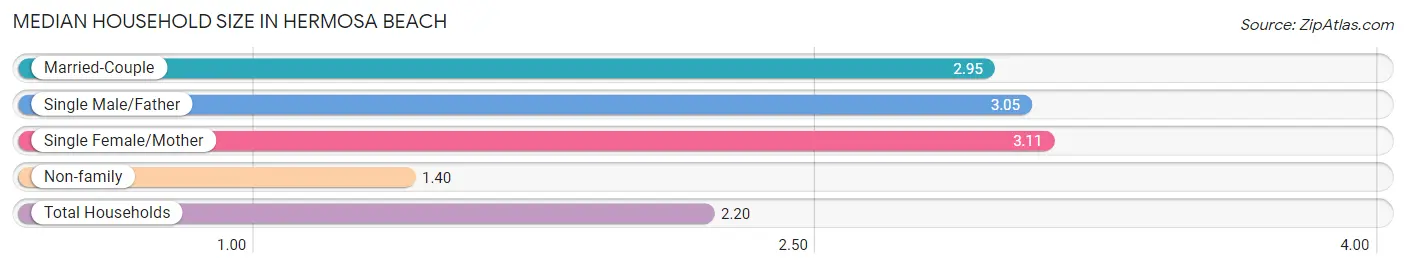
The median household size in Hermosa Beach is 2.20 persons per household, with single female/mother households (464 | 5.2%) accounting for the largest median household size of 3.11 persons per household. non-family households (4,366 | 49.2%) represent the smallest median household size with 1.40 persons per household.
| Household Type | # Households | Household Size |
| Married-Couple | 3,791 (42.7%) | 2.95 |
| Single Male/Father | 261 (2.9%) | 3.05 |
| Single Female/Mother | 464 (5.2%) | 3.11 |
| Non-family | 4,366 (49.2%) | 1.40 |
| Total Households | 8,882 (100.0%) | 2.20 |
Household Size by Marriage Status in Hermosa Beach
Out of a total of 8,882 households in Hermosa Beach, 4,516 (50.8%) are family households, while 4,366 (49.2%) are nonfamily households. The most numerous type of family households are 2-person households, comprising 2,287, and the most common type of nonfamily households are 1-person households, comprising 3,075.
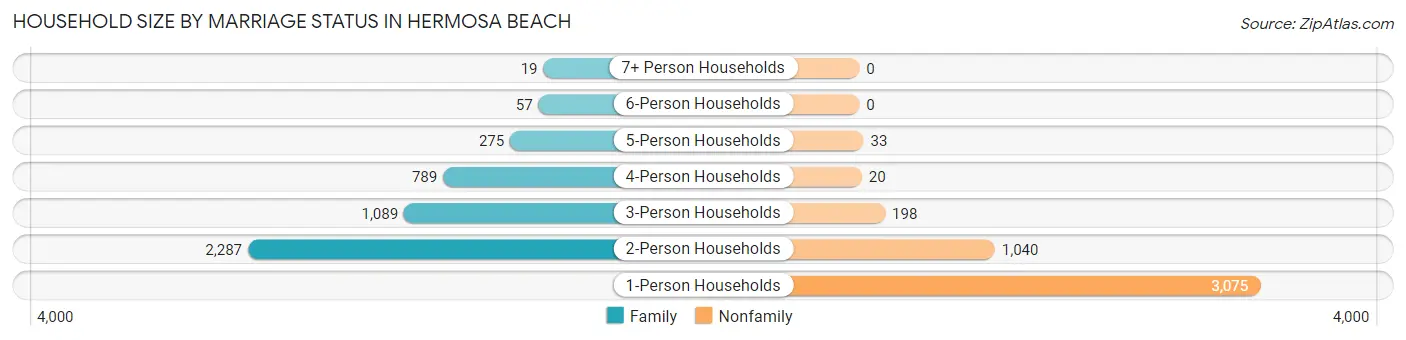
| Household Size | Family Households | Nonfamily Households |
| 1-Person Households | - | 3,075 (34.6%) |
| 2-Person Households | 2,287 (25.8%) | 1,040 (11.7%) |
| 3-Person Households | 1,089 (12.3%) | 198 (2.2%) |
| 4-Person Households | 789 (8.9%) | 20 (0.2%) |
| 5-Person Households | 275 (3.1%) | 33 (0.4%) |
| 6-Person Households | 57 (0.6%) | 0 (0.0%) |
| 7+ Person Households | 19 (0.2%) | 0 (0.0%) |
| Total | 4,516 (50.8%) | 4,366 (49.2%) |
Female Fertility in Hermosa Beach
Fertility by Age in Hermosa Beach
Average fertility rate in Hermosa Beach is 35.0 births per 1,000 women. Women in the age bracket of 20 to 34 years have the highest fertility rate with 40.0 births per 1,000 women. Women in the age bracket of 35 to 50 years acount for 50.6% of all women with births.
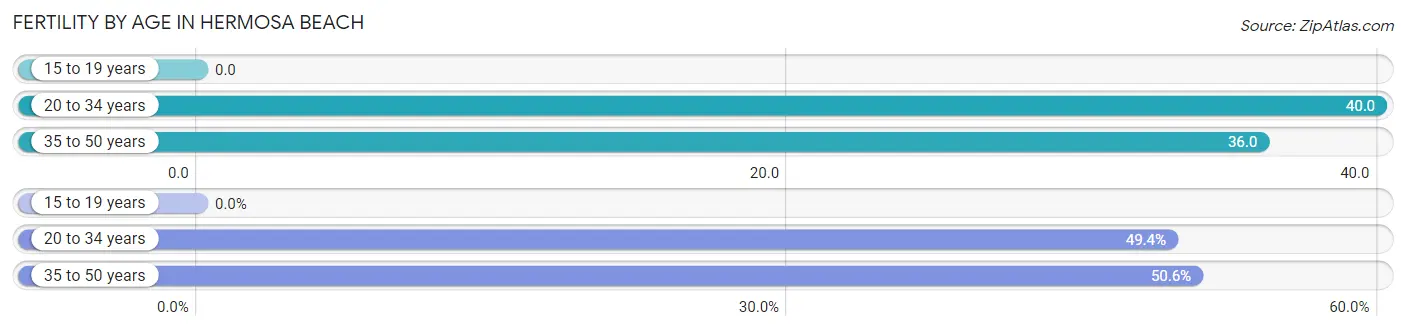
| Age Bracket | Women with Births | Births / 1,000 Women |
| 15 to 19 years | 0 (0.0%) | 0.0 |
| 20 to 34 years | 77 (49.4%) | 40.0 |
| 35 to 50 years | 79 (50.6%) | 36.0 |
| Total | 156 (100.0%) | 35.0 |
Fertility by Age by Marriage Status in Hermosa Beach
54.5% of women with births (156) in Hermosa Beach are married. The highest percentage of unmarried women with births falls into 20 to 34 years age bracket with 81.8% of them unmarried at the time of birth, while the lowest percentage of unmarried women with births belong to 35 to 50 years age bracket with 10.1% of them unmarried.
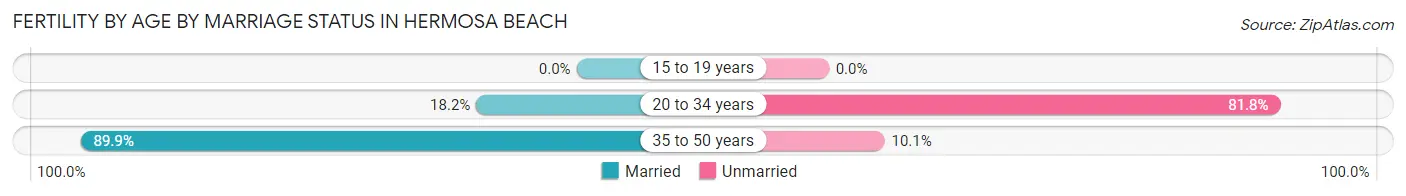
| Age Bracket | Married | Unmarried |
| 15 to 19 years | 0 (0.0%) | 0 (0.0%) |
| 20 to 34 years | 14 (18.2%) | 63 (81.8%) |
| 35 to 50 years | 71 (89.9%) | 8 (10.1%) |
| Total | 85 (54.5%) | 71 (45.5%) |
Fertility by Education in Hermosa Beach
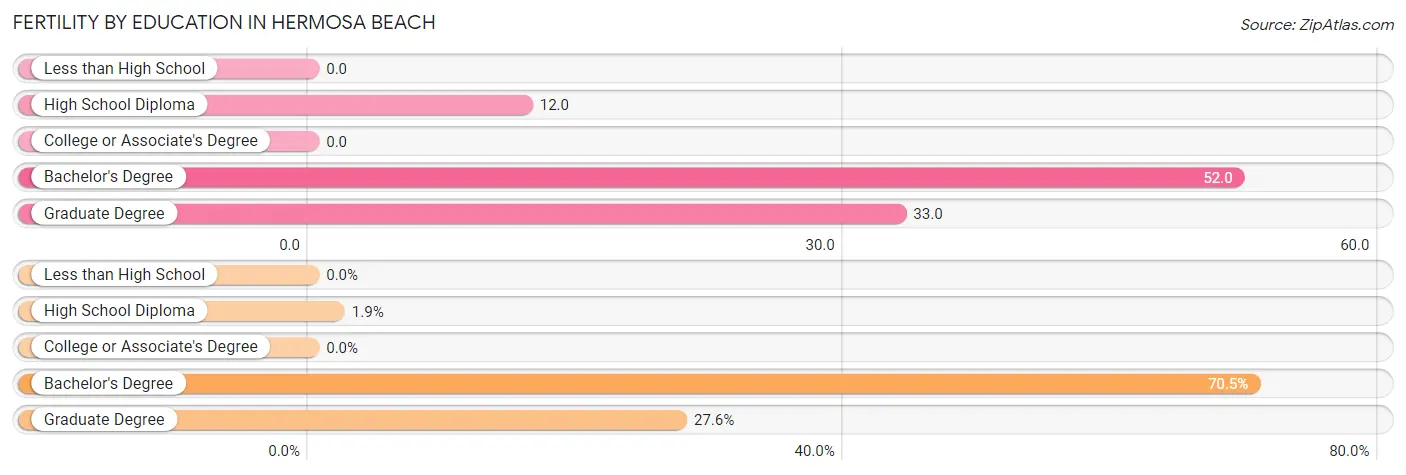
| Educational Attainment | Women with Births | Births / 1,000 Women |
| Less than High School | 0 (0.0%) | 0.0 |
| High School Diploma | 3 (1.9%) | 12.0 |
| College or Associate's Degree | 0 (0.0%) | 0.0 |
| Bachelor's Degree | 110 (70.5%) | 52.0 |
| Graduate Degree | 43 (27.6%) | 33.0 |
| Total | 156 (100.0%) | 35.0 |
Fertility by Education by Marriage Status in Hermosa Beach
45.5% of women with births in Hermosa Beach are unmarried. Women with the educational attainment of high school diploma are most likely to be married with 100.0% of them married at childbirth, while women with the educational attainment of bachelor's degree are least likely to be married with 64.5% of them unmarried at childbirth.
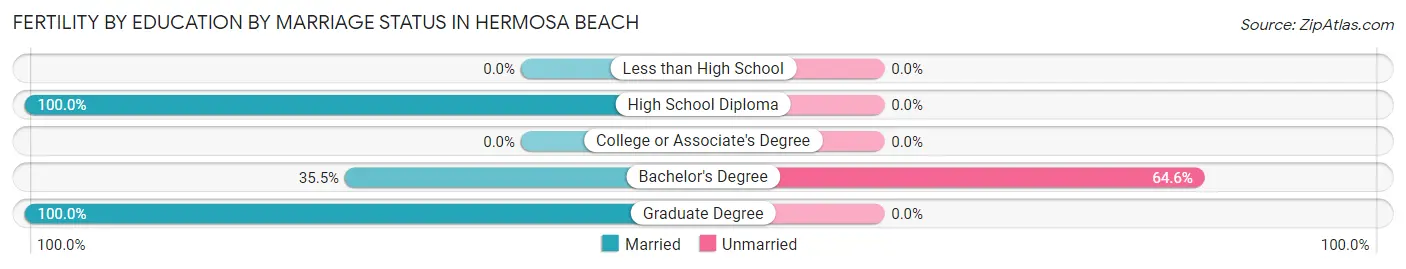
| Educational Attainment | Married | Unmarried |
| Less than High School | 0 (0.0%) | 0 (0.0%) |
| High School Diploma | 3 (100.0%) | 0 (0.0%) |
| College or Associate's Degree | 0 (0.0%) | 0 (0.0%) |
| Bachelor's Degree | 39 (35.4%) | 71 (64.5%) |
| Graduate Degree | 43 (100.0%) | 0 (0.0%) |
| Total | 85 (54.5%) | 71 (45.5%) |
Employment Characteristics in Hermosa Beach
Employment by Class of Employer in Hermosa Beach
Among the 10,757 employed individuals in Hermosa Beach, private company employees (7,608 | 70.7%), self-employed (incorporated) (842 | 7.8%), and not-for-profit organizations (704 | 6.5%) make up the most common classes of employment.
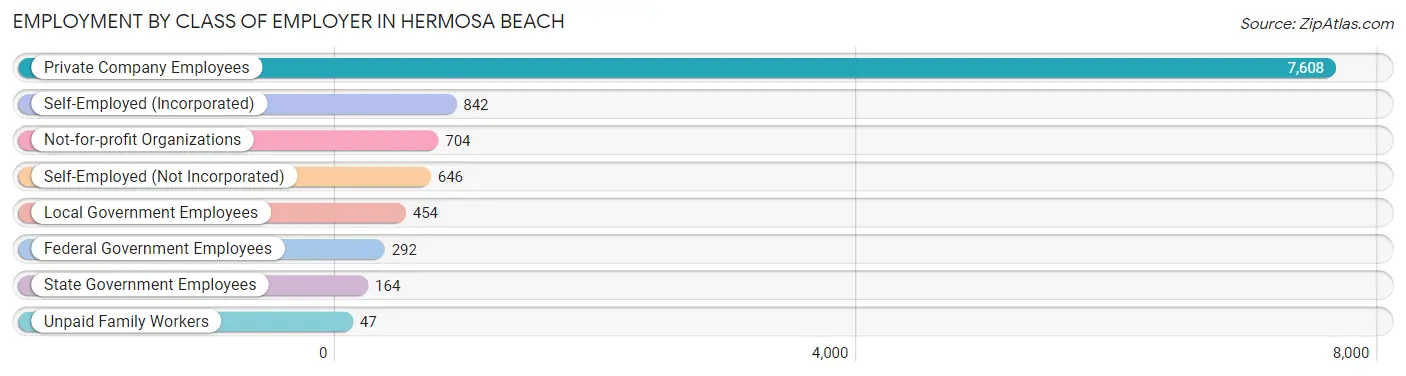
| Employer Class | # Employees | % Employees |
| Private Company Employees | 7,608 | 70.7% |
| Self-Employed (Incorporated) | 842 | 7.8% |
| Self-Employed (Not Incorporated) | 646 | 6.0% |
| Not-for-profit Organizations | 704 | 6.5% |
| Local Government Employees | 454 | 4.2% |
| State Government Employees | 164 | 1.5% |
| Federal Government Employees | 292 | 2.7% |
| Unpaid Family Workers | 47 | 0.4% |
| Total | 10,757 | 100.0% |
Employment Status by Age in Hermosa Beach
According to the labor force statistics for Hermosa Beach, out of the total population over 16 years of age (16,311), 71.1% or 11,597 individuals are in the labor force, with 4.9% or 568 of them unemployed. The age group with the highest labor force participation rate is 30 to 34 years, with 99.2% or 2,000 individuals in the labor force. Within the labor force, the 16 to 19 years age range has the highest percentage of unemployed individuals, with 22.6% or 45 of them being unemployed.
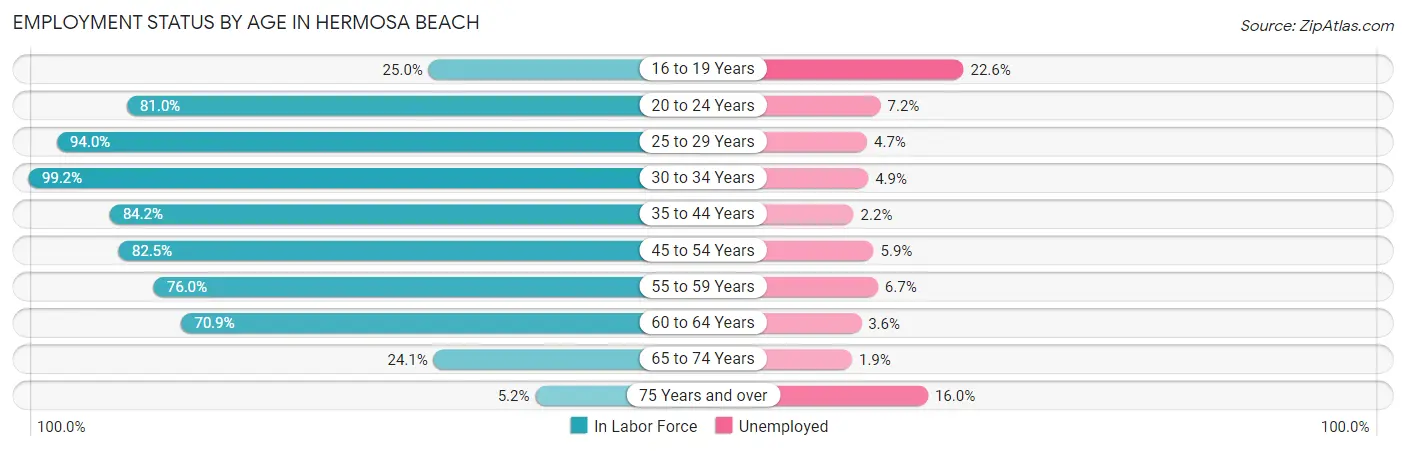
| Age Bracket | In Labor Force | Unemployed |
| 16 to 19 Years | 199 (25.0%) | 45 (22.6%) |
| 20 to 24 Years | 414 (81.0%) | 30 (7.2%) |
| 25 to 29 Years | 1,882 (94.0%) | 88 (4.7%) |
| 30 to 34 Years | 2,000 (99.2%) | 98 (4.9%) |
| 35 to 44 Years | 2,267 (84.2%) | 50 (2.2%) |
| 45 to 54 Years | 2,435 (82.5%) | 144 (5.9%) |
| 55 to 59 Years | 1,110 (76.0%) | 74 (6.7%) |
| 60 to 64 Years | 810 (70.9%) | 29 (3.6%) |
| 65 to 74 Years | 428 (24.1%) | 8 (1.9%) |
| 75 Years and over | 50 (5.2%) | 8 (16.0%) |
| Total | 11,597 (71.1%) | 568 (4.9%) |
Employment Status by Educational Attainment in Hermosa Beach
According to labor force statistics for Hermosa Beach, 85.6% of individuals (10,499) out of the total population between 25 and 64 years of age (12,265) are in the labor force, with 4.6% or 483 of them being unemployed. The group with the highest labor force participation rate are those with the educational attainment of less than high school, with 91.6% or 87 individuals in the labor force. Within the labor force, individuals with college / associate degree education have the highest percentage of unemployment, with 5.1% or 61 of them being unemployed.
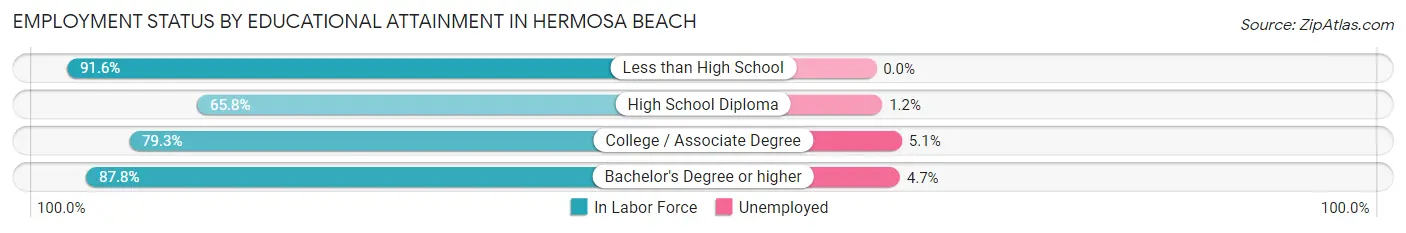
| Educational Attainment | In Labor Force | Unemployed |
| Less than High School | 87 (91.6%) | 0 (0.0%) |
| High School Diploma | 420 (65.8%) | 8 (1.2%) |
| College / Associate Degree | 1,205 (79.3%) | 77 (5.1%) |
| Bachelor's Degree or higher | 8,791 (87.8%) | 471 (4.7%) |
| Total | 10,499 (85.6%) | 564 (4.6%) |
Employment Occupations by Sex in Hermosa Beach
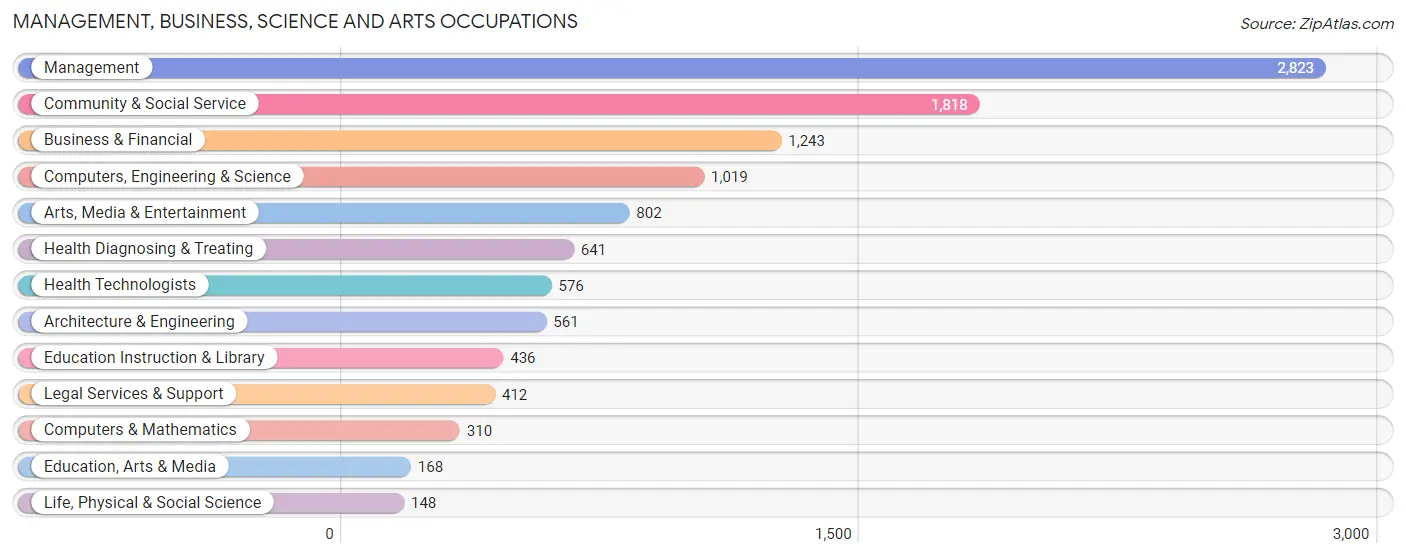
Management, Business, Science and Arts Occupations
The most common Management, Business, Science and Arts occupations in Hermosa Beach are Management (2,823 | 25.9%), Community & Social Service (1,818 | 16.7%), Business & Financial (1,243 | 11.4%), Computers, Engineering & Science (1,019 | 9.3%), and Arts, Media & Entertainment (802 | 7.3%).
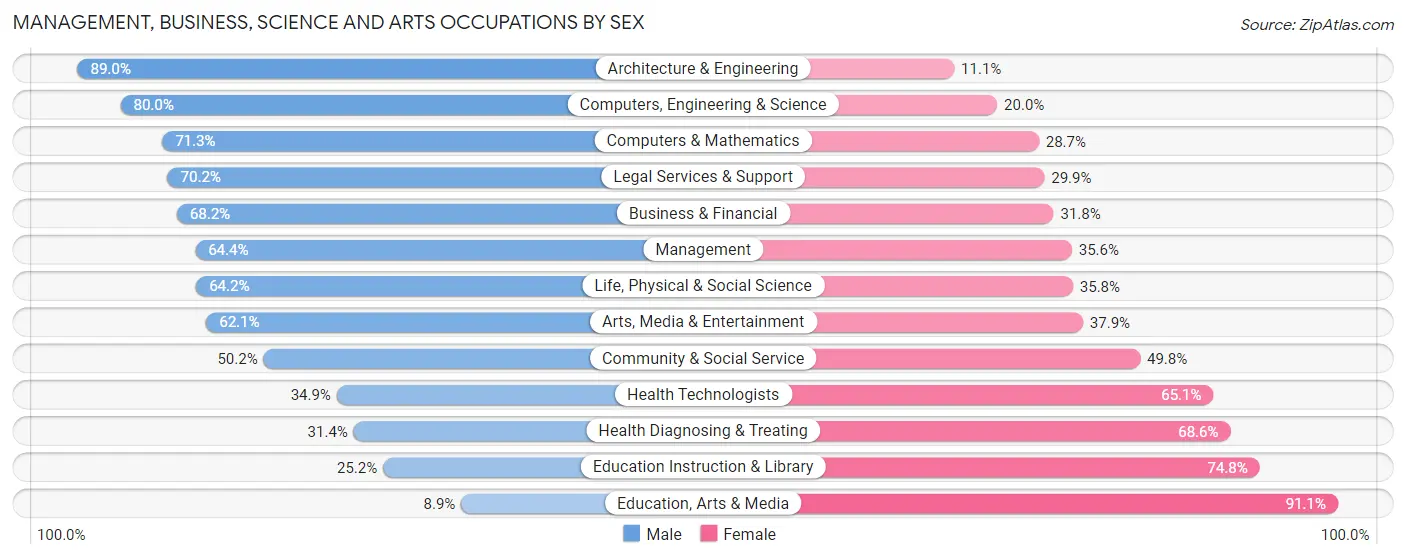
Management, Business, Science and Arts Occupations by Sex
Within the Management, Business, Science and Arts occupations in Hermosa Beach, the most male-oriented occupations are Architecture & Engineering (88.9%), Computers, Engineering & Science (80.0%), and Computers & Mathematics (71.3%), while the most female-oriented occupations are Education, Arts & Media (91.1%), Education Instruction & Library (74.8%), and Health Diagnosing & Treating (68.6%).
| Occupation | Male | Female |
| Management | 1,818 (64.4%) | 1,005 (35.6%) |
| Business & Financial | 848 (68.2%) | 395 (31.8%) |
| Computers, Engineering & Science | 815 (80.0%) | 204 (20.0%) |
| Computers & Mathematics | 221 (71.3%) | 89 (28.7%) |
| Architecture & Engineering | 499 (88.9%) | 62 (11.1%) |
| Life, Physical & Social Science | 95 (64.2%) | 53 (35.8%) |
| Community & Social Service | 912 (50.2%) | 906 (49.8%) |
| Education, Arts & Media | 15 (8.9%) | 153 (91.1%) |
| Legal Services & Support | 289 (70.2%) | 123 (29.8%) |
| Education Instruction & Library | 110 (25.2%) | 326 (74.8%) |
| Arts, Media & Entertainment | 498 (62.1%) | 304 (37.9%) |
| Health Diagnosing & Treating | 201 (31.4%) | 440 (68.6%) |
| Health Technologists | 201 (34.9%) | 375 (65.1%) |
| Total (Category) | 4,594 (60.9%) | 2,950 (39.1%) |
| Total (Overall) | 6,421 (58.8%) | 4,491 (41.2%) |
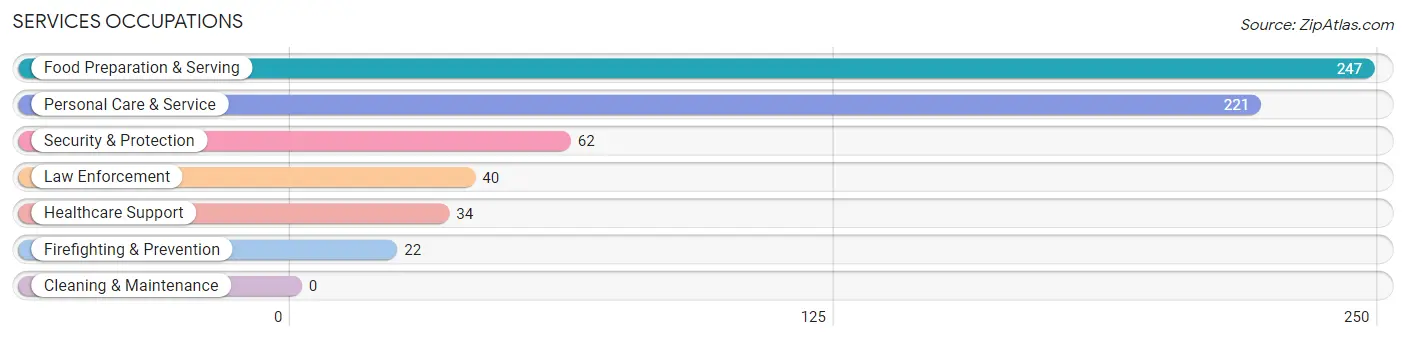
Services Occupations
The most common Services occupations in Hermosa Beach are Food Preparation & Serving (247 | 2.3%), Personal Care & Service (221 | 2.0%), Security & Protection (62 | 0.6%), Law Enforcement (40 | 0.4%), and Healthcare Support (34 | 0.3%).
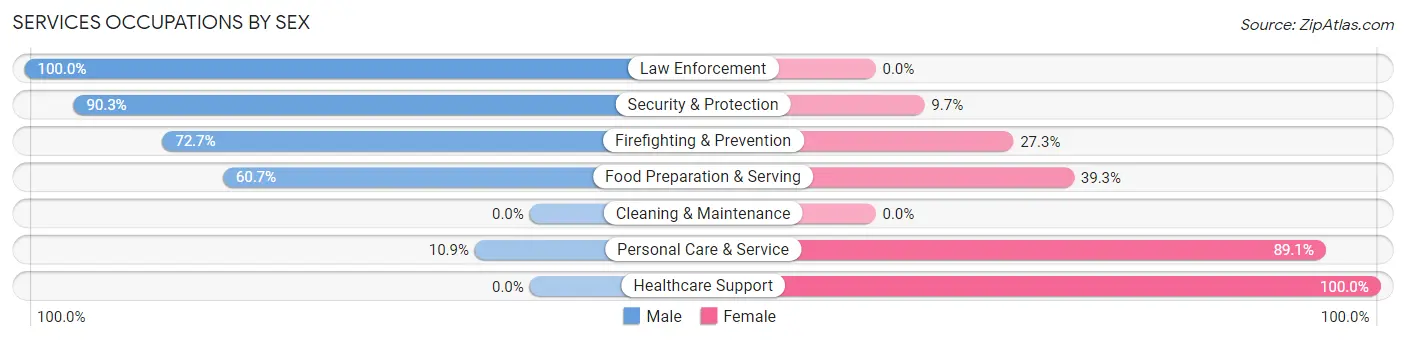
Services Occupations by Sex
Within the Services occupations in Hermosa Beach, the most male-oriented occupations are Law Enforcement (100.0%), Security & Protection (90.3%), and Firefighting & Prevention (72.7%), while the most female-oriented occupations are Healthcare Support (100.0%), Personal Care & Service (89.1%), and Food Preparation & Serving (39.3%).
| Occupation | Male | Female |
| Healthcare Support | 0 (0.0%) | 34 (100.0%) |
| Security & Protection | 56 (90.3%) | 6 (9.7%) |
| Firefighting & Prevention | 16 (72.7%) | 6 (27.3%) |
| Law Enforcement | 40 (100.0%) | 0 (0.0%) |
| Food Preparation & Serving | 150 (60.7%) | 97 (39.3%) |
| Cleaning & Maintenance | 0 (0.0%) | 0 (0.0%) |
| Personal Care & Service | 24 (10.9%) | 197 (89.1%) |
| Total (Category) | 230 (40.8%) | 334 (59.2%) |
| Total (Overall) | 6,421 (58.8%) | 4,491 (41.2%) |
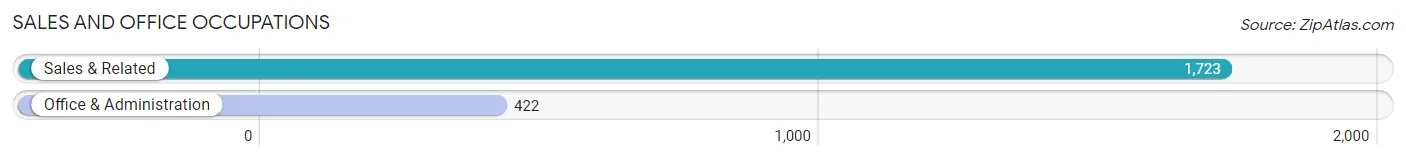
Sales and Office Occupations
The most common Sales and Office occupations in Hermosa Beach are Sales & Related (1,723 | 15.8%), and Office & Administration (422 | 3.9%).
Sales and Office Occupations by Sex
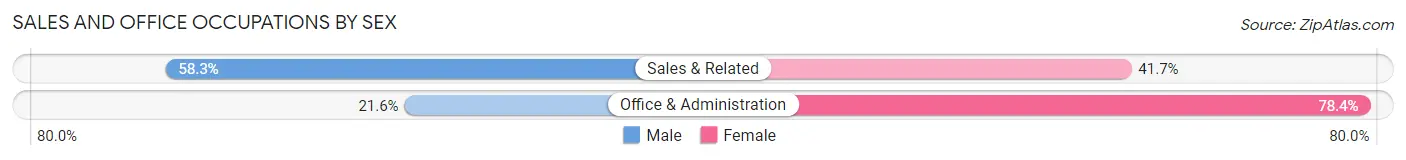
| Occupation | Male | Female |
| Sales & Related | 1,005 (58.3%) | 718 (41.7%) |
| Office & Administration | 91 (21.6%) | 331 (78.4%) |
| Total (Category) | 1,096 (51.1%) | 1,049 (48.9%) |
| Total (Overall) | 6,421 (58.8%) | 4,491 (41.2%) |
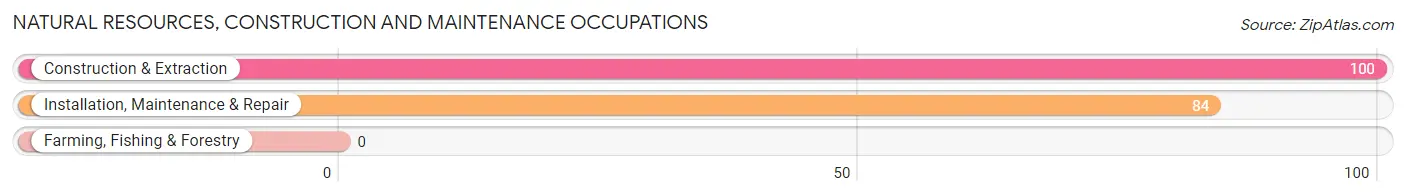
Natural Resources, Construction and Maintenance Occupations
The most common Natural Resources, Construction and Maintenance occupations in Hermosa Beach are Construction & Extraction (100 | 0.9%), and Installation, Maintenance & Repair (84 | 0.8%).
Natural Resources, Construction and Maintenance Occupations by Sex
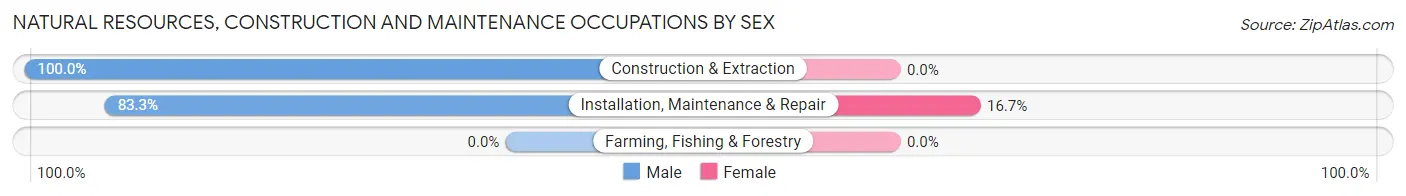
| Occupation | Male | Female |
| Farming, Fishing & Forestry | 0 (0.0%) | 0 (0.0%) |
| Construction & Extraction | 100 (100.0%) | 0 (0.0%) |
| Installation, Maintenance & Repair | 70 (83.3%) | 14 (16.7%) |
| Total (Category) | 170 (92.4%) | 14 (7.6%) |
| Total (Overall) | 6,421 (58.8%) | 4,491 (41.2%) |
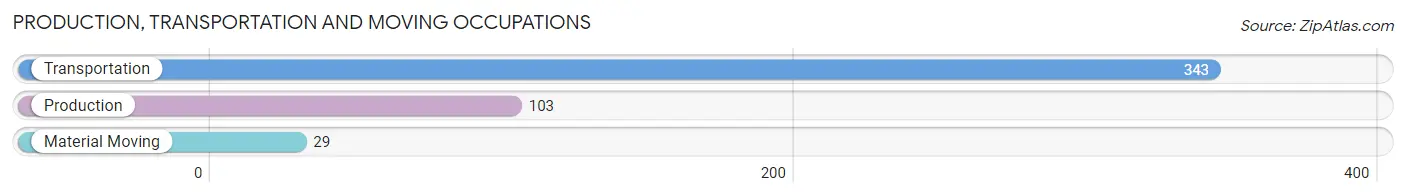
Production, Transportation and Moving Occupations
The most common Production, Transportation and Moving occupations in Hermosa Beach are Transportation (343 | 3.1%), Production (103 | 0.9%), and Material Moving (29 | 0.3%).
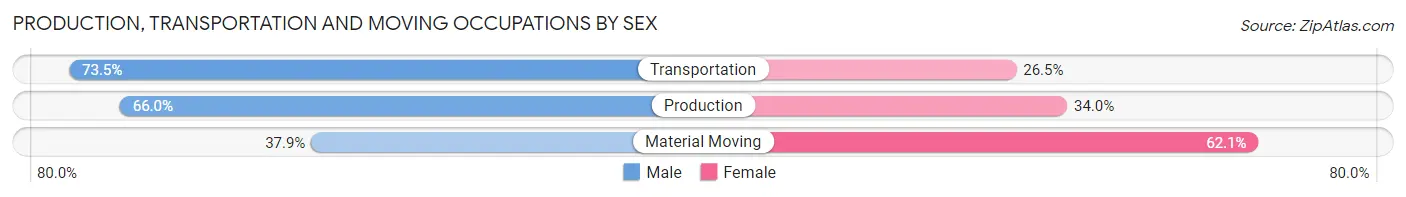
Production, Transportation and Moving Occupations by Sex
| Occupation | Male | Female |
| Production | 68 (66.0%) | 35 (34.0%) |
| Transportation | 252 (73.5%) | 91 (26.5%) |
| Material Moving | 11 (37.9%) | 18 (62.1%) |
| Total (Category) | 331 (69.7%) | 144 (30.3%) |
| Total (Overall) | 6,421 (58.8%) | 4,491 (41.2%) |
Employment Industries by Sex in Hermosa Beach
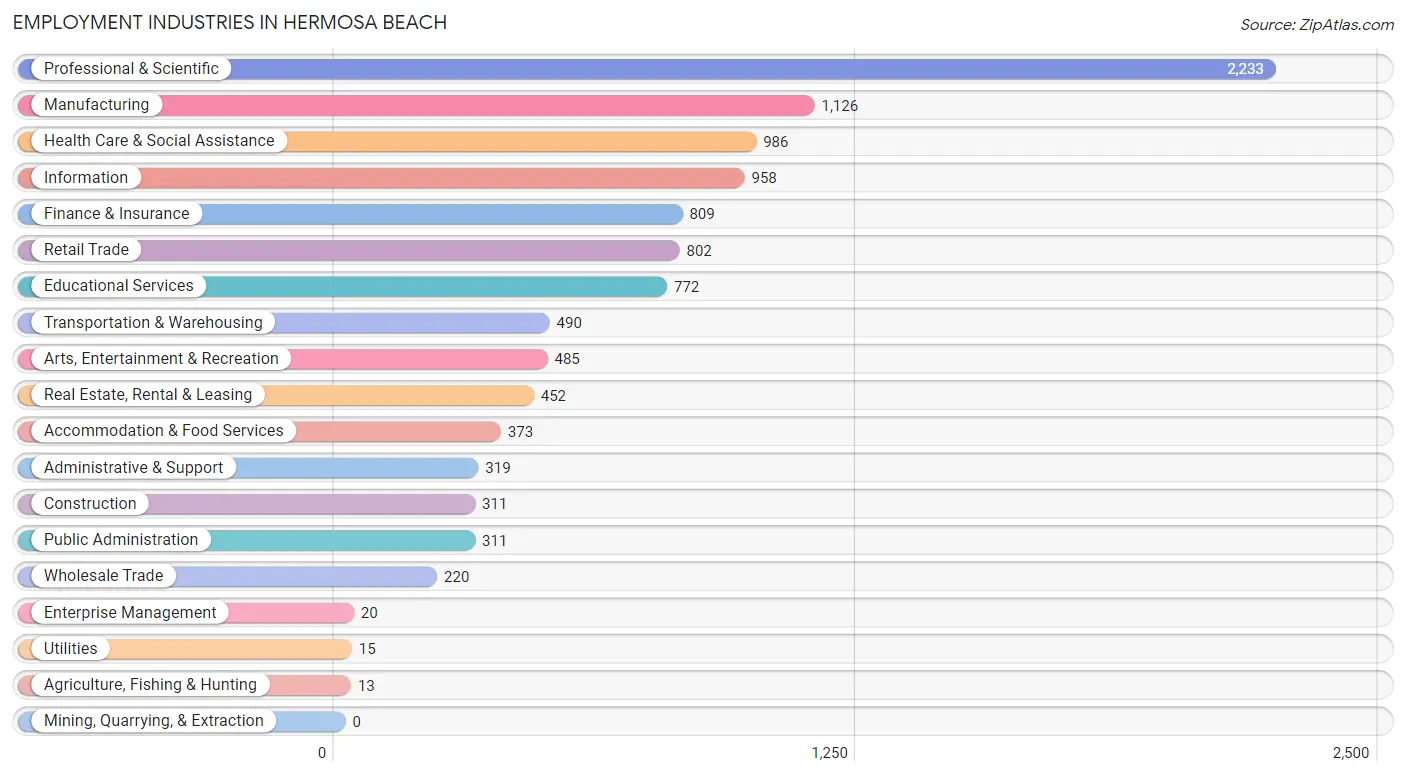
Employment Industries in Hermosa Beach
The major employment industries in Hermosa Beach include Professional & Scientific (2,233 | 20.5%), Manufacturing (1,126 | 10.3%), Health Care & Social Assistance (986 | 9.0%), Information (958 | 8.8%), and Finance & Insurance (809 | 7.4%).
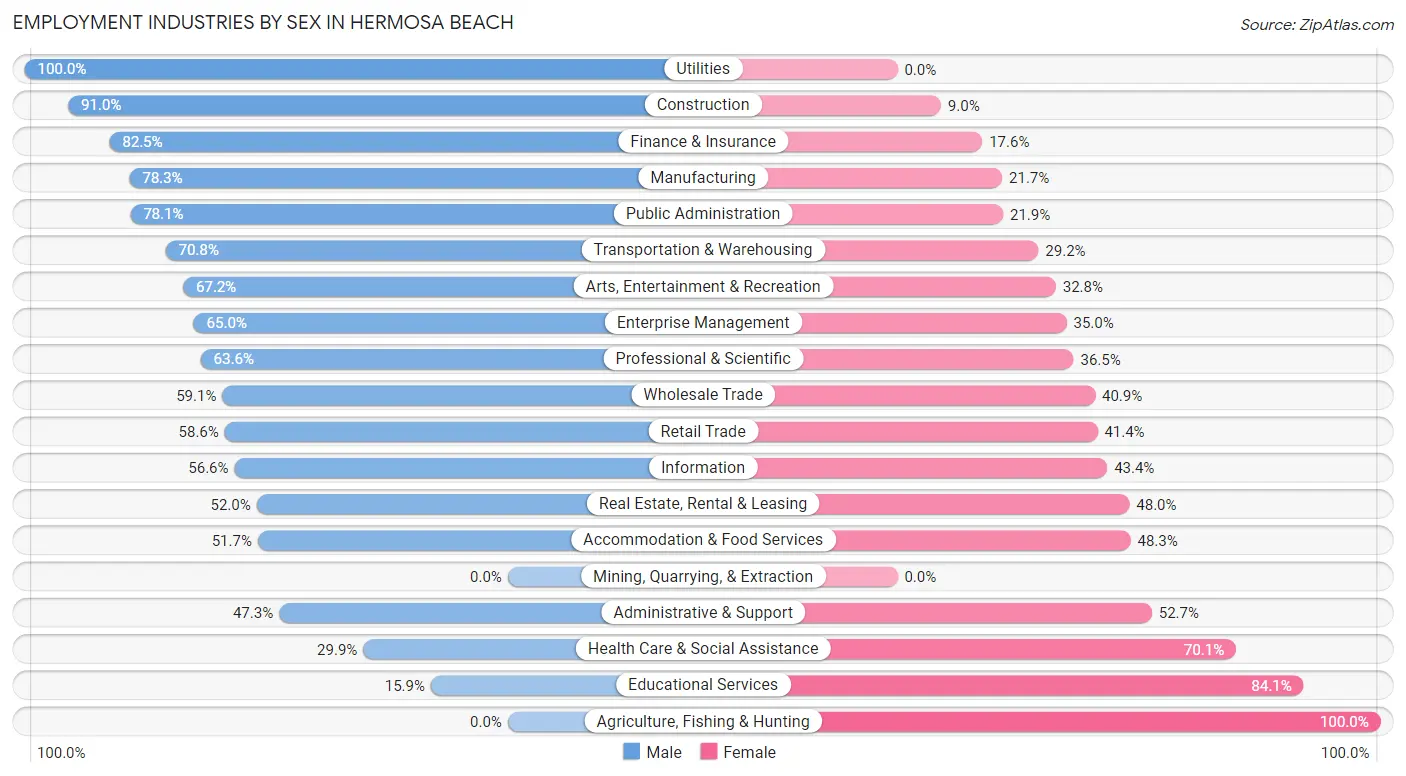
Employment Industries by Sex in Hermosa Beach
The Hermosa Beach industries that see more men than women are Utilities (100.0%), Construction (91.0%), and Finance & Insurance (82.5%), whereas the industries that tend to have a higher number of women are Agriculture, Fishing & Hunting (100.0%), Educational Services (84.1%), and Health Care & Social Assistance (70.1%).
| Industry | Male | Female |
| Agriculture, Fishing & Hunting | 0 (0.0%) | 13 (100.0%) |
| Mining, Quarrying, & Extraction | 0 (0.0%) | 0 (0.0%) |
| Construction | 283 (91.0%) | 28 (9.0%) |
| Manufacturing | 882 (78.3%) | 244 (21.7%) |
| Wholesale Trade | 130 (59.1%) | 90 (40.9%) |
| Retail Trade | 470 (58.6%) | 332 (41.4%) |
| Transportation & Warehousing | 347 (70.8%) | 143 (29.2%) |
| Utilities | 15 (100.0%) | 0 (0.0%) |
| Information | 542 (56.6%) | 416 (43.4%) |
| Finance & Insurance | 667 (82.5%) | 142 (17.5%) |
| Real Estate, Rental & Leasing | 235 (52.0%) | 217 (48.0%) |
| Professional & Scientific | 1,419 (63.5%) | 814 (36.4%) |
| Enterprise Management | 13 (65.0%) | 7 (35.0%) |
| Administrative & Support | 151 (47.3%) | 168 (52.7%) |
| Educational Services | 123 (15.9%) | 649 (84.1%) |
| Health Care & Social Assistance | 295 (29.9%) | 691 (70.1%) |
| Arts, Entertainment & Recreation | 326 (67.2%) | 159 (32.8%) |
| Accommodation & Food Services | 193 (51.7%) | 180 (48.3%) |
| Public Administration | 243 (78.1%) | 68 (21.9%) |
| Total | 6,421 (58.8%) | 4,491 (41.2%) |
Education in Hermosa Beach
School Enrollment in Hermosa Beach
The most common levels of schooling among the 3,690 students in Hermosa Beach are high school (854 | 23.1%), middle school (820 | 22.2%), and elementary school (710 | 19.2%).
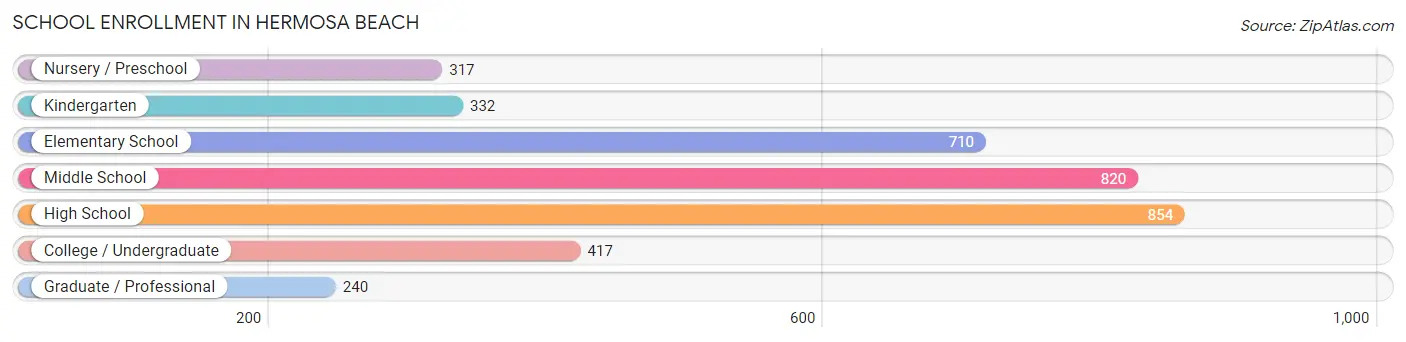
| School Level | # Students | % Students |
| Nursery / Preschool | 317 | 8.6% |
| Kindergarten | 332 | 9.0% |
| Elementary School | 710 | 19.2% |
| Middle School | 820 | 22.2% |
| High School | 854 | 23.1% |
| College / Undergraduate | 417 | 11.3% |
| Graduate / Professional | 240 | 6.5% |
| Total | 3,690 | 100.0% |
School Enrollment by Age by Funding Source in Hermosa Beach
Out of a total of 3,690 students who are enrolled in schools in Hermosa Beach, 948 (25.7%) attend a private institution, while the remaining 2,742 (74.3%) are enrolled in public schools. The age group of 3 to 4 year olds has the highest likelihood of being enrolled in private schools, with 290 (95.1% in the age bracket) enrolled. Conversely, the age group of 15 to 17 year olds has the lowest likelihood of being enrolled in a private school, with 633 (89.3% in the age bracket) attending a public institution.
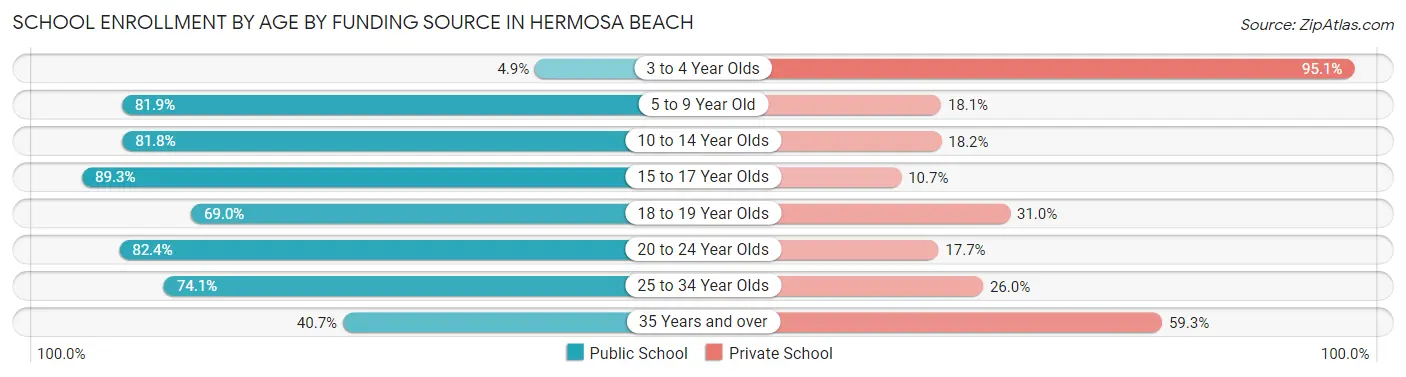
| Age Bracket | Public School | Private School |
| 3 to 4 Year Olds | 15 (4.9%) | 290 (95.1%) |
| 5 to 9 Year Old | 818 (81.9%) | 181 (18.1%) |
| 10 to 14 Year Olds | 737 (81.8%) | 164 (18.2%) |
| 15 to 17 Year Olds | 633 (89.3%) | 76 (10.7%) |
| 18 to 19 Year Olds | 147 (69.0%) | 66 (31.0%) |
| 20 to 24 Year Olds | 196 (82.4%) | 42 (17.6%) |
| 25 to 34 Year Olds | 137 (74.1%) | 48 (26.0%) |
| 35 Years and over | 57 (40.7%) | 83 (59.3%) |
| Total | 2,742 (74.3%) | 948 (25.7%) |
Educational Attainment by Field of Study in Hermosa Beach
Business (2,552 | 20.3%), social sciences (1,820 | 14.5%), engineering (1,440 | 11.5%), communications (1,145 | 9.1%), and visual & performing arts (976 | 7.8%) are the most common fields of study among 12,580 individuals in Hermosa Beach who have obtained a bachelor's degree or higher.
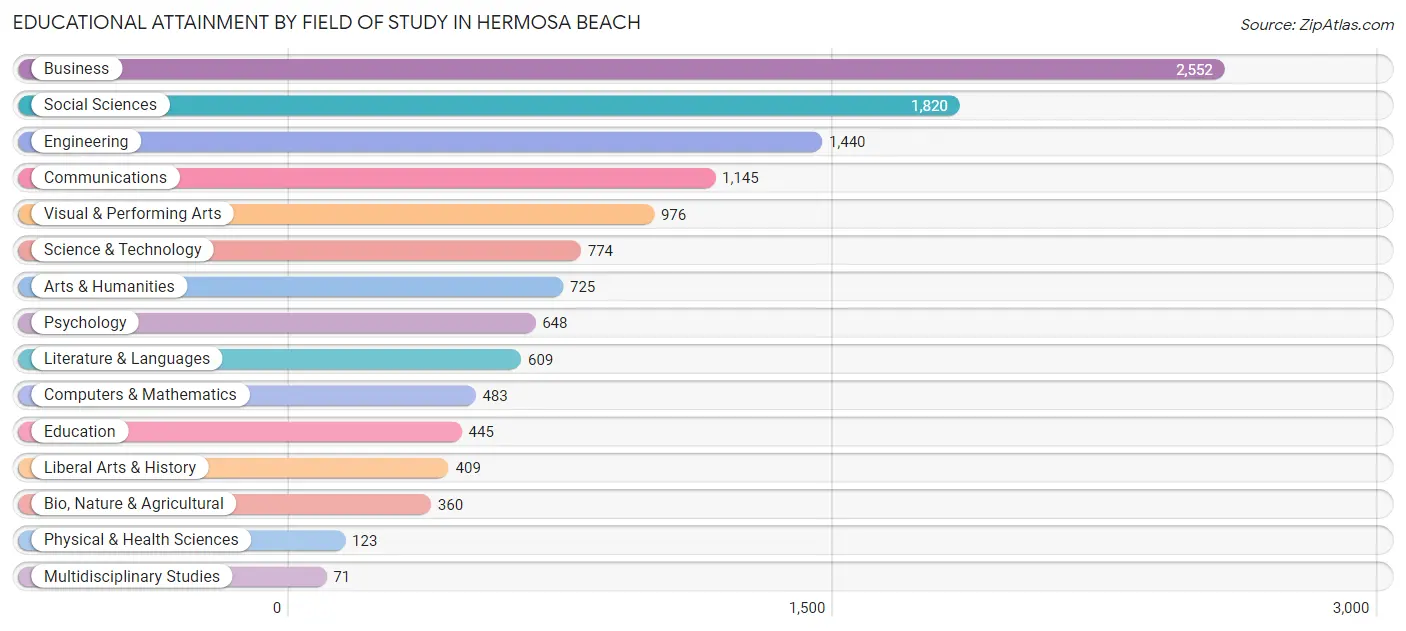
| Field of Study | # Graduates | % Graduates |
| Computers & Mathematics | 483 | 3.8% |
| Bio, Nature & Agricultural | 360 | 2.9% |
| Physical & Health Sciences | 123 | 1.0% |
| Psychology | 648 | 5.1% |
| Social Sciences | 1,820 | 14.5% |
| Engineering | 1,440 | 11.5% |
| Multidisciplinary Studies | 71 | 0.6% |
| Science & Technology | 774 | 6.1% |
| Business | 2,552 | 20.3% |
| Education | 445 | 3.5% |
| Literature & Languages | 609 | 4.8% |
| Liberal Arts & History | 409 | 3.3% |
| Visual & Performing Arts | 976 | 7.8% |
| Communications | 1,145 | 9.1% |
| Arts & Humanities | 725 | 5.8% |
| Total | 12,580 | 100.0% |
Transportation & Commute in Hermosa Beach
Vehicle Availability by Sex in Hermosa Beach
The most prevalent vehicle ownership categories in Hermosa Beach are males with 2 vehicles (3,024, accounting for 47.2%) and females with 2 vehicles (1,966, making up 69.6%).
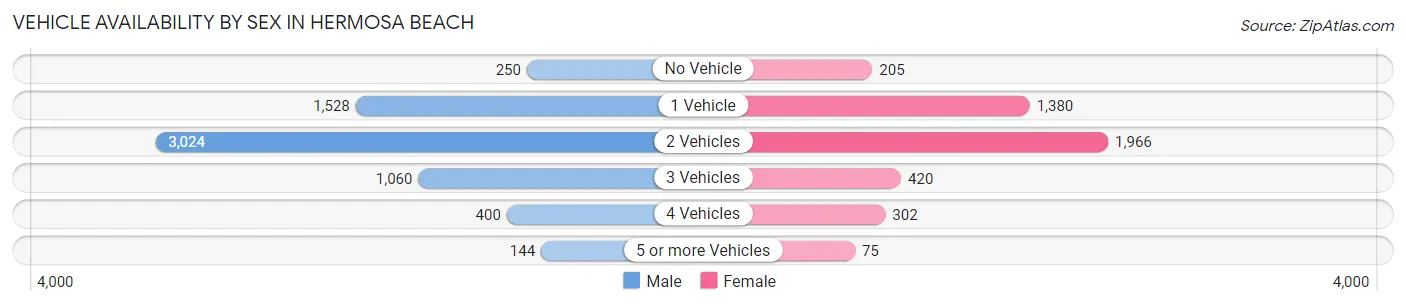
| Vehicles Available | Male | Female |
| No Vehicle | 250 (3.9%) | 205 (4.7%) |
| 1 Vehicle | 1,528 (23.8%) | 1,380 (31.7%) |
| 2 Vehicles | 3,024 (47.2%) | 1,966 (45.2%) |
| 3 Vehicles | 1,060 (16.6%) | 420 (9.7%) |
| 4 Vehicles | 400 (6.2%) | 302 (7.0%) |
| 5 or more Vehicles | 144 (2.2%) | 75 (1.7%) |
| Total | 6,406 (100.0%) | 4,348 (100.0%) |
Commute Time in Hermosa Beach
The most frequently occuring commute durations in Hermosa Beach are 20 to 24 minutes (1,048 commuters, 13.6%), 45 to 59 minutes (1,036 commuters, 13.4%), and 60 to 89 minutes (905 commuters, 11.7%).
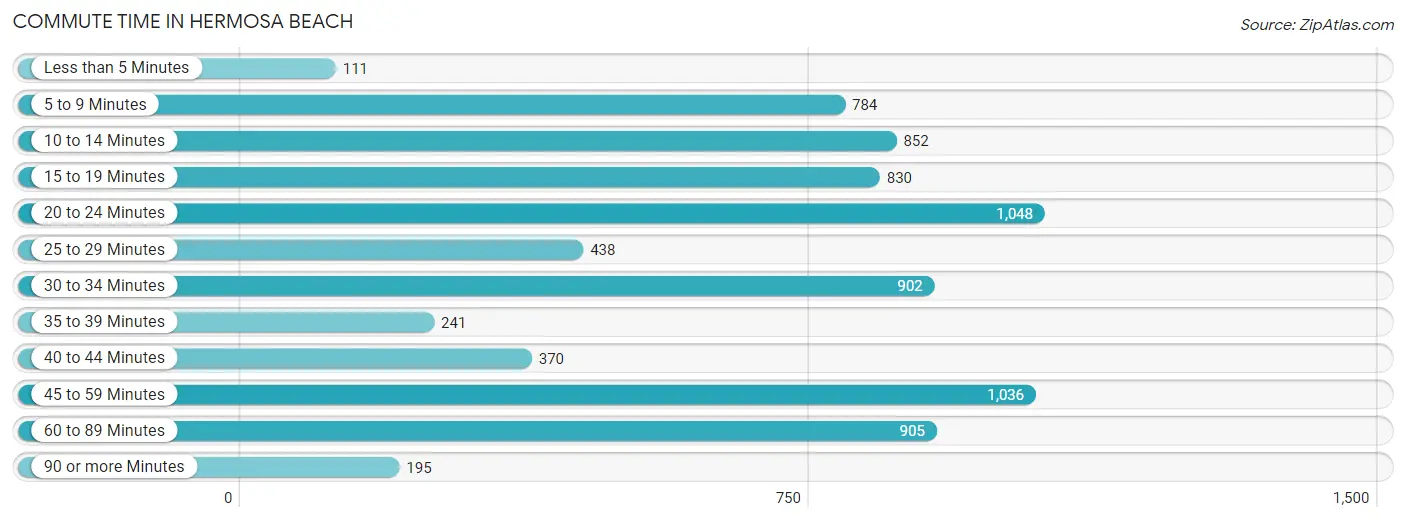
| Commute Time | # Commuters | % Commuters |
| Less than 5 Minutes | 111 | 1.4% |
| 5 to 9 Minutes | 784 | 10.2% |
| 10 to 14 Minutes | 852 | 11.1% |
| 15 to 19 Minutes | 830 | 10.8% |
| 20 to 24 Minutes | 1,048 | 13.6% |
| 25 to 29 Minutes | 438 | 5.7% |
| 30 to 34 Minutes | 902 | 11.7% |
| 35 to 39 Minutes | 241 | 3.1% |
| 40 to 44 Minutes | 370 | 4.8% |
| 45 to 59 Minutes | 1,036 | 13.4% |
| 60 to 89 Minutes | 905 | 11.7% |
| 90 or more Minutes | 195 | 2.5% |
Commute Time by Sex in Hermosa Beach
The most common commute times in Hermosa Beach are 20 to 24 minutes (833 commuters, 17.2%) for males and 60 to 89 minutes (433 commuters, 15.0%) for females.
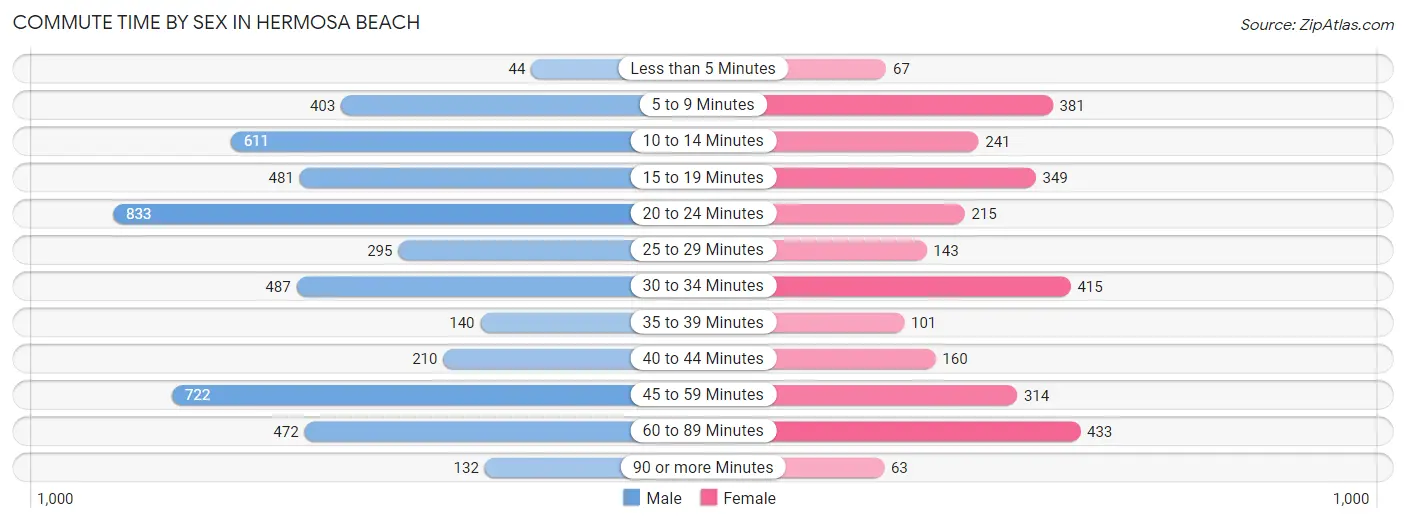
| Commute Time | Male | Female |
| Less than 5 Minutes | 44 (0.9%) | 67 (2.3%) |
| 5 to 9 Minutes | 403 (8.3%) | 381 (13.2%) |
| 10 to 14 Minutes | 611 (12.7%) | 241 (8.4%) |
| 15 to 19 Minutes | 481 (10.0%) | 349 (12.1%) |
| 20 to 24 Minutes | 833 (17.2%) | 215 (7.5%) |
| 25 to 29 Minutes | 295 (6.1%) | 143 (5.0%) |
| 30 to 34 Minutes | 487 (10.1%) | 415 (14.4%) |
| 35 to 39 Minutes | 140 (2.9%) | 101 (3.5%) |
| 40 to 44 Minutes | 210 (4.3%) | 160 (5.6%) |
| 45 to 59 Minutes | 722 (14.9%) | 314 (10.9%) |
| 60 to 89 Minutes | 472 (9.8%) | 433 (15.0%) |
| 90 or more Minutes | 132 (2.7%) | 63 (2.2%) |
Time of Departure to Work by Sex in Hermosa Beach
The most frequent times of departure to work in Hermosa Beach are 8:00 AM to 8:29 AM (830, 17.2%) for males and 9:00 AM to 9:59 AM (563, 19.5%) for females.
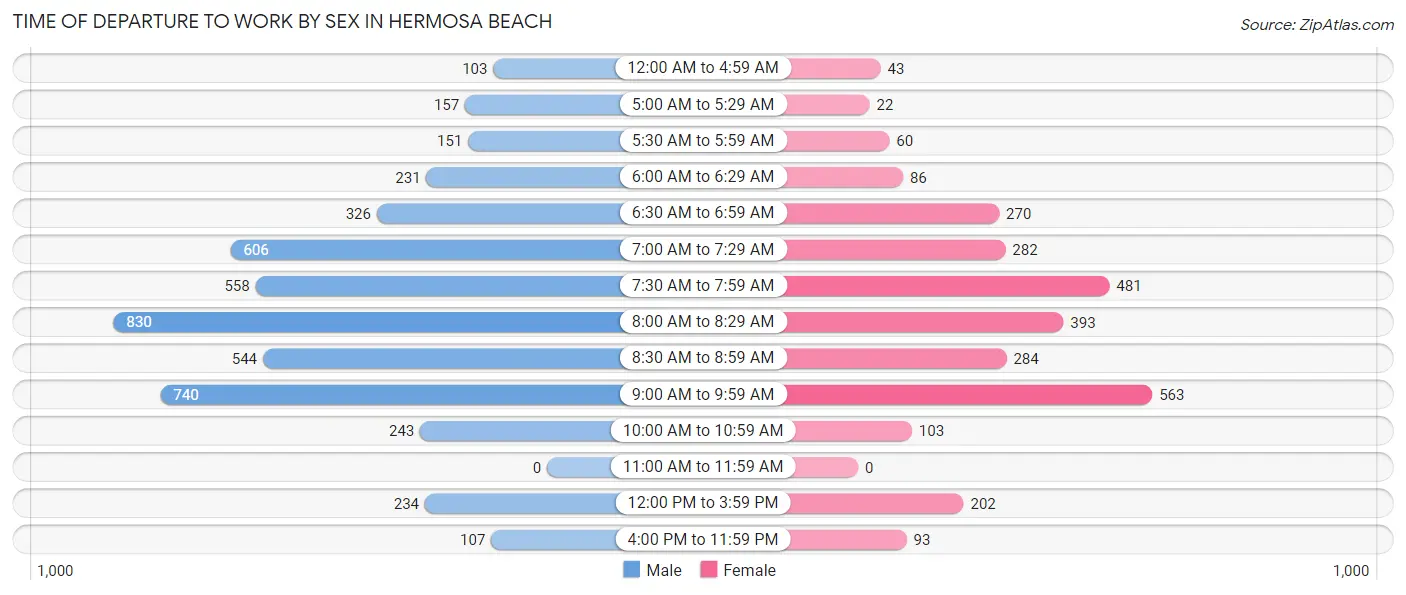
| Time of Departure | Male | Female |
| 12:00 AM to 4:59 AM | 103 (2.1%) | 43 (1.5%) |
| 5:00 AM to 5:29 AM | 157 (3.3%) | 22 (0.8%) |
| 5:30 AM to 5:59 AM | 151 (3.1%) | 60 (2.1%) |
| 6:00 AM to 6:29 AM | 231 (4.8%) | 86 (3.0%) |
| 6:30 AM to 6:59 AM | 326 (6.8%) | 270 (9.4%) |
| 7:00 AM to 7:29 AM | 606 (12.6%) | 282 (9.8%) |
| 7:30 AM to 7:59 AM | 558 (11.6%) | 481 (16.7%) |
| 8:00 AM to 8:29 AM | 830 (17.2%) | 393 (13.6%) |
| 8:30 AM to 8:59 AM | 544 (11.3%) | 284 (9.9%) |
| 9:00 AM to 9:59 AM | 740 (15.3%) | 563 (19.5%) |
| 10:00 AM to 10:59 AM | 243 (5.0%) | 103 (3.6%) |
| 11:00 AM to 11:59 AM | 0 (0.0%) | 0 (0.0%) |
| 12:00 PM to 3:59 PM | 234 (4.8%) | 202 (7.0%) |
| 4:00 PM to 11:59 PM | 107 (2.2%) | 93 (3.2%) |
| Total | 4,830 (100.0%) | 2,882 (100.0%) |
Housing Occupancy in Hermosa Beach
Occupancy by Ownership in Hermosa Beach
Of the total 8,882 dwellings in Hermosa Beach, owner-occupied units account for 4,564 (51.4%), while renter-occupied units make up 4,318 (48.6%).
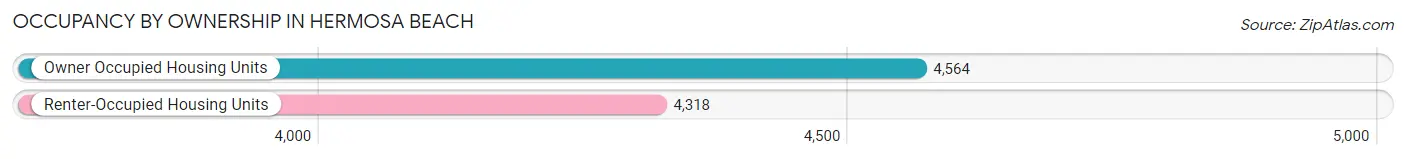
| Occupancy | # Housing Units | % Housing Units |
| Owner Occupied Housing Units | 4,564 | 51.4% |
| Renter-Occupied Housing Units | 4,318 | 48.6% |
| Total Occupied Housing Units | 8,882 | 100.0% |
Occupancy by Household Size in Hermosa Beach
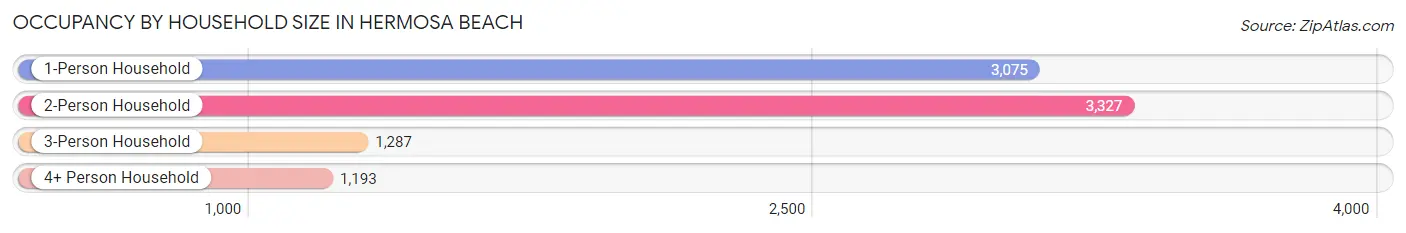
| Household Size | # Housing Units | % Housing Units |
| 1-Person Household | 3,075 | 34.6% |
| 2-Person Household | 3,327 | 37.5% |
| 3-Person Household | 1,287 | 14.5% |
| 4+ Person Household | 1,193 | 13.4% |
| Total Housing Units | 8,882 | 100.0% |
Occupancy by Ownership by Household Size in Hermosa Beach
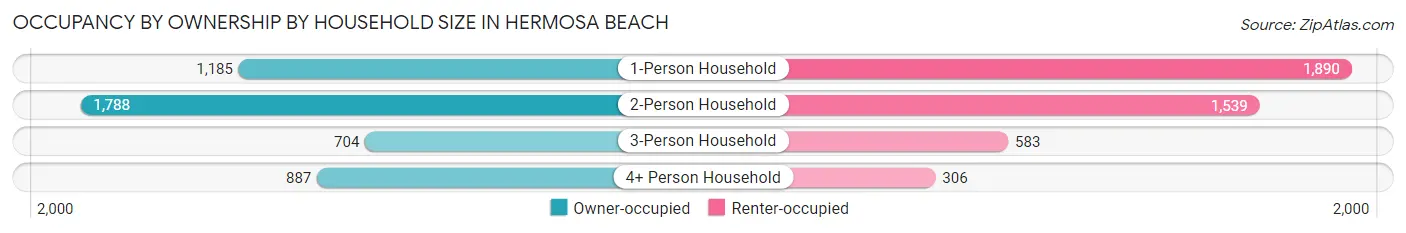
| Household Size | Owner-occupied | Renter-occupied |
| 1-Person Household | 1,185 (38.5%) | 1,890 (61.5%) |
| 2-Person Household | 1,788 (53.7%) | 1,539 (46.3%) |
| 3-Person Household | 704 (54.7%) | 583 (45.3%) |
| 4+ Person Household | 887 (74.4%) | 306 (25.7%) |
| Total Housing Units | 4,564 (51.4%) | 4,318 (48.6%) |
Occupancy by Educational Attainment in Hermosa Beach
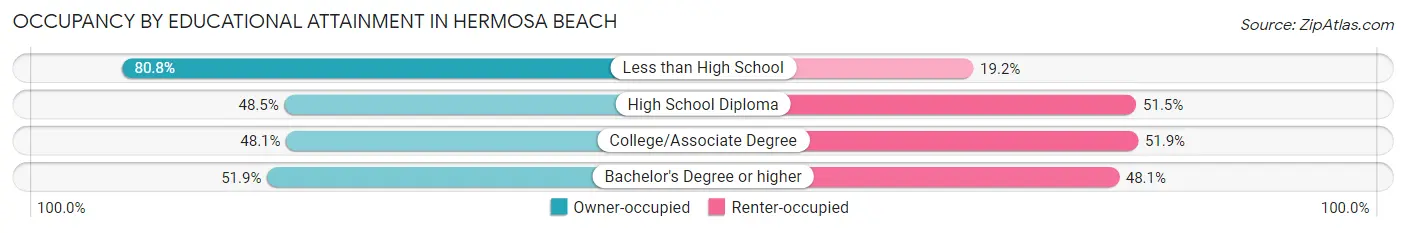
| Household Size | Owner-occupied | Renter-occupied |
| Less than High School | 63 (80.8%) | 15 (19.2%) |
| High School Diploma | 221 (48.5%) | 235 (51.5%) |
| College/Associate Degree | 660 (48.1%) | 712 (51.9%) |
| Bachelor's Degree or higher | 3,620 (51.9%) | 3,356 (48.1%) |
Occupancy by Age of Householder in Hermosa Beach
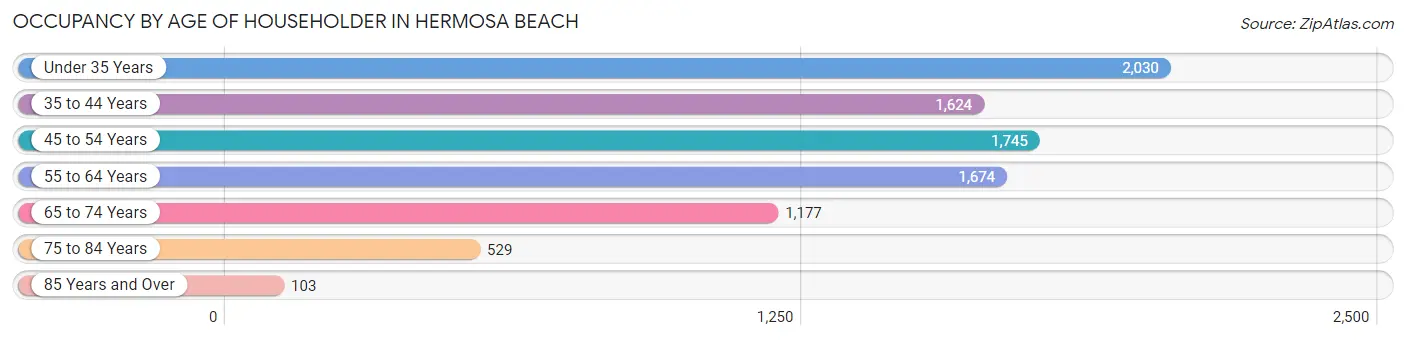
| Age Bracket | # Households | % Households |
| Under 35 Years | 2,030 | 22.9% |
| 35 to 44 Years | 1,624 | 18.3% |
| 45 to 54 Years | 1,745 | 19.7% |
| 55 to 64 Years | 1,674 | 18.9% |
| 65 to 74 Years | 1,177 | 13.3% |
| 75 to 84 Years | 529 | 6.0% |
| 85 Years and Over | 103 | 1.2% |
| Total | 8,882 | 100.0% |
Housing Finances in Hermosa Beach
Median Income by Occupancy in Hermosa Beach
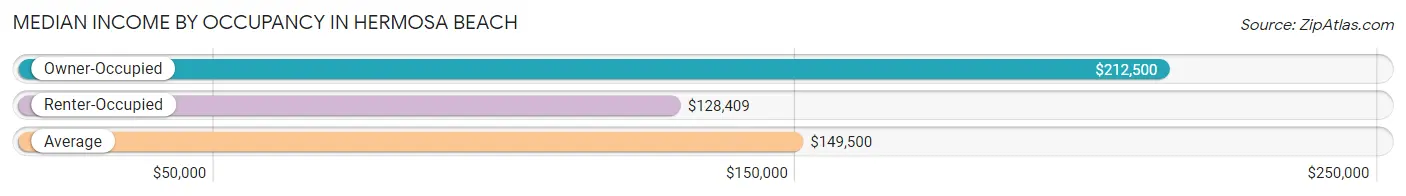
| Occupancy Type | # Households | Median Income |
| Owner-Occupied | 4,564 (51.4%) | $212,500 |
| Renter-Occupied | 4,318 (48.6%) | $128,409 |
| Average | 8,882 (100.0%) | $149,500 |
Occupancy by Householder Income Bracket in Hermosa Beach
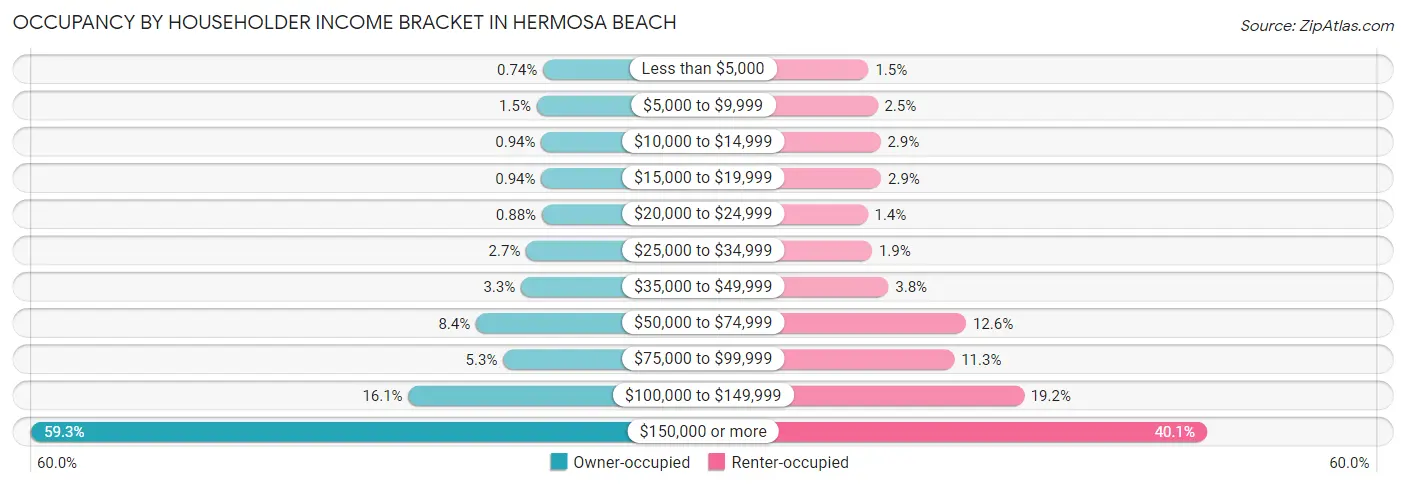
| Income Bracket | Owner-occupied | Renter-occupied |
| Less than $5,000 | 34 (0.7%) | 64 (1.5%) |
| $5,000 to $9,999 | 67 (1.5%) | 108 (2.5%) |
| $10,000 to $14,999 | 43 (0.9%) | 123 (2.9%) |
| $15,000 to $19,999 | 43 (0.9%) | 126 (2.9%) |
| $20,000 to $24,999 | 40 (0.9%) | 59 (1.4%) |
| $25,000 to $34,999 | 122 (2.7%) | 81 (1.9%) |
| $35,000 to $49,999 | 149 (3.3%) | 162 (3.7%) |
| $50,000 to $74,999 | 384 (8.4%) | 545 (12.6%) |
| $75,000 to $99,999 | 242 (5.3%) | 487 (11.3%) |
| $100,000 to $149,999 | 736 (16.1%) | 830 (19.2%) |
| $150,000 or more | 2,704 (59.3%) | 1,733 (40.1%) |
| Total | 4,564 (100.0%) | 4,318 (100.0%) |
Monthly Housing Cost Tiers in Hermosa Beach
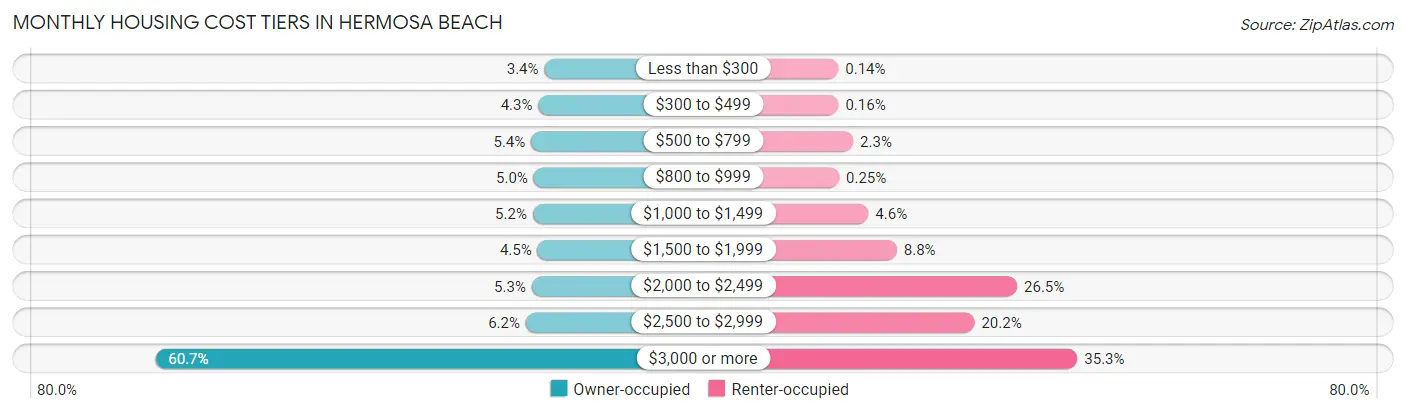
| Monthly Cost | Owner-occupied | Renter-occupied |
| Less than $300 | 157 (3.4%) | 6 (0.1%) |
| $300 to $499 | 198 (4.3%) | 7 (0.2%) |
| $500 to $799 | 246 (5.4%) | 100 (2.3%) |
| $800 to $999 | 229 (5.0%) | 11 (0.3%) |
| $1,000 to $1,499 | 235 (5.1%) | 197 (4.6%) |
| $1,500 to $1,999 | 203 (4.4%) | 378 (8.7%) |
| $2,000 to $2,499 | 242 (5.3%) | 1,143 (26.5%) |
| $2,500 to $2,999 | 282 (6.2%) | 872 (20.2%) |
| $3,000 or more | 2,772 (60.7%) | 1,526 (35.3%) |
| Total | 4,564 (100.0%) | 4,318 (100.0%) |
Physical Housing Characteristics in Hermosa Beach
Housing Structures in Hermosa Beach
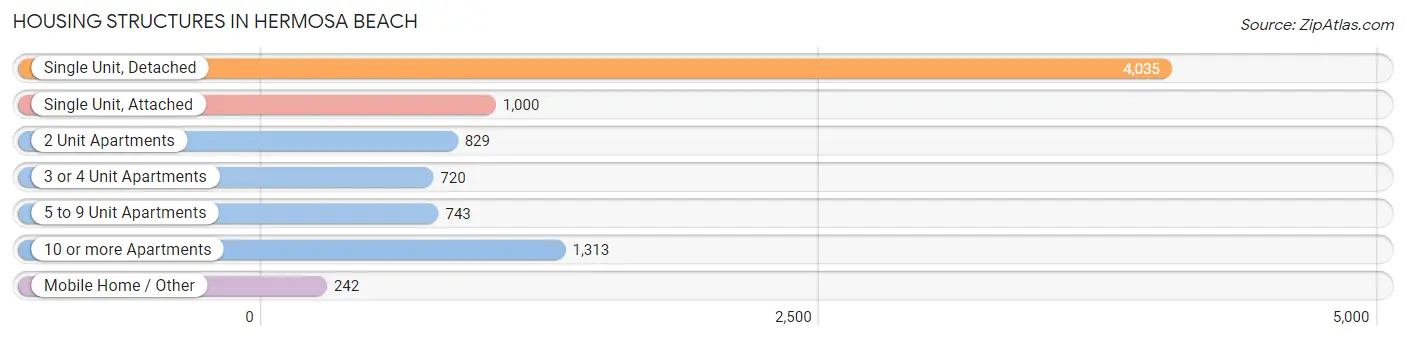
| Structure Type | # Housing Units | % Housing Units |
| Single Unit, Detached | 4,035 | 45.4% |
| Single Unit, Attached | 1,000 | 11.3% |
| 2 Unit Apartments | 829 | 9.3% |
| 3 or 4 Unit Apartments | 720 | 8.1% |
| 5 to 9 Unit Apartments | 743 | 8.4% |
| 10 or more Apartments | 1,313 | 14.8% |
| Mobile Home / Other | 242 | 2.7% |
| Total | 8,882 | 100.0% |
Housing Structures by Occupancy in Hermosa Beach
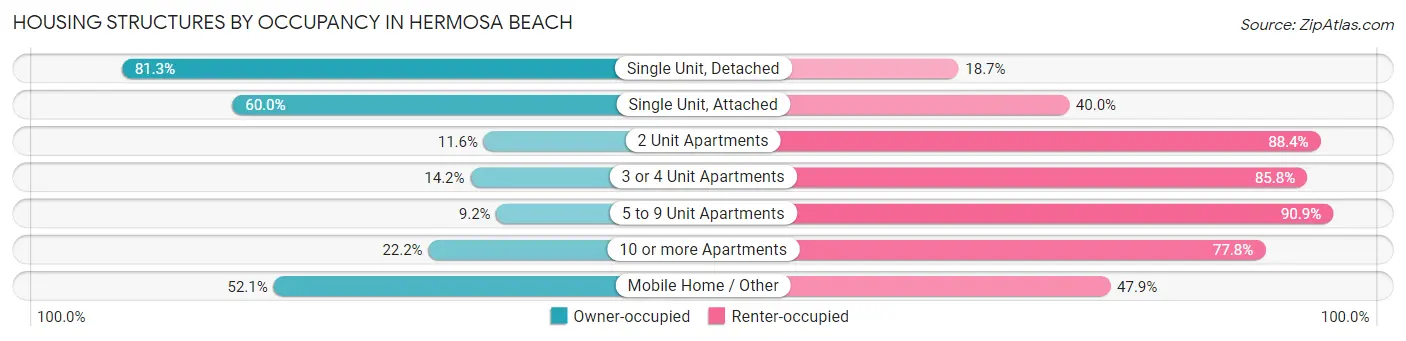
| Structure Type | Owner-occupied | Renter-occupied |
| Single Unit, Detached | 3,280 (81.3%) | 755 (18.7%) |
| Single Unit, Attached | 600 (60.0%) | 400 (40.0%) |
| 2 Unit Apartments | 96 (11.6%) | 733 (88.4%) |
| 3 or 4 Unit Apartments | 102 (14.2%) | 618 (85.8%) |
| 5 to 9 Unit Apartments | 68 (9.1%) | 675 (90.8%) |
| 10 or more Apartments | 292 (22.2%) | 1,021 (77.8%) |
| Mobile Home / Other | 126 (52.1%) | 116 (47.9%) |
| Total | 4,564 (51.4%) | 4,318 (48.6%) |
Housing Structures by Number of Rooms in Hermosa Beach
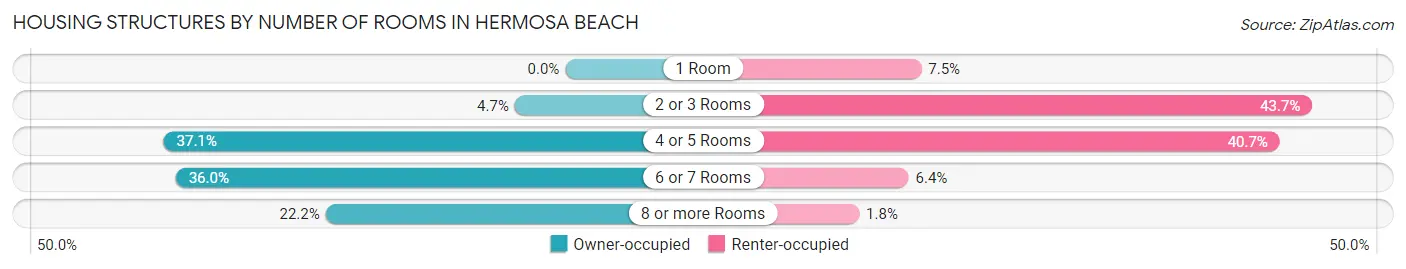
| Number of Rooms | Owner-occupied | Renter-occupied |
| 1 Room | 0 (0.0%) | 325 (7.5%) |
| 2 or 3 Rooms | 213 (4.7%) | 1,886 (43.7%) |
| 4 or 5 Rooms | 1,695 (37.1%) | 1,756 (40.7%) |
| 6 or 7 Rooms | 1,644 (36.0%) | 274 (6.4%) |
| 8 or more Rooms | 1,012 (22.2%) | 77 (1.8%) |
| Total | 4,564 (100.0%) | 4,318 (100.0%) |
Housing Structure by Heating Type in Hermosa Beach
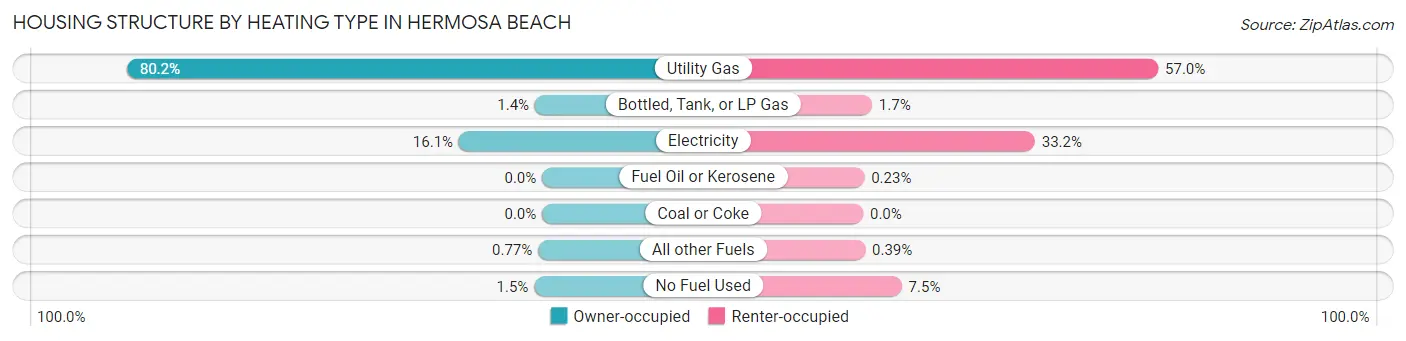
| Heating Type | Owner-occupied | Renter-occupied |
| Utility Gas | 3,662 (80.2%) | 2,462 (57.0%) |
| Bottled, Tank, or LP Gas | 63 (1.4%) | 74 (1.7%) |
| Electricity | 734 (16.1%) | 1,433 (33.2%) |
| Fuel Oil or Kerosene | 0 (0.0%) | 10 (0.2%) |
| Coal or Coke | 0 (0.0%) | 0 (0.0%) |
| All other Fuels | 35 (0.8%) | 17 (0.4%) |
| No Fuel Used | 70 (1.5%) | 322 (7.5%) |
| Total | 4,564 (100.0%) | 4,318 (100.0%) |
Household Vehicle Usage in Hermosa Beach
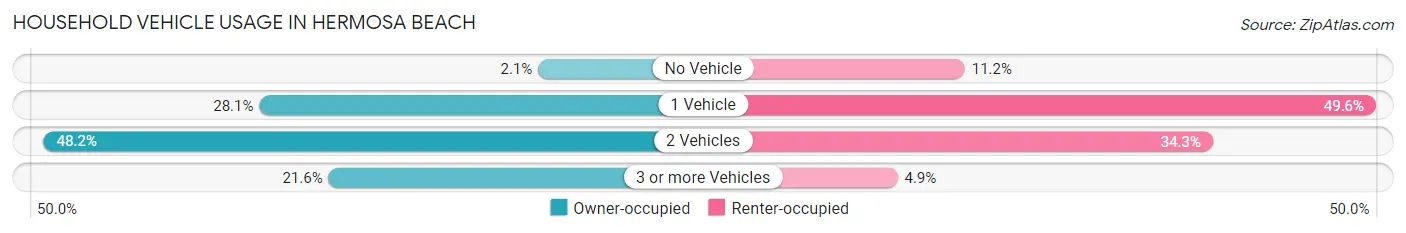
| Vehicles per Household | Owner-occupied | Renter-occupied |
| No Vehicle | 94 (2.1%) | 483 (11.2%) |
| 1 Vehicle | 1,282 (28.1%) | 2,140 (49.6%) |
| 2 Vehicles | 2,201 (48.2%) | 1,483 (34.3%) |
| 3 or more Vehicles | 987 (21.6%) | 212 (4.9%) |
| Total | 4,564 (100.0%) | 4,318 (100.0%) |
Real Estate & Mortgages in Hermosa Beach
Real Estate and Mortgage Overview in Hermosa Beach
| Characteristic | Without Mortgage | With Mortgage |
| Housing Units | 1,258 | 3,306 |
| Median Property Value | $1,456,500 | $1,986,100 |
| Median Household Income | $106,016 | $2,297 |
| Monthly Housing Costs | $835 | $2,738 |
| Real Estate Taxes | $4,401 | $10 |
Property Value by Mortgage Status in Hermosa Beach
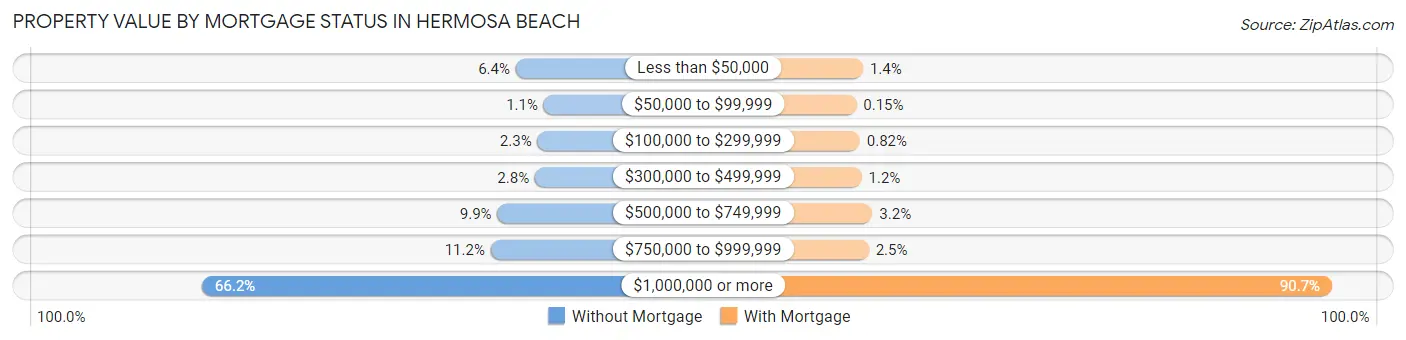
| Property Value | Without Mortgage | With Mortgage |
| Less than $50,000 | 81 (6.4%) | 47 (1.4%) |
| $50,000 to $99,999 | 14 (1.1%) | 5 (0.2%) |
| $100,000 to $299,999 | 29 (2.3%) | 27 (0.8%) |
| $300,000 to $499,999 | 35 (2.8%) | 38 (1.1%) |
| $500,000 to $749,999 | 125 (9.9%) | 106 (3.2%) |
| $750,000 to $999,999 | 141 (11.2%) | 83 (2.5%) |
| $1,000,000 or more | 833 (66.2%) | 3,000 (90.7%) |
| Total | 1,258 (100.0%) | 3,306 (100.0%) |
Household Income by Mortgage Status in Hermosa Beach
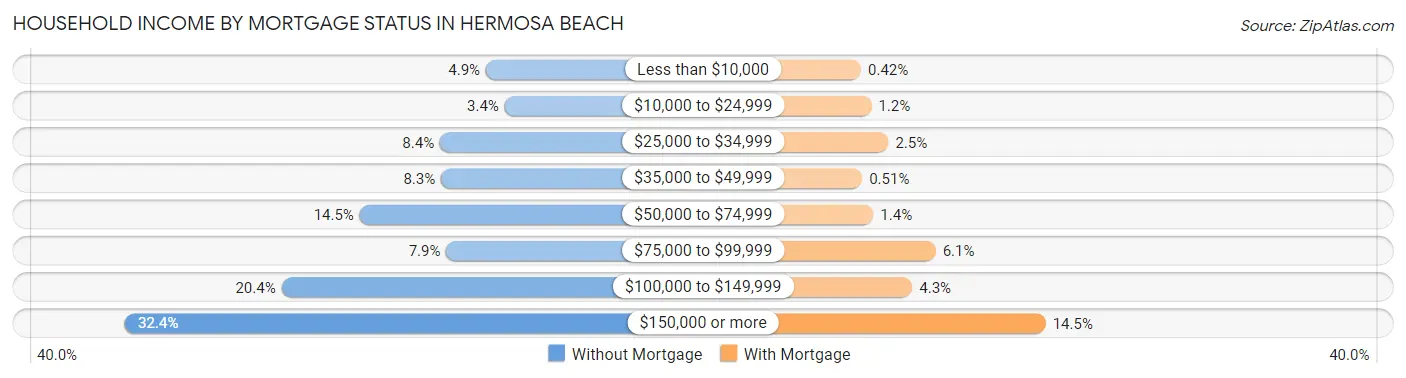
| Household Income | Without Mortgage | With Mortgage |
| Less than $10,000 | 61 (4.9%) | 14 (0.4%) |
| $10,000 to $24,999 | 43 (3.4%) | 40 (1.2%) |
| $25,000 to $34,999 | 105 (8.4%) | 83 (2.5%) |
| $35,000 to $49,999 | 104 (8.3%) | 17 (0.5%) |
| $50,000 to $74,999 | 182 (14.5%) | 45 (1.4%) |
| $75,000 to $99,999 | 99 (7.9%) | 202 (6.1%) |
| $100,000 to $149,999 | 257 (20.4%) | 143 (4.3%) |
| $150,000 or more | 407 (32.4%) | 479 (14.5%) |
| Total | 1,258 (100.0%) | 3,306 (100.0%) |
Property Value to Household Income Ratio in Hermosa Beach
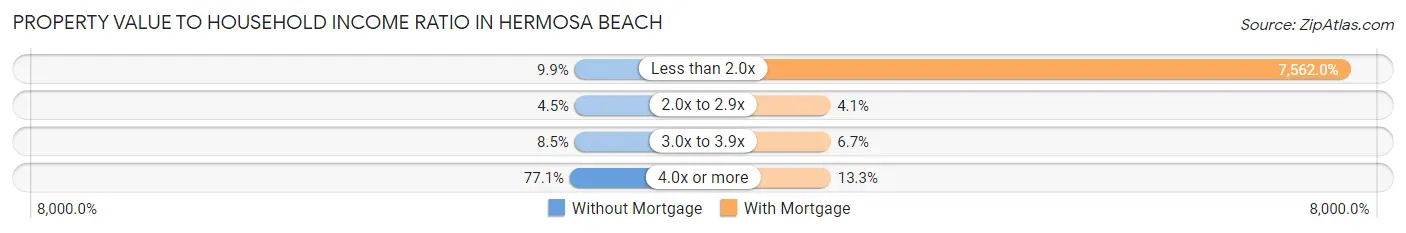
| Value-to-Income Ratio | Without Mortgage | With Mortgage |
| Less than 2.0x | 125 (9.9%) | 250,001 (7,562.0%) |
| 2.0x to 2.9x | 56 (4.4%) | 135 (4.1%) |
| 3.0x to 3.9x | 107 (8.5%) | 222 (6.7%) |
| 4.0x or more | 970 (77.1%) | 439 (13.3%) |
| Total | 1,258 (100.0%) | 3,306 (100.0%) |
Real Estate Taxes by Mortgage Status in Hermosa Beach
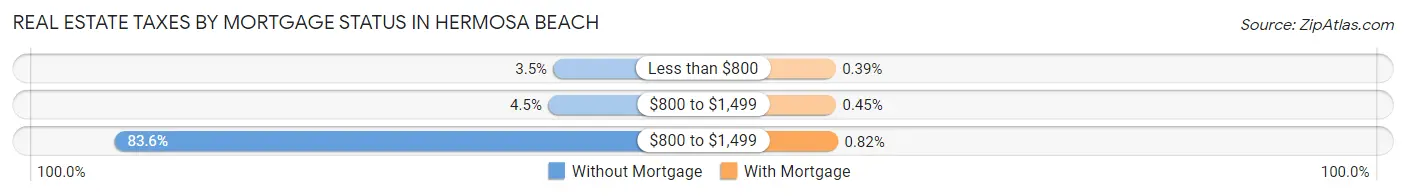
| Property Taxes | Without Mortgage | With Mortgage |
| Less than $800 | 44 (3.5%) | 13 (0.4%) |
| $800 to $1,499 | 56 (4.4%) | 15 (0.4%) |
| $800 to $1,499 | 1,051 (83.6%) | 27 (0.8%) |
| Total | 1,258 (100.0%) | 3,306 (100.0%) |
Health & Disability in Hermosa Beach
Health Insurance Coverage by Age in Hermosa Beach
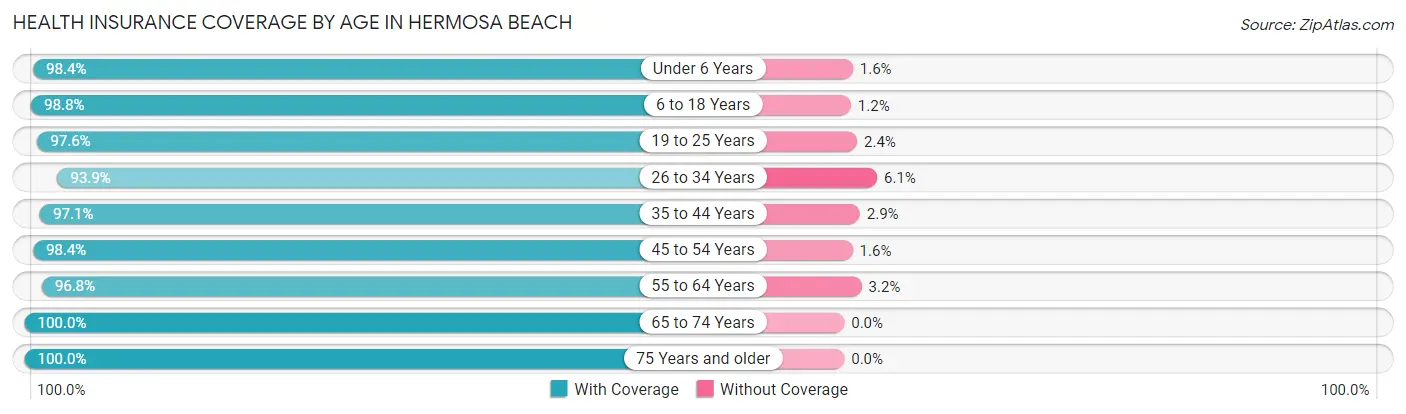
| Age Bracket | With Coverage | Without Coverage |
| Under 6 Years | 1,230 (98.4%) | 20 (1.6%) |
| 6 to 18 Years | 2,652 (98.8%) | 33 (1.2%) |
| 19 to 25 Years | 1,019 (97.6%) | 25 (2.4%) |
| 26 to 34 Years | 3,254 (93.9%) | 212 (6.1%) |
| 35 to 44 Years | 2,614 (97.1%) | 78 (2.9%) |
| 45 to 54 Years | 2,906 (98.4%) | 46 (1.6%) |
| 55 to 64 Years | 2,519 (96.8%) | 84 (3.2%) |
| 65 to 74 Years | 1,774 (100.0%) | 0 (0.0%) |
| 75 Years and older | 962 (100.0%) | 0 (0.0%) |
| Total | 18,930 (97.4%) | 498 (2.6%) |
Health Insurance Coverage by Citizenship Status in Hermosa Beach
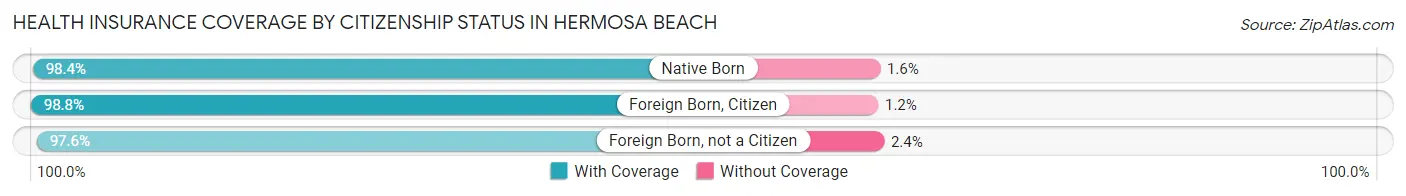
| Citizenship Status | With Coverage | Without Coverage |
| Native Born | 1,230 (98.4%) | 20 (1.6%) |
| Foreign Born, Citizen | 2,652 (98.8%) | 33 (1.2%) |
| Foreign Born, not a Citizen | 1,019 (97.6%) | 25 (2.4%) |
Health Insurance Coverage by Household Income in Hermosa Beach
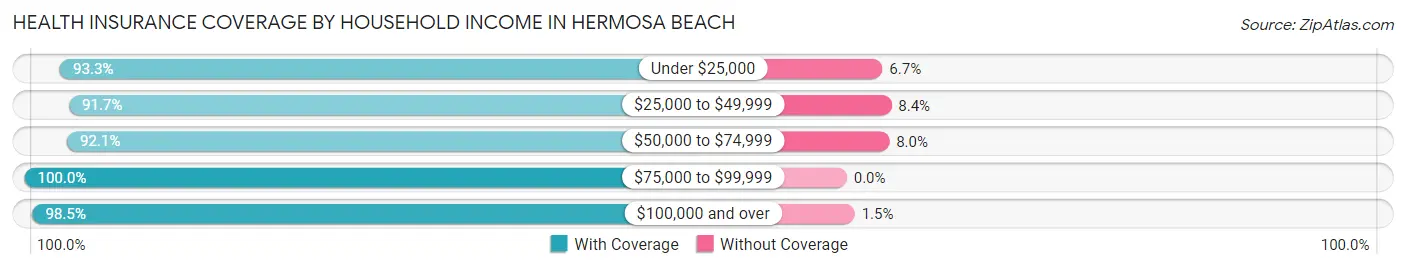
| Household Income | With Coverage | Without Coverage |
| Under $25,000 | 951 (93.3%) | 68 (6.7%) |
| $25,000 to $49,999 | 615 (91.6%) | 56 (8.4%) |
| $50,000 to $74,999 | 1,794 (92.0%) | 155 (8.0%) |
| $75,000 to $99,999 | 946 (100.0%) | 0 (0.0%) |
| $100,000 and over | 14,615 (98.5%) | 219 (1.5%) |
Public vs Private Health Insurance Coverage by Age in Hermosa Beach
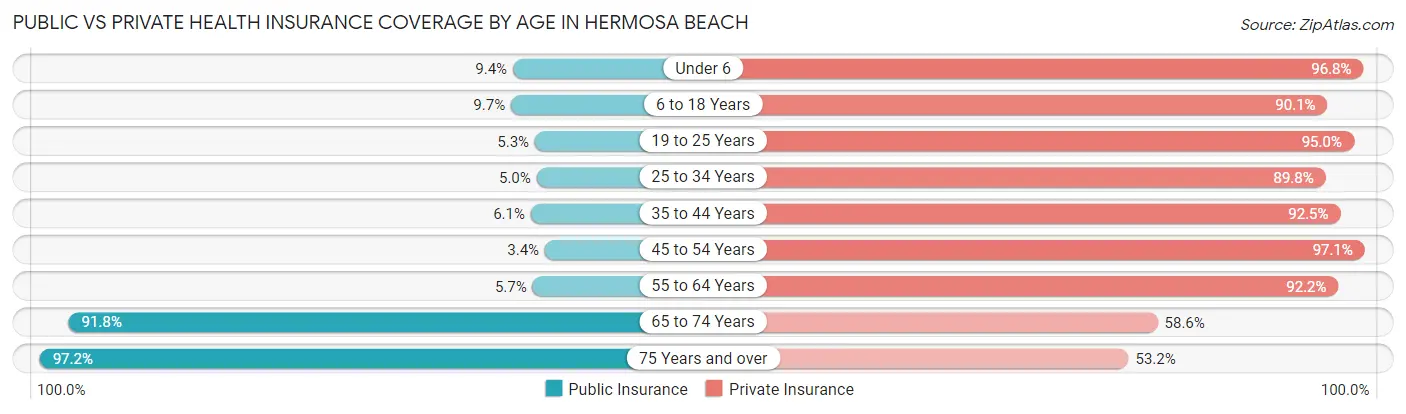
| Age Bracket | Public Insurance | Private Insurance |
| Under 6 | 117 (9.4%) | 1,210 (96.8%) |
| 6 to 18 Years | 261 (9.7%) | 2,420 (90.1%) |
| 19 to 25 Years | 55 (5.3%) | 992 (95.0%) |
| 25 to 34 Years | 172 (5.0%) | 3,112 (89.8%) |
| 35 to 44 Years | 163 (6.0%) | 2,491 (92.5%) |
| 45 to 54 Years | 101 (3.4%) | 2,865 (97.1%) |
| 55 to 64 Years | 149 (5.7%) | 2,399 (92.2%) |
| 65 to 74 Years | 1,629 (91.8%) | 1,040 (58.6%) |
| 75 Years and over | 935 (97.2%) | 512 (53.2%) |
| Total | 3,582 (18.4%) | 17,041 (87.7%) |
Disability Status by Sex by Age in Hermosa Beach
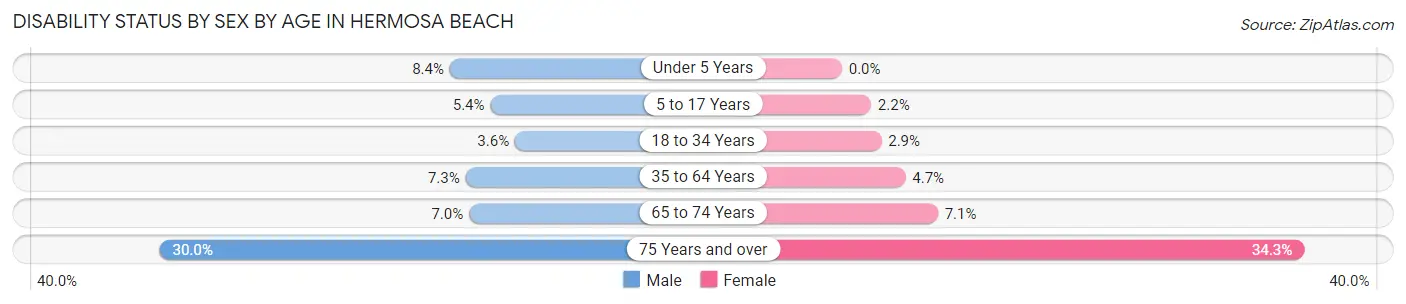
| Age Bracket | Male | Female |
| Under 5 Years | 49 (8.4%) | 0 (0.0%) |
| 5 to 17 Years | 79 (5.4%) | 29 (2.2%) |
| 18 to 34 Years | 94 (3.6%) | 60 (2.9%) |
| 35 to 64 Years | 310 (7.3%) | 188 (4.7%) |
| 65 to 74 Years | 75 (7.0%) | 50 (7.1%) |
| 75 Years and over | 146 (30.0%) | 163 (34.3%) |
Disability Class by Sex by Age in Hermosa Beach
Disability Class: Hearing Difficulty
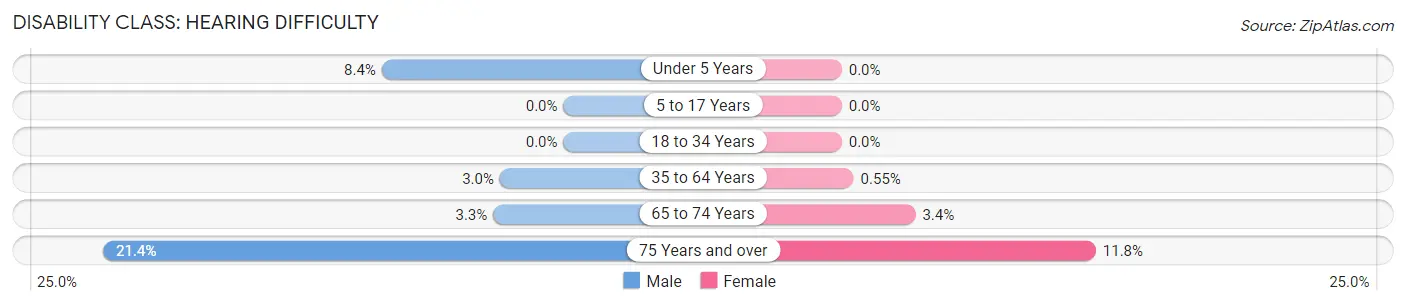
| Age Bracket | Male | Female |
| Under 5 Years | 49 (8.4%) | 0 (0.0%) |
| 5 to 17 Years | 0 (0.0%) | 0 (0.0%) |
| 18 to 34 Years | 0 (0.0%) | 0 (0.0%) |
| 35 to 64 Years | 126 (2.9%) | 22 (0.5%) |
| 65 to 74 Years | 35 (3.3%) | 24 (3.4%) |
| 75 Years and over | 104 (21.4%) | 56 (11.8%) |
Disability Class: Vision Difficulty
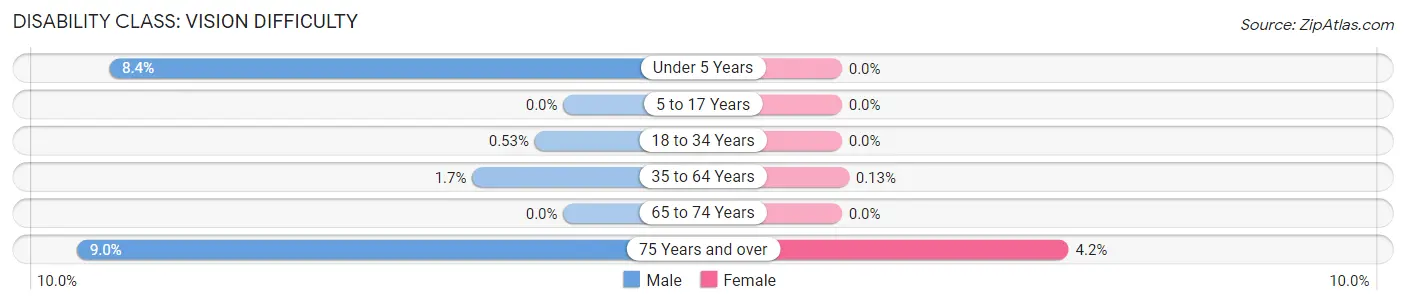
| Age Bracket | Male | Female |
| Under 5 Years | 49 (8.4%) | 0 (0.0%) |
| 5 to 17 Years | 0 (0.0%) | 0 (0.0%) |
| 18 to 34 Years | 14 (0.5%) | 0 (0.0%) |
| 35 to 64 Years | 72 (1.7%) | 5 (0.1%) |
| 65 to 74 Years | 0 (0.0%) | 0 (0.0%) |
| 75 Years and over | 44 (9.0%) | 20 (4.2%) |
Disability Class: Cognitive Difficulty
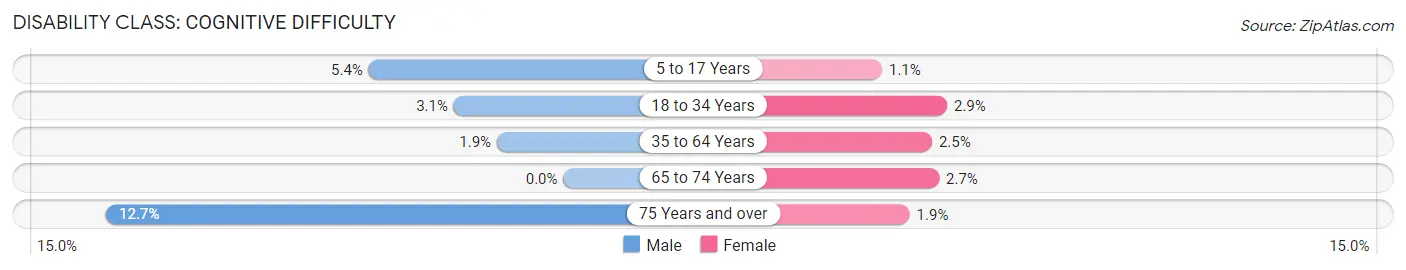
| Age Bracket | Male | Female |
| 5 to 17 Years | 79 (5.4%) | 15 (1.1%) |
| 18 to 34 Years | 80 (3.0%) | 60 (2.9%) |
| 35 to 64 Years | 79 (1.8%) | 100 (2.5%) |
| 65 to 74 Years | 0 (0.0%) | 19 (2.7%) |
| 75 Years and over | 62 (12.7%) | 9 (1.9%) |
Disability Class: Ambulatory Difficulty
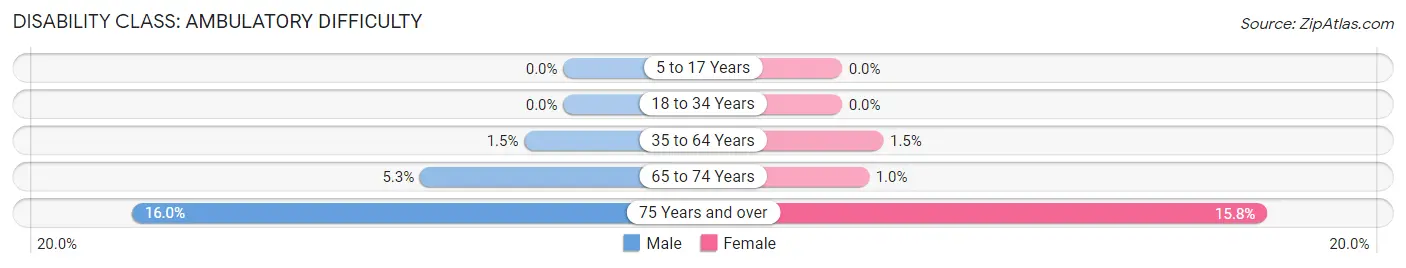
| Age Bracket | Male | Female |
| 5 to 17 Years | 0 (0.0%) | 0 (0.0%) |
| 18 to 34 Years | 0 (0.0%) | 0 (0.0%) |
| 35 to 64 Years | 62 (1.5%) | 61 (1.5%) |
| 65 to 74 Years | 57 (5.3%) | 7 (1.0%) |
| 75 Years and over | 78 (16.0%) | 75 (15.8%) |
Disability Class: Self-Care Difficulty
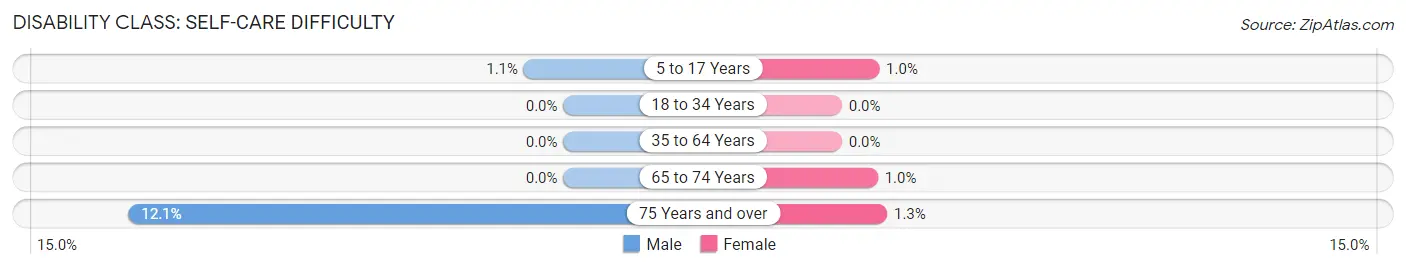
| Age Bracket | Male | Female |
| 5 to 17 Years | 16 (1.1%) | 14 (1.0%) |
| 18 to 34 Years | 0 (0.0%) | 0 (0.0%) |
| 35 to 64 Years | 0 (0.0%) | 0 (0.0%) |
| 65 to 74 Years | 0 (0.0%) | 7 (1.0%) |
| 75 Years and over | 59 (12.1%) | 6 (1.3%) |
Technology Access in Hermosa Beach
Computing Device Access in Hermosa Beach
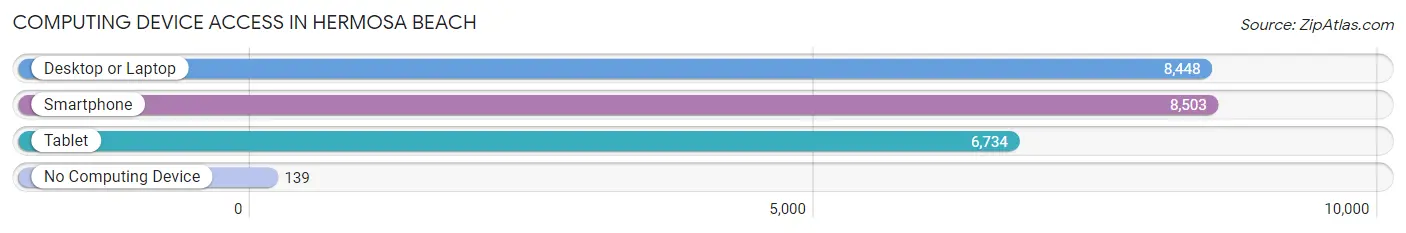
| Device Type | # Households | % Households |
| Desktop or Laptop | 8,448 | 95.1% |
| Smartphone | 8,503 | 95.7% |
| Tablet | 6,734 | 75.8% |
| No Computing Device | 139 | 1.6% |
| Total | 8,882 | 100.0% |
Internet Access in Hermosa Beach
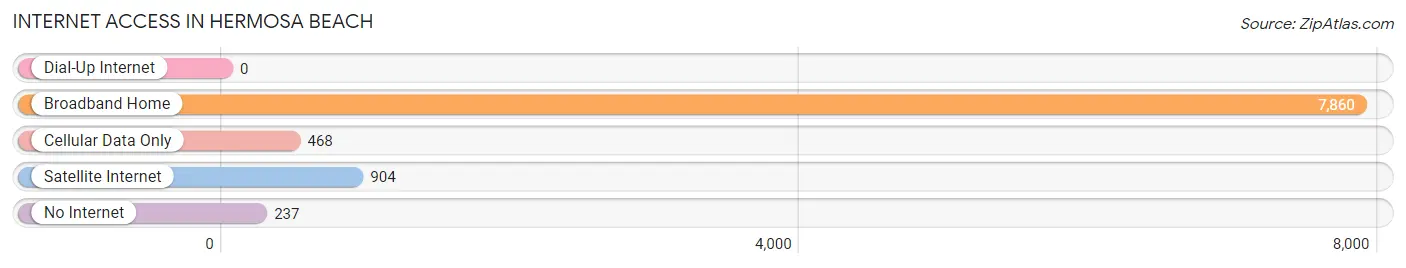
| Internet Type | # Households | % Households |
| Dial-Up Internet | 0 | 0.0% |
| Broadband Home | 7,860 | 88.5% |
| Cellular Data Only | 468 | 5.3% |
| Satellite Internet | 904 | 10.2% |
| No Internet | 237 | 2.7% |
| Total | 8,882 | 100.0% |
Hermosa Beach Summary
HerMosa Beach, CA is a small beach city located in Los Angeles County, California. It is situated on the Pacific Ocean, just south of the larger city of Los Angeles. The city is known for its beautiful beaches, surfing, and laid-back atmosphere. It is also home to a vibrant arts and culture scene, with many galleries, restaurants, and shops.
History
HerMosa Beach was originally inhabited by the Tongva Native American tribe. The area was first explored by Spanish settlers in the late 1700s, and the city was officially founded in 1907. The city was named after the Spanish word for “beautiful”, and the city’s motto is “A Place to Play”.
In the early 1900s, HerMosa Beach was a popular destination for beachgoers, and the city quickly became known for its surfing culture. The city was also home to a number of famous musicians, including the Beach Boys and Jan and Dean.
Geography
HerMosa Beach is located in Los Angeles County, California, on the Pacific Ocean. The city is bordered by the cities of Manhattan Beach to the north, Redondo Beach to the south, and Torrance to the east. The city covers an area of 2.5 square miles, and has a population of 19,000.
The city is known for its beautiful beaches, which are popular for swimming, surfing, and other beach activities. The city also has a number of parks, including the HerMosa Beach Pier, which is a popular spot for fishing and sightseeing.
Economy
HerMosa Beach has a thriving economy, with a number of businesses and industries located in the city. The city is home to a number of technology companies, including the software company Adobe Systems. The city is also home to a number of restaurants, bars, and shops, as well as a number of art galleries and museums.
The city is also home to a number of professional sports teams, including the Los Angeles Kings of the National Hockey League and the Los Angeles Lakers of the National Basketball Association.
Demographics
As of the 2010 census, HerMosa Beach had a population of 19,000. The population is predominantly white (78.3%), with a significant Hispanic population (14.2%). The median household income is $90,000, and the median age is 39.
HerMosa Beach is a diverse city, with a variety of cultures and backgrounds represented. The city is home to a number of immigrants from Mexico, Central America, and South America, as well as a number of Asian immigrants. The city is also home to a large LGBT community.
Conclusion
HerMosa Beach, CA is a small beach city located in Los Angeles County, California. It is known for its beautiful beaches, surfing culture, and laid-back atmosphere. The city has a thriving economy, with a number of businesses and industries located in the city. The city is also home to a diverse population, with a variety of cultures and backgrounds represented. HerMosa Beach is a great place to live, work, and play.
Common Questions
What is Per Capita Income in Hermosa Beach?
Per Capita income in Hermosa Beach is $106,731.
What is the Median Family Income in Hermosa Beach?
Median Family Income in Hermosa Beach is $226,970.
What is the Median Household income in Hermosa Beach?
Median Household Income in Hermosa Beach is $149,500.
What is Income or Wage Gap in Hermosa Beach?
Income or Wage Gap in Hermosa Beach is 24.4%.
Women in Hermosa Beach earn 75.6 cents for every dollar earned by a man.
What is Inequality or Gini Index in Hermosa Beach?
Inequality or Gini Index in Hermosa Beach is 0.49.
What is the Total Population of Hermosa Beach?
Total Population of Hermosa Beach is 19,551.
What is the Total Male Population of Hermosa Beach?
Total Male Population of Hermosa Beach is 10,553.
What is the Total Female Population of Hermosa Beach?
Total Female Population of Hermosa Beach is 8,998.
What is the Ratio of Males per 100 Females in Hermosa Beach?
There are 117.28 Males per 100 Females in Hermosa Beach.
What is the Ratio of Females per 100 Males in Hermosa Beach?
There are 85.26 Females per 100 Males in Hermosa Beach.
What is the Median Population Age in Hermosa Beach?
Median Population Age in Hermosa Beach is 40.2 Years.
What is the Average Family Size in Hermosa Beach
Average Family Size in Hermosa Beach is 2.9 People.
What is the Average Household Size in Hermosa Beach
Average Household Size in Hermosa Beach is 2.2 People.
How Large is the Labor Force in Hermosa Beach?
There are 11,597 People in the Labor Forcein in Hermosa Beach.
What is the Percentage of People in the Labor Force in Hermosa Beach?
71.1% of People are in the Labor Force in Hermosa Beach.
What is the Unemployment Rate in Hermosa Beach?
Unemployment Rate in Hermosa Beach is 4.9%.