Cities with the Lowest Poverty Level Among Seniors Over the Age of 75 in Tennessee
RELATED REPORTS & OPTIONS
Lowest Poverty | Seniors 75+
Tennessee
Compare Cities
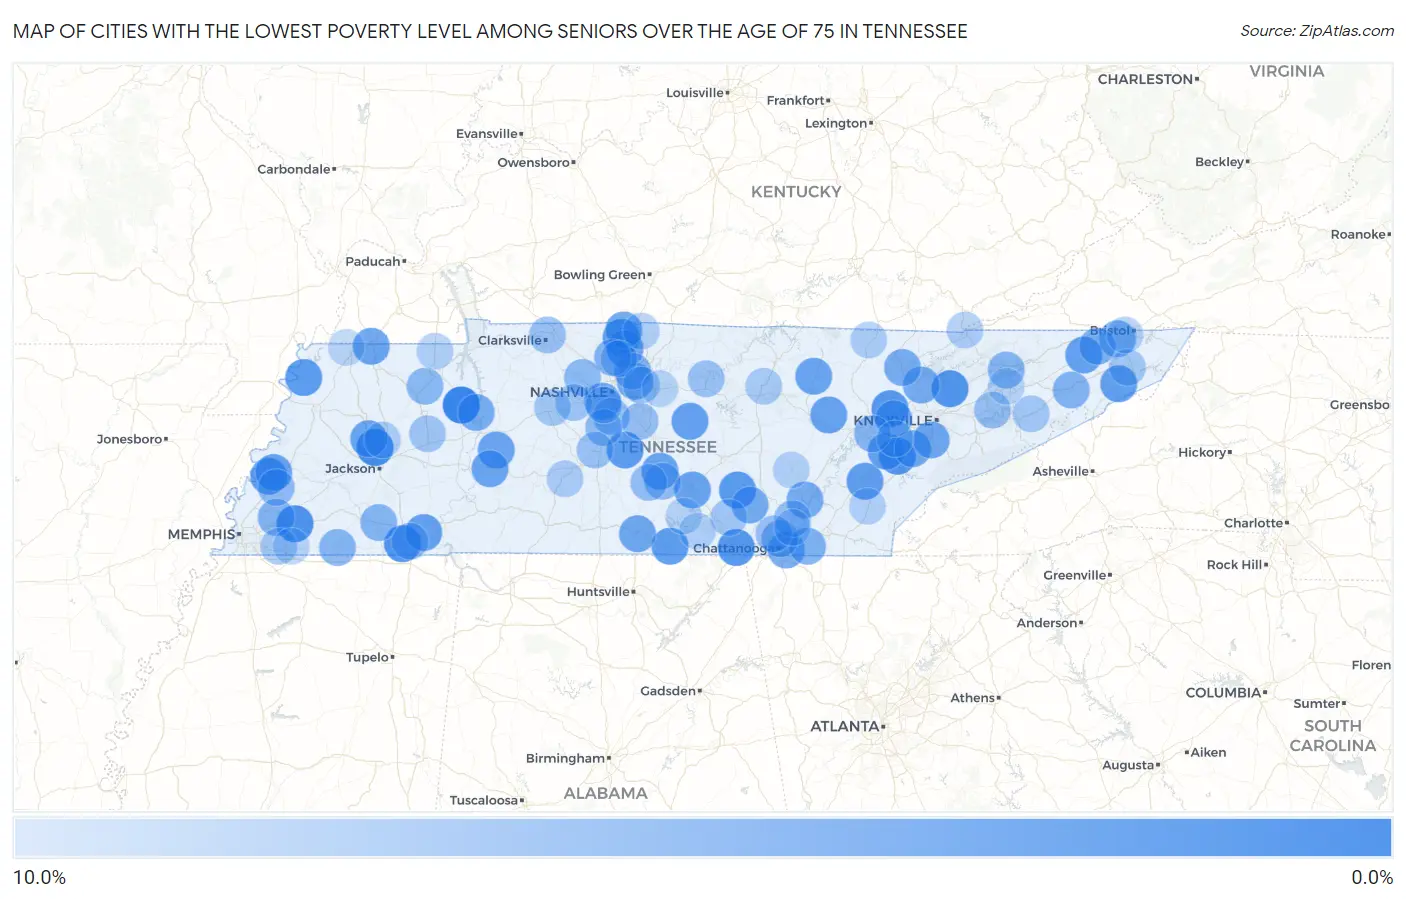
Map of Cities with the Lowest Poverty Level Among Seniors Over the Age of 75 in Tennessee
10.0%
0.0%
Cities with the Lowest Poverty Level Among Seniors Over the Age of 75 in Tennessee
| City | Senior Poverty | vs State | vs National | |
| 1. | Camden | 0.68% | 11.1%(-10.5)#1 | 11.1%(-10.4)#84 |
| 2. | Three Way | 1.6% | 11.1%(-9.53)#2 | 11.1%(-9.46)#340 |
| 3. | Oakland | 1.9% | 11.1%(-9.22)#3 | 11.1%(-9.15)#478 |
| 4. | Ramer | 2.0% | 11.1%(-9.14)#4 | 11.1%(-9.07)#523 |
| 5. | Plainview | 2.2% | 11.1%(-8.97)#5 | 11.1%(-8.89)#635 |
| 6. | Tellico Village | 2.4% | 11.1%(-8.74)#6 | 11.1%(-8.66)#780 |
| 7. | Kimball | 2.5% | 11.1%(-8.68)#7 | 11.1%(-8.61)#822 |
| 8. | Oliver Springs | 2.5% | 11.1%(-8.66)#8 | 11.1%(-8.59)#841 |
| 9. | Beersheba Springs | 2.6% | 11.1%(-8.51)#9 | 11.1%(-8.44)#955 |
| 10. | Cross Plains | 2.7% | 11.1%(-8.44)#10 | 11.1%(-8.36)#994 |
| 11. | Burlison | 2.8% | 11.1%(-8.36)#11 | 11.1%(-8.29)#1,069 |
| 12. | Ridgely | 2.9% | 11.1%(-8.28)#12 | 11.1%(-8.21)#1,125 |
| 13. | Eagleville | 2.9% | 11.1%(-8.28)#13 | 11.1%(-8.21)#1,130 |
| 14. | Huntland | 2.9% | 11.1%(-8.20)#14 | 11.1%(-8.13)#1,188 |
| 15. | Niota | 3.0% | 11.1%(-8.16)#15 | 11.1%(-8.08)#1,228 |
| 16. | White House | 3.1% | 11.1%(-8.03)#16 | 11.1%(-7.96)#1,328 |
| 17. | Loudon | 3.1% | 11.1%(-8.03)#17 | 11.1%(-7.95)#1,329 |
| 18. | Unicoi | 3.2% | 11.1%(-7.96)#18 | 11.1%(-7.88)#1,395 |
| 19. | Fall Branch | 3.3% | 11.1%(-7.84)#19 | 11.1%(-7.77)#1,497 |
| 20. | Auburntown | 3.3% | 11.1%(-7.81)#20 | 11.1%(-7.73)#1,530 |
| 21. | Stantonville | 3.4% | 11.1%(-7.69)#21 | 11.1%(-7.62)#1,643 |
| 22. | Fairfield Glade | 3.5% | 11.1%(-7.69)#22 | 11.1%(-7.62)#1,648 |
| 23. | Manchester | 3.5% | 11.1%(-7.65)#23 | 11.1%(-7.58)#1,668 |
| 24. | Humboldt | 3.6% | 11.1%(-7.58)#24 | 11.1%(-7.51)#1,721 |
| 25. | Bell Buckle | 3.6% | 11.1%(-7.57)#25 | 11.1%(-7.50)#1,748 |
| 26. | Garland | 3.6% | 11.1%(-7.57)#26 | 11.1%(-7.50)#1,762 |
| 27. | Lobelville | 3.7% | 11.1%(-7.48)#27 | 11.1%(-7.41)#1,827 |
| 28. | South Fulton | 3.7% | 11.1%(-7.47)#28 | 11.1%(-7.40)#1,839 |
| 29. | Linden | 3.7% | 11.1%(-7.41)#29 | 11.1%(-7.34)#1,898 |
| 30. | Grimsley | 3.7% | 11.1%(-7.41)#30 | 11.1%(-7.34)#1,899 |
| 31. | Orlinda | 3.8% | 11.1%(-7.37)#31 | 11.1%(-7.29)#1,943 |
| 32. | Fayetteville | 3.9% | 11.1%(-7.19)#32 | 11.1%(-7.12)#2,118 |
| 33. | Friendsville | 3.9% | 11.1%(-7.19)#33 | 11.1%(-7.12)#2,120 |
| 34. | Alcoa | 4.0% | 11.1%(-7.16)#34 | 11.1%(-7.09)#2,149 |
| 35. | Belle Meade | 4.1% | 11.1%(-7.09)#35 | 11.1%(-7.01)#2,227 |
| 36. | Palmer | 4.2% | 11.1%(-6.97)#36 | 11.1%(-6.90)#2,338 |
| 37. | Ridgeside | 4.2% | 11.1%(-6.92)#37 | 11.1%(-6.84)#2,406 |
| 38. | Oak Ridge | 4.3% | 11.1%(-6.88)#38 | 11.1%(-6.81)#2,446 |
| 39. | Norris | 4.4% | 11.1%(-6.77)#39 | 11.1%(-6.70)#2,558 |
| 40. | Sale Creek | 4.4% | 11.1%(-6.76)#40 | 11.1%(-6.69)#2,568 |
| 41. | Caryville | 4.4% | 11.1%(-6.75)#41 | 11.1%(-6.67)#2,580 |
| 42. | Green Hill | 4.4% | 11.1%(-6.71)#42 | 11.1%(-6.63)#2,623 |
| 43. | New Johnsonville | 4.5% | 11.1%(-6.60)#43 | 11.1%(-6.52)#2,722 |
| 44. | Blountville | 4.7% | 11.1%(-6.49)#44 | 11.1%(-6.42)#2,855 |
| 45. | Colonial Heights | 4.7% | 11.1%(-6.40)#45 | 11.1%(-6.33)#2,918 |
| 46. | Collegedale | 4.8% | 11.1%(-6.32)#46 | 11.1%(-6.25)#3,019 |
| 47. | Lakeland | 5.1% | 11.1%(-6.09)#47 | 11.1%(-6.02)#3,266 |
| 48. | Red Bank | 5.1% | 11.1%(-6.09)#48 | 11.1%(-6.02)#3,267 |
| 49. | Tusculum | 5.1% | 11.1%(-6.06)#49 | 11.1%(-5.99)#3,295 |
| 50. | Hendersonville | 5.1% | 11.1%(-6.06)#50 | 11.1%(-5.98)#3,297 |
| 51. | Ridgetop | 5.1% | 11.1%(-6.06)#51 | 11.1%(-5.98)#3,300 |
| 52. | Grand Junction | 5.3% | 11.1%(-5.88)#52 | 11.1%(-5.80)#3,483 |
| 53. | Hornsby | 5.3% | 11.1%(-5.88)#53 | 11.1%(-5.80)#3,492 |
| 54. | Bean Station | 5.3% | 11.1%(-5.85)#54 | 11.1%(-5.78)#3,519 |
| 55. | Kingston | 5.4% | 11.1%(-5.71)#55 | 11.1%(-5.63)#3,638 |
| 56. | Henry | 5.6% | 11.1%(-5.59)#56 | 11.1%(-5.51)#3,766 |
| 57. | Brentwood | 5.6% | 11.1%(-5.50)#57 | 11.1%(-5.43)#3,863 |
| 58. | Ashland City | 5.7% | 11.1%(-5.49)#58 | 11.1%(-5.41)#3,874 |
| 59. | Franklin | 5.7% | 11.1%(-5.45)#59 | 11.1%(-5.37)#3,922 |
| 60. | Brighton | 5.9% | 11.1%(-5.20)#60 | 11.1%(-5.13)#4,193 |
| 61. | Wartrace | 6.1% | 11.1%(-5.08)#61 | 11.1%(-5.01)#4,321 |
| 62. | Oak Grove Cdp Washington County | 6.1% | 11.1%(-5.04)#62 | 11.1%(-4.97)#4,362 |
| 63. | Eastview | 6.1% | 11.1%(-5.02)#63 | 11.1%(-4.94)#4,391 |
| 64. | Soddy Daisy | 6.2% | 11.1%(-4.98)#64 | 11.1%(-4.91)#4,435 |
| 65. | Shelbyville | 6.2% | 11.1%(-4.92)#65 | 11.1%(-4.85)#4,479 |
| 66. | Dandridge | 6.3% | 11.1%(-4.87)#66 | 11.1%(-4.79)#4,586 |
| 67. | Smyrna | 6.3% | 11.1%(-4.82)#67 | 11.1%(-4.74)#4,622 |
| 68. | Clarksville | 6.4% | 11.1%(-4.75)#68 | 11.1%(-4.68)#4,692 |
| 69. | Karns | 6.4% | 11.1%(-4.74)#69 | 11.1%(-4.66)#4,707 |
| 70. | Signal Mountain | 6.4% | 11.1%(-4.73)#70 | 11.1%(-4.65)#4,719 |
| 71. | Carthage | 6.5% | 11.1%(-4.67)#71 | 11.1%(-4.59)#4,797 |
| 72. | Spring Hill | 6.6% | 11.1%(-4.57)#72 | 11.1%(-4.49)#4,884 |
| 73. | Millersville | 6.6% | 11.1%(-4.54)#73 | 11.1%(-4.46)#4,906 |
| 74. | Mount Juliet | 6.6% | 11.1%(-4.52)#74 | 11.1%(-4.44)#4,924 |
| 75. | Kingston Springs | 6.7% | 11.1%(-4.47)#75 | 11.1%(-4.40)#4,949 |
| 76. | Clarksburg | 6.8% | 11.1%(-4.32)#76 | 11.1%(-4.25)#5,134 |
| 77. | Forest Hills | 6.8% | 11.1%(-4.29)#77 | 11.1%(-4.22)#5,160 |
| 78. | Tracy City | 6.8% | 11.1%(-4.29)#78 | 11.1%(-4.22)#5,162 |
| 79. | Parrottsville | 6.9% | 11.1%(-4.24)#79 | 11.1%(-4.17)#5,237 |
| 80. | Burns | 7.0% | 11.1%(-4.12)#80 | 11.1%(-4.05)#5,345 |
| 81. | Elizabethton | 7.0% | 11.1%(-4.10)#81 | 11.1%(-4.02)#5,371 |
| 82. | Collierville | 7.1% | 11.1%(-4.09)#82 | 11.1%(-4.01)#5,376 |
| 83. | Middle Valley | 7.3% | 11.1%(-3.85)#83 | 11.1%(-3.78)#5,609 |
| 84. | Algood | 7.3% | 11.1%(-3.84)#84 | 11.1%(-3.76)#5,626 |
| 85. | Mount Pleasant | 7.4% | 11.1%(-3.73)#85 | 11.1%(-3.66)#5,709 |
| 86. | Cumberland Gap | 7.4% | 11.1%(-3.73)#86 | 11.1%(-3.66)#5,734 |
| 87. | Lenoir City | 7.5% | 11.1%(-3.66)#87 | 11.1%(-3.59)#5,798 |
| 88. | Oneida | 7.5% | 11.1%(-3.63)#88 | 11.1%(-3.55)#5,835 |
| 89. | Medina | 7.5% | 11.1%(-3.62)#89 | 11.1%(-3.54)#5,845 |
| 90. | Cowan | 7.6% | 11.1%(-3.52)#90 | 11.1%(-3.45)#5,913 |
| 91. | Walnut Hill | 7.6% | 11.1%(-3.50)#91 | 11.1%(-3.43)#5,927 |
| 92. | Portland | 7.7% | 11.1%(-3.45)#92 | 11.1%(-3.37)#5,952 |
| 93. | Puryear | 7.7% | 11.1%(-3.45)#93 | 11.1%(-3.37)#5,985 |
| 94. | Pikeville | 7.7% | 11.1%(-3.41)#94 | 11.1%(-3.33)#6,053 |
| 95. | Etowah | 7.8% | 11.1%(-3.36)#95 | 11.1%(-3.29)#6,087 |
| 96. | Piperton | 8.0% | 11.1%(-3.16)#96 | 11.1%(-3.08)#6,250 |
| 97. | Lebanon | 8.1% | 11.1%(-3.07)#97 | 11.1%(-2.99)#6,353 |
| 98. | Estill Springs | 8.1% | 11.1%(-3.03)#98 | 11.1%(-2.96)#6,380 |
| 99. | Woodland Mills | 8.1% | 11.1%(-3.03)#99 | 11.1%(-2.96)#6,385 |
| 100. | Morristown | 8.1% | 11.1%(-2.99)#100 | 11.1%(-2.92)#6,423 |
Common Questions
What are the Top 10 Cities with the Lowest Poverty Level Among Seniors Over the Age of 75 in Tennessee?
Top 10 Cities with the Lowest Poverty Level Among Seniors Over the Age of 75 in Tennessee are:
#1
0.68%
#2
1.6%
#3
1.9%
#4
2.0%
#5
2.2%
#6
2.4%
#7
2.5%
#8
2.5%
#9
2.6%
#10
2.7%
What city has the Lowest Poverty Level Among Seniors Over the Age of 75 in Tennessee?
Camden has the Lowest Poverty Level Among Seniors Over the Age of 75 in Tennessee with 0.68%.
What is the Poverty Level Among Seniors Over the Age of 75 in the State of Tennessee?
Poverty Level Among Seniors Over the Age of 75 in Tennessee is 11.1%.
What is the Poverty Level Among Seniors Over the Age of 75 in the United States?
Poverty Level Among Seniors Over the Age of 75 in the United States is 11.1%.