Cities with the Lowest Poverty Level Among Seniors Over the Age of 75 in Colorado
RELATED REPORTS & OPTIONS
Lowest Poverty | Seniors 75+
Colorado
Compare Cities
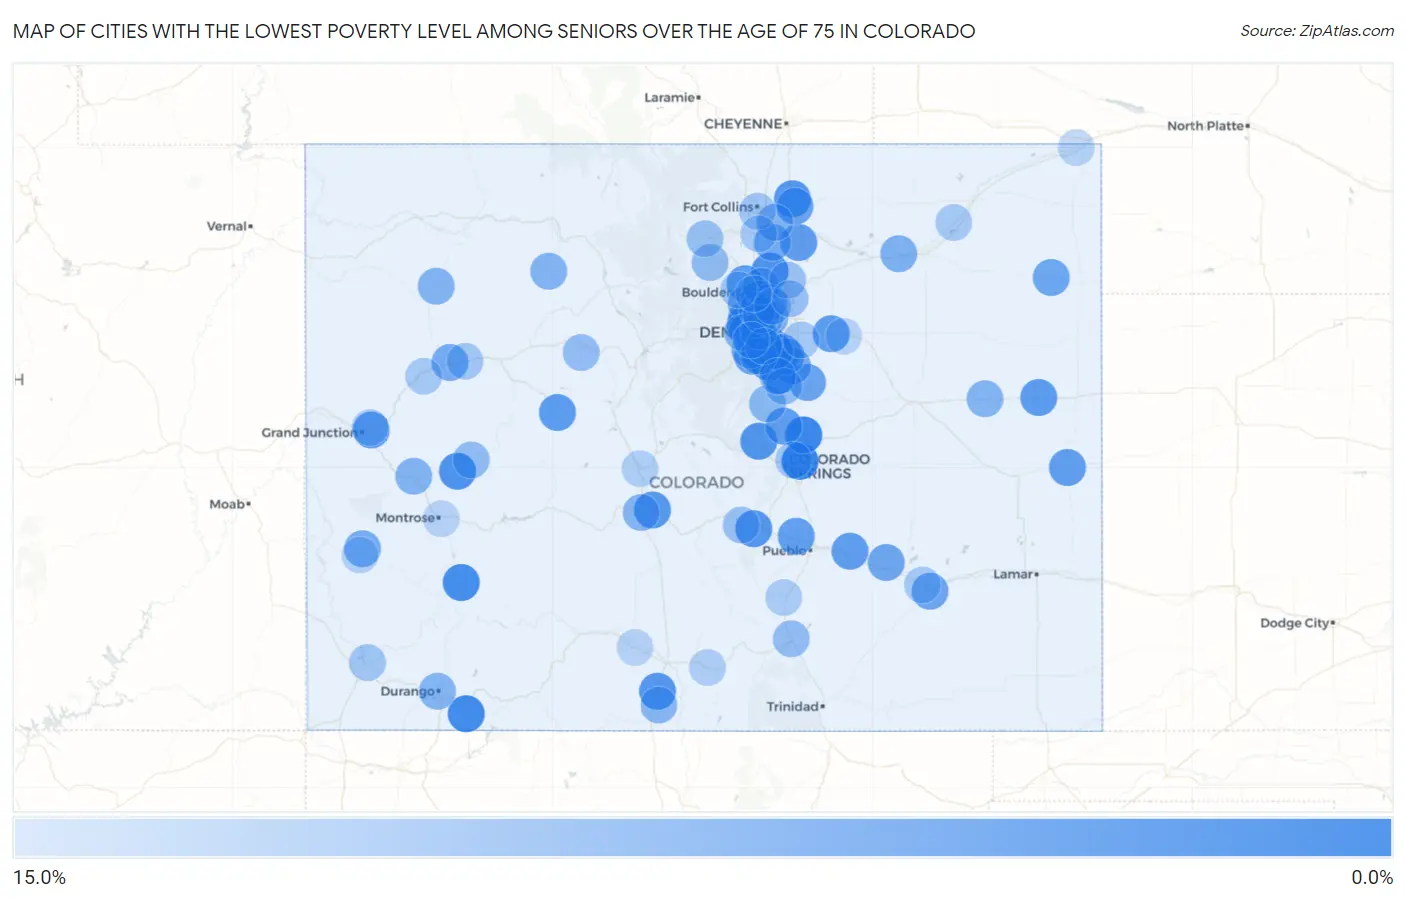
Map of Cities with the Lowest Poverty Level Among Seniors Over the Age of 75 in Colorado
15.0%
0.0%
Cities with the Lowest Poverty Level Among Seniors Over the Age of 75 in Colorado
| City | Senior Poverty | vs State | vs National | |
| 1. | Cimarron Hills | 0.47% | 8.9%(-8.41)#1 | 11.1%(-10.6)#50 |
| 2. | Park Center | 0.60% | 8.9%(-8.29)#2 | 11.1%(-10.5)#70 |
| 3. | Black Forest | 0.84% | 8.9%(-8.05)#3 | 11.1%(-10.2)#114 |
| 4. | Ignacio | 1.4% | 8.9%(-7.53)#4 | 11.1%(-9.72)#237 |
| 5. | Cherry Hills Village | 1.4% | 8.9%(-7.52)#5 | 11.1%(-9.70)#243 |
| 6. | Ouray | 1.5% | 8.9%(-7.35)#6 | 11.1%(-9.53)#312 |
| 7. | Columbine Valley | 1.7% | 8.9%(-7.20)#7 | 11.1%(-9.38)#379 |
| 8. | Fairmount | 1.9% | 8.9%(-6.97)#8 | 11.1%(-9.15)#477 |
| 9. | Hotchkiss | 2.2% | 8.9%(-6.65)#9 | 11.1%(-8.83)#680 |
| 10. | Castle Pines | 2.3% | 8.9%(-6.57)#10 | 11.1%(-8.75)#732 |
| 11. | Firestone | 2.4% | 8.9%(-6.48)#11 | 11.1%(-8.66)#781 |
| 12. | Woodland Park | 2.7% | 8.9%(-6.23)#12 | 11.1%(-8.41)#968 |
| 13. | Pierce | 2.8% | 8.9%(-6.11)#13 | 11.1%(-8.29)#1,061 |
| 14. | Florence | 2.8% | 8.9%(-6.08)#14 | 11.1%(-8.26)#1,083 |
| 15. | La Jara | 2.9% | 8.9%(-6.03)#15 | 11.1%(-8.21)#1,134 |
| 16. | Salida | 3.0% | 8.9%(-5.90)#16 | 11.1%(-8.08)#1,233 |
| 17. | Highlands Ranch | 3.1% | 8.9%(-5.80)#17 | 11.1%(-7.98)#1,310 |
| 18. | Stratton | 3.3% | 8.9%(-5.55)#18 | 11.1%(-7.73)#1,525 |
| 19. | Bennett | 3.4% | 8.9%(-5.53)#19 | 11.1%(-7.71)#1,552 |
| 20. | Gunbarrel | 3.4% | 8.9%(-5.48)#20 | 11.1%(-7.67)#1,601 |
| 21. | Aspen | 3.4% | 8.9%(-5.44)#21 | 11.1%(-7.62)#1,626 |
| 22. | Bow Mar | 3.5% | 8.9%(-5.40)#22 | 11.1%(-7.58)#1,671 |
| 23. | Englewood | 3.5% | 8.9%(-5.35)#23 | 11.1%(-7.53)#1,704 |
| 24. | Woodmoor | 3.6% | 8.9%(-5.24)#24 | 11.1%(-7.42)#1,815 |
| 25. | Clifton | 3.7% | 8.9%(-5.21)#25 | 11.1%(-7.39)#1,843 |
| 26. | La Salle | 3.7% | 8.9%(-5.15)#26 | 11.1%(-7.34)#1,896 |
| 27. | Cheyenne Wells | 3.8% | 8.9%(-5.11)#27 | 11.1%(-7.29)#1,944 |
| 28. | Boone | 3.8% | 8.9%(-5.11)#28 | 11.1%(-7.29)#1,954 |
| 29. | Pueblo West | 3.9% | 8.9%(-5.00)#29 | 11.1%(-7.18)#2,056 |
| 30. | Ken Caryl | 4.2% | 8.9%(-4.69)#30 | 11.1%(-6.87)#2,377 |
| 31. | Ault | 4.3% | 8.9%(-4.54)#31 | 11.1%(-6.72)#2,518 |
| 32. | Ponderosa Park | 4.4% | 8.9%(-4.48)#32 | 11.1%(-6.66)#2,587 |
| 33. | Eckley | 4.8% | 8.9%(-4.12)#33 | 11.1%(-6.31)#2,959 |
| 34. | Olney Springs | 4.9% | 8.9%(-4.01)#34 | 11.1%(-6.19)#3,071 |
| 35. | Arvada | 4.9% | 8.9%(-3.95)#35 | 11.1%(-6.14)#3,122 |
| 36. | Centennial | 5.0% | 8.9%(-3.93)#36 | 11.1%(-6.11)#3,153 |
| 37. | La Junta | 5.0% | 8.9%(-3.89)#37 | 11.1%(-6.07)#3,184 |
| 38. | Parker | 5.1% | 8.9%(-3.78)#38 | 11.1%(-5.96)#3,316 |
| 39. | Superior | 5.2% | 8.9%(-3.68)#39 | 11.1%(-5.86)#3,410 |
| 40. | Applewood | 5.2% | 8.9%(-3.67)#40 | 11.1%(-5.85)#3,415 |
| 41. | Dakota Ridge | 5.3% | 8.9%(-3.63)#41 | 11.1%(-5.81)#3,439 |
| 42. | Dove Valley | 5.3% | 8.9%(-3.62)#42 | 11.1%(-5.80)#3,444 |
| 43. | Broomfield | 5.3% | 8.9%(-3.62)#43 | 11.1%(-5.80)#3,503 |
| 44. | Rifle | 5.4% | 8.9%(-3.45)#44 | 11.1%(-5.64)#3,636 |
| 45. | Johnstown | 5.4% | 8.9%(-3.45)#45 | 11.1%(-5.63)#3,648 |
| 46. | Greenwood Village | 5.5% | 8.9%(-3.41)#46 | 11.1%(-5.59)#3,666 |
| 47. | Nucla | 5.6% | 8.9%(-3.25)#47 | 11.1%(-5.43)#3,860 |
| 48. | Welby | 6.0% | 8.9%(-2.89)#48 | 11.1%(-5.07)#4,248 |
| 49. | Log Lane Village | 6.2% | 8.9%(-2.64)#49 | 11.1%(-4.82)#4,531 |
| 50. | Sherrelwood | 6.4% | 8.9%(-2.51)#50 | 11.1%(-4.69)#4,677 |
| 51. | Windsor | 6.4% | 8.9%(-2.47)#51 | 11.1%(-4.65)#4,716 |
| 52. | Yampa | 6.7% | 8.9%(-2.22)#52 | 11.1%(-4.40)#4,989 |
| 53. | Delta | 6.7% | 8.9%(-2.21)#53 | 11.1%(-4.39)#5,027 |
| 54. | Meeker | 6.7% | 8.9%(-2.17)#54 | 11.1%(-4.36)#5,051 |
| 55. | Flagler | 6.8% | 8.9%(-2.05)#55 | 11.1%(-4.23)#5,154 |
| 56. | Golden | 6.8% | 8.9%(-2.04)#56 | 11.1%(-4.22)#5,156 |
| 57. | Durango | 6.9% | 8.9%(-2.03)#57 | 11.1%(-4.21)#5,169 |
| 58. | Poncha Springs | 6.9% | 8.9%(-1.99)#58 | 11.1%(-4.17)#5,214 |
| 59. | Northglenn | 6.9% | 8.9%(-1.95)#59 | 11.1%(-4.13)#5,274 |
| 60. | Manassa | 7.0% | 8.9%(-1.84)#60 | 11.1%(-4.02)#5,368 |
| 61. | Columbine | 7.1% | 8.9%(-1.75)#61 | 11.1%(-3.93)#5,435 |
| 62. | Perry Park | 7.2% | 8.9%(-1.69)#62 | 11.1%(-3.87)#5,526 |
| 63. | Edgewater | 7.4% | 8.9%(-1.44)#63 | 11.1%(-3.62)#5,773 |
| 64. | Westminster | 7.5% | 8.9%(-1.36)#64 | 11.1%(-3.54)#5,851 |
| 65. | Shaw Heights | 7.6% | 8.9%(-1.26)#65 | 11.1%(-3.44)#5,916 |
| 66. | Twin Lakes Cdp Adams County | 7.7% | 8.9%(-1.19)#66 | 11.1%(-3.37)#5,953 |
| 67. | Paonia | 7.8% | 8.9%(-1.04)#67 | 11.1%(-3.22)#6,129 |
| 68. | Allenspark | 7.8% | 8.9%(-1.04)#68 | 11.1%(-3.22)#6,138 |
| 69. | Castle Rock | 7.9% | 8.9%(-1.03)#69 | 11.1%(-3.21)#6,146 |
| 70. | Walsenburg | 8.0% | 8.9%(-0.897)#70 | 11.1%(-3.08)#6,251 |
| 71. | Erie | 8.0% | 8.9%(-0.850)#71 | 11.1%(-3.03)#6,323 |
| 72. | Edwards | 8.1% | 8.9%(-0.815)#72 | 11.1%(-3.00)#6,350 |
| 73. | Thornton | 8.1% | 8.9%(-0.780)#73 | 11.1%(-2.96)#6,375 |
| 74. | Sheridan | 8.2% | 8.9%(-0.642)#74 | 11.1%(-2.82)#6,508 |
| 75. | Fort Lupton | 8.4% | 8.9%(-0.511)#75 | 11.1%(-2.69)#6,685 |
| 76. | Lincoln Park | 8.4% | 8.9%(-0.506)#76 | 11.1%(-2.69)#6,689 |
| 77. | Brighton | 8.4% | 8.9%(-0.460)#77 | 11.1%(-2.64)#6,723 |
| 78. | Estes Park | 8.5% | 8.9%(-0.375)#78 | 11.1%(-2.56)#6,787 |
| 79. | Castle Pines Village | 8.7% | 8.9%(-0.163)#79 | 11.1%(-2.34)#7,004 |
| 80. | Fort Collins | 9.1% | 8.9%(+0.192)#80 | 11.1%(-1.99)#7,286 |
| 81. | Dolores | 9.1% | 8.9%(+0.205)#81 | 11.1%(-1.98)#7,321 |
| 82. | Colorado Springs | 9.1% | 8.9%(+0.226)#82 | 11.1%(-1.95)#7,415 |
| 83. | Silt | 9.3% | 8.9%(+0.374)#83 | 11.1%(-1.81)#7,521 |
| 84. | Aurora | 9.3% | 8.9%(+0.432)#84 | 11.1%(-1.75)#7,577 |
| 85. | Loveland | 9.4% | 8.9%(+0.524)#85 | 11.1%(-1.66)#7,654 |
| 86. | Lakewood | 9.4% | 8.9%(+0.561)#86 | 11.1%(-1.62)#7,679 |
| 87. | Merino | 9.5% | 8.9%(+0.638)#87 | 11.1%(-1.54)#7,776 |
| 88. | Boulder | 9.6% | 8.9%(+0.729)#88 | 11.1%(-1.45)#7,839 |
| 89. | Battlement Mesa | 9.6% | 8.9%(+0.730)#89 | 11.1%(-1.45)#7,840 |
| 90. | Swink | 9.6% | 8.9%(+0.730)#90 | 11.1%(-1.45)#7,845 |
| 91. | Colorado City | 9.8% | 8.9%(+0.930)#91 | 11.1%(-1.25)#8,041 |
| 92. | Blanca | 10.0% | 8.9%(+1.11)#92 | 11.1%(-1.07)#8,219 |
| 93. | Lafayette | 10.1% | 8.9%(+1.24)#93 | 11.1%(-0.938)#8,342 |
| 94. | Fruitvale | 10.2% | 8.9%(+1.28)#94 | 11.1%(-0.906)#8,371 |
| 95. | Johnson Village | 10.3% | 8.9%(+1.37)#95 | 11.1%(-0.811)#8,455 |
| 96. | Naturita | 10.4% | 8.9%(+1.53)#96 | 11.1%(-0.650)#8,598 |
| 97. | Julesburg | 10.6% | 8.9%(+1.75)#97 | 11.1%(-0.429)#8,813 |
| 98. | Montrose | 10.7% | 8.9%(+1.84)#98 | 11.1%(-0.337)#8,887 |
| 99. | Monte Vista | 10.7% | 8.9%(+1.86)#99 | 11.1%(-0.321)#8,901 |
| 100. | Strasburg | 10.8% | 8.9%(+1.87)#100 | 11.1%(-0.314)#8,904 |
Common Questions
What are the Top 10 Cities with the Lowest Poverty Level Among Seniors Over the Age of 75 in Colorado?
Top 10 Cities with the Lowest Poverty Level Among Seniors Over the Age of 75 in Colorado are:
#1
0.47%
#2
0.84%
#3
1.4%
#4
1.4%
#5
1.5%
#6
1.7%
#7
1.9%
#8
2.2%
#9
2.3%
#10
2.4%
What city has the Lowest Poverty Level Among Seniors Over the Age of 75 in Colorado?
Cimarron Hills has the Lowest Poverty Level Among Seniors Over the Age of 75 in Colorado with 0.47%.
What is the Poverty Level Among Seniors Over the Age of 75 in the State of Colorado?
Poverty Level Among Seniors Over the Age of 75 in Colorado is 8.9%.
What is the Poverty Level Among Seniors Over the Age of 75 in the United States?
Poverty Level Among Seniors Over the Age of 75 in the United States is 11.1%.