Cities with the Lowest Poverty Level Among Seniors Over the Age of 75 in Missouri
RELATED REPORTS & OPTIONS
Lowest Poverty | Seniors 75+
Missouri
Compare Cities
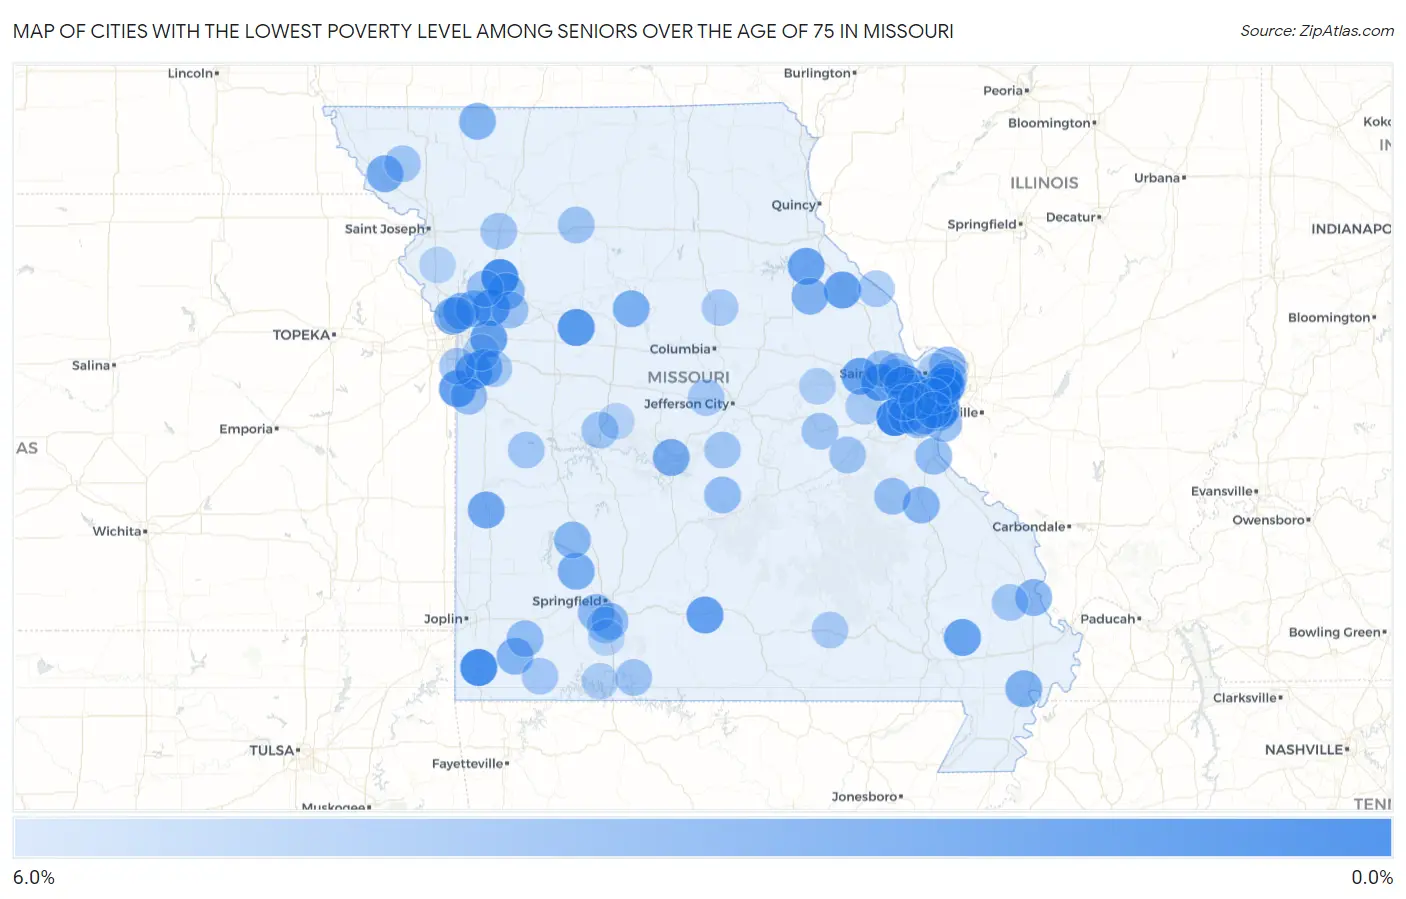
Map of Cities with the Lowest Poverty Level Among Seniors Over the Age of 75 in Missouri
6.0%
0.0%
Cities with the Lowest Poverty Level Among Seniors Over the Age of 75 in Missouri
| City | Senior Poverty | vs State | vs National | |
| 1. | Pacific | 0.17% | 10.5%(-10.4)#1 | 11.1%(-10.9)#9 |
| 2. | Goodman | 0.85% | 10.5%(-9.68)#2 | 11.1%(-10.2)#117 |
| 3. | Lawson | 0.96% | 10.5%(-9.57)#3 | 11.1%(-10.1)#133 |
| 4. | Lakeshire | 1.0% | 10.5%(-9.53)#4 | 11.1%(-10.1)#142 |
| 5. | Des Peres | 1.3% | 10.5%(-9.19)#5 | 11.1%(-9.72)#235 |
| 6. | New Melle | 1.4% | 10.5%(-9.11)#6 | 11.1%(-9.64)#268 |
| 7. | Weldon Spring | 1.5% | 10.5%(-9.03)#7 | 11.1%(-9.56)#297 |
| 8. | Alma | 1.5% | 10.5%(-9.02)#8 | 11.1%(-9.55)#300 |
| 9. | Grantwood Village | 1.6% | 10.5%(-8.95)#9 | 11.1%(-9.48)#335 |
| 10. | Missouri City | 1.7% | 10.5%(-8.81)#10 | 11.1%(-9.34)#397 |
| 11. | Cleveland | 1.8% | 10.5%(-8.76)#11 | 11.1%(-9.30)#412 |
| 12. | Norwood | 2.0% | 10.5%(-8.53)#12 | 11.1%(-9.07)#518 |
| 13. | Bowling Green | 2.0% | 10.5%(-8.49)#13 | 11.1%(-9.03)#542 |
| 14. | Lake Tapawingo | 2.0% | 10.5%(-8.49)#14 | 11.1%(-9.03)#547 |
| 15. | Innsbrook | 2.1% | 10.5%(-8.43)#15 | 11.1%(-8.96)#596 |
| 16. | Huntleigh | 2.2% | 10.5%(-8.36)#16 | 11.1%(-8.89)#642 |
| 17. | Eureka | 2.2% | 10.5%(-8.33)#17 | 11.1%(-8.87)#656 |
| 18. | Center | 2.2% | 10.5%(-8.31)#18 | 11.1%(-8.84)#670 |
| 19. | Ladue | 2.2% | 10.5%(-8.29)#19 | 11.1%(-8.83)#683 |
| 20. | Puxico | 2.3% | 10.5%(-8.26)#20 | 11.1%(-8.79)#703 |
| 21. | Pasadena Hills | 2.4% | 10.5%(-8.10)#21 | 11.1%(-8.63)#805 |
| 22. | Nevada | 2.5% | 10.5%(-8.07)#22 | 11.1%(-8.61)#824 |
| 23. | Raymore | 2.5% | 10.5%(-8.05)#23 | 11.1%(-8.58)#847 |
| 24. | Crystal Lake Park | 2.6% | 10.5%(-7.97)#24 | 11.1%(-8.50)#902 |
| 25. | Bel Nor | 2.7% | 10.5%(-7.86)#25 | 11.1%(-8.39)#981 |
| 26. | Town And Country | 2.7% | 10.5%(-7.81)#26 | 11.1%(-8.34)#1,030 |
| 27. | Mound City | 2.7% | 10.5%(-7.79)#27 | 11.1%(-8.33)#1,039 |
| 28. | Riverside | 2.8% | 10.5%(-7.72)#28 | 11.1%(-8.25)#1,097 |
| 29. | Village Of Four Seasons | 2.8% | 10.5%(-7.69)#29 | 11.1%(-8.22)#1,116 |
| 30. | Lake Winnebago | 2.9% | 10.5%(-7.65)#30 | 11.1%(-8.18)#1,150 |
| 31. | Walnut Grove | 2.9% | 10.5%(-7.64)#31 | 11.1%(-8.17)#1,166 |
| 32. | Crestwood | 2.9% | 10.5%(-7.58)#32 | 11.1%(-8.12)#1,204 |
| 33. | Slater | 3.0% | 10.5%(-7.58)#33 | 11.1%(-8.11)#1,210 |
| 34. | Lilbourn | 3.1% | 10.5%(-7.46)#34 | 11.1%(-7.99)#1,303 |
| 35. | Gladstone | 3.1% | 10.5%(-7.41)#35 | 11.1%(-7.94)#1,356 |
| 36. | Vandalia | 3.1% | 10.5%(-7.39)#36 | 11.1%(-7.92)#1,365 |
| 37. | Fairview | 3.2% | 10.5%(-7.31)#37 | 11.1%(-7.84)#1,440 |
| 38. | Grant City | 3.3% | 10.5%(-7.20)#38 | 11.1%(-7.73)#1,521 |
| 39. | Wood Heights | 3.4% | 10.5%(-7.14)#39 | 11.1%(-7.68)#1,590 |
| 40. | Desloge | 3.4% | 10.5%(-7.13)#40 | 11.1%(-7.66)#1,604 |
| 41. | Scott City | 3.5% | 10.5%(-7.07)#41 | 11.1%(-7.60)#1,655 |
| 42. | Fair Play | 3.5% | 10.5%(-7.03)#42 | 11.1%(-7.56)#1,683 |
| 43. | Glenaire | 3.6% | 10.5%(-6.96)#43 | 11.1%(-7.50)#1,751 |
| 44. | Old Jamestown | 3.7% | 10.5%(-6.88)#44 | 11.1%(-7.41)#1,822 |
| 45. | Battlefield | 3.7% | 10.5%(-6.87)#45 | 11.1%(-7.40)#1,837 |
| 46. | Concord | 3.7% | 10.5%(-6.79)#46 | 11.1%(-7.32)#1,909 |
| 47. | Dardenne Prairie | 3.8% | 10.5%(-6.74)#47 | 11.1%(-7.27)#1,978 |
| 48. | Pierce City | 3.8% | 10.5%(-6.69)#48 | 11.1%(-7.22)#2,007 |
| 49. | Oakland | 3.9% | 10.5%(-6.66)#49 | 11.1%(-7.20)#2,046 |
| 50. | Festus | 3.9% | 10.5%(-6.64)#50 | 11.1%(-7.17)#2,073 |
| 51. | Oakville | 3.9% | 10.5%(-6.63)#51 | 11.1%(-7.16)#2,082 |
| 52. | Crocker | 3.9% | 10.5%(-6.59)#52 | 11.1%(-7.12)#2,123 |
| 53. | Fremont Hills | 4.0% | 10.5%(-6.57)#53 | 11.1%(-7.11)#2,139 |
| 54. | Freeman | 4.0% | 10.5%(-6.53)#54 | 11.1%(-7.07)#2,180 |
| 55. | Potosi | 4.0% | 10.5%(-6.49)#55 | 11.1%(-7.02)#2,219 |
| 56. | Northwoods | 4.1% | 10.5%(-6.46)#56 | 11.1%(-6.99)#2,248 |
| 57. | Dellwood | 4.1% | 10.5%(-6.46)#57 | 11.1%(-6.99)#2,249 |
| 58. | Orrick | 4.1% | 10.5%(-6.45)#58 | 11.1%(-6.99)#2,262 |
| 59. | Parkdale | 4.2% | 10.5%(-6.37)#59 | 11.1%(-6.90)#2,356 |
| 60. | Wentzville | 4.2% | 10.5%(-6.36)#60 | 11.1%(-6.89)#2,366 |
| 61. | Kearney | 4.2% | 10.5%(-6.34)#61 | 11.1%(-6.87)#2,381 |
| 62. | Chesterfield | 4.2% | 10.5%(-6.30)#62 | 11.1%(-6.83)#2,410 |
| 63. | Cool Valley | 4.3% | 10.5%(-6.25)#63 | 11.1%(-6.78)#2,461 |
| 64. | Loch Lloyd | 4.3% | 10.5%(-6.23)#64 | 11.1%(-6.77)#2,475 |
| 65. | Lincoln | 4.3% | 10.5%(-6.19)#65 | 11.1%(-6.72)#2,519 |
| 66. | Kissee Mills | 4.3% | 10.5%(-6.19)#66 | 11.1%(-6.72)#2,522 |
| 67. | Rosebud | 4.3% | 10.5%(-6.19)#67 | 11.1%(-6.72)#2,532 |
| 68. | Sullivan | 4.4% | 10.5%(-6.16)#68 | 11.1%(-6.70)#2,560 |
| 69. | Chillicothe | 4.4% | 10.5%(-6.13)#69 | 11.1%(-6.66)#2,591 |
| 70. | Montrose | 4.4% | 10.5%(-6.09)#70 | 11.1%(-6.62)#2,636 |
| 71. | Cameron | 4.5% | 10.5%(-6.06)#71 | 11.1%(-6.59)#2,653 |
| 72. | O Fallon | 4.5% | 10.5%(-6.03)#72 | 11.1%(-6.56)#2,687 |
| 73. | Nixa | 4.5% | 10.5%(-6.03)#73 | 11.1%(-6.56)#2,689 |
| 74. | Pleasant Hill | 4.5% | 10.5%(-6.01)#74 | 11.1%(-6.54)#2,702 |
| 75. | St Elizabeth | 4.5% | 10.5%(-5.99)#75 | 11.1%(-6.52)#2,744 |
| 76. | Delta | 4.5% | 10.5%(-5.99)#76 | 11.1%(-6.52)#2,746 |
| 77. | Maitland | 4.5% | 10.5%(-5.99)#77 | 11.1%(-6.52)#2,754 |
| 78. | High Ridge | 4.6% | 10.5%(-5.95)#78 | 11.1%(-6.48)#2,785 |
| 79. | Cassville | 4.6% | 10.5%(-5.91)#79 | 11.1%(-6.45)#2,825 |
| 80. | Clarksville | 4.7% | 10.5%(-5.88)#80 | 11.1%(-6.42)#2,862 |
| 81. | Centertown | 4.7% | 10.5%(-5.88)#81 | 11.1%(-6.42)#2,864 |
| 82. | Clayton | 4.7% | 10.5%(-5.88)#82 | 11.1%(-6.41)#2,865 |
| 83. | Weldon Spring Heights | 4.8% | 10.5%(-5.77)#83 | 11.1%(-6.31)#2,972 |
| 84. | Murphy | 4.8% | 10.5%(-5.74)#84 | 11.1%(-6.27)#2,993 |
| 85. | Winona | 4.8% | 10.5%(-5.71)#85 | 11.1%(-6.25)#3,017 |
| 86. | Sturgeon | 4.8% | 10.5%(-5.70)#86 | 11.1%(-6.23)#3,036 |
| 87. | Washington | 4.9% | 10.5%(-5.62)#87 | 11.1%(-6.15)#3,103 |
| 88. | Wildwood | 4.9% | 10.5%(-5.60)#88 | 11.1%(-6.13)#3,130 |
| 89. | Hermann | 4.9% | 10.5%(-5.59)#89 | 11.1%(-6.12)#3,146 |
| 90. | Indian Point | 5.0% | 10.5%(-5.53)#90 | 11.1%(-6.07)#3,208 |
| 91. | Northmoor | 5.0% | 10.5%(-5.53)#91 | 11.1%(-6.07)#3,212 |
| 92. | Velda City | 5.0% | 10.5%(-5.49)#92 | 11.1%(-6.02)#3,255 |
| 93. | Hazelwood | 5.1% | 10.5%(-5.48)#93 | 11.1%(-6.01)#3,272 |
| 94. | Frontenac | 5.1% | 10.5%(-5.48)#94 | 11.1%(-6.01)#3,273 |
| 95. | Ballwin | 5.2% | 10.5%(-5.33)#95 | 11.1%(-5.87)#3,404 |
| 96. | Lee S Summit | 5.2% | 10.5%(-5.33)#96 | 11.1%(-5.87)#3,405 |
| 97. | Highlandville | 5.3% | 10.5%(-5.27)#97 | 11.1%(-5.80)#3,461 |
| 98. | Dearborn | 5.3% | 10.5%(-5.27)#98 | 11.1%(-5.80)#3,479 |
| 99. | Sunset Hills | 5.3% | 10.5%(-5.26)#99 | 11.1%(-5.79)#3,511 |
| 100. | Cole Camp | 5.3% | 10.5%(-5.21)#100 | 11.1%(-5.74)#3,543 |
Common Questions
What are the Top 10 Cities with the Lowest Poverty Level Among Seniors Over the Age of 75 in Missouri?
Top 10 Cities with the Lowest Poverty Level Among Seniors Over the Age of 75 in Missouri are:
#1
0.17%
#2
0.85%
#3
0.96%
#4
1.0%
#5
1.3%
#6
1.4%
#7
1.5%
#8
1.5%
#9
1.6%
#10
1.7%
What city has the Lowest Poverty Level Among Seniors Over the Age of 75 in Missouri?
Pacific has the Lowest Poverty Level Among Seniors Over the Age of 75 in Missouri with 0.17%.
What is the Poverty Level Among Seniors Over the Age of 75 in the State of Missouri?
Poverty Level Among Seniors Over the Age of 75 in Missouri is 10.5%.
What is the Poverty Level Among Seniors Over the Age of 75 in the United States?
Poverty Level Among Seniors Over the Age of 75 in the United States is 11.1%.