Cities with the Lowest Poverty Level Among Seniors Over the Age of 75 in Connecticut
RELATED REPORTS & OPTIONS
Lowest Poverty | Seniors 75+
Connecticut
Compare Cities
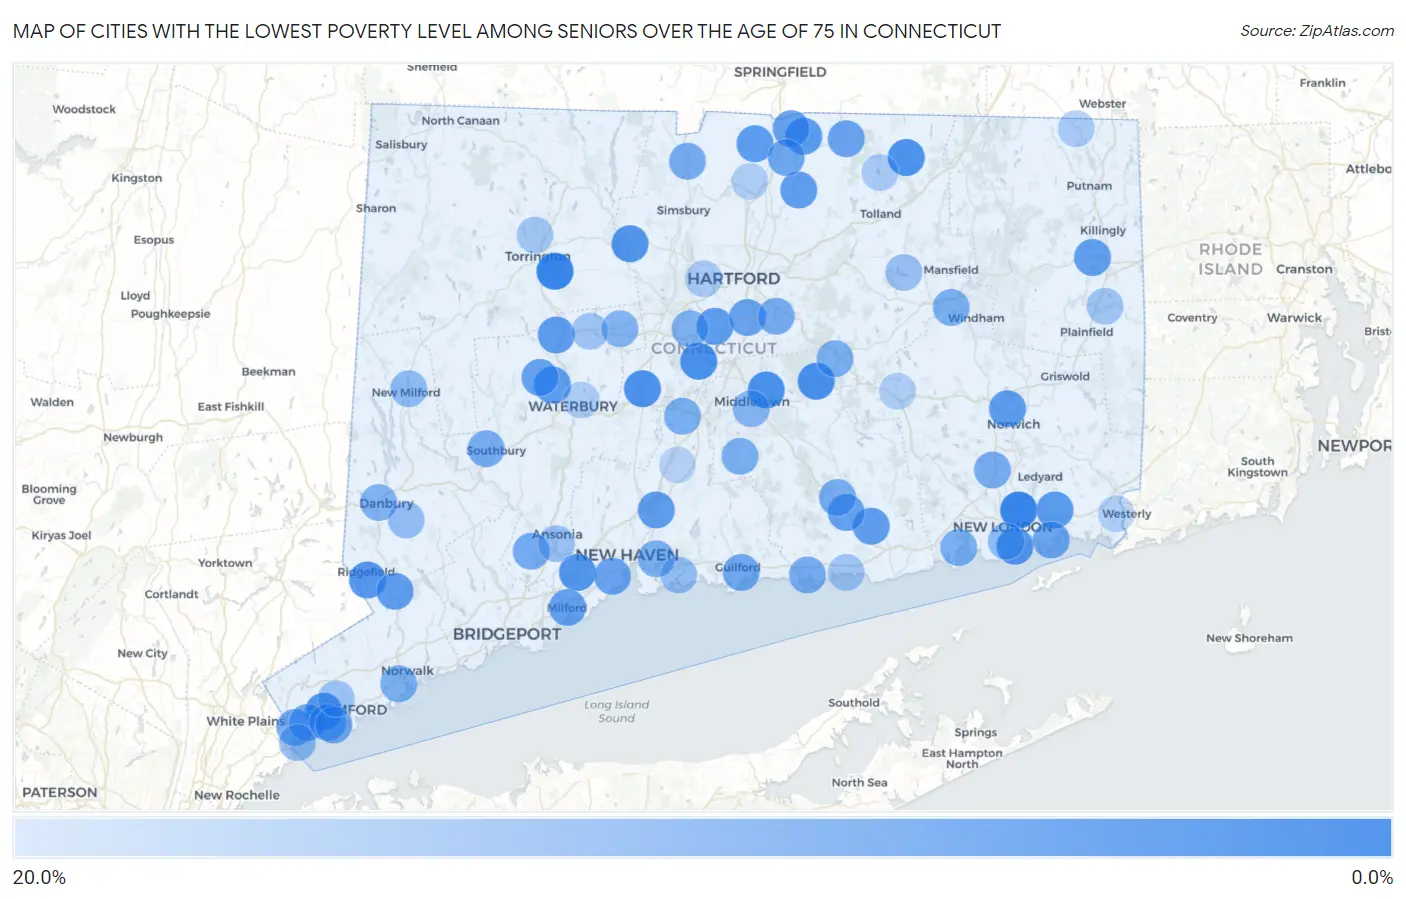
Map of Cities with the Lowest Poverty Level Among Seniors Over the Age of 75 in Connecticut
20.0%
0.0%
Cities with the Lowest Poverty Level Among Seniors Over the Age of 75 in Connecticut
| City | Senior Poverty | vs State | vs National | |
| 1. | Conning Towers Nautilus Park | 0.27% | 8.8%(-8.55)#1 | 11.1%(-10.8)#20 |
| 2. | Northwest Harwinton | 0.37% | 8.8%(-8.45)#2 | 11.1%(-10.7)#38 |
| 3. | Tashua | 0.56% | 8.8%(-8.26)#3 | 11.1%(-10.5)#63 |
| 4. | Groton Long Point Borough | 1.9% | 8.8%(-6.88)#4 | 11.1%(-9.13)#487 |
| 5. | Lake Pocotopaug | 2.4% | 8.8%(-6.44)#5 | 11.1%(-8.69)#760 |
| 6. | Portland | 2.5% | 8.8%(-6.32)#6 | 11.1%(-8.57)#856 |
| 7. | Kensington | 2.6% | 8.8%(-6.27)#7 | 11.1%(-8.52)#890 |
| 8. | Stafford Springs | 2.7% | 8.8%(-6.10)#8 | 11.1%(-8.34)#1,025 |
| 9. | Plantsville | 2.8% | 8.8%(-6.03)#9 | 11.1%(-8.27)#1,077 |
| 10. | Tokeneke | 2.8% | 8.8%(-6.01)#10 | 11.1%(-8.25)#1,098 |
| 11. | Cos Cob | 3.1% | 8.8%(-5.77)#11 | 11.1%(-8.02)#1,286 |
| 12. | Collinsville | 3.2% | 8.8%(-5.65)#12 | 11.1%(-7.90)#1,381 |
| 13. | Orange | 3.2% | 8.8%(-5.58)#13 | 11.1%(-7.82)#1,456 |
| 14. | Stratford Downtown | 3.3% | 8.8%(-5.47)#14 | 11.1%(-7.72)#1,547 |
| 15. | Trumbull Center | 3.5% | 8.8%(-5.36)#15 | 11.1%(-7.61)#1,652 |
| 16. | Saugatuck | 3.6% | 8.8%(-5.19)#16 | 11.1%(-7.44)#1,800 |
| 17. | Ridgefield | 3.7% | 8.8%(-5.13)#17 | 11.1%(-7.37)#1,856 |
| 18. | Daniels Farm | 3.7% | 8.8%(-5.12)#18 | 11.1%(-7.36)#1,861 |
| 19. | Groton | 3.9% | 8.8%(-4.96)#19 | 11.1%(-7.21)#2,037 |
| 20. | Northford | 4.0% | 8.8%(-4.82)#20 | 11.1%(-7.07)#2,166 |
| 21. | Hazardville | 4.2% | 8.8%(-4.65)#21 | 11.1%(-6.89)#2,364 |
| 22. | Old Mystic | 4.2% | 8.8%(-4.64)#22 | 11.1%(-6.89)#2,367 |
| 23. | Suffield Depot | 4.6% | 8.8%(-4.24)#23 | 11.1%(-6.48)#2,787 |
| 24. | Norwich | 4.6% | 8.8%(-4.19)#24 | 11.1%(-6.44)#2,831 |
| 25. | Lordship | 4.7% | 8.8%(-4.17)#25 | 11.1%(-6.42)#2,854 |
| 26. | Newington | 4.7% | 8.8%(-4.11)#26 | 11.1%(-6.35)#2,904 |
| 27. | Oakville | 4.7% | 8.8%(-4.08)#27 | 11.1%(-6.33)#2,921 |
| 28. | Thomaston | 4.8% | 8.8%(-4.00)#28 | 11.1%(-6.25)#3,013 |
| 29. | North Haven | 4.9% | 8.8%(-3.94)#29 | 11.1%(-6.18)#3,081 |
| 30. | Essex Village | 5.0% | 8.8%(-3.87)#30 | 11.1%(-6.12)#3,150 |
| 31. | Georgetown | 5.0% | 8.8%(-3.82)#31 | 11.1%(-6.07)#3,192 |
| 32. | Broad Brook | 5.1% | 8.8%(-3.74)#32 | 11.1%(-5.99)#3,293 |
| 33. | East Brooklyn | 5.3% | 8.8%(-3.56)#33 | 11.1%(-5.80)#3,454 |
| 34. | Milford City Balance | 5.4% | 8.8%(-3.41)#34 | 11.1%(-5.66)#3,618 |
| 35. | Staples | 5.5% | 8.8%(-3.28)#35 | 11.1%(-5.53)#3,728 |
| 36. | Watertown | 5.6% | 8.8%(-3.27)#36 | 11.1%(-5.51)#3,744 |
| 37. | Ball Pond | 5.6% | 8.8%(-3.27)#37 | 11.1%(-5.51)#3,748 |
| 38. | Deep River Center | 5.7% | 8.8%(-3.16)#38 | 11.1%(-5.41)#3,882 |
| 39. | Sherwood Manor | 5.7% | 8.8%(-3.07)#39 | 11.1%(-5.32)#3,979 |
| 40. | West Haven | 6.0% | 8.8%(-2.83)#40 | 11.1%(-5.07)#4,244 |
| 41. | Somers | 6.0% | 8.8%(-2.79)#41 | 11.1%(-5.03)#4,291 |
| 42. | Wethersfield | 6.1% | 8.8%(-2.77)#42 | 11.1%(-5.01)#4,308 |
| 43. | Pemberwick | 6.6% | 8.8%(-2.23)#43 | 11.1%(-4.47)#4,902 |
| 44. | Southwood Acres | 6.7% | 8.8%(-2.17)#44 | 11.1%(-4.41)#4,938 |
| 45. | Noank | 6.7% | 8.8%(-2.16)#45 | 11.1%(-4.40)#4,957 |
| 46. | Stepney | 6.9% | 8.8%(-1.94)#46 | 11.1%(-4.18)#5,193 |
| 47. | Greenwich | 6.9% | 8.8%(-1.88)#47 | 11.1%(-4.13)#5,273 |
| 48. | Guilford Center | 7.0% | 8.8%(-1.82)#48 | 11.1%(-4.06)#5,335 |
| 49. | Shelton | 7.5% | 8.8%(-1.32)#49 | 11.1%(-3.56)#5,831 |
| 50. | Riverside | 7.5% | 8.8%(-1.30)#50 | 11.1%(-3.55)#5,839 |
| 51. | Old Greenwich | 7.6% | 8.8%(-1.22)#51 | 11.1%(-3.47)#5,900 |
| 52. | Clinton | 7.6% | 8.8%(-1.17)#52 | 11.1%(-3.42)#5,930 |
| 53. | Heritage Village | 7.7% | 8.8%(-1.15)#53 | 11.1%(-3.40)#5,942 |
| 54. | Oxoboxo River | 7.8% | 8.8%(-1.06)#54 | 11.1%(-3.30)#6,074 |
| 55. | Glastonbury Center | 7.8% | 8.8%(-0.996)#55 | 11.1%(-3.24)#6,117 |
| 56. | Salmon Brook | 7.8% | 8.8%(-0.991)#56 | 11.1%(-3.24)#6,122 |
| 57. | Chester Center | 8.0% | 8.8%(-0.868)#57 | 11.1%(-3.11)#6,223 |
| 58. | Terramuggus | 8.3% | 8.8%(-0.566)#58 | 11.1%(-2.81)#6,519 |
| 59. | Durham | 8.3% | 8.8%(-0.540)#59 | 11.1%(-2.78)#6,538 |
| 60. | Niantic | 8.3% | 8.8%(-0.508)#60 | 11.1%(-2.75)#6,558 |
| 61. | East Haven | 8.4% | 8.8%(-0.472)#61 | 11.1%(-2.72)#6,669 |
| 62. | Norwalk | 8.4% | 8.8%(-0.465)#62 | 11.1%(-2.71)#6,675 |
| 63. | Willimantic | 8.4% | 8.8%(-0.440)#63 | 11.1%(-2.68)#6,691 |
| 64. | Meriden | 8.4% | 8.8%(-0.436)#64 | 11.1%(-2.68)#6,694 |
| 65. | Woodmont Borough | 8.5% | 8.8%(-0.361)#65 | 11.1%(-2.61)#6,749 |
| 66. | Litchfield Borough | 8.6% | 8.8%(-0.213)#66 | 11.1%(-2.46)#6,893 |
| 67. | Naugatuck Borough | 8.6% | 8.8%(-0.211)#67 | 11.1%(-2.46)#6,895 |
| 68. | New Britain | 8.9% | 8.8%(+0.031)#68 | 11.1%(-2.21)#7,114 |
| 69. | Danbury | 8.9% | 8.8%(+0.115)#69 | 11.1%(-2.13)#7,199 |
| 70. | Sandy Hook | 9.0% | 8.8%(+0.202)#70 | 11.1%(-2.04)#7,259 |
| 71. | Westport | 9.1% | 8.8%(+0.268)#71 | 11.1%(-1.98)#7,295 |
| 72. | Bristol | 9.3% | 8.8%(+0.478)#72 | 11.1%(-1.77)#7,547 |
| 73. | Route 7 Gateway | 9.4% | 8.8%(+0.605)#73 | 11.1%(-1.64)#7,665 |
| 74. | Middletown | 9.7% | 8.8%(+0.852)#74 | 11.1%(-1.39)#7,888 |
| 75. | New London | 10.2% | 8.8%(+1.36)#75 | 11.1%(-0.889)#8,379 |
| 76. | New Milford | 10.4% | 8.8%(+1.61)#76 | 11.1%(-0.635)#8,607 |
| 77. | Byram | 10.8% | 8.8%(+1.95)#77 | 11.1%(-0.298)#8,918 |
| 78. | Bethel | 11.2% | 8.8%(+2.33)#78 | 11.1%(+0.087)#9,342 |
| 79. | Branford Center | 11.3% | 8.8%(+2.52)#79 | 11.1%(+0.272)#9,438 |
| 80. | South Coventry | 11.7% | 8.8%(+2.83)#80 | 11.1%(+0.584)#9,675 |
| 81. | Derby | 11.9% | 8.8%(+3.03)#81 | 11.1%(+0.790)#9,850 |
| 82. | Oronoque | 12.1% | 8.8%(+3.24)#82 | 11.1%(+0.991)#9,995 |
| 83. | Greens Farms | 12.1% | 8.8%(+3.29)#83 | 11.1%(+1.04)#10,025 |
| 84. | Noroton Heights | 12.3% | 8.8%(+3.52)#84 | 11.1%(+1.28)#10,196 |
| 85. | Stamford | 12.4% | 8.8%(+3.54)#85 | 11.1%(+1.29)#10,212 |
| 86. | Moosup | 12.4% | 8.8%(+3.62)#86 | 11.1%(+1.37)#10,256 |
| 87. | Terryville | 12.5% | 8.8%(+3.72)#87 | 11.1%(+1.47)#10,436 |
| 88. | Westbrook Center | 12.7% | 8.8%(+3.91)#88 | 11.1%(+1.67)#10,566 |
| 89. | Torrington | 13.1% | 8.8%(+4.25)#89 | 11.1%(+2.00)#10,823 |
| 90. | West Hartford | 13.7% | 8.8%(+4.88)#90 | 11.1%(+2.64)#11,294 |
| 91. | Quinebaug | 13.7% | 8.8%(+4.90)#91 | 11.1%(+2.66)#11,315 |
| 92. | Coleytown | 13.7% | 8.8%(+4.91)#92 | 11.1%(+2.67)#11,319 |
| 93. | Crystal Lake | 13.8% | 8.8%(+5.01)#93 | 11.1%(+2.76)#11,372 |
| 94. | Plattsville | 14.1% | 8.8%(+5.24)#94 | 11.1%(+3.00)#11,507 |
| 95. | Colchester | 14.2% | 8.8%(+5.39)#95 | 11.1%(+3.14)#11,591 |
| 96. | Waterbury | 14.4% | 8.8%(+5.56)#96 | 11.1%(+3.32)#11,780 |
| 97. | Windsor Locks | 14.4% | 8.8%(+5.57)#97 | 11.1%(+3.33)#11,785 |
| 98. | Pawcatuck | 14.8% | 8.8%(+5.99)#98 | 11.1%(+3.75)#12,026 |
| 99. | Newtown Borough | 15.2% | 8.8%(+6.39)#99 | 11.1%(+4.15)#12,254 |
| 100. | Wallingford Center | 15.3% | 8.8%(+6.45)#100 | 11.1%(+4.20)#12,288 |
1
2Common Questions
What are the Top 10 Cities with the Lowest Poverty Level Among Seniors Over the Age of 75 in Connecticut?
Top 10 Cities with the Lowest Poverty Level Among Seniors Over the Age of 75 in Connecticut are:
#1
0.27%
#2
0.37%
#3
2.4%
#4
2.5%
#5
2.6%
#6
2.7%
#7
2.8%
#8
3.1%
#9
3.2%
#10
3.2%
What city has the Lowest Poverty Level Among Seniors Over the Age of 75 in Connecticut?
Conning Towers Nautilus Park has the Lowest Poverty Level Among Seniors Over the Age of 75 in Connecticut with 0.27%.
What is the Poverty Level Among Seniors Over the Age of 75 in the State of Connecticut?
Poverty Level Among Seniors Over the Age of 75 in Connecticut is 8.8%.
What is the Poverty Level Among Seniors Over the Age of 75 in the United States?
Poverty Level Among Seniors Over the Age of 75 in the United States is 11.1%.