Corralitos, CA Map & Demographics
Corralitos Map
Corralitos Overview
$80,333
PER CAPITA INCOME
$159,095
AVG FAMILY INCOME
$152,036
AVG HOUSEHOLD INCOME
0.37
INEQUALITY / GINI INDEX
2,154
TOTAL POPULATION
1,150
MALE POPULATION
1,004
FEMALE POPULATION
114.54
MALES / 100 FEMALES
87.30
FEMALES / 100 MALES
60.6
MEDIAN AGE
2.0
AVG FAMILY SIZE
1.9
AVG HOUSEHOLD SIZE
1,200
LABOR FORCE [ PEOPLE ]
56.8%
PERCENT IN LABOR FORCE
10.8%
UNEMPLOYMENT RATE
Income in Corralitos
Income Overview in Corralitos
Per Capita Income in Corralitos is $80,333, while median incomes of families and households are $159,095 and $152,036 respectively.
| Characteristic | Number | Measure |
| Per Capita Income | 2,154 | $80,333 |
| Median Family Income | 786 | $159,095 |
| Mean Family Income | 786 | $171,553 |
| Median Household Income | 1,145 | $152,036 |
| Mean Household Income | 1,145 | $158,270 |
| Income Deficit | 786 | $0 |
| Wage / Income Gap (%) | 2,154 | 0.00% |
| Wage / Income Gap ($) | 2,154 | 100.00¢ per $1 |
| Gini / Inequality Index | 2,154 | 0.37 |
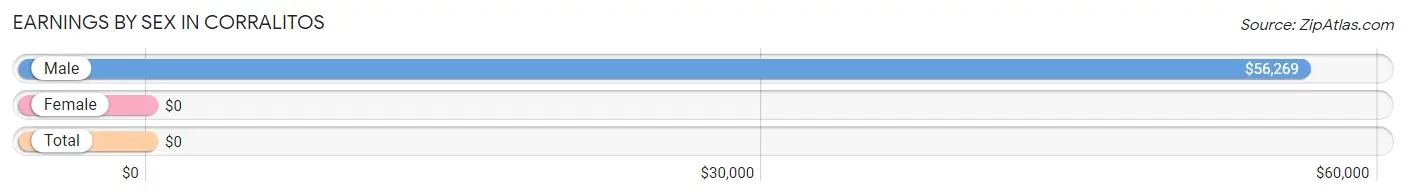
Earnings by Sex in Corralitos
| Sex | Number | Average Earnings |
| Male | 700 (54.5%) | $56,269 |
| Female | 585 (45.5%) | $0 |
| Total | 1,285 (100.0%) | $0 |
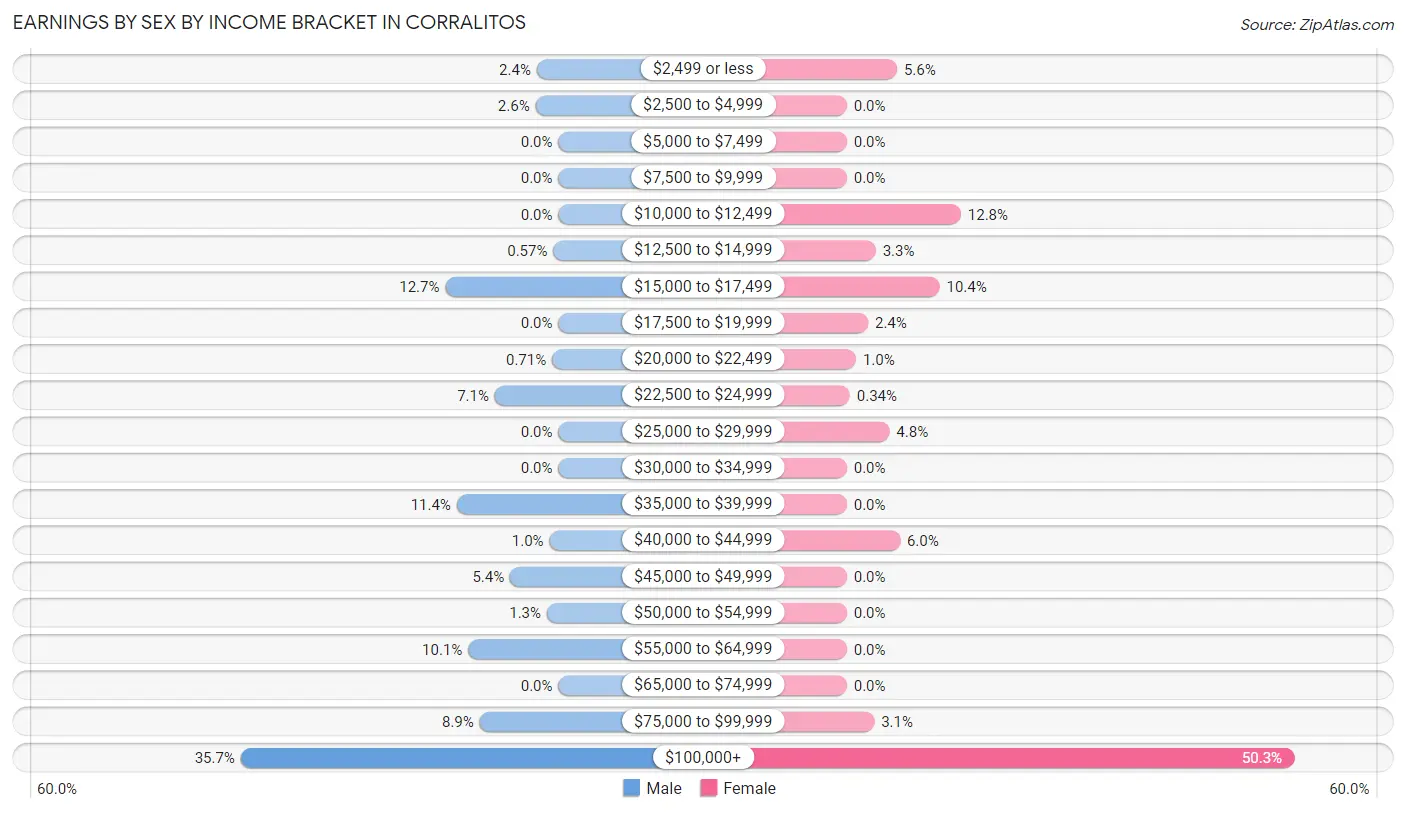
Earnings by Sex by Income Bracket in Corralitos
The most common earnings brackets in Corralitos are $100,000+ for men (250 | 35.7%) and $100,000+ for women (294 | 50.3%).
| Income | Male | Female |
| $2,499 or less | 17 (2.4%) | 33 (5.6%) |
| $2,500 to $4,999 | 18 (2.6%) | 0 (0.0%) |
| $5,000 to $7,499 | 0 (0.0%) | 0 (0.0%) |
| $7,500 to $9,999 | 0 (0.0%) | 0 (0.0%) |
| $10,000 to $12,499 | 0 (0.0%) | 75 (12.8%) |
| $12,500 to $14,999 | 4 (0.6%) | 19 (3.3%) |
| $15,000 to $17,499 | 89 (12.7%) | 61 (10.4%) |
| $17,500 to $19,999 | 0 (0.0%) | 14 (2.4%) |
| $20,000 to $22,499 | 5 (0.7%) | 6 (1.0%) |
| $22,500 to $24,999 | 50 (7.1%) | 2 (0.3%) |
| $25,000 to $29,999 | 0 (0.0%) | 28 (4.8%) |
| $30,000 to $34,999 | 0 (0.0%) | 0 (0.0%) |
| $35,000 to $39,999 | 80 (11.4%) | 0 (0.0%) |
| $40,000 to $44,999 | 7 (1.0%) | 35 (6.0%) |
| $45,000 to $49,999 | 38 (5.4%) | 0 (0.0%) |
| $50,000 to $54,999 | 9 (1.3%) | 0 (0.0%) |
| $55,000 to $64,999 | 71 (10.1%) | 0 (0.0%) |
| $65,000 to $74,999 | 0 (0.0%) | 0 (0.0%) |
| $75,000 to $99,999 | 62 (8.9%) | 18 (3.1%) |
| $100,000+ | 250 (35.7%) | 294 (50.3%) |
| Total | 700 (100.0%) | 585 (100.0%) |
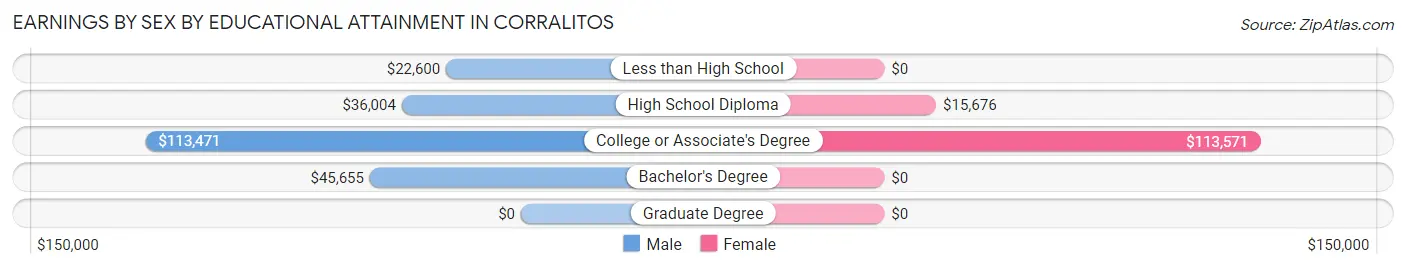
Earnings by Sex by Educational Attainment in Corralitos
| Educational Attainment | Male Income | Female Income |
| Less than High School | $22,600 | $0 |
| High School Diploma | $36,004 | $15,676 |
| College or Associate's Degree | $113,471 | $113,571 |
| Bachelor's Degree | $45,655 | $0 |
| Graduate Degree | - | - |
| Total | $56,269 | $0 |
Family Income in Corralitos
Family Income Brackets in Corralitos
According to the Corralitos family income data, there are 263 families falling into the $200,000+ income range, which is the most common income bracket and makes up 33.5% of all families.
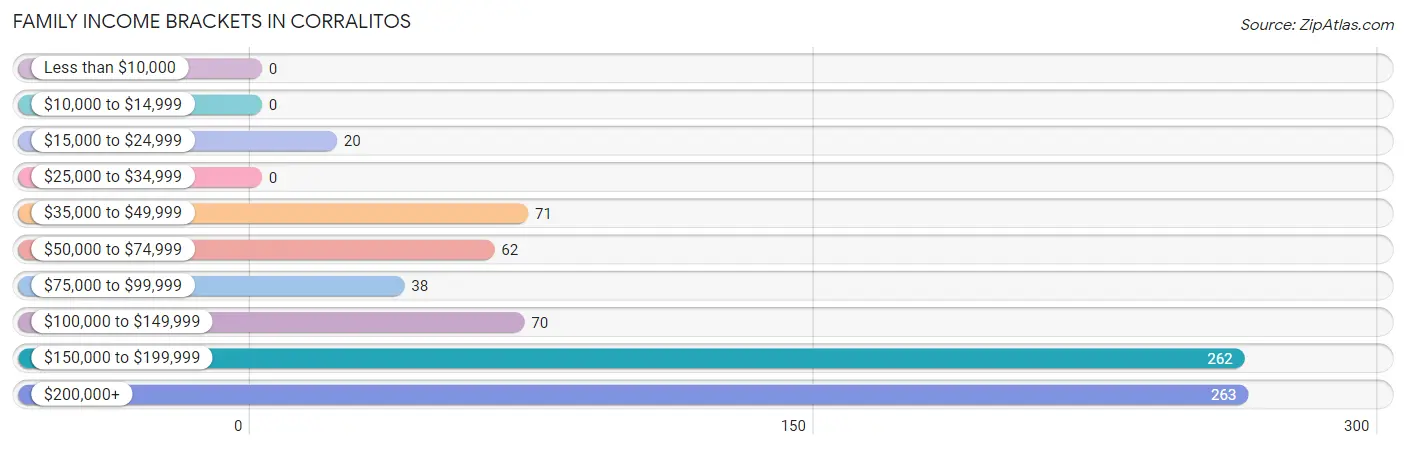
| Income Bracket | # Families | % Families |
| Less than $10,000 | 0 | 0.0% |
| $10,000 to $14,999 | 0 | 0.0% |
| $15,000 to $24,999 | 20 | 2.5% |
| $25,000 to $34,999 | 0 | 0.0% |
| $35,000 to $49,999 | 71 | 9.0% |
| $50,000 to $74,999 | 62 | 7.9% |
| $75,000 to $99,999 | 38 | 4.8% |
| $100,000 to $149,999 | 70 | 8.9% |
| $150,000 to $199,999 | 262 | 33.3% |
| $200,000+ | 263 | 33.5% |
Family Income by Famaliy Size in Corralitos
3-person families (77 | 9.8%) account for the highest median family income in Corralitos with $166,250 per family, while 2-person families (701 | 89.2%) have the highest median income of $79,346 per family member.
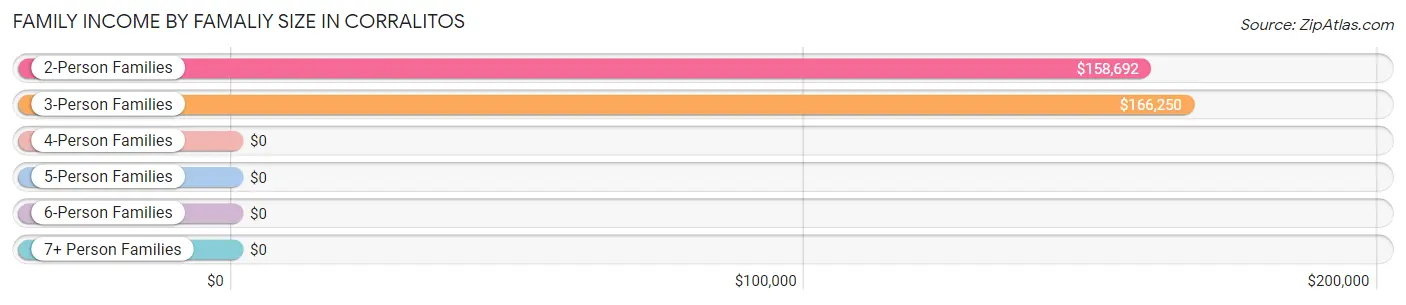
| Income Bracket | # Families | Median Income |
| 2-Person Families | 701 (89.2%) | $158,692 |
| 3-Person Families | 77 (9.8%) | $166,250 |
| 4-Person Families | 0 (0.0%) | $0 |
| 5-Person Families | 2 (0.3%) | $0 |
| 6-Person Families | 0 (0.0%) | $0 |
| 7+ Person Families | 6 (0.8%) | $0 |
| Total | 786 (100.0%) | $159,095 |
Family Income by Number of Earners in Corralitos
The median family income in Corralitos is $159,095, with families comprising 2 earners (417) having the highest median family income of $250,001, while families with 1 earner (101) have the lowest median family income of $111,321, accounting for 53.0% and 12.9% of families, respectively.
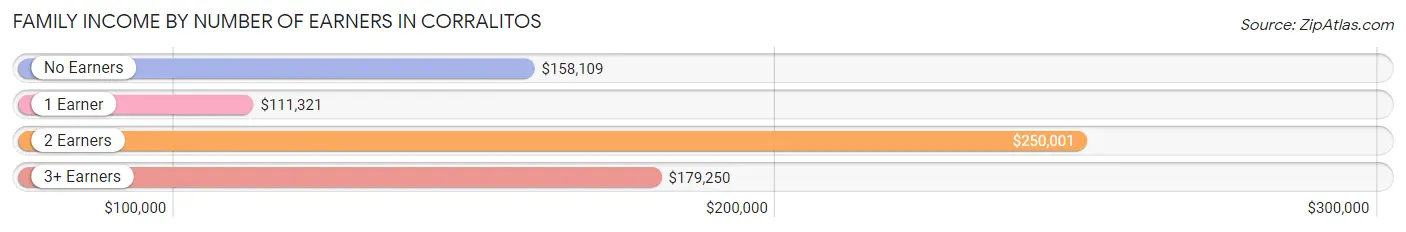
| Number of Earners | # Families | Median Income |
| No Earners | 250 (31.8%) | $158,109 |
| 1 Earner | 101 (12.9%) | $111,321 |
| 2 Earners | 417 (53.0%) | $250,001 |
| 3+ Earners | 18 (2.3%) | $179,250 |
| Total | 786 (100.0%) | $159,095 |
Household Income in Corralitos
Household Income Brackets in Corralitos
With 319 households falling in the category, the $150,000 to $199,999 income range is the most frequent in Corralitos, accounting for 27.9% of all households.
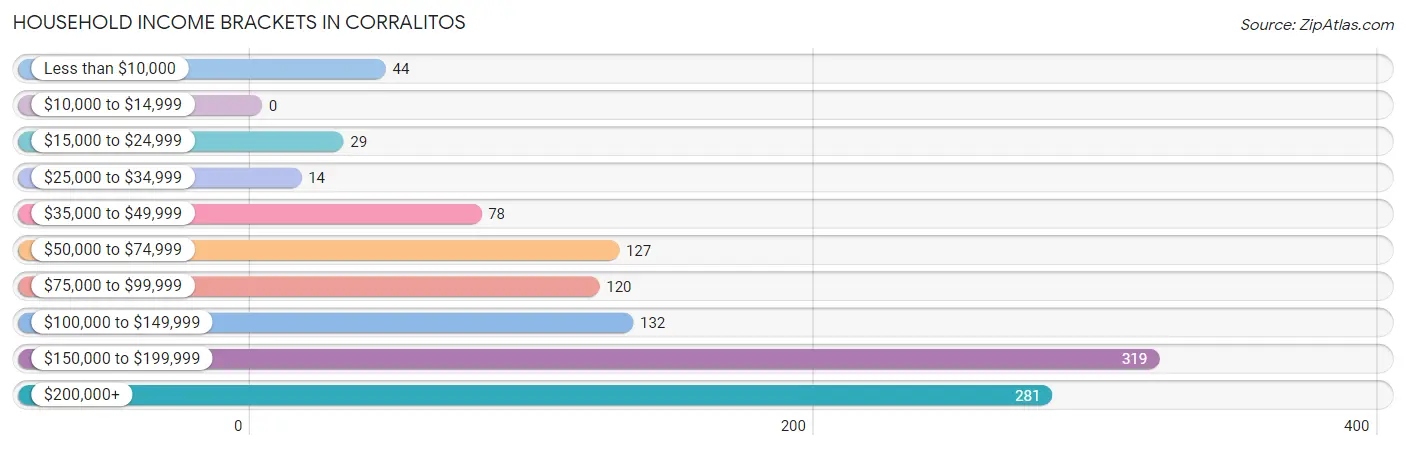
| Income Bracket | # Households | % Households |
| Less than $10,000 | 44 | 3.8% |
| $10,000 to $14,999 | 0 | 0.0% |
| $15,000 to $24,999 | 29 | 2.5% |
| $25,000 to $34,999 | 14 | 1.2% |
| $35,000 to $49,999 | 78 | 6.8% |
| $50,000 to $74,999 | 127 | 11.1% |
| $75,000 to $99,999 | 120 | 10.5% |
| $100,000 to $149,999 | 132 | 11.5% |
| $150,000 to $199,999 | 319 | 27.9% |
| $200,000+ | 281 | 24.5% |
Household Income by Householder Age in Corralitos
The median household income in Corralitos is $152,036, with the highest median household income of $157,623 found in the 65+ years age bracket for the primary householder. A total of 481 households (42.0%) fall into this category.
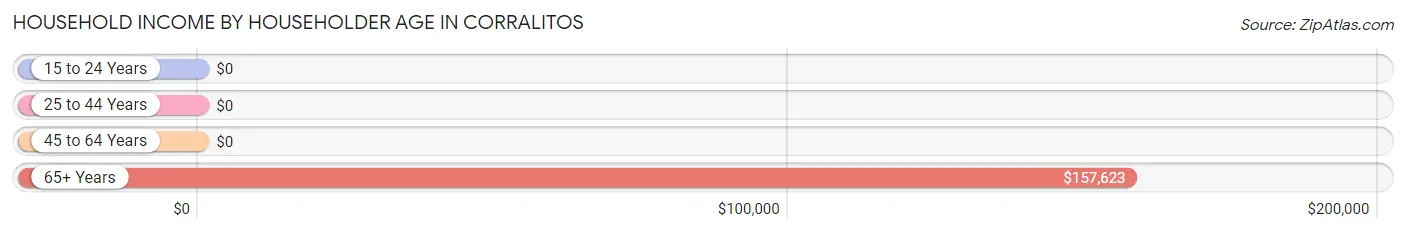
| Income Bracket | # Households | Median Income |
| 15 to 24 Years | 0 (0.0%) | $0 |
| 25 to 44 Years | 107 (9.3%) | $0 |
| 45 to 64 Years | 557 (48.6%) | $0 |
| 65+ Years | 481 (42.0%) | $157,623 |
| Total | 1,145 (100.0%) | $152,036 |
Poverty in Corralitos
Income Below Poverty by Sex and Age in Corralitos
With 2.5% poverty level for males and 7.9% for females among the residents of Corralitos, 55 to 64 year old males and 25 to 34 year old females are the most vulnerable to poverty, with 18 males (6.0%) and 20 females (22.0%) in their respective age groups living below the poverty level.
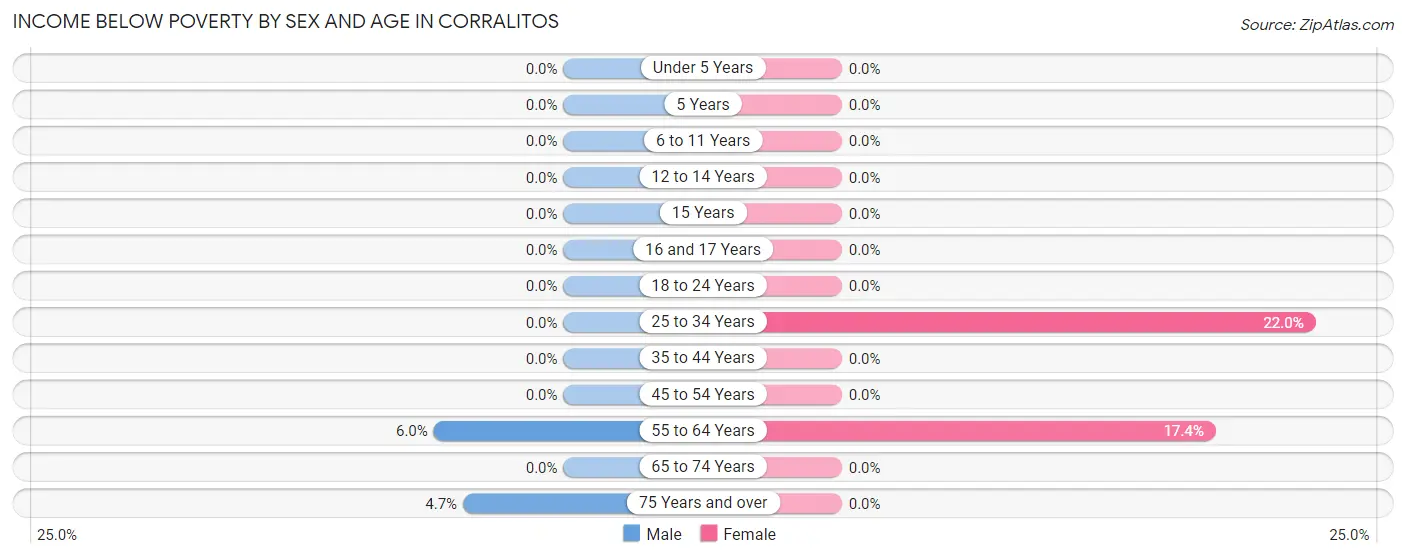
| Age Bracket | Male | Female |
| Under 5 Years | 0 (0.0%) | 0 (0.0%) |
| 5 Years | 0 (0.0%) | 0 (0.0%) |
| 6 to 11 Years | 0 (0.0%) | 0 (0.0%) |
| 12 to 14 Years | 0 (0.0%) | 0 (0.0%) |
| 15 Years | 0 (0.0%) | 0 (0.0%) |
| 16 and 17 Years | 0 (0.0%) | 0 (0.0%) |
| 18 to 24 Years | 0 (0.0%) | 0 (0.0%) |
| 25 to 34 Years | 0 (0.0%) | 20 (22.0%) |
| 35 to 44 Years | 0 (0.0%) | 0 (0.0%) |
| 45 to 54 Years | 0 (0.0%) | 0 (0.0%) |
| 55 to 64 Years | 18 (6.0%) | 59 (17.3%) |
| 65 to 74 Years | 0 (0.0%) | 0 (0.0%) |
| 75 Years and over | 11 (4.7%) | 0 (0.0%) |
| Total | 29 (2.5%) | 79 (7.9%) |
Income Above Poverty by Sex and Age in Corralitos
According to the poverty statistics in Corralitos, males aged 5 years and females aged under 5 years are the age groups that are most secure financially, with 100.0% of males and 100.0% of females in these age groups living above the poverty line.
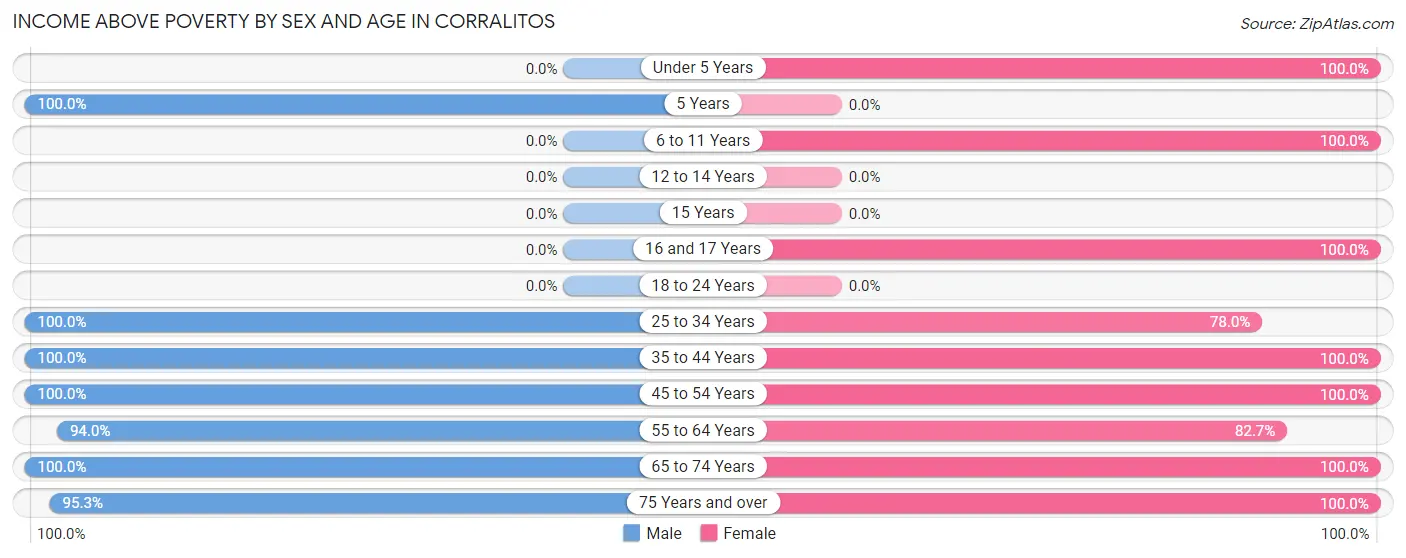
| Age Bracket | Male | Female |
| Under 5 Years | 0 (0.0%) | 4 (100.0%) |
| 5 Years | 7 (100.0%) | 0 (0.0%) |
| 6 to 11 Years | 0 (0.0%) | 31 (100.0%) |
| 12 to 14 Years | 0 (0.0%) | 0 (0.0%) |
| 15 Years | 0 (0.0%) | 0 (0.0%) |
| 16 and 17 Years | 0 (0.0%) | 13 (100.0%) |
| 18 to 24 Years | 0 (0.0%) | 0 (0.0%) |
| 25 to 34 Years | 205 (100.0%) | 71 (78.0%) |
| 35 to 44 Years | 9 (100.0%) | 125 (100.0%) |
| 45 to 54 Years | 214 (100.0%) | 76 (100.0%) |
| 55 to 64 Years | 281 (94.0%) | 281 (82.7%) |
| 65 to 74 Years | 180 (100.0%) | 139 (100.0%) |
| 75 Years and over | 225 (95.3%) | 185 (100.0%) |
| Total | 1,121 (97.5%) | 925 (92.1%) |
Income Below Poverty Among Married-Couple Families in Corralitos
The poverty statistics for married-couple families in Corralitos show that 0.6% or 4 of the total 698 families live below the poverty line. Families with no children have the highest poverty rate of 0.6%, comprising of 4 families. On the other hand, families with 1 or 2 children have the lowest poverty rate of 0.0%, which includes 0 families.
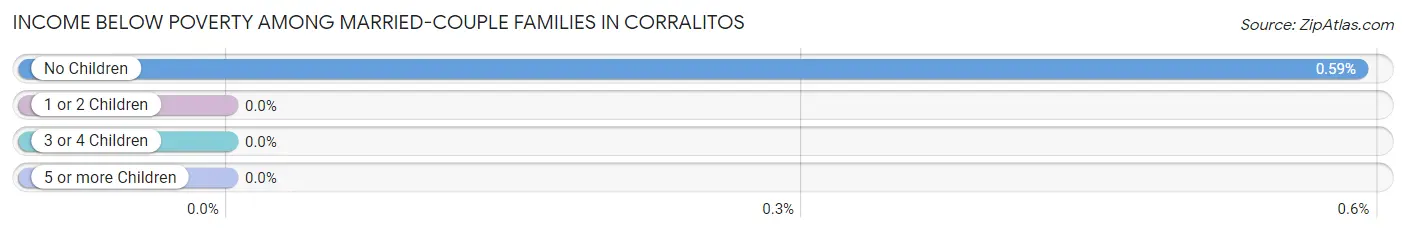
| Children | Above Poverty | Below Poverty |
| No Children | 672 (99.4%) | 4 (0.6%) |
| 1 or 2 Children | 22 (100.0%) | 0 (0.0%) |
| 3 or 4 Children | 0 (0.0%) | 0 (0.0%) |
| 5 or more Children | 0 (0.0%) | 0 (0.0%) |
| Total | 694 (99.4%) | 4 (0.6%) |
Income Below Poverty Among Single-Parent Households in Corralitos
| Children | Single Father | Single Mother |
| No Children | 0 (0.0%) | 0 (0.0%) |
| 1 or 2 Children | 0 (0.0%) | 0 (0.0%) |
| 3 or 4 Children | 0 (0.0%) | 0 (0.0%) |
| 5 or more Children | 0 (0.0%) | 0 (0.0%) |
| Total | 0 (0.0%) | 0 (0.0%) |
Income Below Poverty Among Married-Couple vs Single-Parent Households in Corralitos
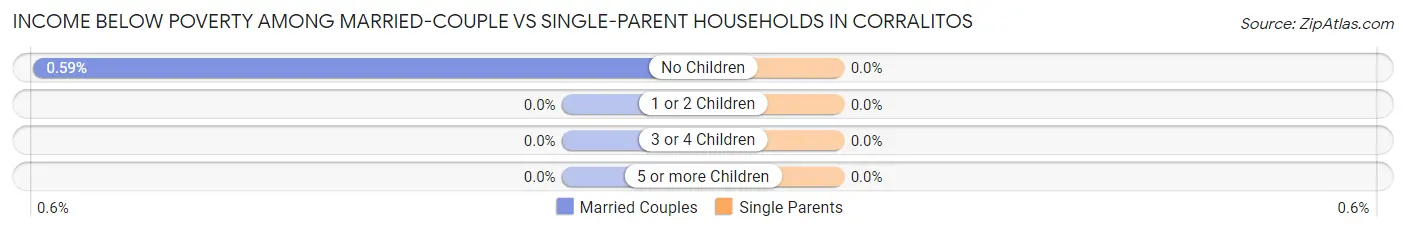
| Children | Married-Couple Families | Single-Parent Households |
| No Children | 4 (0.6%) | 0 (0.0%) |
| 1 or 2 Children | 0 (0.0%) | 0 (0.0%) |
| 3 or 4 Children | 0 (0.0%) | 0 (0.0%) |
| 5 or more Children | 0 (0.0%) | 0 (0.0%) |
| Total | 4 (0.6%) | 0 (0.0%) |
Race in Corralitos
The most populous races in Corralitos are White / Caucasian (1,341 | 62.3%), Hispanic or Latino (791 | 36.7%), and Two or more Races (418 | 19.4%).
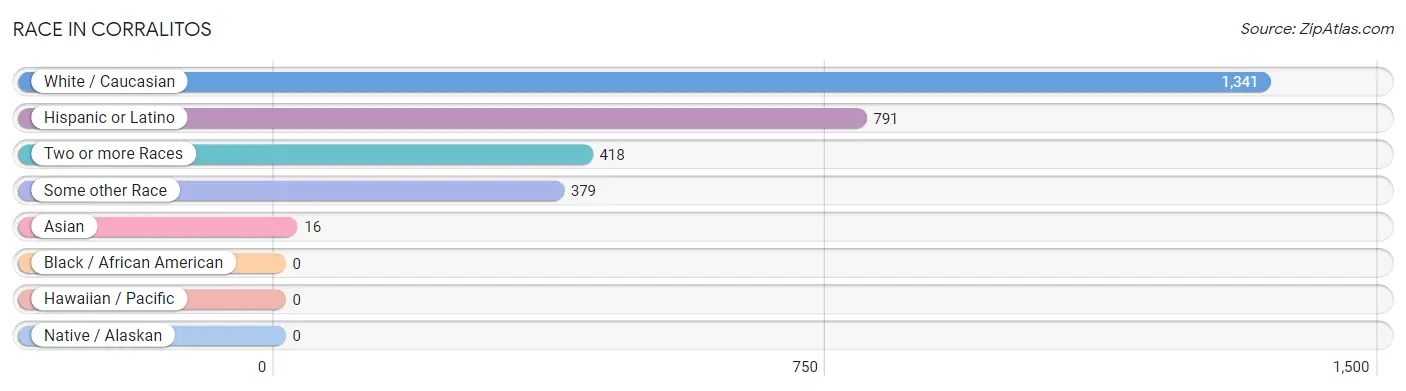
| Race | # Population | % Population |
| Asian | 16 | 0.7% |
| Black / African American | 0 | 0.0% |
| Hawaiian / Pacific | 0 | 0.0% |
| Hispanic or Latino | 791 | 36.7% |
| Native / Alaskan | 0 | 0.0% |
| White / Caucasian | 1,341 | 62.3% |
| Two or more Races | 418 | 19.4% |
| Some other Race | 379 | 17.6% |
| Total | 2,154 | 100.0% |
Ancestry in Corralitos
The most populous ancestries reported in Corralitos are Mexican (772 | 35.8%), English (343 | 15.9%), German (212 | 9.8%), Irish (170 | 7.9%), and Italian (163 | 7.6%), together accounting for 77.1% of all Corralitos residents.
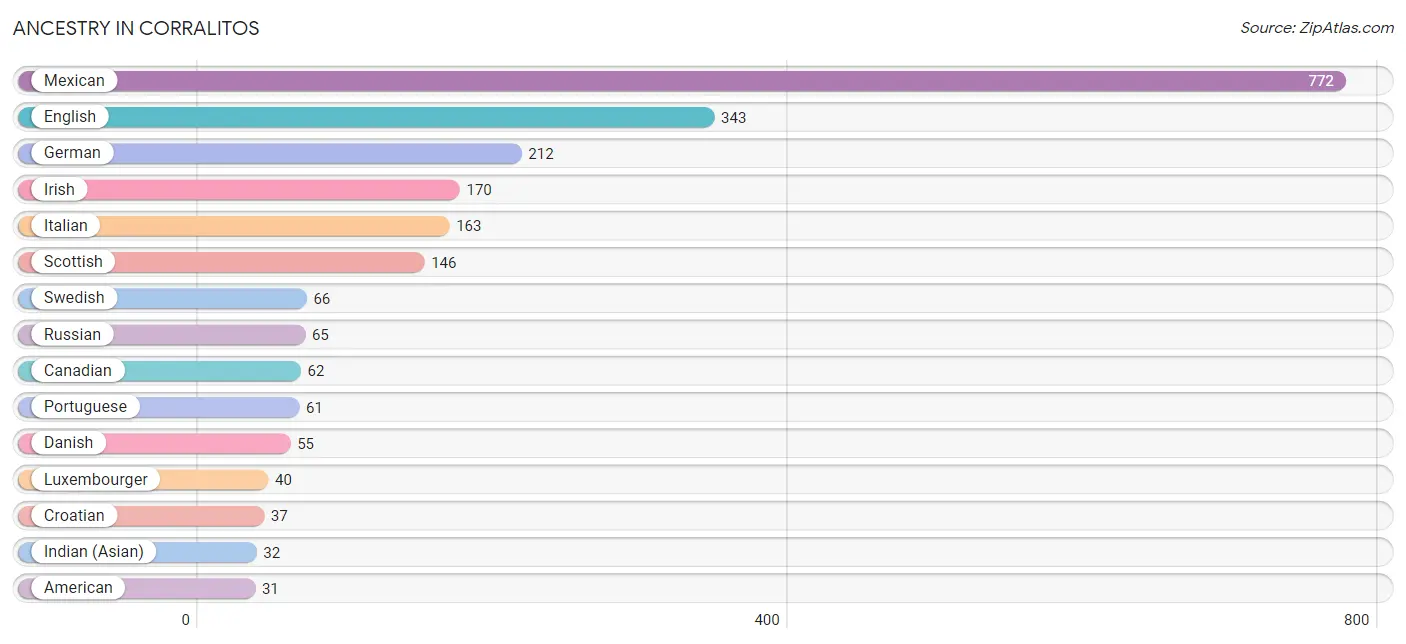
| Ancestry | # Population | % Population |
| American | 31 | 1.4% |
| Bhutanese | 16 | 0.7% |
| British | 10 | 0.5% |
| Canadian | 62 | 2.9% |
| Central American | 19 | 0.9% |
| Croatian | 37 | 1.7% |
| Czech | 12 | 0.6% |
| Danish | 55 | 2.5% |
| Dutch | 20 | 0.9% |
| English | 343 | 15.9% |
| European | 11 | 0.5% |
| French | 12 | 0.6% |
| German | 212 | 9.8% |
| Indian (Asian) | 32 | 1.5% |
| Irish | 170 | 7.9% |
| Italian | 163 | 7.6% |
| Luxembourger | 40 | 1.9% |
| Mexican | 772 | 35.8% |
| Nicaraguan | 19 | 0.9% |
| Norwegian | 20 | 0.9% |
| Polish | 9 | 0.4% |
| Portuguese | 61 | 2.8% |
| Russian | 65 | 3.0% |
| Scotch-Irish | 20 | 0.9% |
| Scottish | 146 | 6.8% |
| Slovene | 7 | 0.3% |
| Swedish | 66 | 3.1% |
| Welsh | 16 | 0.7% | View All 28 Rows |
Immigrants in Corralitos
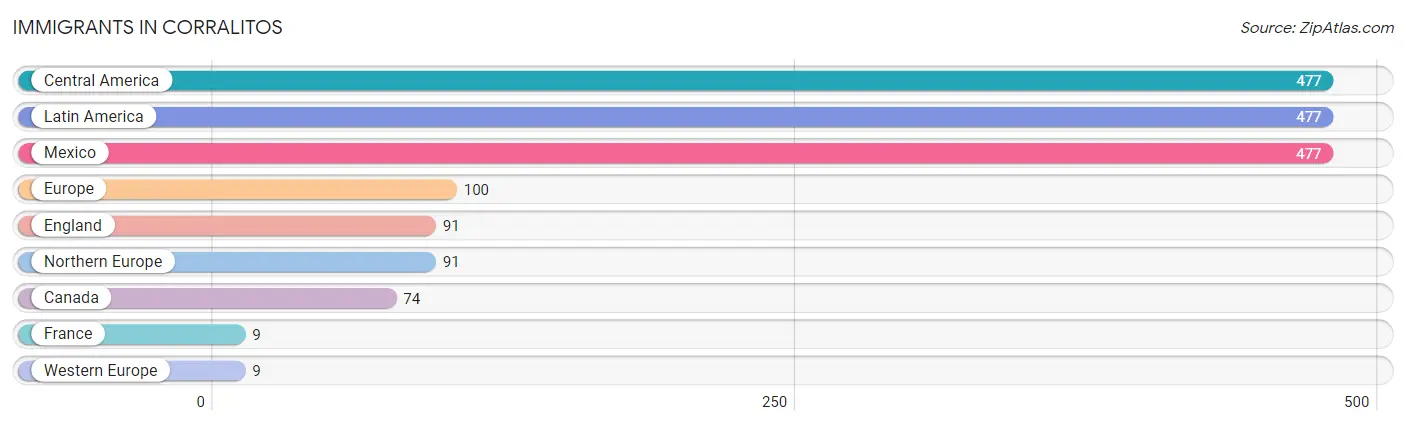
The most numerous immigrant groups reported in Corralitos came from Central America (477 | 22.1%), Latin America (477 | 22.1%), Mexico (477 | 22.1%), Europe (100 | 4.6%), and England (91 | 4.2%), together accounting for 75.3% of all Corralitos residents.
| Immigration Origin | # Population | % Population |
| Canada | 74 | 3.4% |
| Central America | 477 | 22.1% |
| England | 91 | 4.2% |
| Europe | 100 | 4.6% |
| France | 9 | 0.4% |
| Latin America | 477 | 22.1% |
| Mexico | 477 | 22.1% |
| Northern Europe | 91 | 4.2% |
| Western Europe | 9 | 0.4% | View All 9 Rows |
Sex and Age in Corralitos
Sex and Age in Corralitos
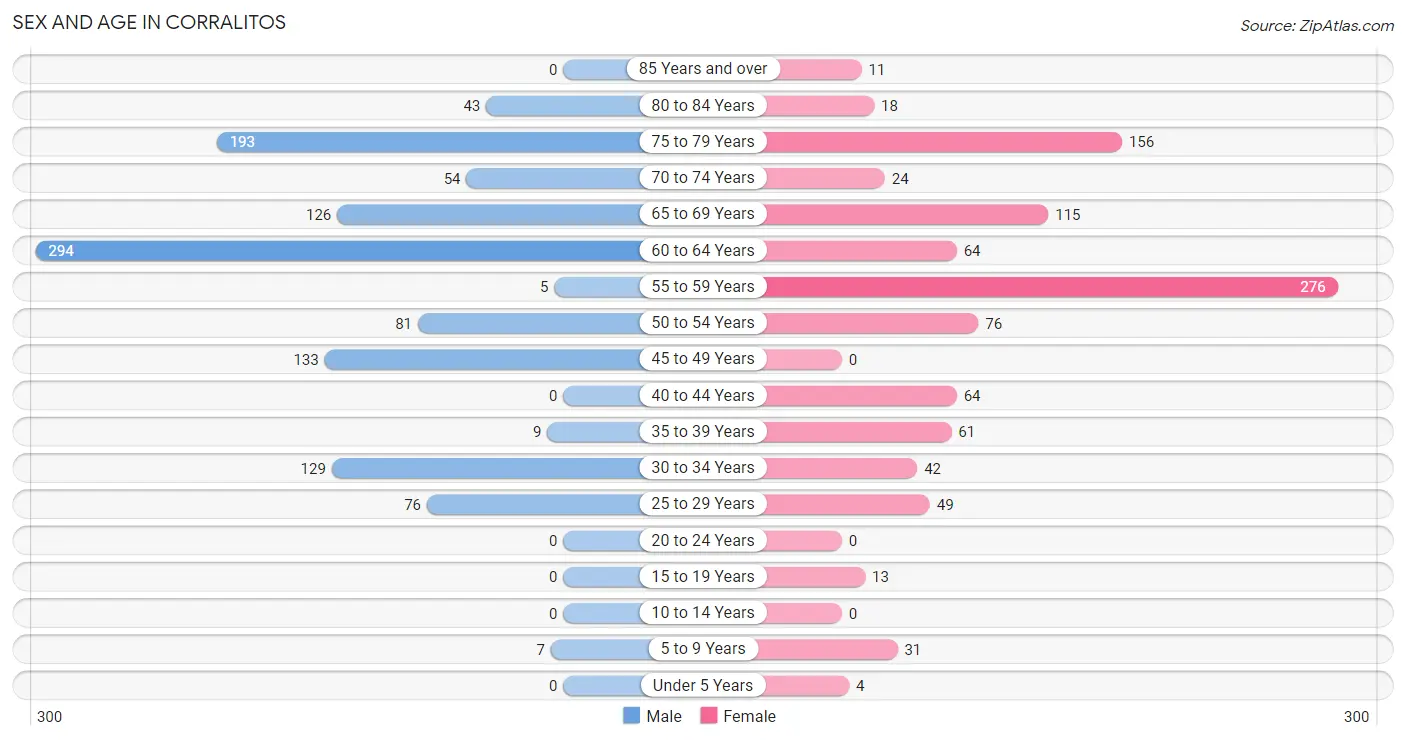
The most populous age groups in Corralitos are 60 to 64 Years (294 | 25.6%) for men and 55 to 59 Years (276 | 27.5%) for women.
| Age Bracket | Male | Female |
| Under 5 Years | 0 (0.0%) | 4 (0.4%) |
| 5 to 9 Years | 7 (0.6%) | 31 (3.1%) |
| 10 to 14 Years | 0 (0.0%) | 0 (0.0%) |
| 15 to 19 Years | 0 (0.0%) | 13 (1.3%) |
| 20 to 24 Years | 0 (0.0%) | 0 (0.0%) |
| 25 to 29 Years | 76 (6.6%) | 49 (4.9%) |
| 30 to 34 Years | 129 (11.2%) | 42 (4.2%) |
| 35 to 39 Years | 9 (0.8%) | 61 (6.1%) |
| 40 to 44 Years | 0 (0.0%) | 64 (6.4%) |
| 45 to 49 Years | 133 (11.6%) | 0 (0.0%) |
| 50 to 54 Years | 81 (7.0%) | 76 (7.6%) |
| 55 to 59 Years | 5 (0.4%) | 276 (27.5%) |
| 60 to 64 Years | 294 (25.6%) | 64 (6.4%) |
| 65 to 69 Years | 126 (11.0%) | 115 (11.5%) |
| 70 to 74 Years | 54 (4.7%) | 24 (2.4%) |
| 75 to 79 Years | 193 (16.8%) | 156 (15.5%) |
| 80 to 84 Years | 43 (3.7%) | 18 (1.8%) |
| 85 Years and over | 0 (0.0%) | 11 (1.1%) |
| Total | 1,150 (100.0%) | 1,004 (100.0%) |
Families and Households in Corralitos
Median Family Size in Corralitos
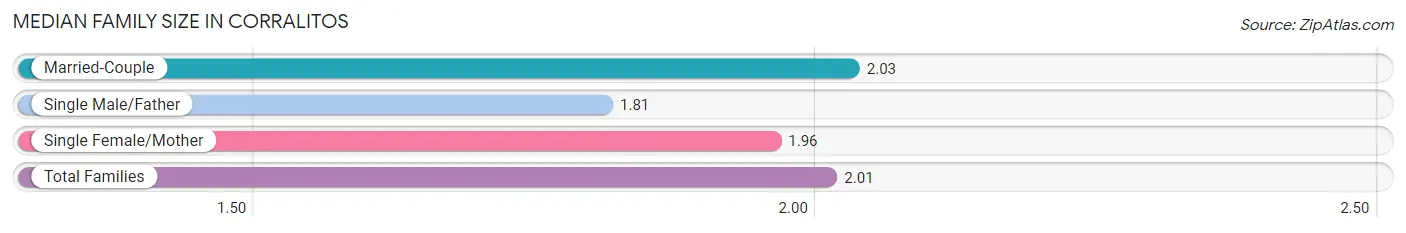
The median family size in Corralitos is 2.01 persons per family, with married-couple families (698 | 88.8%) accounting for the largest median family size of 2.03 persons per family. On the other hand, single male/father families (37 | 4.7%) represent the smallest median family size with 1.81 persons per family.
| Family Type | # Families | Family Size |
| Married-Couple | 698 (88.8%) | 2.03 |
| Single Male/Father | 37 (4.7%) | 1.81 |
| Single Female/Mother | 51 (6.5%) | 1.96 |
| Total Families | 786 (100.0%) | 2.01 |
Median Household Size in Corralitos
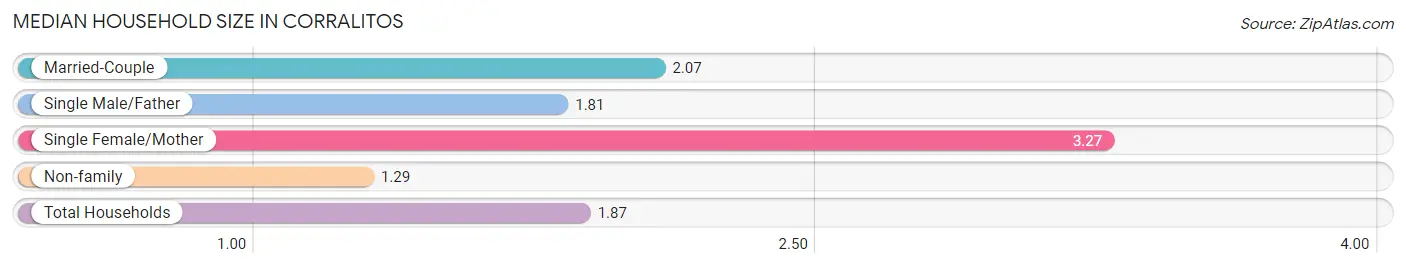
The median household size in Corralitos is 1.87 persons per household, with single female/mother households (51 | 4.4%) accounting for the largest median household size of 3.27 persons per household. non-family households (359 | 31.4%) represent the smallest median household size with 1.29 persons per household.
| Household Type | # Households | Household Size |
| Married-Couple | 698 (61.0%) | 2.07 |
| Single Male/Father | 37 (3.2%) | 1.81 |
| Single Female/Mother | 51 (4.4%) | 3.27 |
| Non-family | 359 (31.4%) | 1.29 |
| Total Households | 1,145 (100.0%) | 1.87 |
Household Size by Marriage Status in Corralitos
Out of a total of 1,145 households in Corralitos, 786 (68.6%) are family households, while 359 (31.4%) are nonfamily households. The most numerous type of family households are 2-person households, comprising 634, and the most common type of nonfamily households are 1-person households, comprising 264.
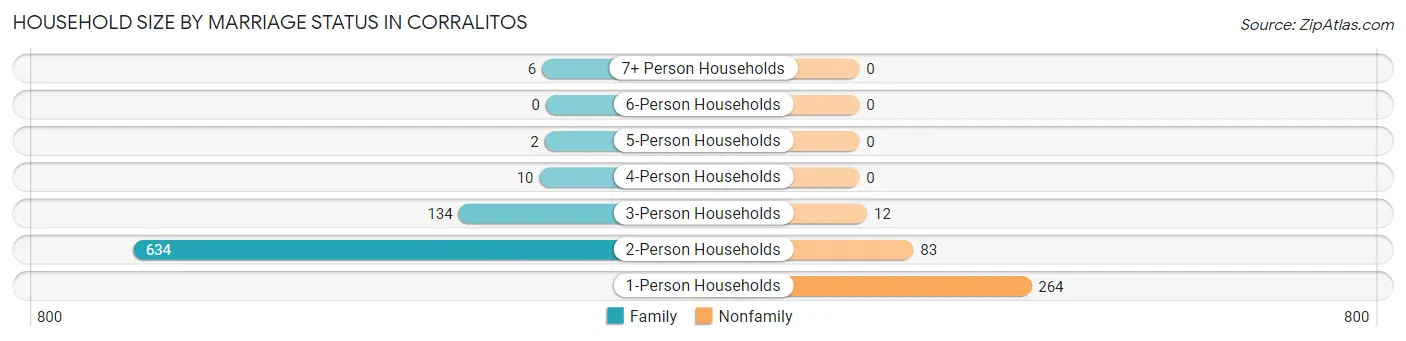
| Household Size | Family Households | Nonfamily Households |
| 1-Person Households | - | 264 (23.1%) |
| 2-Person Households | 634 (55.4%) | 83 (7.2%) |
| 3-Person Households | 134 (11.7%) | 12 (1.1%) |
| 4-Person Households | 10 (0.9%) | 0 (0.0%) |
| 5-Person Households | 2 (0.2%) | 0 (0.0%) |
| 6-Person Households | 0 (0.0%) | 0 (0.0%) |
| 7+ Person Households | 6 (0.5%) | 0 (0.0%) |
| Total | 786 (68.6%) | 359 (31.4%) |
Female Fertility in Corralitos
Fertility by Age in Corralitos
| Age Bracket | Women with Births | Births / 1,000 Women |
| 15 to 19 years | 0 (0.0%) | 0.0 |
| 20 to 34 years | 0 (0.0%) | 0.0 |
| 35 to 50 years | 0 (0.0%) | 0.0 |
| Total | 0 (0.0%) | 0.0 |
Fertility by Age by Marriage Status in Corralitos
| Age Bracket | Married | Unmarried |
| 15 to 19 years | 0 (0.0%) | 0 (0.0%) |
| 20 to 34 years | 0 (0.0%) | 0 (0.0%) |
| 35 to 50 years | 0 (0.0%) | 0 (0.0%) |
| Total | 0 (0.0%) | 0 (0.0%) |
Fertility by Education in Corralitos
| Educational Attainment | Women with Births | Births / 1,000 Women |
| Less than High School | 0 (0.0%) | 0.0 |
| High School Diploma | 0 (0.0%) | 0.0 |
| College or Associate's Degree | 0 (0.0%) | 0.0 |
| Bachelor's Degree | 0 (0.0%) | 0.0 |
| Graduate Degree | 0 (0.0%) | 0.0 |
| Total | 0 (0.0%) | 0.0 |
Fertility by Education by Marriage Status in Corralitos
| Educational Attainment | Married | Unmarried |
| Less than High School | 0 (0.0%) | 0 (0.0%) |
| High School Diploma | 0 (0.0%) | 0 (0.0%) |
| College or Associate's Degree | 0 (0.0%) | 0 (0.0%) |
| Bachelor's Degree | 0 (0.0%) | 0 (0.0%) |
| Graduate Degree | 0 (0.0%) | 0 (0.0%) |
| Total | 0 (0.0%) | 0 (0.0%) |
Employment Characteristics in Corralitos
Employment by Class of Employer in Corralitos
Among the 1,069 employed individuals in Corralitos, self-employed (incorporated) (496 | 46.4%), private company employees (364 | 34.1%), and self-employed (not incorporated) (91 | 8.5%) make up the most common classes of employment.
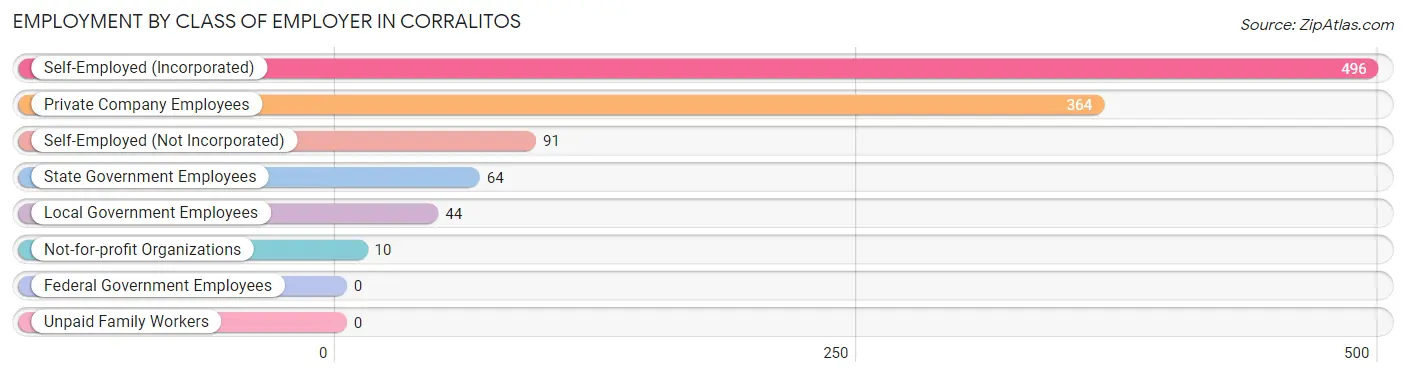
| Employer Class | # Employees | % Employees |
| Private Company Employees | 364 | 34.1% |
| Self-Employed (Incorporated) | 496 | 46.4% |
| Self-Employed (Not Incorporated) | 91 | 8.5% |
| Not-for-profit Organizations | 10 | 0.9% |
| Local Government Employees | 44 | 4.1% |
| State Government Employees | 64 | 6.0% |
| Federal Government Employees | 0 | 0.0% |
| Unpaid Family Workers | 0 | 0.0% |
| Total | 1,069 | 100.0% |
Employment Status by Age in Corralitos
According to the labor force statistics for Corralitos, out of the total population over 16 years of age (2,112), 56.8% or 1,200 individuals are in the labor force, with 10.8% or 130 of them unemployed. The age group with the highest labor force participation rate is 30 to 34 years, with 100.0% or 171 individuals in the labor force. Within the labor force, the 35 to 44 years age range has the highest percentage of unemployed individuals, with 92.9% or 118 of them being unemployed.
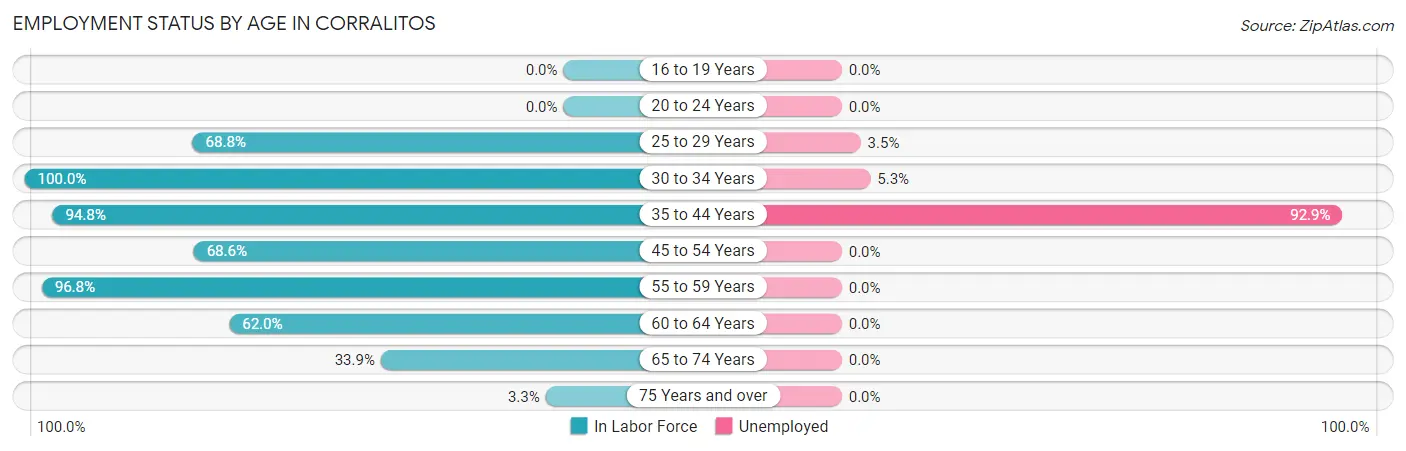
| Age Bracket | In Labor Force | Unemployed |
| 16 to 19 Years | 0 (0.0%) | 0 (0.0%) |
| 20 to 24 Years | 0 (0.0%) | 0 (0.0%) |
| 25 to 29 Years | 86 (68.8%) | 3 (3.5%) |
| 30 to 34 Years | 171 (100.0%) | 9 (5.3%) |
| 35 to 44 Years | 127 (94.8%) | 118 (92.9%) |
| 45 to 54 Years | 199 (68.6%) | 0 (0.0%) |
| 55 to 59 Years | 272 (96.8%) | 0 (0.0%) |
| 60 to 64 Years | 222 (62.0%) | 0 (0.0%) |
| 65 to 74 Years | 108 (33.9%) | 0 (0.0%) |
| 75 Years and over | 14 (3.3%) | 0 (0.0%) |
| Total | 1,200 (56.8%) | 130 (10.8%) |
Employment Status by Educational Attainment in Corralitos
According to labor force statistics for Corralitos, 79.2% of individuals (1,076) out of the total population between 25 and 64 years of age (1,359) are in the labor force, with 12.1% or 130 of them being unemployed. The group with the highest labor force participation rate are those with the educational attainment of college / associate degree, with 91.5% or 615 individuals in the labor force. Within the labor force, individuals with high school diploma education have the highest percentage of unemployment, with 56.4% or 123 of them being unemployed.
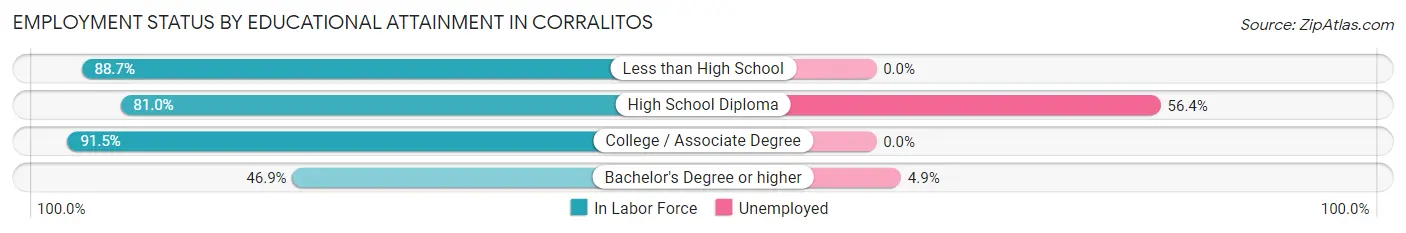
| Educational Attainment | In Labor Force | Unemployed |
| Less than High School | 102 (88.7%) | 0 (0.0%) |
| High School Diploma | 218 (81.0%) | 152 (56.4%) |
| College / Associate Degree | 615 (91.5%) | 0 (0.0%) |
| Bachelor's Degree or higher | 142 (46.9%) | 15 (4.9%) |
| Total | 1,076 (79.2%) | 164 (12.1%) |
Employment Occupations by Sex in Corralitos
Management, Business, Science and Arts Occupations
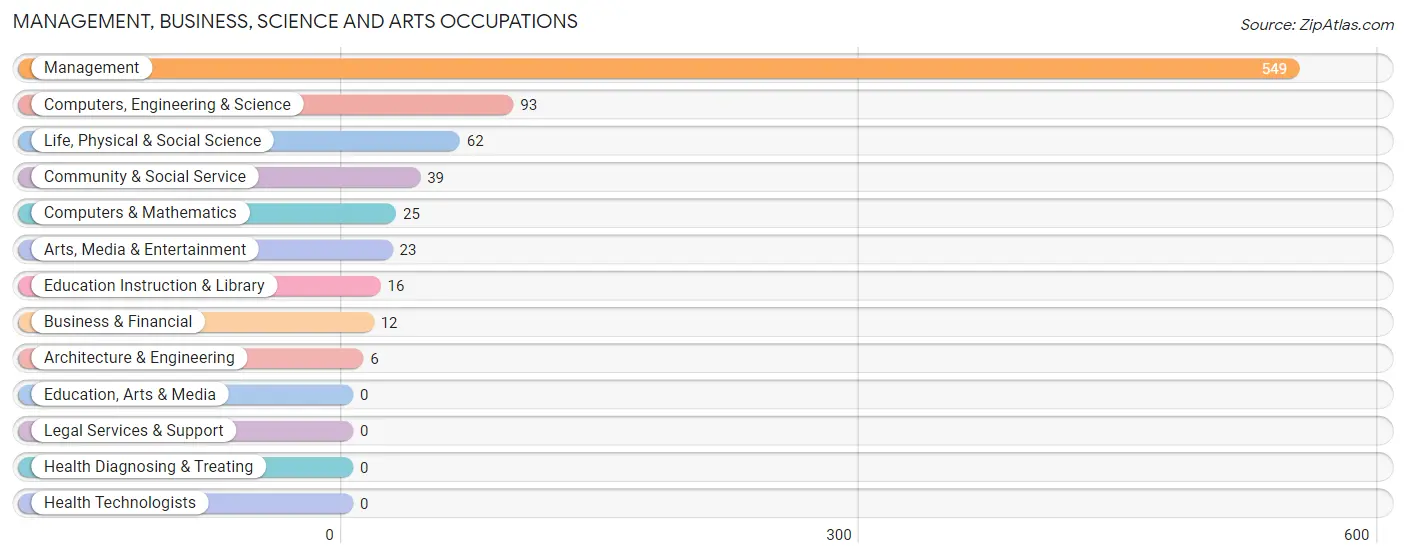
The most common Management, Business, Science and Arts occupations in Corralitos are Management (549 | 51.4%), Computers, Engineering & Science (93 | 8.7%), Life, Physical & Social Science (62 | 5.8%), Community & Social Service (39 | 3.6%), and Computers & Mathematics (25 | 2.3%).
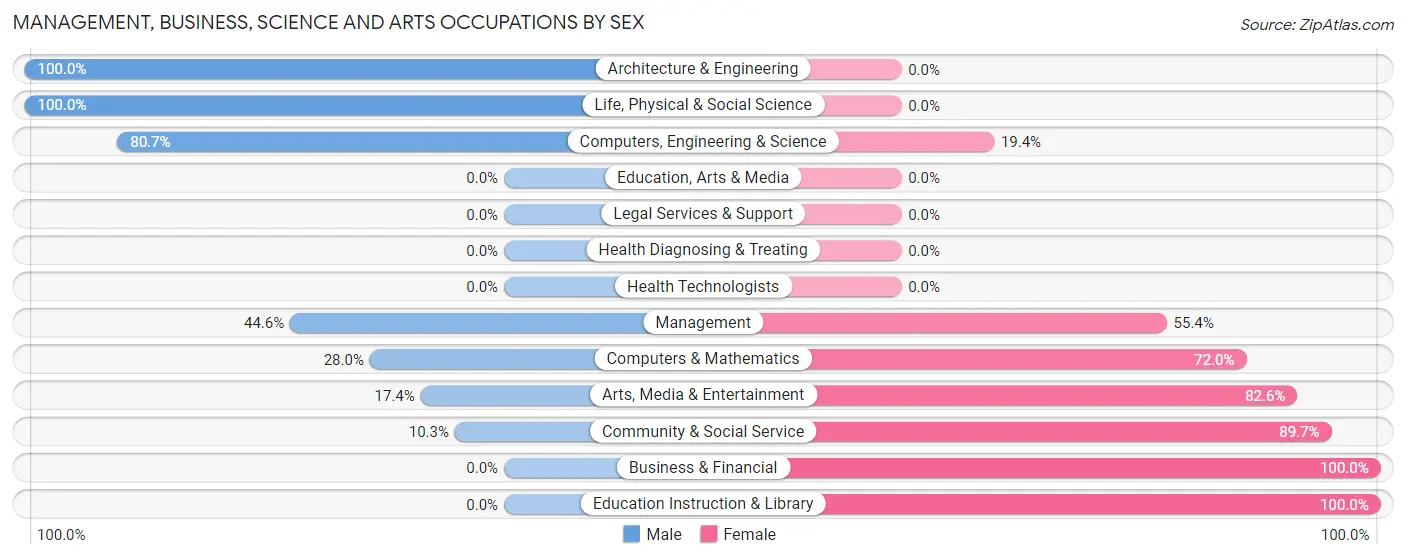
Management, Business, Science and Arts Occupations by Sex
Within the Management, Business, Science and Arts occupations in Corralitos, the most male-oriented occupations are Architecture & Engineering (100.0%), Life, Physical & Social Science (100.0%), and Computers, Engineering & Science (80.6%), while the most female-oriented occupations are Business & Financial (100.0%), Education Instruction & Library (100.0%), and Community & Social Service (89.7%).
| Occupation | Male | Female |
| Management | 245 (44.6%) | 304 (55.4%) |
| Business & Financial | 0 (0.0%) | 12 (100.0%) |
| Computers, Engineering & Science | 75 (80.6%) | 18 (19.4%) |
| Computers & Mathematics | 7 (28.0%) | 18 (72.0%) |
| Architecture & Engineering | 6 (100.0%) | 0 (0.0%) |
| Life, Physical & Social Science | 62 (100.0%) | 0 (0.0%) |
| Community & Social Service | 4 (10.3%) | 35 (89.7%) |
| Education, Arts & Media | 0 (0.0%) | 0 (0.0%) |
| Legal Services & Support | 0 (0.0%) | 0 (0.0%) |
| Education Instruction & Library | 0 (0.0%) | 16 (100.0%) |
| Arts, Media & Entertainment | 4 (17.4%) | 19 (82.6%) |
| Health Diagnosing & Treating | 0 (0.0%) | 0 (0.0%) |
| Health Technologists | 0 (0.0%) | 0 (0.0%) |
| Total (Category) | 324 (46.8%) | 369 (53.2%) |
| Total (Overall) | 642 (60.1%) | 427 (39.9%) |
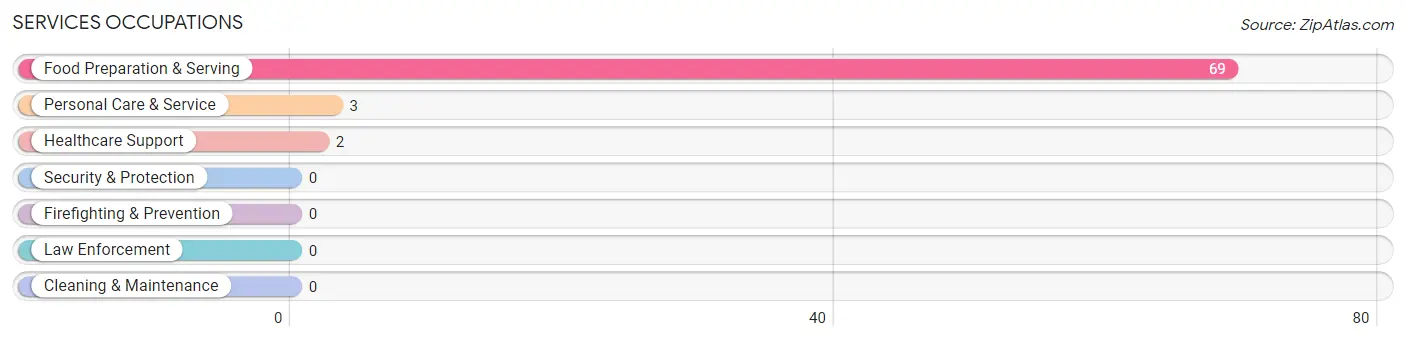
Services Occupations
The most common Services occupations in Corralitos are Food Preparation & Serving (69 | 6.5%), Personal Care & Service (3 | 0.3%), and Healthcare Support (2 | 0.2%).
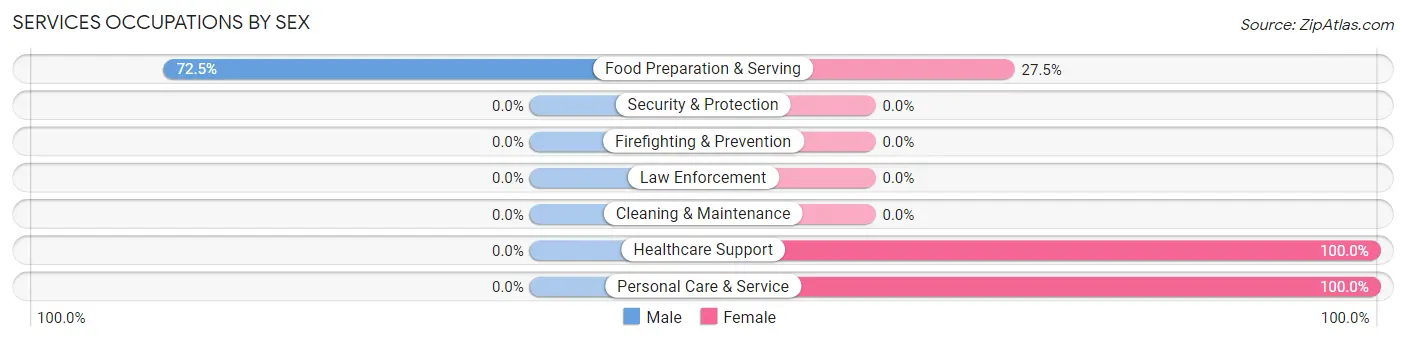
Services Occupations by Sex
| Occupation | Male | Female |
| Healthcare Support | 0 (0.0%) | 2 (100.0%) |
| Security & Protection | 0 (0.0%) | 0 (0.0%) |
| Firefighting & Prevention | 0 (0.0%) | 0 (0.0%) |
| Law Enforcement | 0 (0.0%) | 0 (0.0%) |
| Food Preparation & Serving | 50 (72.5%) | 19 (27.5%) |
| Cleaning & Maintenance | 0 (0.0%) | 0 (0.0%) |
| Personal Care & Service | 0 (0.0%) | 3 (100.0%) |
| Total (Category) | 50 (67.6%) | 24 (32.4%) |
| Total (Overall) | 642 (60.1%) | 427 (39.9%) |
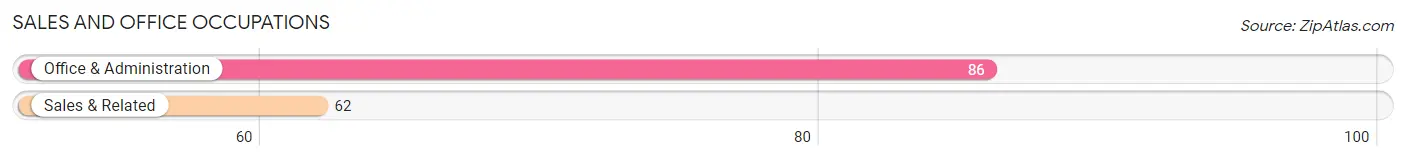
Sales and Office Occupations
The most common Sales and Office occupations in Corralitos are Office & Administration (86 | 8.0%), and Sales & Related (62 | 5.8%).
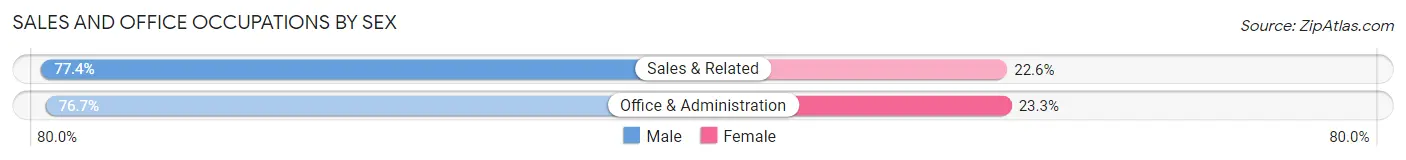
Sales and Office Occupations by Sex
| Occupation | Male | Female |
| Sales & Related | 48 (77.4%) | 14 (22.6%) |
| Office & Administration | 66 (76.7%) | 20 (23.3%) |
| Total (Category) | 114 (77.0%) | 34 (23.0%) |
| Total (Overall) | 642 (60.1%) | 427 (39.9%) |
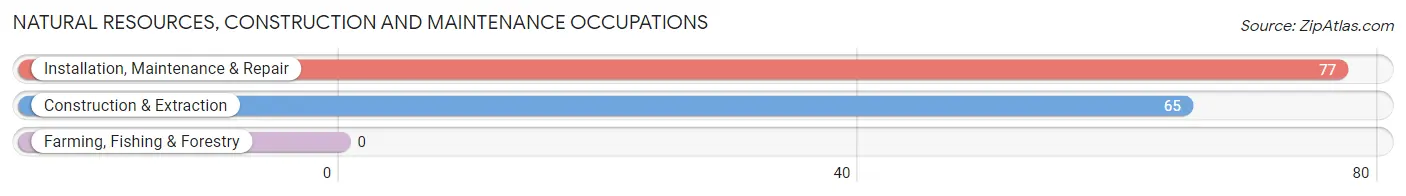
Natural Resources, Construction and Maintenance Occupations
The most common Natural Resources, Construction and Maintenance occupations in Corralitos are Installation, Maintenance & Repair (77 | 7.2%), and Construction & Extraction (65 | 6.1%).
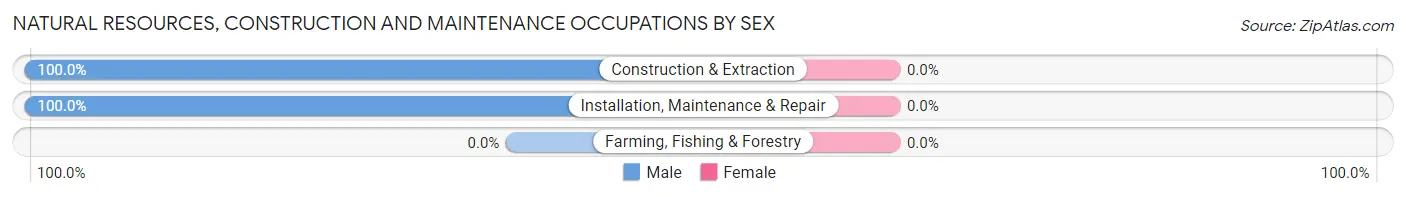
Natural Resources, Construction and Maintenance Occupations by Sex
| Occupation | Male | Female |
| Farming, Fishing & Forestry | 0 (0.0%) | 0 (0.0%) |
| Construction & Extraction | 65 (100.0%) | 0 (0.0%) |
| Installation, Maintenance & Repair | 77 (100.0%) | 0 (0.0%) |
| Total (Category) | 142 (100.0%) | 0 (0.0%) |
| Total (Overall) | 642 (60.1%) | 427 (39.9%) |
Production, Transportation and Moving Occupations
The most common Production, Transportation and Moving occupations in Corralitos are , and Production (12 | 1.1%).
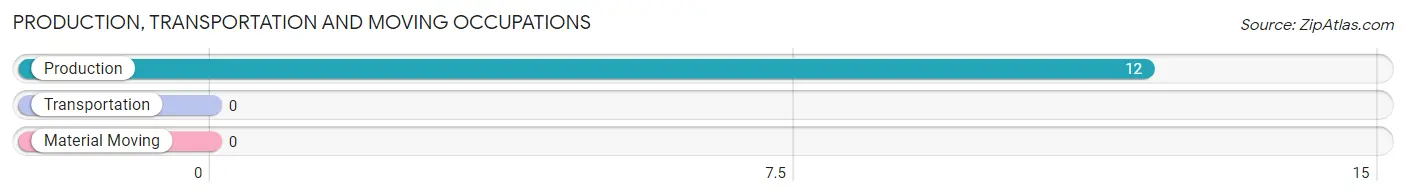
Production, Transportation and Moving Occupations by Sex
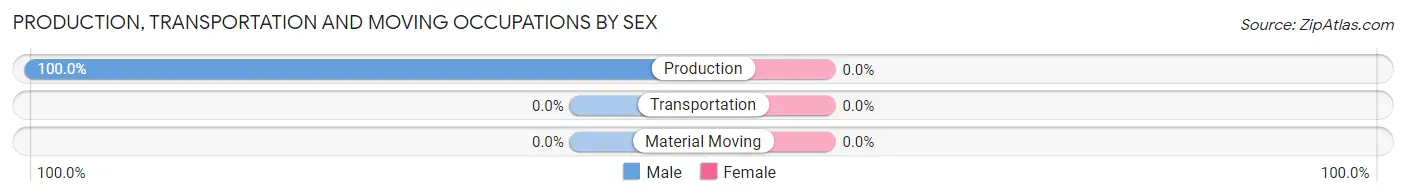
| Occupation | Male | Female |
| Production | 12 (100.0%) | 0 (0.0%) |
| Transportation | 0 (0.0%) | 0 (0.0%) |
| Material Moving | 0 (0.0%) | 0 (0.0%) |
| Total (Category) | 12 (100.0%) | 0 (0.0%) |
| Total (Overall) | 642 (60.1%) | 427 (39.9%) |
Employment Industries by Sex in Corralitos
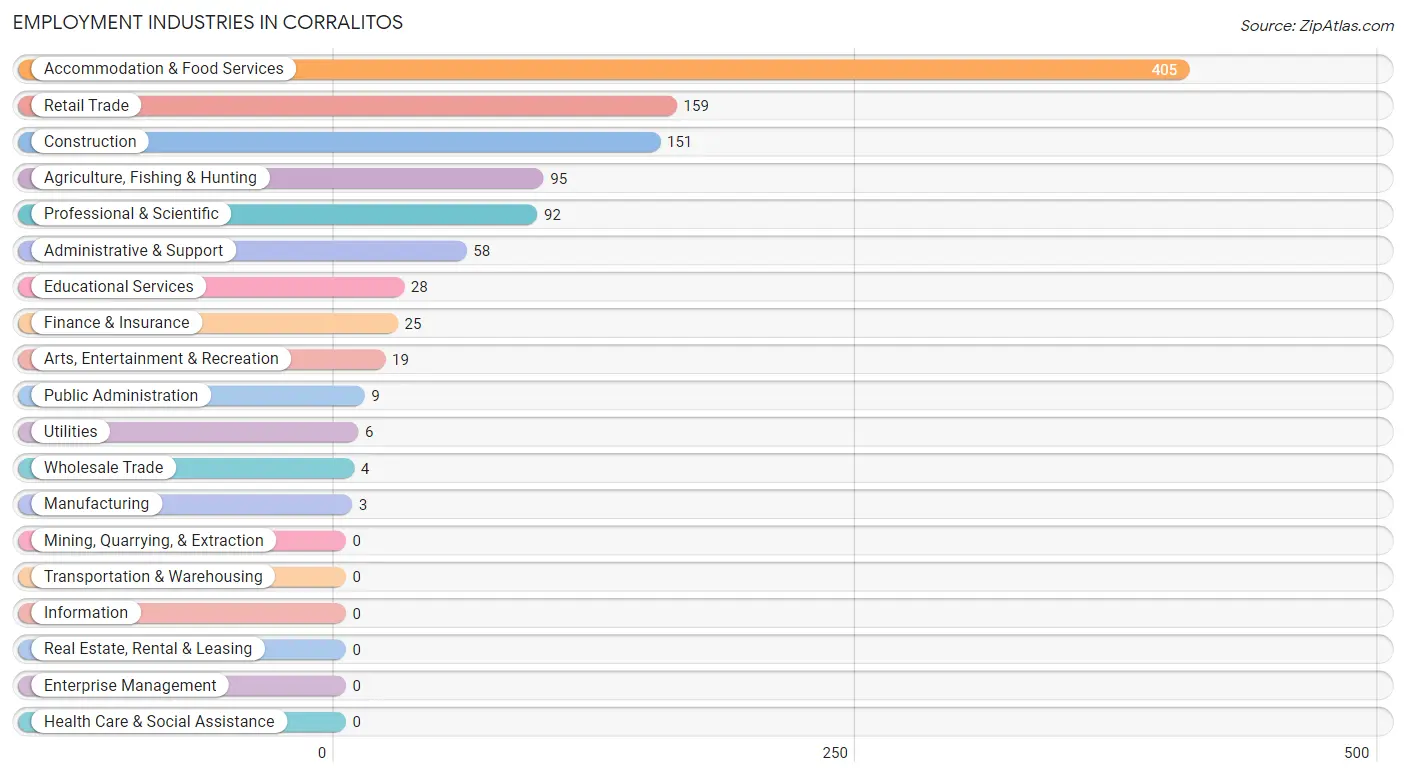
Employment Industries in Corralitos
The major employment industries in Corralitos include Accommodation & Food Services (405 | 37.9%), Retail Trade (159 | 14.9%), Construction (151 | 14.1%), Agriculture, Fishing & Hunting (95 | 8.9%), and Professional & Scientific (92 | 8.6%).
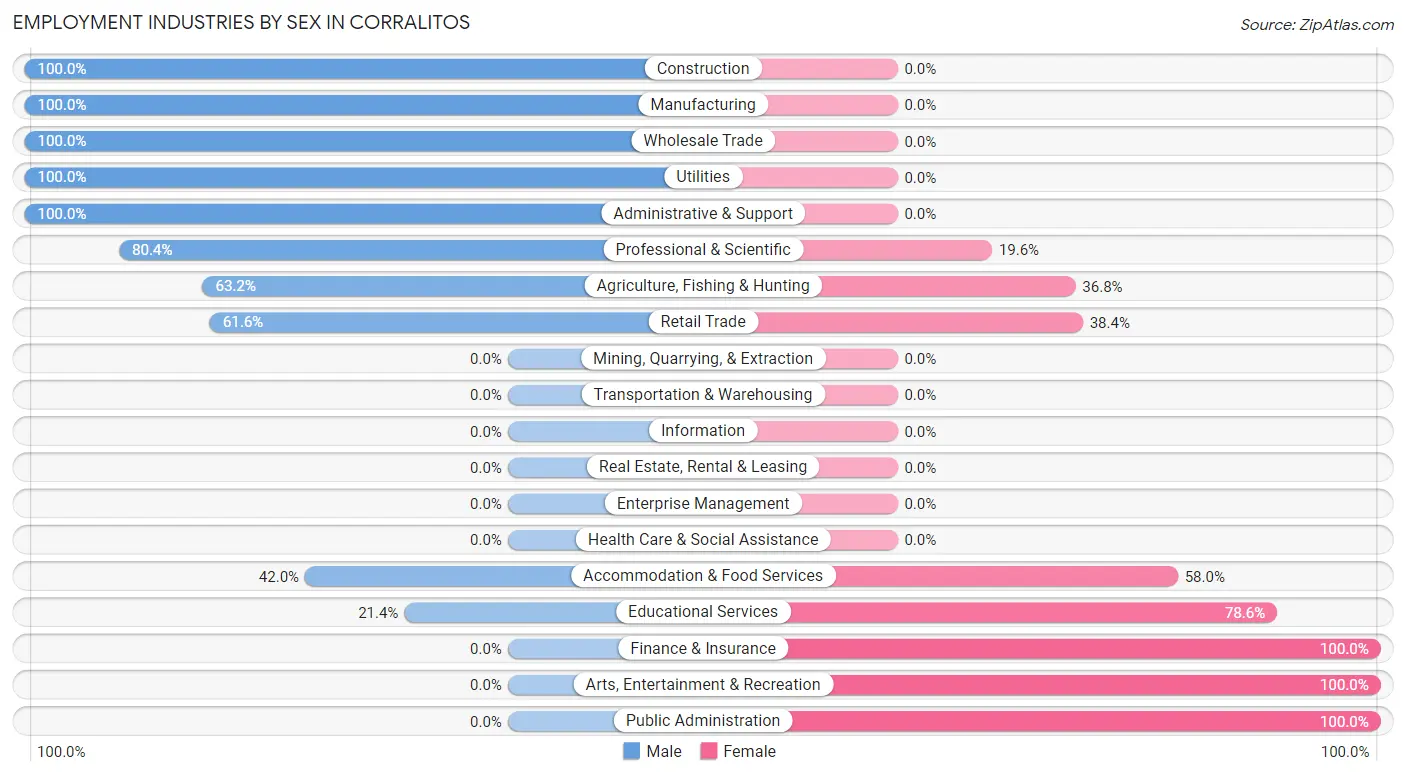
Employment Industries by Sex in Corralitos
The Corralitos industries that see more men than women are Construction (100.0%), Manufacturing (100.0%), and Wholesale Trade (100.0%), whereas the industries that tend to have a higher number of women are Finance & Insurance (100.0%), Arts, Entertainment & Recreation (100.0%), and Public Administration (100.0%).
| Industry | Male | Female |
| Agriculture, Fishing & Hunting | 60 (63.2%) | 35 (36.8%) |
| Mining, Quarrying, & Extraction | 0 (0.0%) | 0 (0.0%) |
| Construction | 151 (100.0%) | 0 (0.0%) |
| Manufacturing | 3 (100.0%) | 0 (0.0%) |
| Wholesale Trade | 4 (100.0%) | 0 (0.0%) |
| Retail Trade | 98 (61.6%) | 61 (38.4%) |
| Transportation & Warehousing | 0 (0.0%) | 0 (0.0%) |
| Utilities | 6 (100.0%) | 0 (0.0%) |
| Information | 0 (0.0%) | 0 (0.0%) |
| Finance & Insurance | 0 (0.0%) | 25 (100.0%) |
| Real Estate, Rental & Leasing | 0 (0.0%) | 0 (0.0%) |
| Professional & Scientific | 74 (80.4%) | 18 (19.6%) |
| Enterprise Management | 0 (0.0%) | 0 (0.0%) |
| Administrative & Support | 58 (100.0%) | 0 (0.0%) |
| Educational Services | 6 (21.4%) | 22 (78.6%) |
| Health Care & Social Assistance | 0 (0.0%) | 0 (0.0%) |
| Arts, Entertainment & Recreation | 0 (0.0%) | 19 (100.0%) |
| Accommodation & Food Services | 170 (42.0%) | 235 (58.0%) |
| Public Administration | 0 (0.0%) | 9 (100.0%) |
| Total | 642 (60.1%) | 427 (39.9%) |
Education in Corralitos
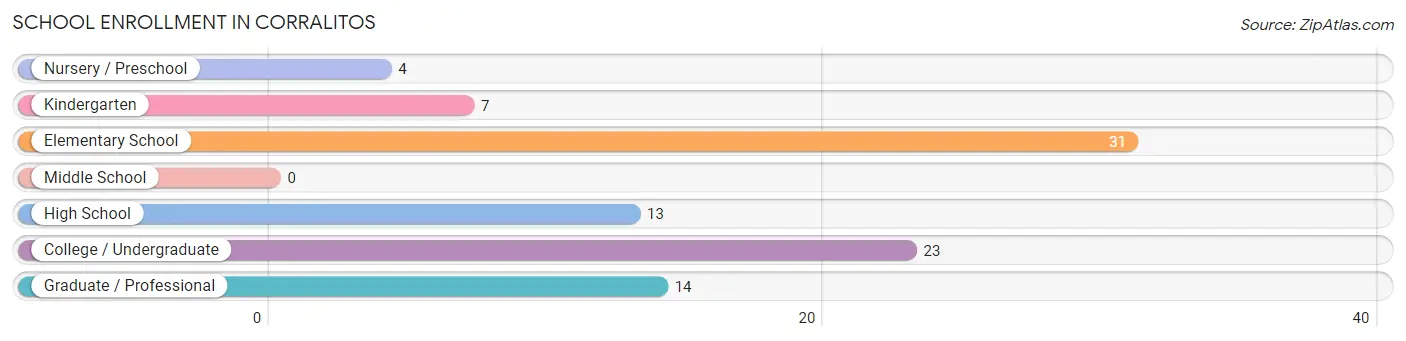
School Enrollment in Corralitos
The most common levels of schooling among the 92 students in Corralitos are elementary school (31 | 33.7%), college / undergraduate (23 | 25.0%), and graduate / professional (14 | 15.2%).
| School Level | # Students | % Students |
| Nursery / Preschool | 4 | 4.3% |
| Kindergarten | 7 | 7.6% |
| Elementary School | 31 | 33.7% |
| Middle School | 0 | 0.0% |
| High School | 13 | 14.1% |
| College / Undergraduate | 23 | 25.0% |
| Graduate / Professional | 14 | 15.2% |
| Total | 92 | 100.0% |
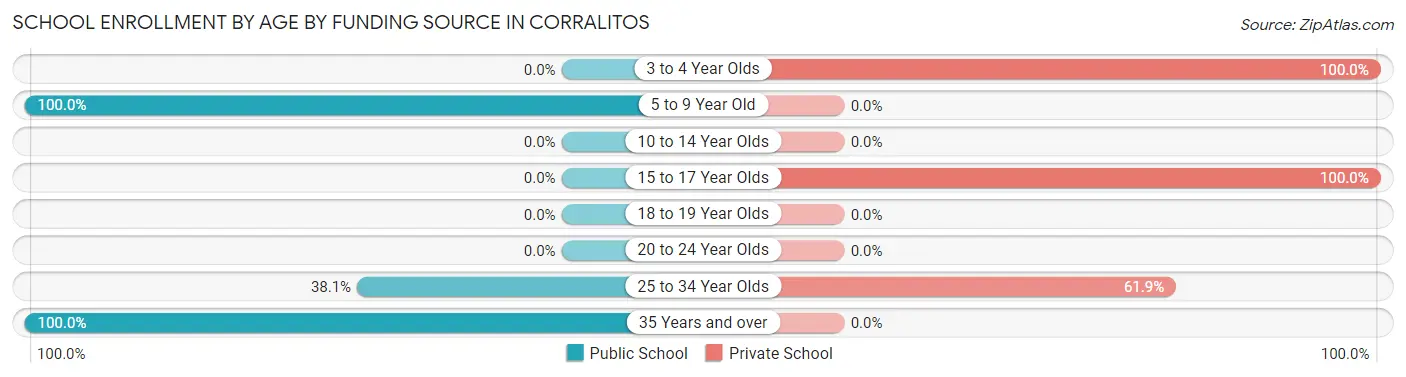
School Enrollment by Age by Funding Source in Corralitos
Out of a total of 92 students who are enrolled in schools in Corralitos, 30 (32.6%) attend a private institution, while the remaining 62 (67.4%) are enrolled in public schools. The age group of 3 to 4 year olds has the highest likelihood of being enrolled in private schools, with 4 (100.0% in the age bracket) enrolled. Conversely, the age group of 5 to 9 year old has the lowest likelihood of being enrolled in a private school, with 38 (100.0% in the age bracket) attending a public institution.
| Age Bracket | Public School | Private School |
| 3 to 4 Year Olds | 0 (0.0%) | 4 (100.0%) |
| 5 to 9 Year Old | 38 (100.0%) | 0 (0.0%) |
| 10 to 14 Year Olds | 0 (0.0%) | 0 (0.0%) |
| 15 to 17 Year Olds | 0 (0.0%) | 13 (100.0%) |
| 18 to 19 Year Olds | 0 (0.0%) | 0 (0.0%) |
| 20 to 24 Year Olds | 0 (0.0%) | 0 (0.0%) |
| 25 to 34 Year Olds | 8 (38.1%) | 13 (61.9%) |
| 35 Years and over | 16 (100.0%) | 0 (0.0%) |
| Total | 62 (67.4%) | 30 (32.6%) |
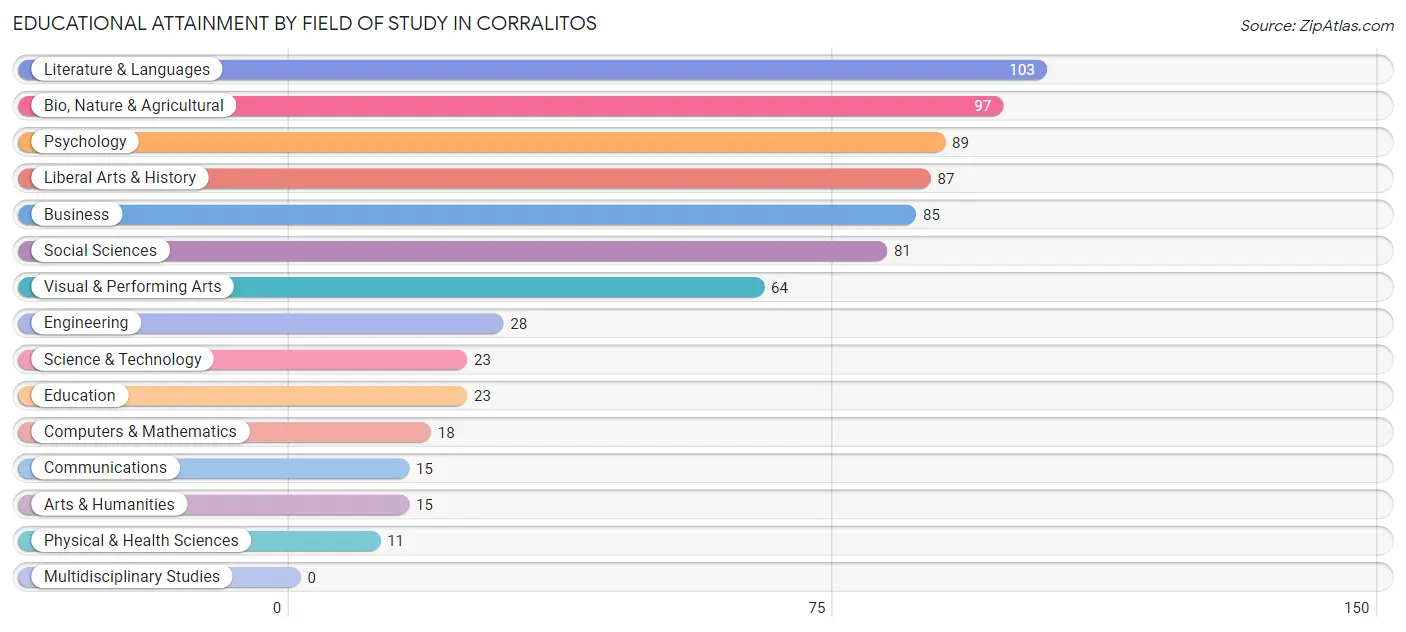
Educational Attainment by Field of Study in Corralitos
Literature & languages (103 | 13.9%), bio, nature & agricultural (97 | 13.1%), psychology (89 | 12.0%), liberal arts & history (87 | 11.8%), and business (85 | 11.5%) are the most common fields of study among 739 individuals in Corralitos who have obtained a bachelor's degree or higher.
| Field of Study | # Graduates | % Graduates |
| Computers & Mathematics | 18 | 2.4% |
| Bio, Nature & Agricultural | 97 | 13.1% |
| Physical & Health Sciences | 11 | 1.5% |
| Psychology | 89 | 12.0% |
| Social Sciences | 81 | 11.0% |
| Engineering | 28 | 3.8% |
| Multidisciplinary Studies | 0 | 0.0% |
| Science & Technology | 23 | 3.1% |
| Business | 85 | 11.5% |
| Education | 23 | 3.1% |
| Literature & Languages | 103 | 13.9% |
| Liberal Arts & History | 87 | 11.8% |
| Visual & Performing Arts | 64 | 8.7% |
| Communications | 15 | 2.0% |
| Arts & Humanities | 15 | 2.0% |
| Total | 739 | 100.0% |
Transportation & Commute in Corralitos
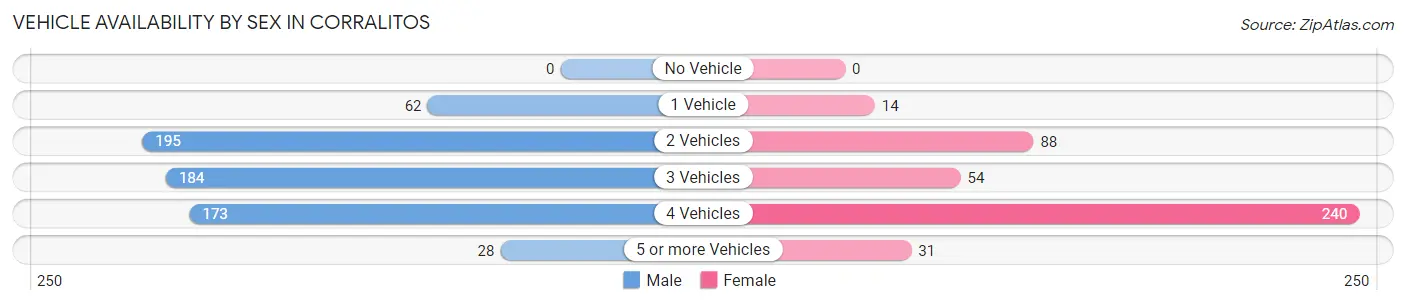
Vehicle Availability by Sex in Corralitos
The most prevalent vehicle ownership categories in Corralitos are males with 2 vehicles (195, accounting for 30.4%) and females with 2 vehicles (88, making up 45.7%).
| Vehicles Available | Male | Female |
| No Vehicle | 0 (0.0%) | 0 (0.0%) |
| 1 Vehicle | 62 (9.7%) | 14 (3.3%) |
| 2 Vehicles | 195 (30.4%) | 88 (20.6%) |
| 3 Vehicles | 184 (28.7%) | 54 (12.7%) |
| 4 Vehicles | 173 (27.0%) | 240 (56.2%) |
| 5 or more Vehicles | 28 (4.4%) | 31 (7.3%) |
| Total | 642 (100.0%) | 427 (100.0%) |
Commute Time in Corralitos
The most frequently occuring commute durations in Corralitos are 15 to 19 minutes (413 commuters, 44.6%), 5 to 9 minutes (200 commuters, 21.6%), and 35 to 39 minutes (112 commuters, 12.1%).
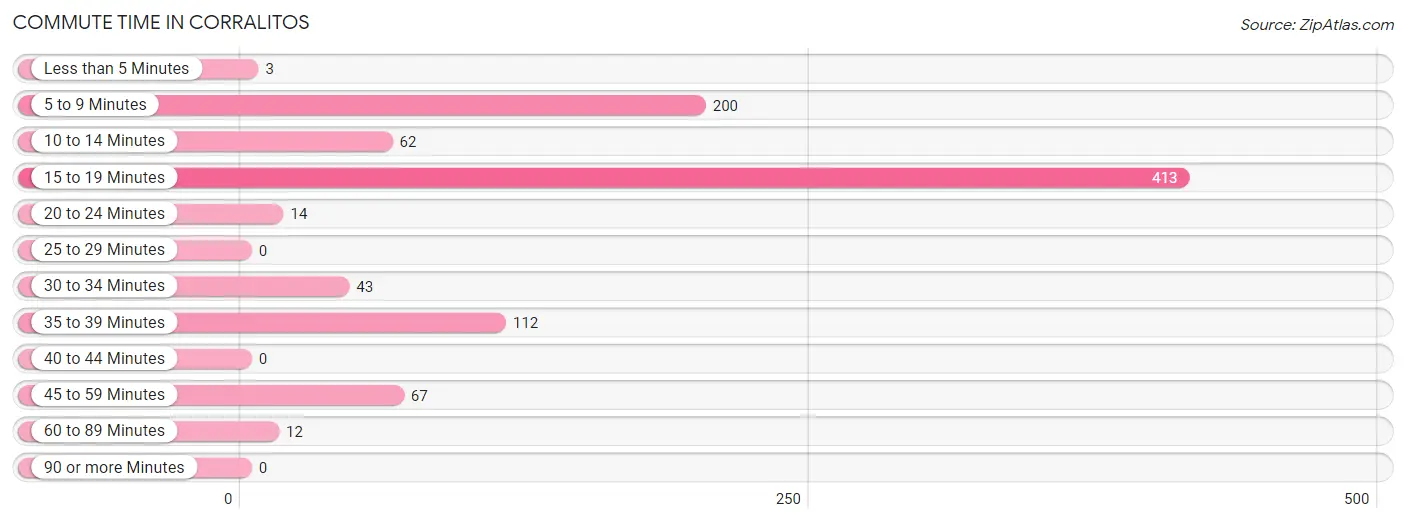
| Commute Time | # Commuters | % Commuters |
| Less than 5 Minutes | 3 | 0.3% |
| 5 to 9 Minutes | 200 | 21.6% |
| 10 to 14 Minutes | 62 | 6.7% |
| 15 to 19 Minutes | 413 | 44.6% |
| 20 to 24 Minutes | 14 | 1.5% |
| 25 to 29 Minutes | 0 | 0.0% |
| 30 to 34 Minutes | 43 | 4.6% |
| 35 to 39 Minutes | 112 | 12.1% |
| 40 to 44 Minutes | 0 | 0.0% |
| 45 to 59 Minutes | 67 | 7.2% |
| 60 to 89 Minutes | 12 | 1.3% |
| 90 or more Minutes | 0 | 0.0% |
Commute Time by Sex in Corralitos
The most common commute times in Corralitos are 5 to 9 minutes (200 commuters, 34.7%) for males and 15 to 19 minutes (243 commuters, 69.4%) for females.
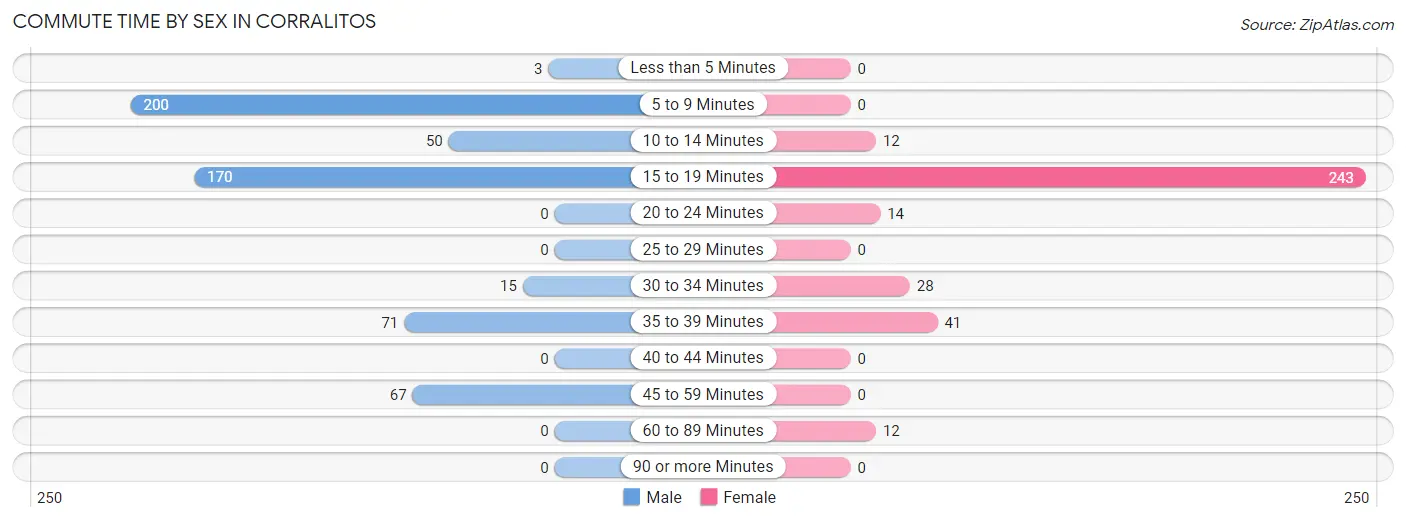
| Commute Time | Male | Female |
| Less than 5 Minutes | 3 (0.5%) | 0 (0.0%) |
| 5 to 9 Minutes | 200 (34.7%) | 0 (0.0%) |
| 10 to 14 Minutes | 50 (8.7%) | 12 (3.4%) |
| 15 to 19 Minutes | 170 (29.5%) | 243 (69.4%) |
| 20 to 24 Minutes | 0 (0.0%) | 14 (4.0%) |
| 25 to 29 Minutes | 0 (0.0%) | 0 (0.0%) |
| 30 to 34 Minutes | 15 (2.6%) | 28 (8.0%) |
| 35 to 39 Minutes | 71 (12.3%) | 41 (11.7%) |
| 40 to 44 Minutes | 0 (0.0%) | 0 (0.0%) |
| 45 to 59 Minutes | 67 (11.6%) | 0 (0.0%) |
| 60 to 89 Minutes | 0 (0.0%) | 12 (3.4%) |
| 90 or more Minutes | 0 (0.0%) | 0 (0.0%) |
Time of Departure to Work by Sex in Corralitos
The most frequent times of departure to work in Corralitos are 8:00 AM to 8:29 AM (173, 30.0%) for males and 10:00 AM to 10:59 AM (239, 68.3%) for females.
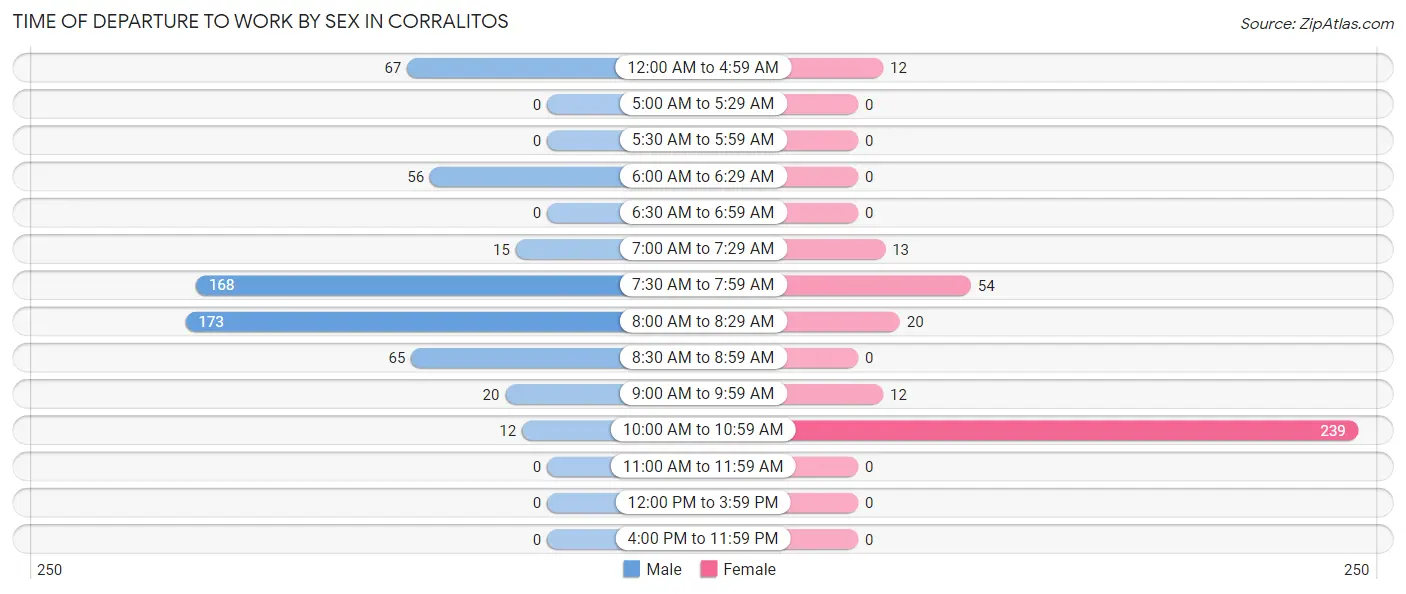
| Time of Departure | Male | Female |
| 12:00 AM to 4:59 AM | 67 (11.6%) | 12 (3.4%) |
| 5:00 AM to 5:29 AM | 0 (0.0%) | 0 (0.0%) |
| 5:30 AM to 5:59 AM | 0 (0.0%) | 0 (0.0%) |
| 6:00 AM to 6:29 AM | 56 (9.7%) | 0 (0.0%) |
| 6:30 AM to 6:59 AM | 0 (0.0%) | 0 (0.0%) |
| 7:00 AM to 7:29 AM | 15 (2.6%) | 13 (3.7%) |
| 7:30 AM to 7:59 AM | 168 (29.2%) | 54 (15.4%) |
| 8:00 AM to 8:29 AM | 173 (30.0%) | 20 (5.7%) |
| 8:30 AM to 8:59 AM | 65 (11.3%) | 0 (0.0%) |
| 9:00 AM to 9:59 AM | 20 (3.5%) | 12 (3.4%) |
| 10:00 AM to 10:59 AM | 12 (2.1%) | 239 (68.3%) |
| 11:00 AM to 11:59 AM | 0 (0.0%) | 0 (0.0%) |
| 12:00 PM to 3:59 PM | 0 (0.0%) | 0 (0.0%) |
| 4:00 PM to 11:59 PM | 0 (0.0%) | 0 (0.0%) |
| Total | 576 (100.0%) | 350 (100.0%) |
Housing Occupancy in Corralitos
Occupancy by Ownership in Corralitos
Of the total 1,145 dwellings in Corralitos, owner-occupied units account for 928 (81.0%), while renter-occupied units make up 217 (19.0%).
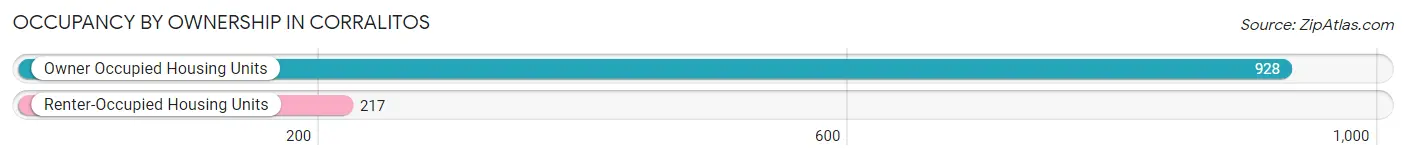
| Occupancy | # Housing Units | % Housing Units |
| Owner Occupied Housing Units | 928 | 81.0% |
| Renter-Occupied Housing Units | 217 | 19.0% |
| Total Occupied Housing Units | 1,145 | 100.0% |
Occupancy by Household Size in Corralitos
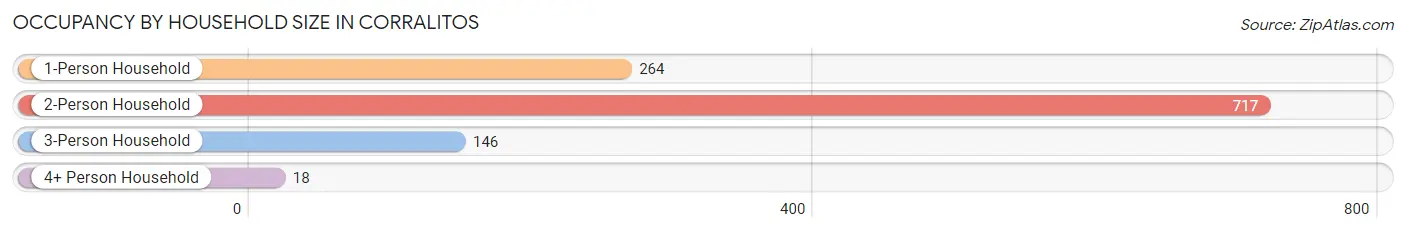
| Household Size | # Housing Units | % Housing Units |
| 1-Person Household | 264 | 23.1% |
| 2-Person Household | 717 | 62.6% |
| 3-Person Household | 146 | 12.8% |
| 4+ Person Household | 18 | 1.6% |
| Total Housing Units | 1,145 | 100.0% |
Occupancy by Ownership by Household Size in Corralitos
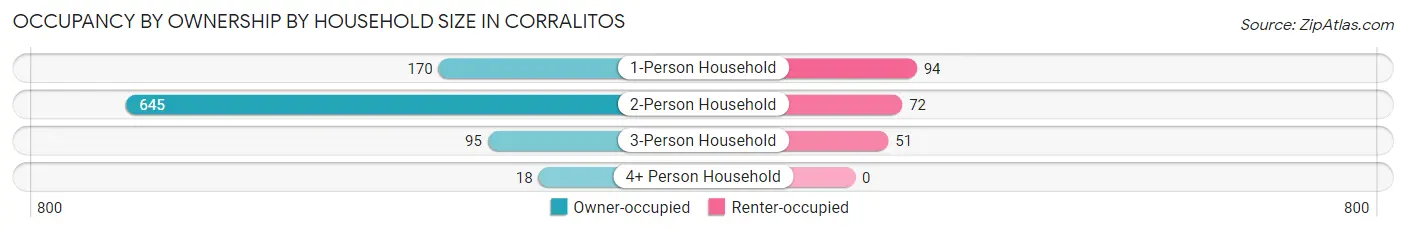
| Household Size | Owner-occupied | Renter-occupied |
| 1-Person Household | 170 (64.4%) | 94 (35.6%) |
| 2-Person Household | 645 (90.0%) | 72 (10.0%) |
| 3-Person Household | 95 (65.1%) | 51 (34.9%) |
| 4+ Person Household | 18 (100.0%) | 0 (0.0%) |
| Total Housing Units | 928 (81.0%) | 217 (19.0%) |
Occupancy by Educational Attainment in Corralitos
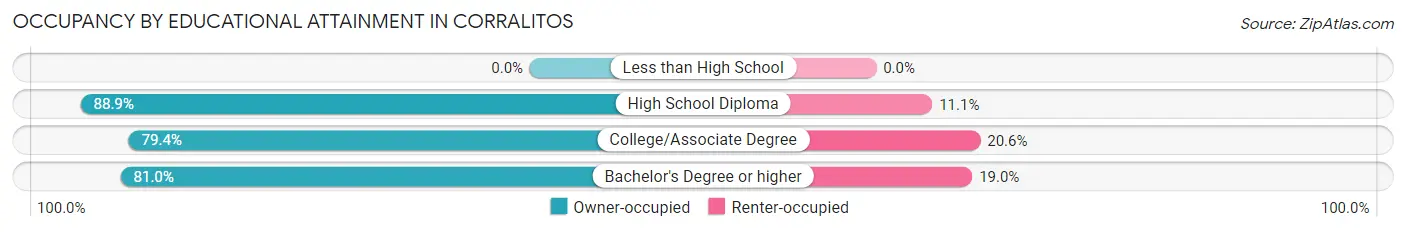
| Household Size | Owner-occupied | Renter-occupied |
| Less than High School | 0 (0.0%) | 0 (0.0%) |
| High School Diploma | 112 (88.9%) | 14 (11.1%) |
| College/Associate Degree | 446 (79.4%) | 116 (20.6%) |
| Bachelor's Degree or higher | 370 (81.0%) | 87 (19.0%) |
Occupancy by Age of Householder in Corralitos
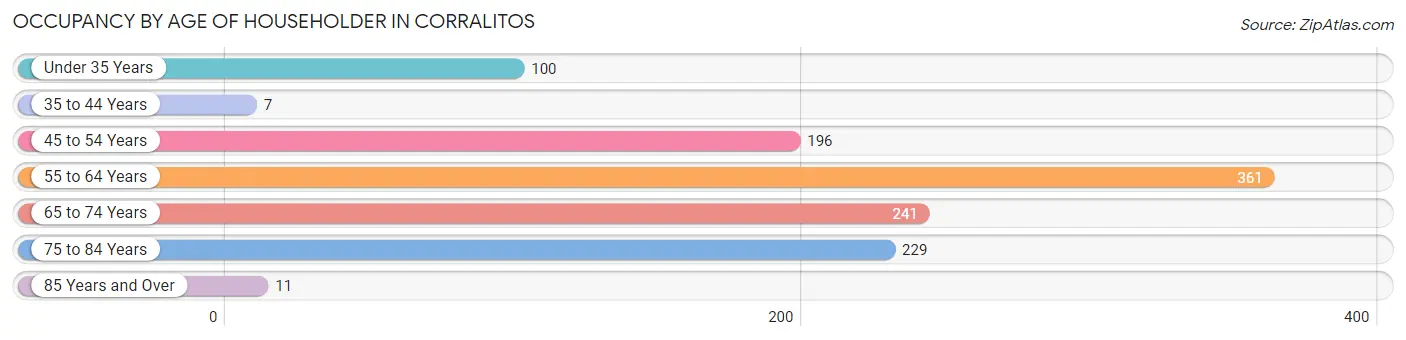
| Age Bracket | # Households | % Households |
| Under 35 Years | 100 | 8.7% |
| 35 to 44 Years | 7 | 0.6% |
| 45 to 54 Years | 196 | 17.1% |
| 55 to 64 Years | 361 | 31.5% |
| 65 to 74 Years | 241 | 21.0% |
| 75 to 84 Years | 229 | 20.0% |
| 85 Years and Over | 11 | 1.0% |
| Total | 1,145 | 100.0% |
Housing Finances in Corralitos
Median Income by Occupancy in Corralitos
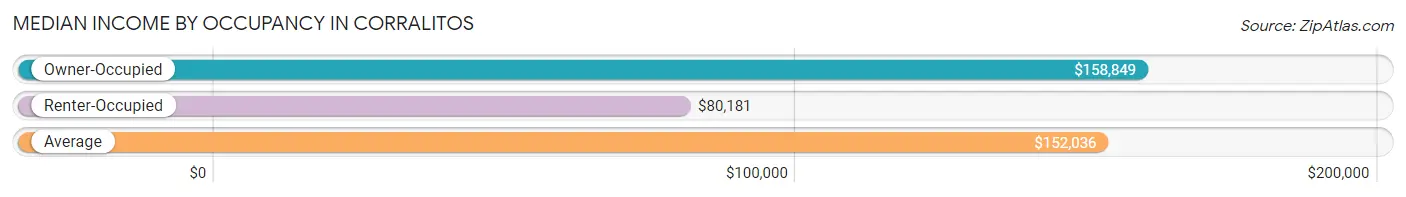
| Occupancy Type | # Households | Median Income |
| Owner-Occupied | 928 (81.0%) | $158,849 |
| Renter-Occupied | 217 (19.0%) | $80,181 |
| Average | 1,145 (100.0%) | $152,036 |
Occupancy by Householder Income Bracket in Corralitos
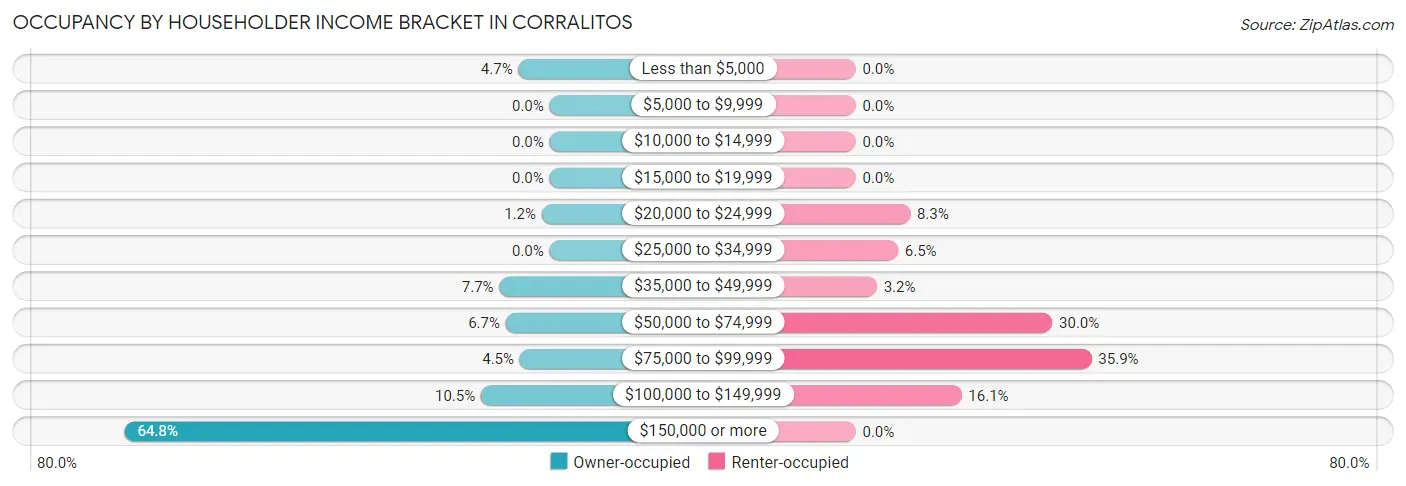
| Income Bracket | Owner-occupied | Renter-occupied |
| Less than $5,000 | 44 (4.7%) | 0 (0.0%) |
| $5,000 to $9,999 | 0 (0.0%) | 0 (0.0%) |
| $10,000 to $14,999 | 0 (0.0%) | 0 (0.0%) |
| $15,000 to $19,999 | 0 (0.0%) | 0 (0.0%) |
| $20,000 to $24,999 | 11 (1.2%) | 18 (8.3%) |
| $25,000 to $34,999 | 0 (0.0%) | 14 (6.5%) |
| $35,000 to $49,999 | 71 (7.6%) | 7 (3.2%) |
| $50,000 to $74,999 | 62 (6.7%) | 65 (29.9%) |
| $75,000 to $99,999 | 42 (4.5%) | 78 (35.9%) |
| $100,000 to $149,999 | 97 (10.4%) | 35 (16.1%) |
| $150,000 or more | 601 (64.8%) | 0 (0.0%) |
| Total | 928 (100.0%) | 217 (100.0%) |
Monthly Housing Cost Tiers in Corralitos
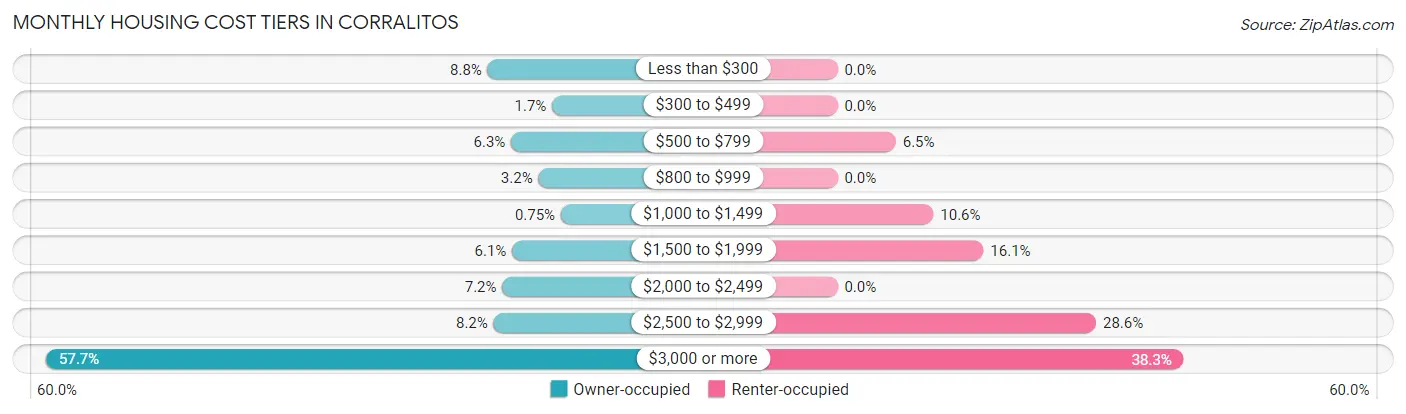
| Monthly Cost | Owner-occupied | Renter-occupied |
| Less than $300 | 82 (8.8%) | 0 (0.0%) |
| $300 to $499 | 16 (1.7%) | 0 (0.0%) |
| $500 to $799 | 58 (6.2%) | 14 (6.5%) |
| $800 to $999 | 30 (3.2%) | 0 (0.0%) |
| $1,000 to $1,499 | 7 (0.7%) | 23 (10.6%) |
| $1,500 to $1,999 | 57 (6.1%) | 35 (16.1%) |
| $2,000 to $2,499 | 67 (7.2%) | 0 (0.0%) |
| $2,500 to $2,999 | 76 (8.2%) | 62 (28.6%) |
| $3,000 or more | 535 (57.7%) | 83 (38.3%) |
| Total | 928 (100.0%) | 217 (100.0%) |
Physical Housing Characteristics in Corralitos
Housing Structures in Corralitos
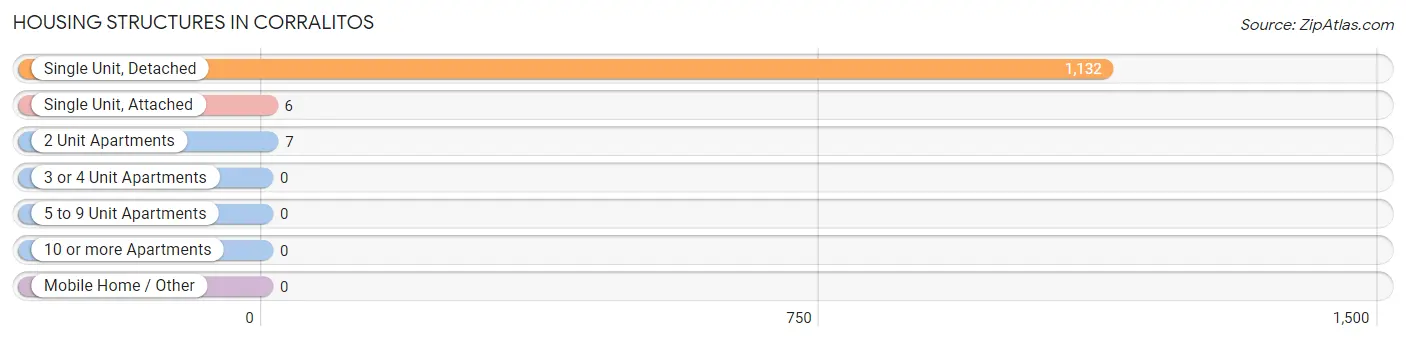
| Structure Type | # Housing Units | % Housing Units |
| Single Unit, Detached | 1,132 | 98.9% |
| Single Unit, Attached | 6 | 0.5% |
| 2 Unit Apartments | 7 | 0.6% |
| 3 or 4 Unit Apartments | 0 | 0.0% |
| 5 to 9 Unit Apartments | 0 | 0.0% |
| 10 or more Apartments | 0 | 0.0% |
| Mobile Home / Other | 0 | 0.0% |
| Total | 1,145 | 100.0% |
Housing Structures by Occupancy in Corralitos
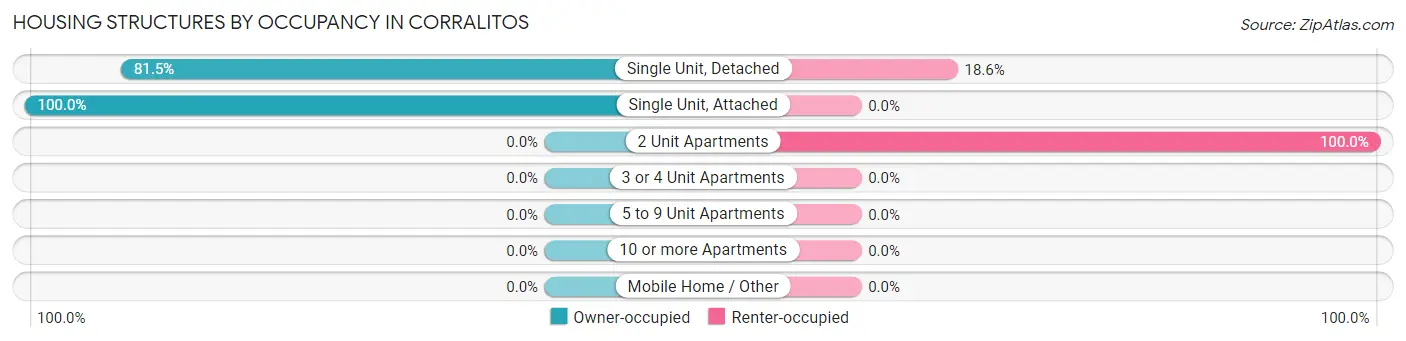
| Structure Type | Owner-occupied | Renter-occupied |
| Single Unit, Detached | 922 (81.5%) | 210 (18.5%) |
| Single Unit, Attached | 6 (100.0%) | 0 (0.0%) |
| 2 Unit Apartments | 0 (0.0%) | 7 (100.0%) |
| 3 or 4 Unit Apartments | 0 (0.0%) | 0 (0.0%) |
| 5 to 9 Unit Apartments | 0 (0.0%) | 0 (0.0%) |
| 10 or more Apartments | 0 (0.0%) | 0 (0.0%) |
| Mobile Home / Other | 0 (0.0%) | 0 (0.0%) |
| Total | 928 (81.0%) | 217 (19.0%) |
Housing Structures by Number of Rooms in Corralitos
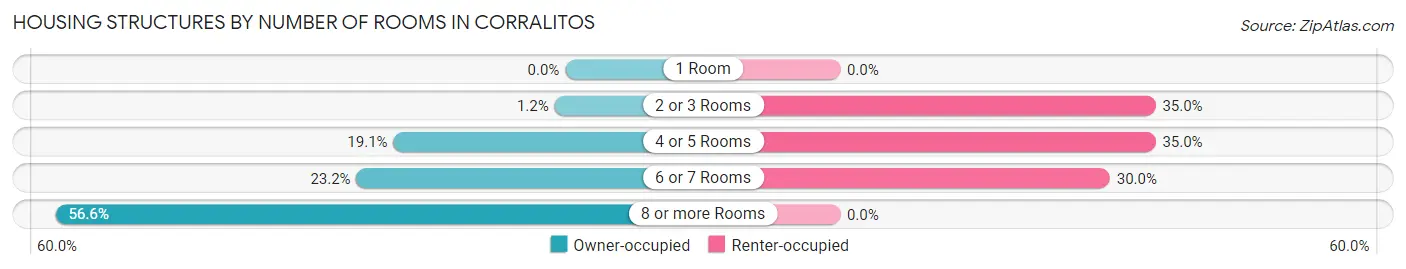
| Number of Rooms | Owner-occupied | Renter-occupied |
| 1 Room | 0 (0.0%) | 0 (0.0%) |
| 2 or 3 Rooms | 11 (1.2%) | 76 (35.0%) |
| 4 or 5 Rooms | 177 (19.1%) | 76 (35.0%) |
| 6 or 7 Rooms | 215 (23.2%) | 65 (29.9%) |
| 8 or more Rooms | 525 (56.6%) | 0 (0.0%) |
| Total | 928 (100.0%) | 217 (100.0%) |
Housing Structure by Heating Type in Corralitos
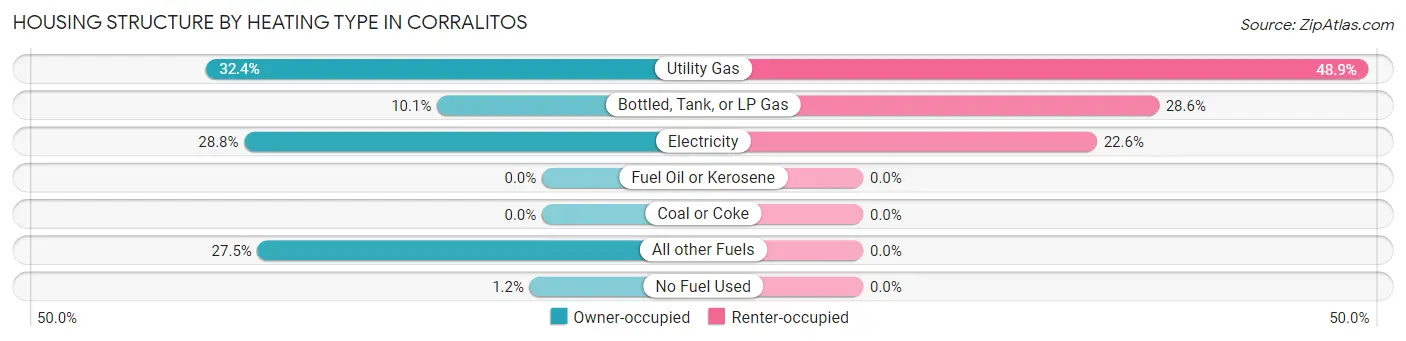
| Heating Type | Owner-occupied | Renter-occupied |
| Utility Gas | 301 (32.4%) | 106 (48.8%) |
| Bottled, Tank, or LP Gas | 94 (10.1%) | 62 (28.6%) |
| Electricity | 267 (28.8%) | 49 (22.6%) |
| Fuel Oil or Kerosene | 0 (0.0%) | 0 (0.0%) |
| Coal or Coke | 0 (0.0%) | 0 (0.0%) |
| All other Fuels | 255 (27.5%) | 0 (0.0%) |
| No Fuel Used | 11 (1.2%) | 0 (0.0%) |
| Total | 928 (100.0%) | 217 (100.0%) |
Household Vehicle Usage in Corralitos
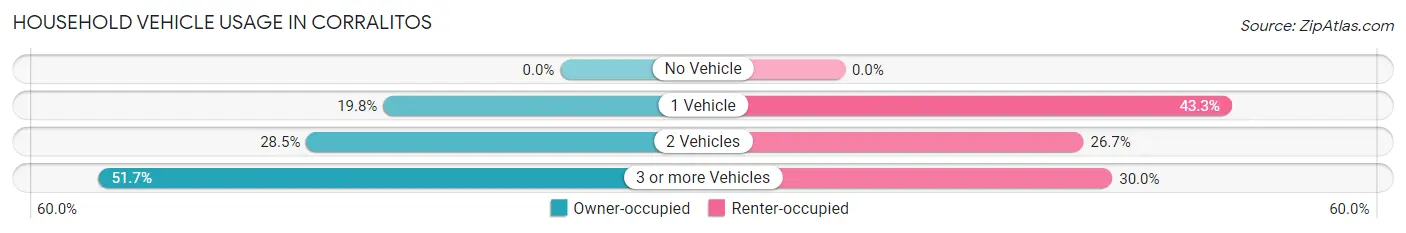
| Vehicles per Household | Owner-occupied | Renter-occupied |
| No Vehicle | 0 (0.0%) | 0 (0.0%) |
| 1 Vehicle | 184 (19.8%) | 94 (43.3%) |
| 2 Vehicles | 264 (28.4%) | 58 (26.7%) |
| 3 or more Vehicles | 480 (51.7%) | 65 (29.9%) |
| Total | 928 (100.0%) | 217 (100.0%) |
Real Estate & Mortgages in Corralitos
Real Estate and Mortgage Overview in Corralitos
| Characteristic | Without Mortgage | With Mortgage |
| Housing Units | 225 | 703 |
| Median Property Value | $1,452,200 | $1,227,000 |
| Median Household Income | $95,547 | $515 |
| Monthly Housing Costs | $537 | $535 |
| Real Estate Taxes | $2,548 | $0 |
Property Value by Mortgage Status in Corralitos
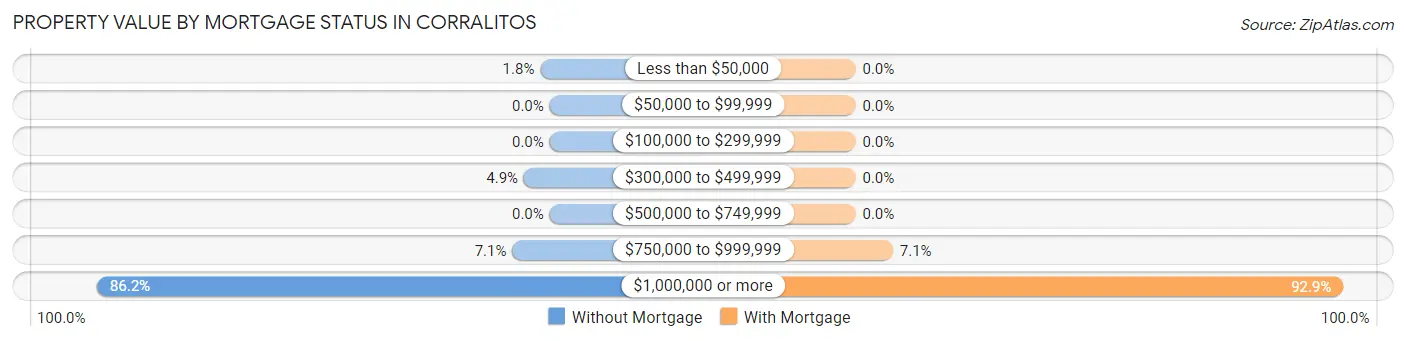
| Property Value | Without Mortgage | With Mortgage |
| Less than $50,000 | 4 (1.8%) | 0 (0.0%) |
| $50,000 to $99,999 | 0 (0.0%) | 0 (0.0%) |
| $100,000 to $299,999 | 0 (0.0%) | 0 (0.0%) |
| $300,000 to $499,999 | 11 (4.9%) | 0 (0.0%) |
| $500,000 to $749,999 | 0 (0.0%) | 0 (0.0%) |
| $750,000 to $999,999 | 16 (7.1%) | 50 (7.1%) |
| $1,000,000 or more | 194 (86.2%) | 653 (92.9%) |
| Total | 225 (100.0%) | 703 (100.0%) |
Household Income by Mortgage Status in Corralitos
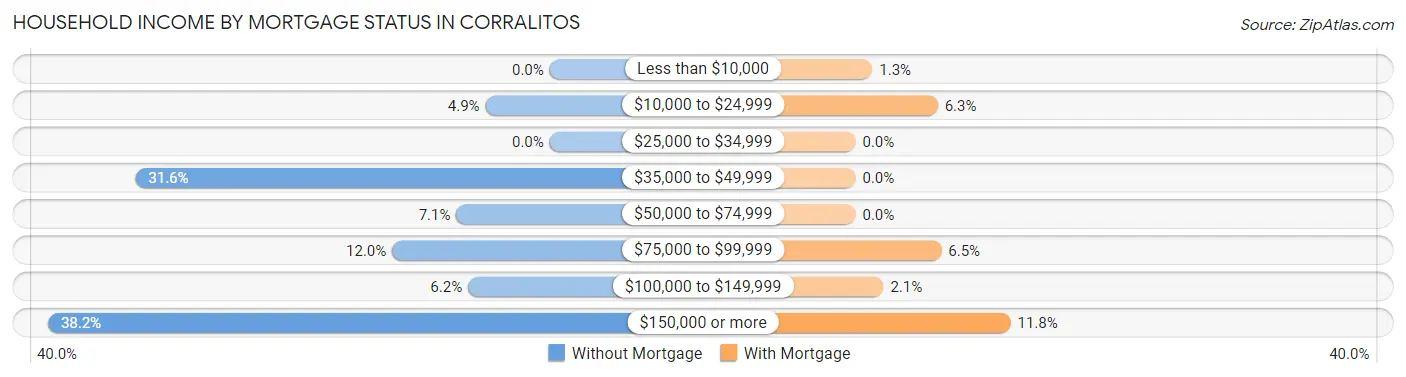
| Household Income | Without Mortgage | With Mortgage |
| Less than $10,000 | 0 (0.0%) | 9 (1.3%) |
| $10,000 to $24,999 | 11 (4.9%) | 44 (6.3%) |
| $25,000 to $34,999 | 0 (0.0%) | 0 (0.0%) |
| $35,000 to $49,999 | 71 (31.6%) | 0 (0.0%) |
| $50,000 to $74,999 | 16 (7.1%) | 0 (0.0%) |
| $75,000 to $99,999 | 27 (12.0%) | 46 (6.5%) |
| $100,000 to $149,999 | 14 (6.2%) | 15 (2.1%) |
| $150,000 or more | 86 (38.2%) | 83 (11.8%) |
| Total | 225 (100.0%) | 703 (100.0%) |
Property Value to Household Income Ratio in Corralitos
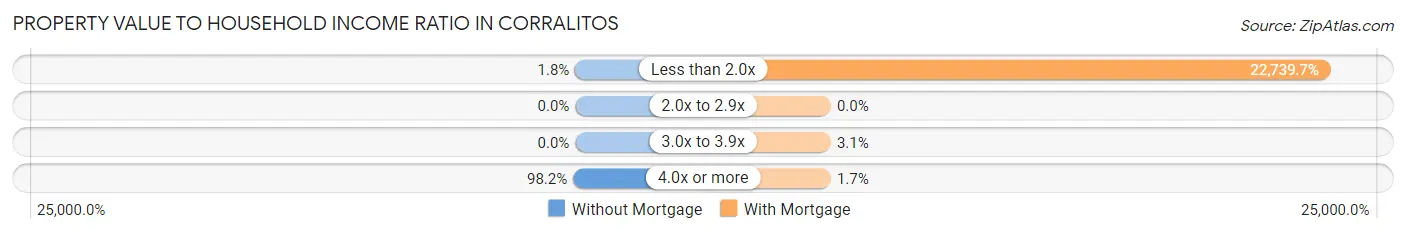
| Value-to-Income Ratio | Without Mortgage | With Mortgage |
| Less than 2.0x | 4 (1.8%) | 159,860 (22,739.7%) |
| 2.0x to 2.9x | 0 (0.0%) | 0 (0.0%) |
| 3.0x to 3.9x | 0 (0.0%) | 22 (3.1%) |
| 4.0x or more | 221 (98.2%) | 12 (1.7%) |
| Total | 225 (100.0%) | 703 (100.0%) |
Real Estate Taxes by Mortgage Status in Corralitos
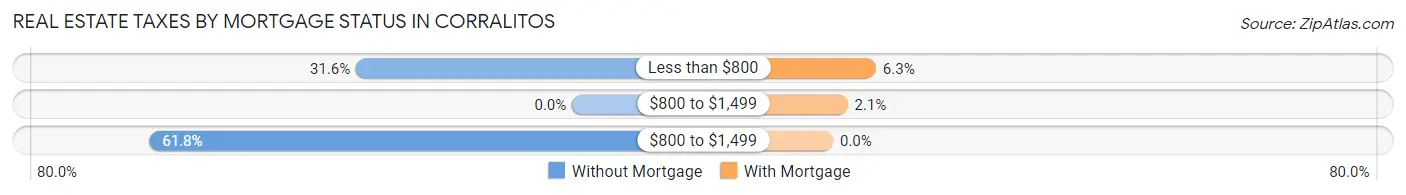
| Property Taxes | Without Mortgage | With Mortgage |
| Less than $800 | 71 (31.6%) | 44 (6.3%) |
| $800 to $1,499 | 0 (0.0%) | 15 (2.1%) |
| $800 to $1,499 | 139 (61.8%) | 0 (0.0%) |
| Total | 225 (100.0%) | 703 (100.0%) |
Health & Disability in Corralitos
Health Insurance Coverage by Age in Corralitos
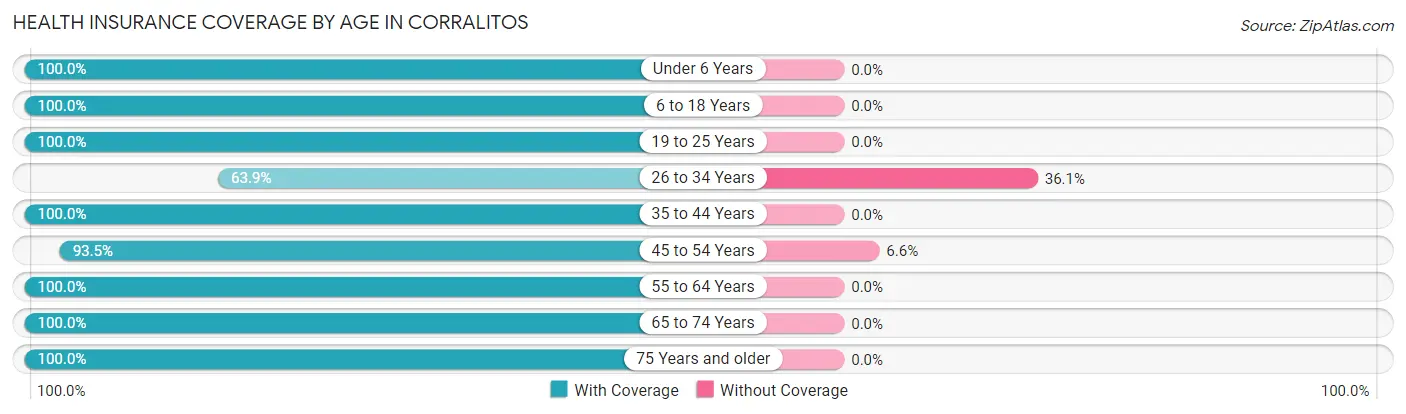
| Age Bracket | With Coverage | Without Coverage |
| Under 6 Years | 11 (100.0%) | 0 (0.0%) |
| 6 to 18 Years | 44 (100.0%) | 0 (0.0%) |
| 19 to 25 Years | 66 (100.0%) | 0 (0.0%) |
| 26 to 34 Years | 147 (63.9%) | 83 (36.1%) |
| 35 to 44 Years | 134 (100.0%) | 0 (0.0%) |
| 45 to 54 Years | 271 (93.4%) | 19 (6.6%) |
| 55 to 64 Years | 639 (100.0%) | 0 (0.0%) |
| 65 to 74 Years | 319 (100.0%) | 0 (0.0%) |
| 75 Years and older | 421 (100.0%) | 0 (0.0%) |
| Total | 2,052 (95.3%) | 102 (4.7%) |
Health Insurance Coverage by Citizenship Status in Corralitos
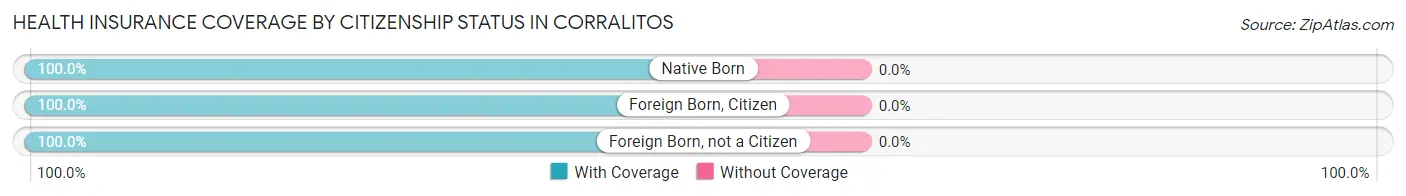
| Citizenship Status | With Coverage | Without Coverage |
| Native Born | 11 (100.0%) | 0 (0.0%) |
| Foreign Born, Citizen | 44 (100.0%) | 0 (0.0%) |
| Foreign Born, not a Citizen | 66 (100.0%) | 0 (0.0%) |
Health Insurance Coverage by Household Income in Corralitos
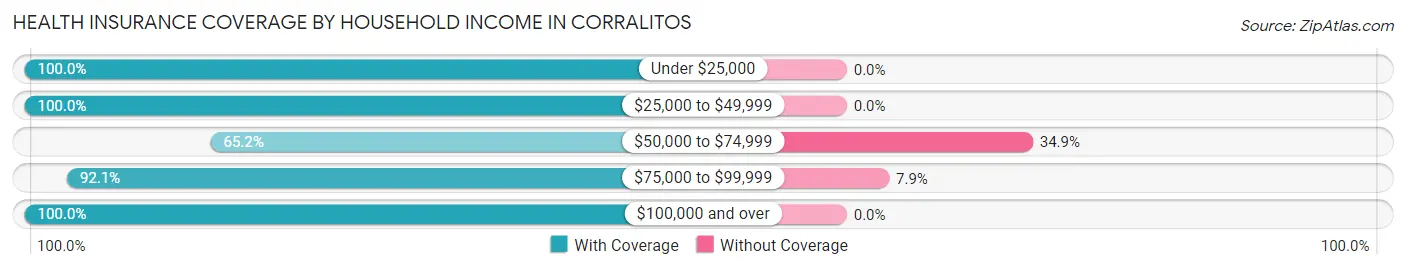
| Household Income | With Coverage | Without Coverage |
| Under $25,000 | 86 (100.0%) | 0 (0.0%) |
| $25,000 to $49,999 | 156 (100.0%) | 0 (0.0%) |
| $50,000 to $74,999 | 157 (65.1%) | 84 (34.8%) |
| $75,000 to $99,999 | 209 (92.1%) | 18 (7.9%) |
| $100,000 and over | 1,433 (100.0%) | 0 (0.0%) |
Public vs Private Health Insurance Coverage by Age in Corralitos
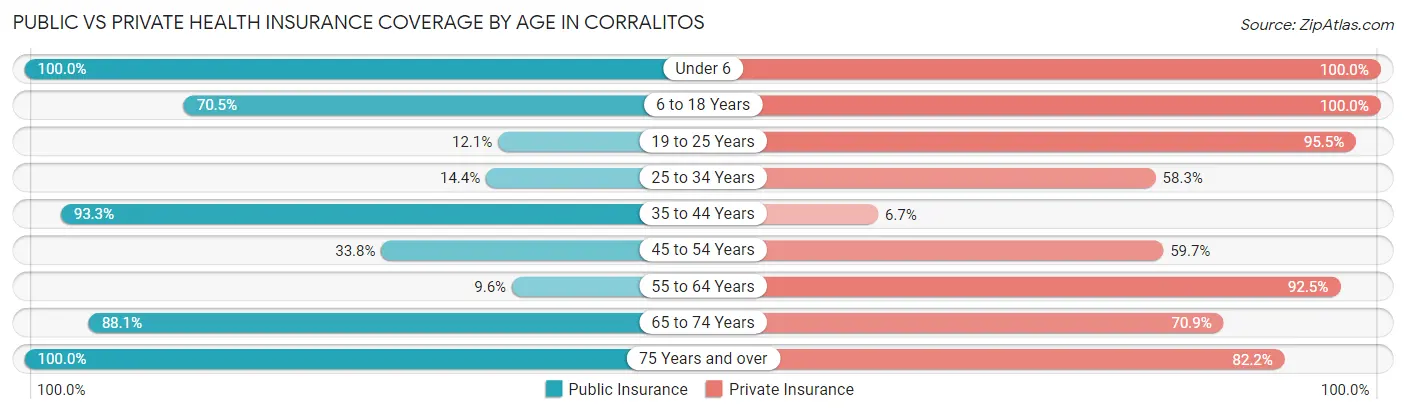
| Age Bracket | Public Insurance | Private Insurance |
| Under 6 | 11 (100.0%) | 11 (100.0%) |
| 6 to 18 Years | 31 (70.5%) | 44 (100.0%) |
| 19 to 25 Years | 8 (12.1%) | 63 (95.5%) |
| 25 to 34 Years | 33 (14.3%) | 134 (58.3%) |
| 35 to 44 Years | 125 (93.3%) | 9 (6.7%) |
| 45 to 54 Years | 98 (33.8%) | 173 (59.7%) |
| 55 to 64 Years | 61 (9.6%) | 591 (92.5%) |
| 65 to 74 Years | 281 (88.1%) | 226 (70.9%) |
| 75 Years and over | 421 (100.0%) | 346 (82.2%) |
| Total | 1,069 (49.6%) | 1,597 (74.1%) |
Disability Status by Sex by Age in Corralitos
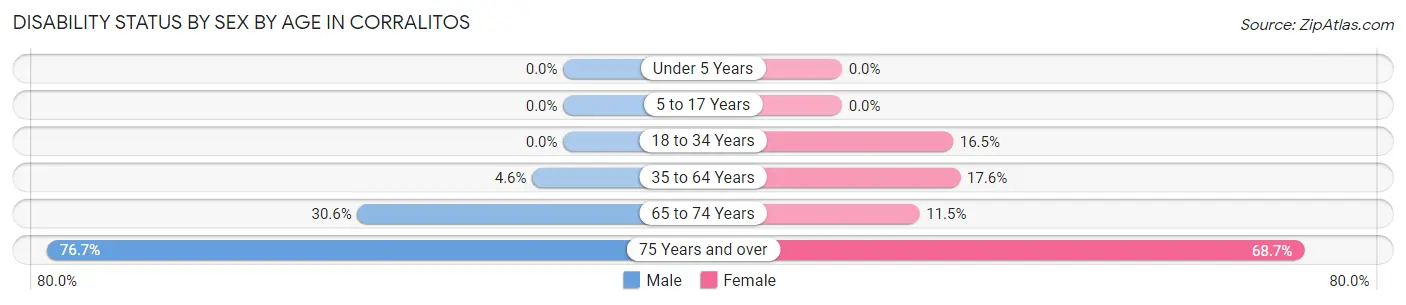
| Age Bracket | Male | Female |
| Under 5 Years | 0 (0.0%) | 0 (0.0%) |
| 5 to 17 Years | 0 (0.0%) | 0 (0.0%) |
| 18 to 34 Years | 0 (0.0%) | 15 (16.5%) |
| 35 to 64 Years | 24 (4.6%) | 95 (17.6%) |
| 65 to 74 Years | 55 (30.6%) | 16 (11.5%) |
| 75 Years and over | 181 (76.7%) | 127 (68.6%) |
Disability Class by Sex by Age in Corralitos
Disability Class: Hearing Difficulty
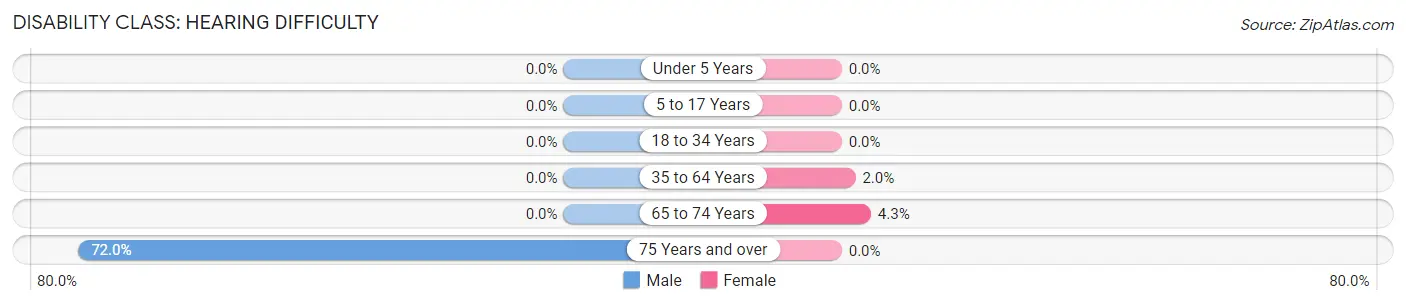
| Age Bracket | Male | Female |
| Under 5 Years | 0 (0.0%) | 0 (0.0%) |
| 5 to 17 Years | 0 (0.0%) | 0 (0.0%) |
| 18 to 34 Years | 0 (0.0%) | 0 (0.0%) |
| 35 to 64 Years | 0 (0.0%) | 11 (2.0%) |
| 65 to 74 Years | 0 (0.0%) | 6 (4.3%) |
| 75 Years and over | 170 (72.0%) | 0 (0.0%) |
Disability Class: Vision Difficulty
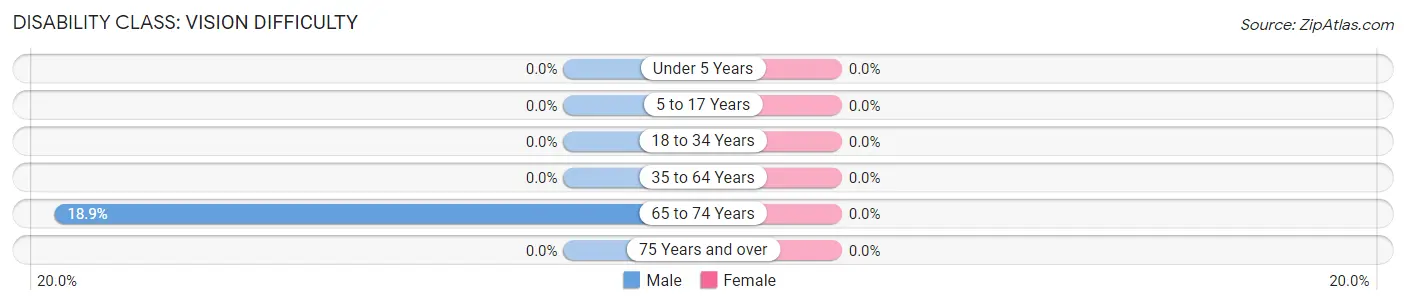
| Age Bracket | Male | Female |
| Under 5 Years | 0 (0.0%) | 0 (0.0%) |
| 5 to 17 Years | 0 (0.0%) | 0 (0.0%) |
| 18 to 34 Years | 0 (0.0%) | 0 (0.0%) |
| 35 to 64 Years | 0 (0.0%) | 0 (0.0%) |
| 65 to 74 Years | 34 (18.9%) | 0 (0.0%) |
| 75 Years and over | 0 (0.0%) | 0 (0.0%) |
Disability Class: Cognitive Difficulty
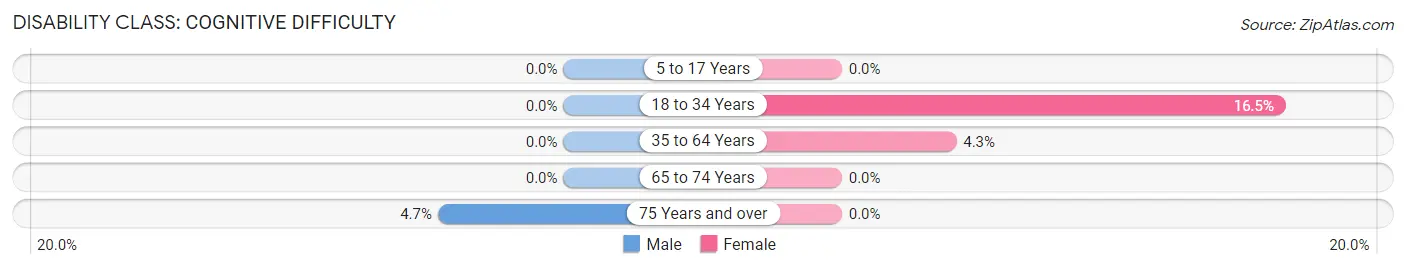
| Age Bracket | Male | Female |
| 5 to 17 Years | 0 (0.0%) | 0 (0.0%) |
| 18 to 34 Years | 0 (0.0%) | 15 (16.5%) |
| 35 to 64 Years | 0 (0.0%) | 23 (4.3%) |
| 65 to 74 Years | 0 (0.0%) | 0 (0.0%) |
| 75 Years and over | 11 (4.7%) | 0 (0.0%) |
Disability Class: Ambulatory Difficulty
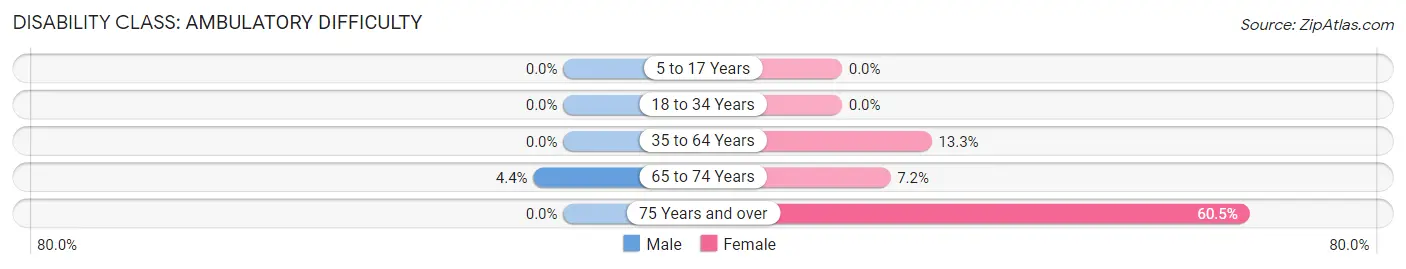
| Age Bracket | Male | Female |
| 5 to 17 Years | 0 (0.0%) | 0 (0.0%) |
| 18 to 34 Years | 0 (0.0%) | 0 (0.0%) |
| 35 to 64 Years | 0 (0.0%) | 72 (13.3%) |
| 65 to 74 Years | 8 (4.4%) | 10 (7.2%) |
| 75 Years and over | 0 (0.0%) | 112 (60.5%) |
Disability Class: Self-Care Difficulty
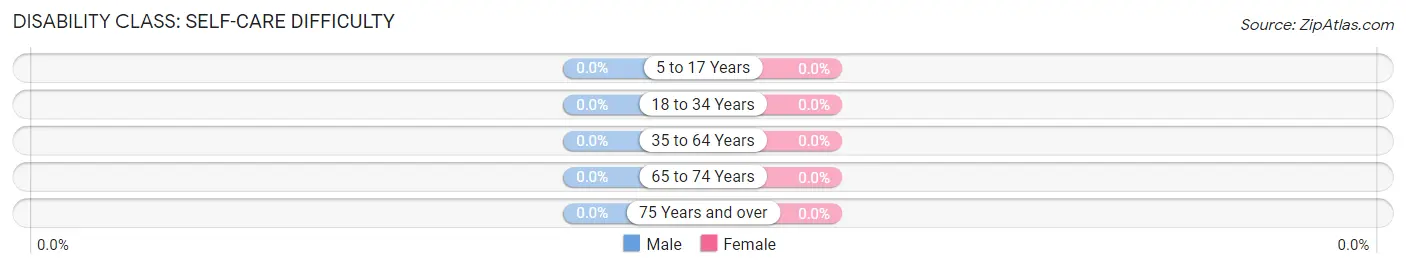
| Age Bracket | Male | Female |
| 5 to 17 Years | 0 (0.0%) | 0 (0.0%) |
| 18 to 34 Years | 0 (0.0%) | 0 (0.0%) |
| 35 to 64 Years | 0 (0.0%) | 0 (0.0%) |
| 65 to 74 Years | 0 (0.0%) | 0 (0.0%) |
| 75 Years and over | 0 (0.0%) | 0 (0.0%) |
Technology Access in Corralitos
Computing Device Access in Corralitos
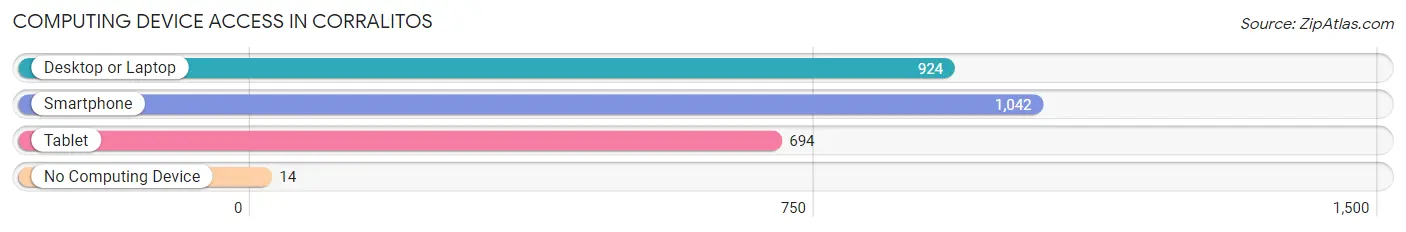
| Device Type | # Households | % Households |
| Desktop or Laptop | 924 | 80.7% |
| Smartphone | 1,042 | 91.0% |
| Tablet | 694 | 60.6% |
| No Computing Device | 14 | 1.2% |
| Total | 1,145 | 100.0% |
Internet Access in Corralitos
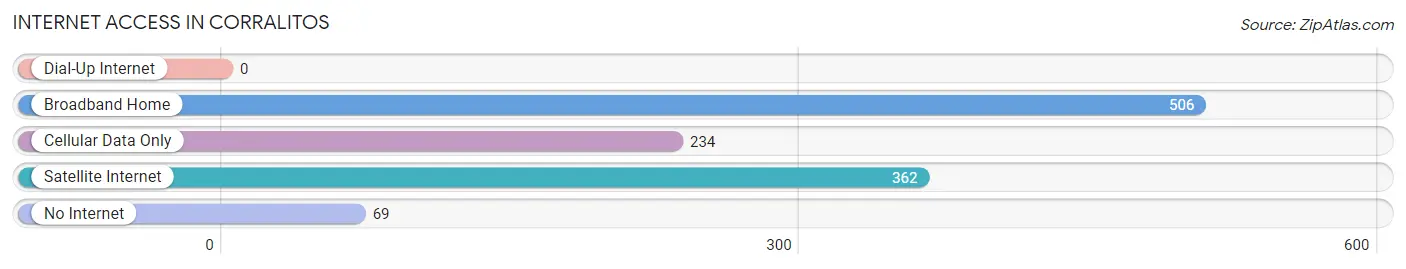
| Internet Type | # Households | % Households |
| Dial-Up Internet | 0 | 0.0% |
| Broadband Home | 506 | 44.2% |
| Cellular Data Only | 234 | 20.4% |
| Satellite Internet | 362 | 31.6% |
| No Internet | 69 | 6.0% |
| Total | 1,145 | 100.0% |
Corralitos Summary
Corralitos, California is a small unincorporated community located in Santa Cruz County, California. It is situated in the foothills of the Santa Cruz Mountains, approximately 8 miles east of the city of Watsonville. The population of Corralitos was estimated to be 2,845 in 2019.
History
Corralitos was originally inhabited by the Ohlone people, who lived in the area for thousands of years before the arrival of Europeans. The first Europeans to settle in the area were Spanish missionaries, who established the Mission Santa Cruz in 1791. The mission was abandoned in 1834, and the land was divided into large ranchos. In the mid-19th century, the area was settled by Mexican and Portuguese immigrants, who established small farms and ranches.
In the late 19th century, the area was settled by Italian immigrants, who established vineyards and wineries. The area was known as “Little Italy” for many years. In the early 20th century, the area was settled by Japanese immigrants, who established truck farms and nurseries.
Geography
Corralitos is located in the foothills of the Santa Cruz Mountains, approximately 8 miles east of the city of Watsonville. The area is characterized by rolling hills, oak woodlands, and grasslands. The climate is mild, with temperatures ranging from the mid-50s to the mid-70s.
Economy
The economy of Corralitos is largely based on agriculture. The area is home to numerous vineyards and wineries, as well as truck farms and nurseries. The area is also home to several small businesses, including restaurants, shops, and services.
Demographics
As of 2019, the population of Corralitos was estimated to be 2,845. The racial makeup of the town was 79.3% White, 0.7% African American, 0.3% Native American, 0.7% Asian, 0.1% Pacific Islander, 16.2% from other races, and 2.9% from two or more races. Hispanic or Latino of any race were 33.2% of the population.
The median household income in Corralitos was $68,958, and the median family income was $76,958. The per capita income was $30,958. About 11.2% of families and 14.2% of the population were below the poverty line, including 18.2% of those under age 18 and 8.2% of those age 65 or over.
Conclusion
Corralitos, California is a small unincorporated community located in Santa Cruz County, California. It is situated in the foothills of the Santa Cruz Mountains, approximately 8 miles east of the city of Watsonville. The population of Corralitos was estimated to be 2,845 in 2019. The economy of Corralitos is largely based on agriculture, with numerous vineyards and wineries, as well as truck farms and nurseries. The racial makeup of the town was 79.3% White, 0.7% African American, 0.3% Native American, 0.7% Asian, 0.1% Pacific Islander, 16.2% from other races, and 2.9% from two or more races. Hispanic or Latino of any race were 33.2% of the population. The median household income in Corralitos was $68,958, and the median family income was $76,958. The per capita income was $30,958.
Common Questions
What is Per Capita Income in Corralitos?
Per Capita income in Corralitos is $80,333.
What is the Median Family Income in Corralitos?
Median Family Income in Corralitos is $159,095.
What is the Median Household income in Corralitos?
Median Household Income in Corralitos is $152,036.
What is Inequality or Gini Index in Corralitos?
Inequality or Gini Index in Corralitos is 0.37.
What is the Total Population of Corralitos?
Total Population of Corralitos is 2,154.
What is the Total Male Population of Corralitos?
Total Male Population of Corralitos is 1,150.
What is the Total Female Population of Corralitos?
Total Female Population of Corralitos is 1,004.
What is the Ratio of Males per 100 Females in Corralitos?
There are 114.54 Males per 100 Females in Corralitos.
What is the Ratio of Females per 100 Males in Corralitos?
There are 87.30 Females per 100 Males in Corralitos.
What is the Median Population Age in Corralitos?
Median Population Age in Corralitos is 60.6 Years.
What is the Average Family Size in Corralitos
Average Family Size in Corralitos is 2.0 People.
What is the Average Household Size in Corralitos
Average Household Size in Corralitos is 1.9 People.
How Large is the Labor Force in Corralitos?
There are 1,200 People in the Labor Forcein in Corralitos.
What is the Percentage of People in the Labor Force in Corralitos?
56.8% of People are in the Labor Force in Corralitos.
What is the Unemployment Rate in Corralitos?
Unemployment Rate in Corralitos is 10.8%.