Cherry Valley, CA Map & Demographics
Cherry Valley Map
Cherry Valley Overview
$40,655
PER CAPITA INCOME
$94,099
AVG FAMILY INCOME
$83,994
AVG HOUSEHOLD INCOME
29.6%
WAGE / INCOME GAP [ % ]
70.4¢/ $1
WAGE / INCOME GAP [ $ ]
0.47
INEQUALITY / GINI INDEX
7,652
TOTAL POPULATION
3,988
MALE POPULATION
3,664
FEMALE POPULATION
108.84
MALES / 100 FEMALES
91.88
FEMALES / 100 MALES
49.7
MEDIAN AGE
3.3
AVG FAMILY SIZE
2.8
AVG HOUSEHOLD SIZE
3,461
LABOR FORCE [ PEOPLE ]
52.7%
PERCENT IN LABOR FORCE
11.2%
UNEMPLOYMENT RATE
Cherry Valley Area Codes
Income in Cherry Valley
Income Overview in Cherry Valley
Per Capita Income in Cherry Valley is $40,655, while median incomes of families and households are $94,099 and $83,994 respectively.
| Characteristic | Number | Measure |
| Per Capita Income | 7,652 | $40,655 |
| Median Family Income | 1,835 | $94,099 |
| Mean Family Income | 1,835 | $125,829 |
| Median Household Income | 2,707 | $83,994 |
| Mean Household Income | 2,707 | $112,095 |
| Income Deficit | 1,835 | $0 |
| Wage / Income Gap (%) | 7,652 | 29.59% |
| Wage / Income Gap ($) | 7,652 | 70.41¢ per $1 |
| Gini / Inequality Index | 7,652 | 0.47 |
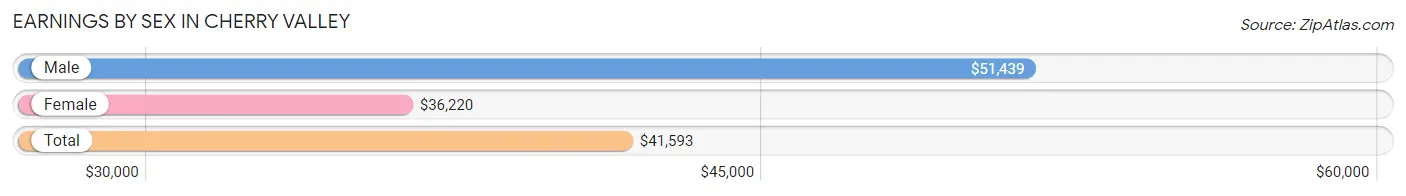
Earnings by Sex in Cherry Valley
Average Earnings in Cherry Valley are $41,593, $51,439 for men and $36,220 for women, a difference of 29.6%.
| Sex | Number | Average Earnings |
| Male | 1,792 (53.2%) | $51,439 |
| Female | 1,576 (46.8%) | $36,220 |
| Total | 3,368 (100.0%) | $41,593 |
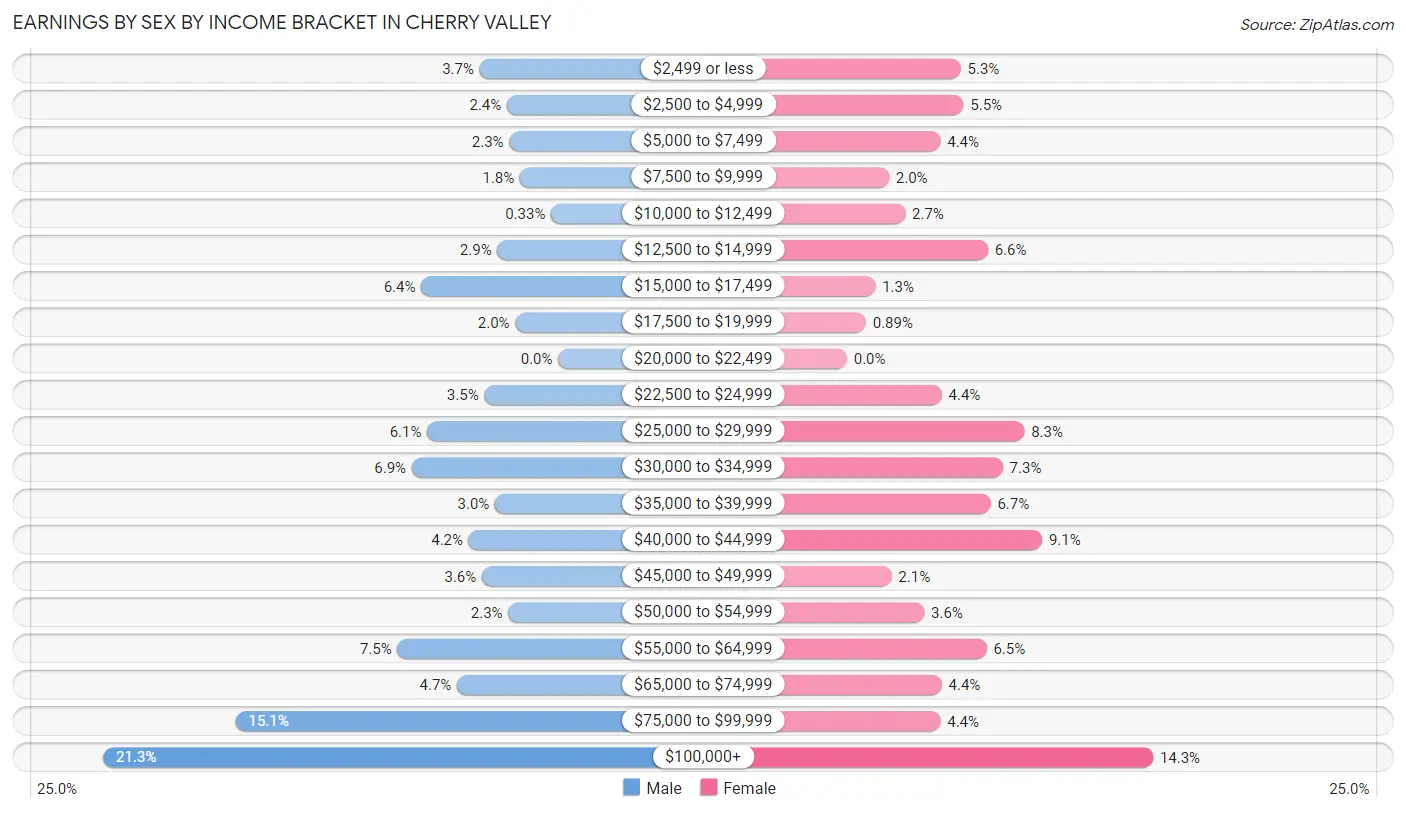
Earnings by Sex by Income Bracket in Cherry Valley
The most common earnings brackets in Cherry Valley are $100,000+ for men (382 | 21.3%) and $100,000+ for women (226 | 14.3%).
| Income | Male | Female |
| $2,499 or less | 66 (3.7%) | 84 (5.3%) |
| $2,500 to $4,999 | 43 (2.4%) | 86 (5.5%) |
| $5,000 to $7,499 | 41 (2.3%) | 69 (4.4%) |
| $7,500 to $9,999 | 32 (1.8%) | 31 (2.0%) |
| $10,000 to $12,499 | 6 (0.3%) | 43 (2.7%) |
| $12,500 to $14,999 | 51 (2.9%) | 104 (6.6%) |
| $15,000 to $17,499 | 115 (6.4%) | 21 (1.3%) |
| $17,500 to $19,999 | 36 (2.0%) | 14 (0.9%) |
| $20,000 to $22,499 | 0 (0.0%) | 0 (0.0%) |
| $22,500 to $24,999 | 62 (3.5%) | 70 (4.4%) |
| $25,000 to $29,999 | 110 (6.1%) | 131 (8.3%) |
| $30,000 to $34,999 | 123 (6.9%) | 115 (7.3%) |
| $35,000 to $39,999 | 53 (3.0%) | 106 (6.7%) |
| $40,000 to $44,999 | 75 (4.2%) | 144 (9.1%) |
| $45,000 to $49,999 | 64 (3.6%) | 33 (2.1%) |
| $50,000 to $54,999 | 42 (2.3%) | 57 (3.6%) |
| $55,000 to $64,999 | 135 (7.5%) | 103 (6.5%) |
| $65,000 to $74,999 | 85 (4.7%) | 70 (4.4%) |
| $75,000 to $99,999 | 271 (15.1%) | 69 (4.4%) |
| $100,000+ | 382 (21.3%) | 226 (14.3%) |
| Total | 1,792 (100.0%) | 1,576 (100.0%) |
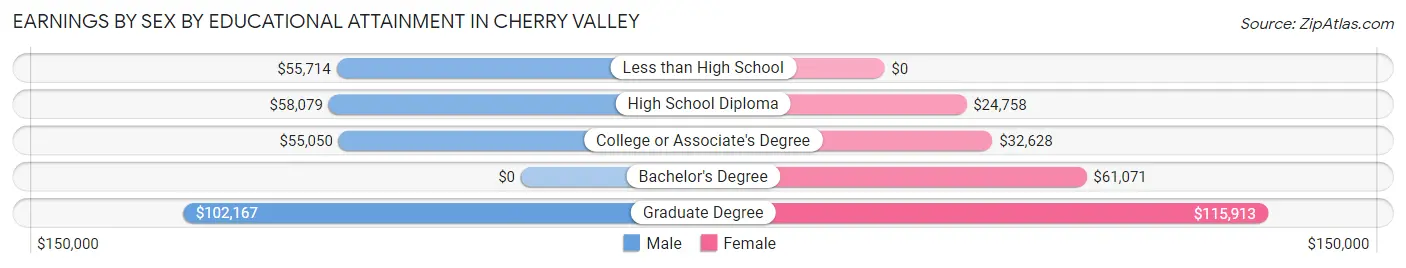
Earnings by Sex by Educational Attainment in Cherry Valley
Average earnings in Cherry Valley are $56,917 for men and $38,942 for women, a difference of 31.6%. Men with an educational attainment of graduate degree enjoy the highest average annual earnings of $102,167, while those with college or associate's degree education earn the least with $55,050. Women with an educational attainment of graduate degree earn the most with the average annual earnings of $115,913, while those with high school diploma education have the smallest earnings of $24,758.
| Educational Attainment | Male Income | Female Income |
| Less than High School | $55,714 | $0 |
| High School Diploma | $58,079 | $24,758 |
| College or Associate's Degree | $55,050 | $32,628 |
| Bachelor's Degree | - | - |
| Graduate Degree | $102,167 | $115,913 |
| Total | $56,917 | $38,942 |
Family Income in Cherry Valley
Family Income Brackets in Cherry Valley
According to the Cherry Valley family income data, there are 453 families falling into the $100,000 to $149,999 income range, which is the most common income bracket and makes up 24.7% of all families.
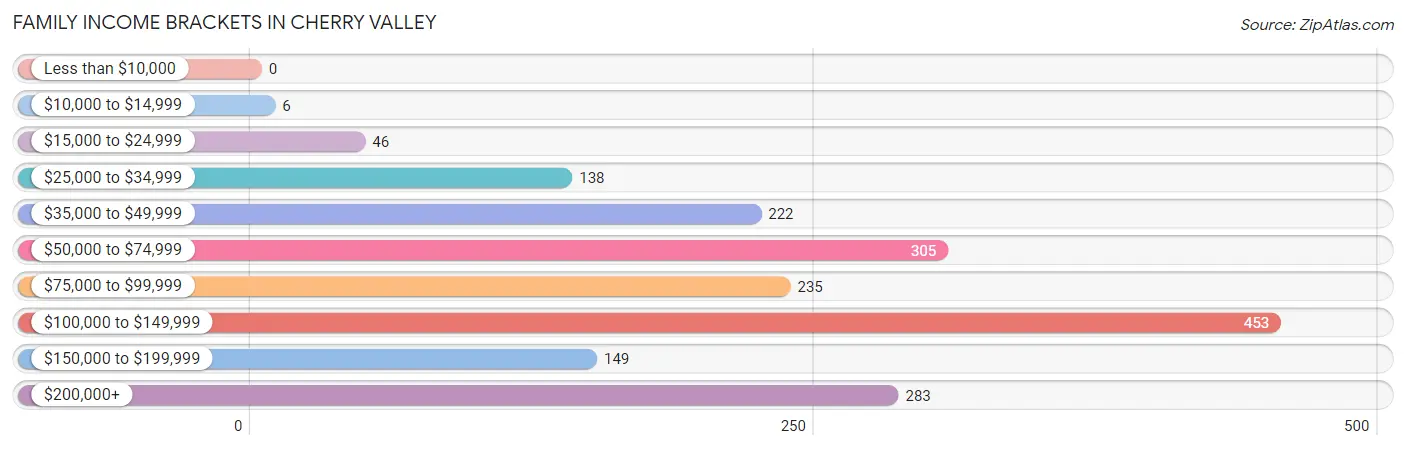
| Income Bracket | # Families | % Families |
| Less than $10,000 | 0 | 0.0% |
| $10,000 to $14,999 | 6 | 0.3% |
| $15,000 to $24,999 | 46 | 2.5% |
| $25,000 to $34,999 | 138 | 7.5% |
| $35,000 to $49,999 | 222 | 12.1% |
| $50,000 to $74,999 | 305 | 16.6% |
| $75,000 to $99,999 | 235 | 12.8% |
| $100,000 to $149,999 | 453 | 24.7% |
| $150,000 to $199,999 | 149 | 8.1% |
| $200,000+ | 283 | 15.4% |
Family Income by Famaliy Size in Cherry Valley
6-person families (105 | 5.7%) account for the highest median family income in Cherry Valley with $146,058 per family, while 2-person families (886 | 48.3%) have the highest median income of $38,315 per family member.
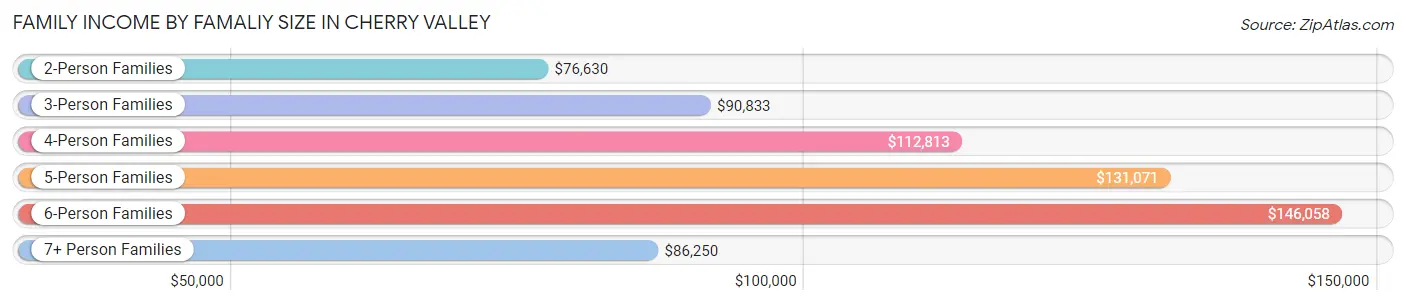
| Income Bracket | # Families | Median Income |
| 2-Person Families | 886 (48.3%) | $76,630 |
| 3-Person Families | 382 (20.8%) | $90,833 |
| 4-Person Families | 331 (18.0%) | $112,813 |
| 5-Person Families | 66 (3.6%) | $131,071 |
| 6-Person Families | 105 (5.7%) | $146,058 |
| 7+ Person Families | 65 (3.5%) | $86,250 |
| Total | 1,835 (100.0%) | $94,099 |
Family Income by Number of Earners in Cherry Valley
The median family income in Cherry Valley is $94,099, with families comprising 3+ earners (272) having the highest median family income of $179,559, while families with no earners (398) have the lowest median family income of $44,875, accounting for 14.8% and 21.7% of families, respectively.
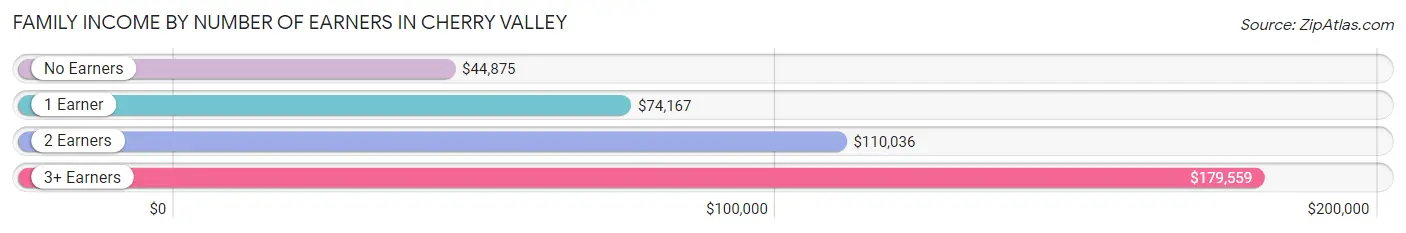
| Number of Earners | # Families | Median Income |
| No Earners | 398 (21.7%) | $44,875 |
| 1 Earner | 576 (31.4%) | $74,167 |
| 2 Earners | 589 (32.1%) | $110,036 |
| 3+ Earners | 272 (14.8%) | $179,559 |
| Total | 1,835 (100.0%) | $94,099 |
Household Income in Cherry Valley
Household Income Brackets in Cherry Valley
With 577 households falling in the category, the $100,000 to $149,999 income range is the most frequent in Cherry Valley, accounting for 21.3% of all households. In contrast, only 16 households (0.6%) fall into the less than $10,000 income bracket, making it the least populous group.
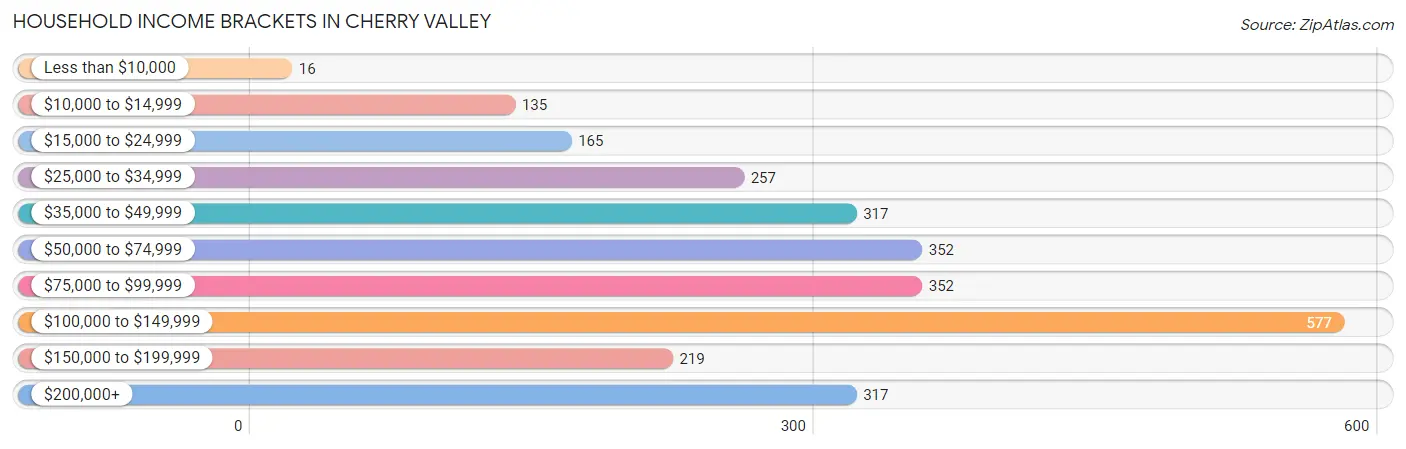
| Income Bracket | # Households | % Households |
| Less than $10,000 | 16 | 0.6% |
| $10,000 to $14,999 | 135 | 5.0% |
| $15,000 to $24,999 | 165 | 6.1% |
| $25,000 to $34,999 | 257 | 9.5% |
| $35,000 to $49,999 | 317 | 11.7% |
| $50,000 to $74,999 | 352 | 13.0% |
| $75,000 to $99,999 | 352 | 13.0% |
| $100,000 to $149,999 | 577 | 21.3% |
| $150,000 to $199,999 | 219 | 8.1% |
| $200,000+ | 317 | 11.7% |
Household Income by Householder Age in Cherry Valley
The median household income in Cherry Valley is $83,994, with the highest median household income of $110,179 found in the 45 to 64 years age bracket for the primary householder. A total of 912 households (33.7%) fall into this category.
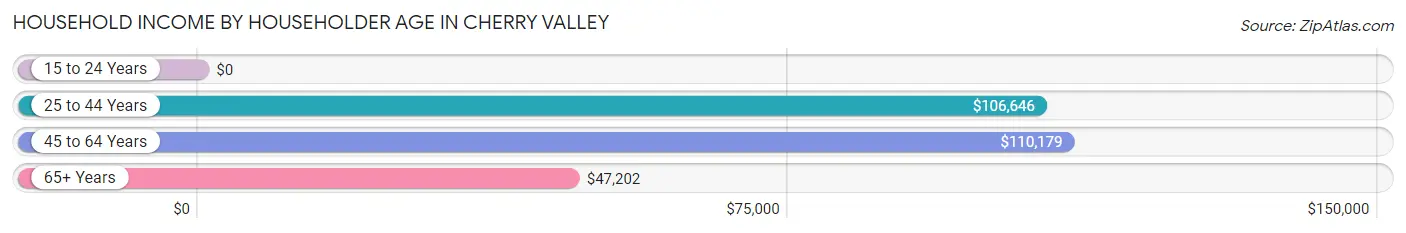
| Income Bracket | # Households | Median Income |
| 15 to 24 Years | 0 (0.0%) | $0 |
| 25 to 44 Years | 446 (16.5%) | $106,646 |
| 45 to 64 Years | 912 (33.7%) | $110,179 |
| 65+ Years | 1,349 (49.8%) | $47,202 |
| Total | 2,707 (100.0%) | $83,994 |
Poverty in Cherry Valley
Income Below Poverty by Sex and Age in Cherry Valley
With 12.8% poverty level for males and 6.9% for females among the residents of Cherry Valley, 12 to 14 year old males and 18 to 24 year old females are the most vulnerable to poverty, with 99 males (43.4%) and 55 females (16.6%) in their respective age groups living below the poverty level.
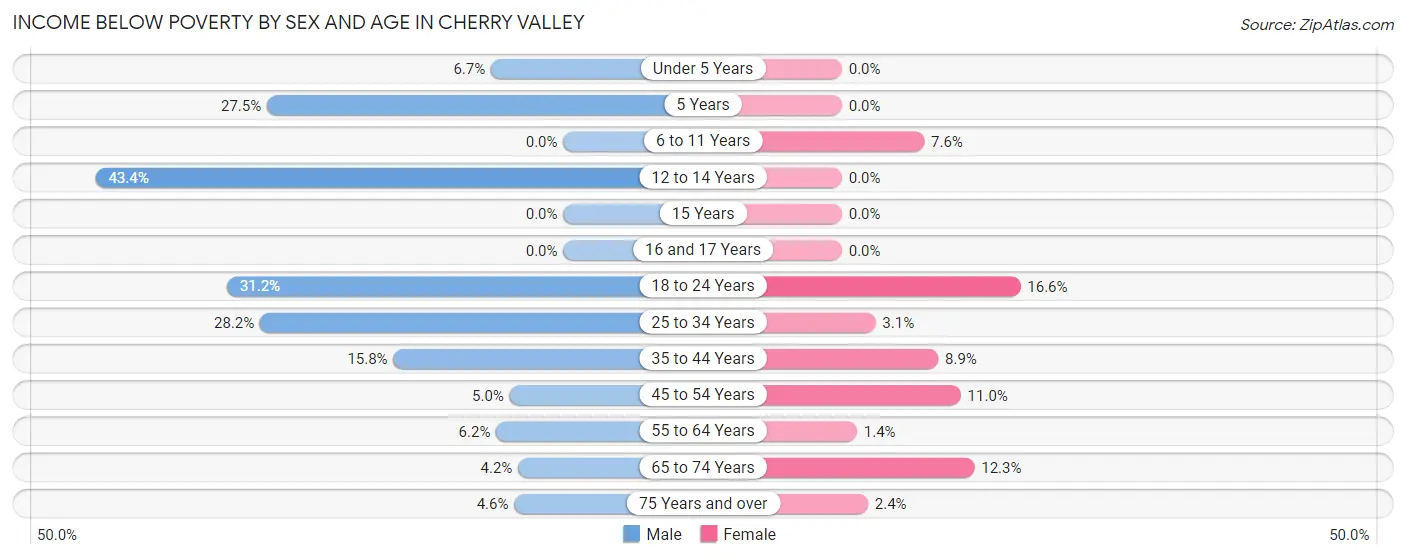
| Age Bracket | Male | Female |
| Under 5 Years | 10 (6.7%) | 0 (0.0%) |
| 5 Years | 11 (27.5%) | 0 (0.0%) |
| 6 to 11 Years | 0 (0.0%) | 11 (7.6%) |
| 12 to 14 Years | 99 (43.4%) | 0 (0.0%) |
| 15 Years | 0 (0.0%) | 0 (0.0%) |
| 16 and 17 Years | 0 (0.0%) | 0 (0.0%) |
| 18 to 24 Years | 64 (31.2%) | 55 (16.6%) |
| 25 to 34 Years | 143 (28.1%) | 10 (3.1%) |
| 35 to 44 Years | 73 (15.8%) | 33 (8.9%) |
| 45 to 54 Years | 15 (5.0%) | 43 (11.0%) |
| 55 to 64 Years | 44 (6.2%) | 8 (1.4%) |
| 65 to 74 Years | 22 (4.2%) | 76 (12.3%) |
| 75 Years and over | 21 (4.5%) | 13 (2.4%) |
| Total | 502 (12.8%) | 249 (6.9%) |
Income Above Poverty by Sex and Age in Cherry Valley
According to the poverty statistics in Cherry Valley, males aged 6 to 11 years and females aged under 5 years are the age groups that are most secure financially, with 100.0% of males and 100.0% of females in these age groups living above the poverty line.
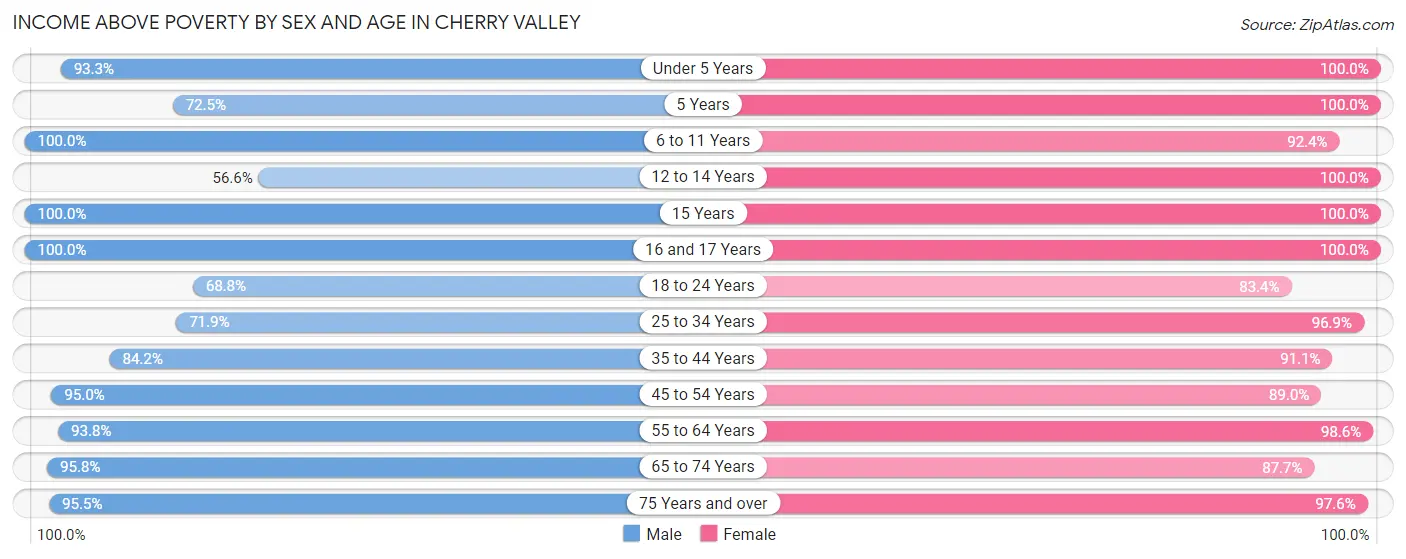
| Age Bracket | Male | Female |
| Under 5 Years | 139 (93.3%) | 146 (100.0%) |
| 5 Years | 29 (72.5%) | 25 (100.0%) |
| 6 to 11 Years | 207 (100.0%) | 133 (92.4%) |
| 12 to 14 Years | 129 (56.6%) | 24 (100.0%) |
| 15 Years | 47 (100.0%) | 58 (100.0%) |
| 16 and 17 Years | 95 (100.0%) | 97 (100.0%) |
| 18 to 24 Years | 141 (68.8%) | 277 (83.4%) |
| 25 to 34 Years | 365 (71.9%) | 310 (96.9%) |
| 35 to 44 Years | 390 (84.2%) | 336 (91.1%) |
| 45 to 54 Years | 286 (95.0%) | 347 (89.0%) |
| 55 to 64 Years | 662 (93.8%) | 564 (98.6%) |
| 65 to 74 Years | 503 (95.8%) | 542 (87.7%) |
| 75 Years and over | 441 (95.5%) | 525 (97.6%) |
| Total | 3,434 (87.3%) | 3,384 (93.1%) |
Income Below Poverty Among Married-Couple Families in Cherry Valley
The poverty statistics for married-couple families in Cherry Valley show that 1.1% or 16 of the total 1,485 families live below the poverty line. Families with 3 or 4 children have the highest poverty rate of 29.4%, comprising of 10 families. On the other hand, families with 1 or 2 children have the lowest poverty rate of 0.0%, which includes 0 families.
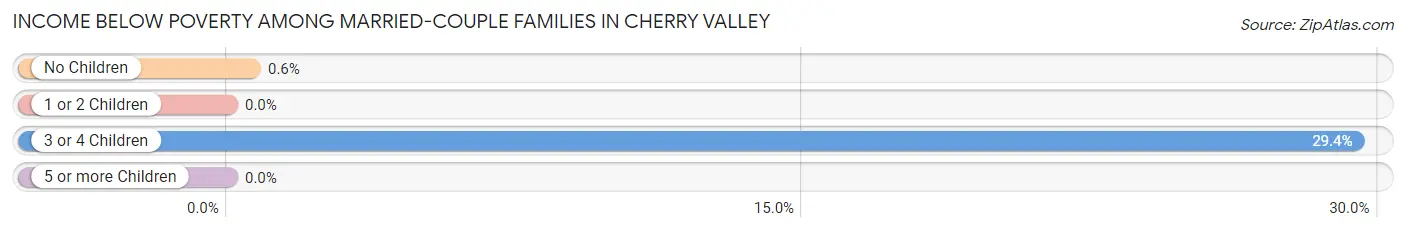
| Children | Above Poverty | Below Poverty |
| No Children | 998 (99.4%) | 6 (0.6%) |
| 1 or 2 Children | 426 (100.0%) | 0 (0.0%) |
| 3 or 4 Children | 24 (70.6%) | 10 (29.4%) |
| 5 or more Children | 21 (100.0%) | 0 (0.0%) |
| Total | 1,469 (98.9%) | 16 (1.1%) |
Income Below Poverty Among Single-Parent Households in Cherry Valley
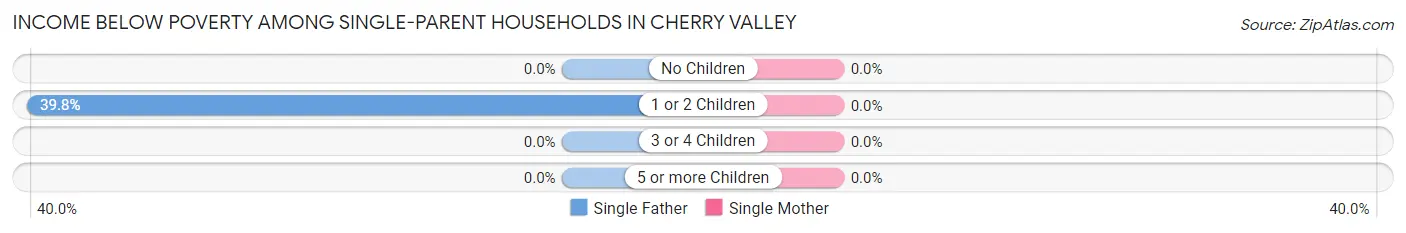
| Children | Single Father | Single Mother |
| No Children | 0 (0.0%) | 0 (0.0%) |
| 1 or 2 Children | 41 (39.8%) | 0 (0.0%) |
| 3 or 4 Children | 0 (0.0%) | 0 (0.0%) |
| 5 or more Children | 0 (0.0%) | 0 (0.0%) |
| Total | 41 (20.1%) | 0 (0.0%) |
Income Below Poverty Among Married-Couple vs Single-Parent Households in Cherry Valley
The poverty data for Cherry Valley shows that 16 of the married-couple family households (1.1%) and 41 of the single-parent households (11.7%) are living below the poverty level. Within the married-couple family households, those with 3 or 4 children have the highest poverty rate, with 10 households (29.4%) falling below the poverty line. Among the single-parent households, those with 1 or 2 children have the highest poverty rate, with 41 household (22.7%) living below poverty.
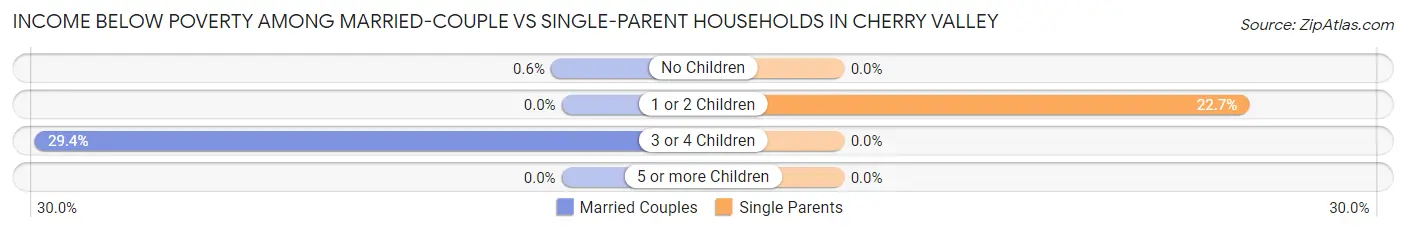
| Children | Married-Couple Families | Single-Parent Households |
| No Children | 6 (0.6%) | 0 (0.0%) |
| 1 or 2 Children | 0 (0.0%) | 41 (22.7%) |
| 3 or 4 Children | 10 (29.4%) | 0 (0.0%) |
| 5 or more Children | 0 (0.0%) | 0 (0.0%) |
| Total | 16 (1.1%) | 41 (11.7%) |
Race in Cherry Valley
The most populous races in Cherry Valley are White / Caucasian (5,523 | 72.2%), Hispanic or Latino (2,448 | 32.0%), and Two or more Races (806 | 10.5%).
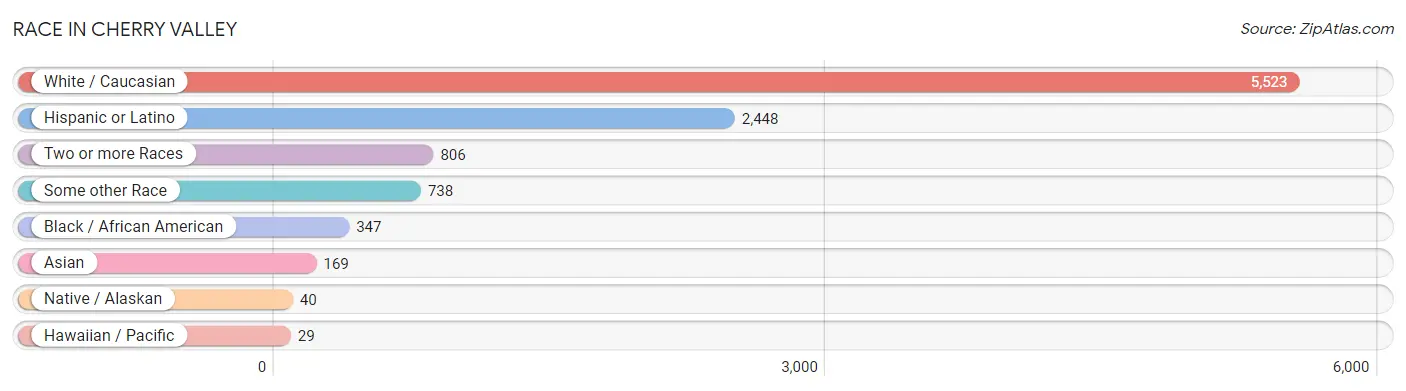
| Race | # Population | % Population |
| Asian | 169 | 2.2% |
| Black / African American | 347 | 4.5% |
| Hawaiian / Pacific | 29 | 0.4% |
| Hispanic or Latino | 2,448 | 32.0% |
| Native / Alaskan | 40 | 0.5% |
| White / Caucasian | 5,523 | 72.2% |
| Two or more Races | 806 | 10.5% |
| Some other Race | 738 | 9.6% |
| Total | 7,652 | 100.0% |
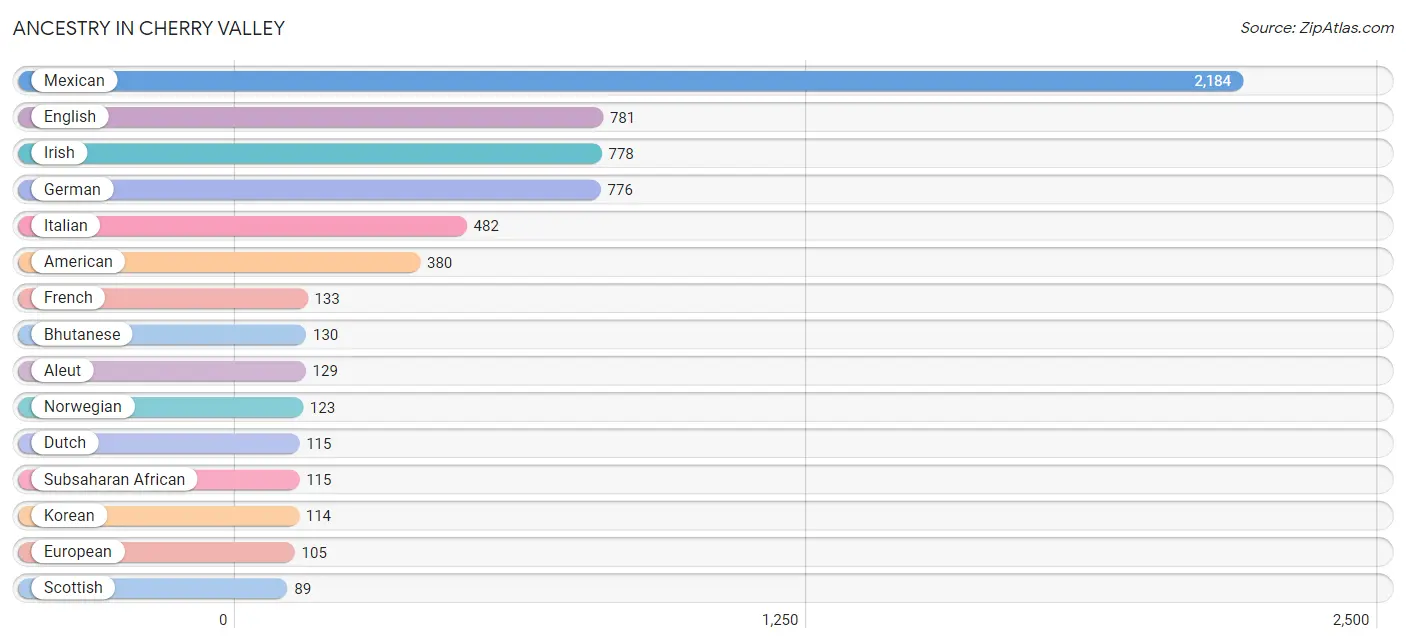
Ancestry in Cherry Valley
The most populous ancestries reported in Cherry Valley are Mexican (2,184 | 28.5%), English (781 | 10.2%), Irish (778 | 10.2%), German (776 | 10.1%), and Italian (482 | 6.3%), together accounting for 65.4% of all Cherry Valley residents.
| Ancestry | # Population | % Population |
| African | 85 | 1.1% |
| Aleut | 129 | 1.7% |
| American | 380 | 5.0% |
| Armenian | 46 | 0.6% |
| Austrian | 8 | 0.1% |
| Bhutanese | 130 | 1.7% |
| Blackfeet | 15 | 0.2% |
| British | 16 | 0.2% |
| Burmese | 58 | 0.8% |
| Canadian | 6 | 0.1% |
| Central American | 56 | 0.7% |
| Cherokee | 84 | 1.1% |
| Choctaw | 5 | 0.1% |
| Costa Rican | 11 | 0.1% |
| Cuban | 50 | 0.6% |
| Czech | 9 | 0.1% |
| Danish | 8 | 0.1% |
| Delaware | 16 | 0.2% |
| Dutch | 115 | 1.5% |
| Eastern European | 6 | 0.1% |
| English | 781 | 10.2% |
| Ethiopian | 8 | 0.1% |
| European | 105 | 1.4% |
| Finnish | 15 | 0.2% |
| French | 133 | 1.7% |
| French Canadian | 56 | 0.7% |
| German | 776 | 10.1% |
| Greek | 15 | 0.2% |
| Hungarian | 47 | 0.6% |
| Iranian | 36 | 0.5% |
| Irish | 778 | 10.2% |
| Iroquois | 17 | 0.2% |
| Italian | 482 | 6.3% |
| Korean | 114 | 1.5% |
| Lithuanian | 9 | 0.1% |
| Mexican | 2,184 | 28.5% |
| Mexican American Indian | 15 | 0.2% |
| Native Hawaiian | 29 | 0.4% |
| Northern European | 10 | 0.1% |
| Norwegian | 123 | 1.6% |
| Polish | 47 | 0.6% |
| Portuguese | 10 | 0.1% |
| Puerto Rican | 16 | 0.2% |
| Romanian | 11 | 0.1% |
| Russian | 32 | 0.4% |
| Salvadoran | 45 | 0.6% |
| Scandinavian | 74 | 1.0% |
| Scotch-Irish | 31 | 0.4% |
| Scottish | 89 | 1.2% |
| South African | 22 | 0.3% |
| Spaniard | 34 | 0.4% |
| Spanish | 42 | 0.5% |
| Sri Lankan | 17 | 0.2% |
| Subsaharan African | 115 | 1.5% |
| Swedish | 60 | 0.8% |
| Swiss | 7 | 0.1% |
| Tohono O'Odham | 16 | 0.2% |
| Welsh | 25 | 0.3% | View All 58 Rows |
Immigrants in Cherry Valley
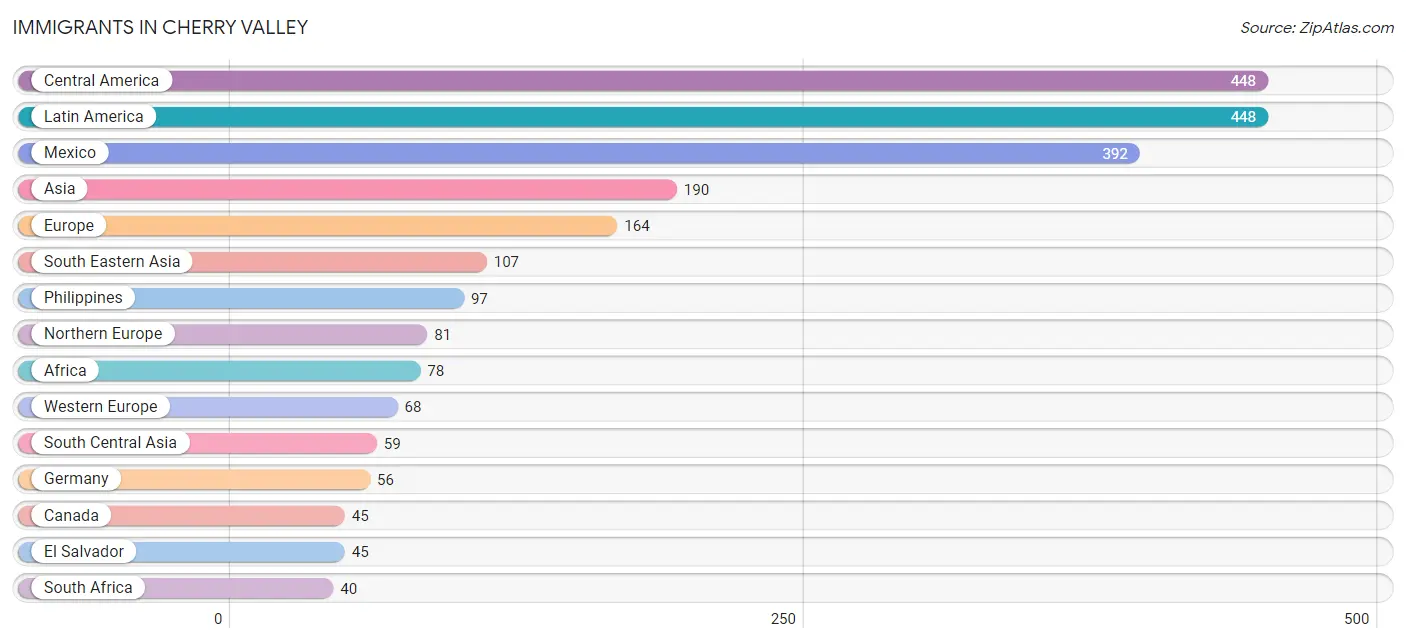
The most numerous immigrant groups reported in Cherry Valley came from Central America (448 | 5.9%), Latin America (448 | 5.9%), Mexico (392 | 5.1%), Asia (190 | 2.5%), and Europe (164 | 2.1%), together accounting for 21.4% of all Cherry Valley residents.
| Immigration Origin | # Population | % Population |
| Africa | 78 | 1.0% |
| Armenia | 7 | 0.1% |
| Asia | 190 | 2.5% |
| Australia | 7 | 0.1% |
| Cameroon | 30 | 0.4% |
| Canada | 45 | 0.6% |
| Central America | 448 | 5.9% |
| Costa Rica | 11 | 0.1% |
| Eastern Africa | 8 | 0.1% |
| Eastern Asia | 17 | 0.2% |
| Eastern Europe | 11 | 0.1% |
| El Salvador | 45 | 0.6% |
| England | 22 | 0.3% |
| Ethiopia | 8 | 0.1% |
| Europe | 164 | 2.1% |
| Germany | 56 | 0.7% |
| Indonesia | 10 | 0.1% |
| Iran | 36 | 0.5% |
| Italy | 4 | 0.1% |
| Korea | 17 | 0.2% |
| Latin America | 448 | 5.9% |
| Mexico | 392 | 5.1% |
| Middle Africa | 30 | 0.4% |
| Netherlands | 12 | 0.2% |
| Northern Europe | 81 | 1.1% |
| Oceania | 7 | 0.1% |
| Pakistan | 23 | 0.3% |
| Philippines | 97 | 1.3% |
| Romania | 11 | 0.1% |
| Scotland | 16 | 0.2% |
| South Africa | 40 | 0.5% |
| South Central Asia | 59 | 0.8% |
| South Eastern Asia | 107 | 1.4% |
| Southern Europe | 4 | 0.1% |
| Western Asia | 7 | 0.1% |
| Western Europe | 68 | 0.9% | View All 36 Rows |
Sex and Age in Cherry Valley
Sex and Age in Cherry Valley
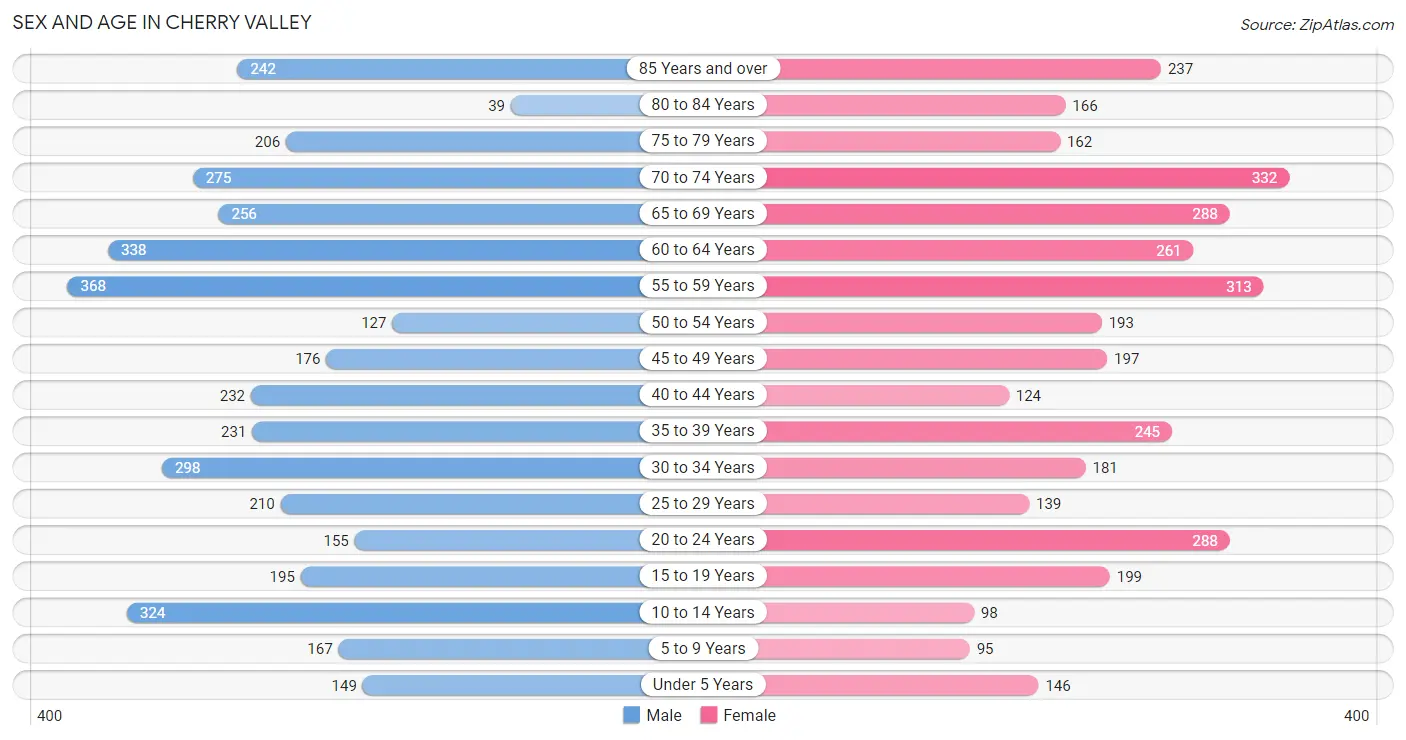
The most populous age groups in Cherry Valley are 55 to 59 Years (368 | 9.2%) for men and 70 to 74 Years (332 | 9.1%) for women.
| Age Bracket | Male | Female |
| Under 5 Years | 149 (3.7%) | 146 (4.0%) |
| 5 to 9 Years | 167 (4.2%) | 95 (2.6%) |
| 10 to 14 Years | 324 (8.1%) | 98 (2.7%) |
| 15 to 19 Years | 195 (4.9%) | 199 (5.4%) |
| 20 to 24 Years | 155 (3.9%) | 288 (7.9%) |
| 25 to 29 Years | 210 (5.3%) | 139 (3.8%) |
| 30 to 34 Years | 298 (7.5%) | 181 (4.9%) |
| 35 to 39 Years | 231 (5.8%) | 245 (6.7%) |
| 40 to 44 Years | 232 (5.8%) | 124 (3.4%) |
| 45 to 49 Years | 176 (4.4%) | 197 (5.4%) |
| 50 to 54 Years | 127 (3.2%) | 193 (5.3%) |
| 55 to 59 Years | 368 (9.2%) | 313 (8.5%) |
| 60 to 64 Years | 338 (8.5%) | 261 (7.1%) |
| 65 to 69 Years | 256 (6.4%) | 288 (7.9%) |
| 70 to 74 Years | 275 (6.9%) | 332 (9.1%) |
| 75 to 79 Years | 206 (5.2%) | 162 (4.4%) |
| 80 to 84 Years | 39 (1.0%) | 166 (4.5%) |
| 85 Years and over | 242 (6.1%) | 237 (6.5%) |
| Total | 3,988 (100.0%) | 3,664 (100.0%) |
Families and Households in Cherry Valley
Median Family Size in Cherry Valley
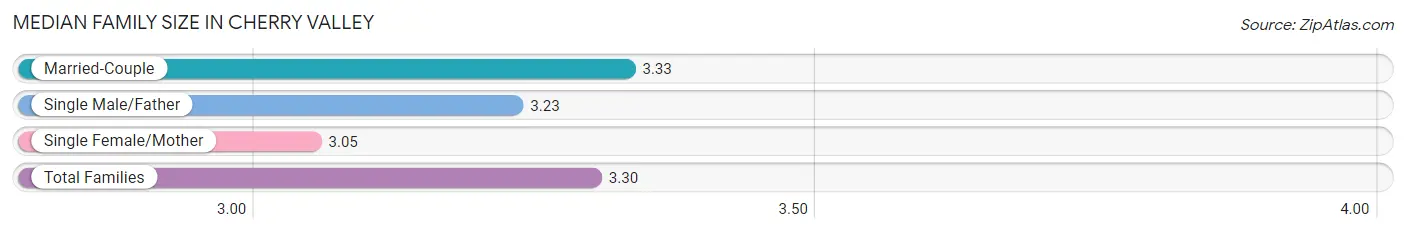
The median family size in Cherry Valley is 3.30 persons per family, with married-couple families (1,485 | 80.9%) accounting for the largest median family size of 3.33 persons per family. On the other hand, single female/mother families (146 | 8.0%) represent the smallest median family size with 3.05 persons per family.
| Family Type | # Families | Family Size |
| Married-Couple | 1,485 (80.9%) | 3.33 |
| Single Male/Father | 204 (11.1%) | 3.23 |
| Single Female/Mother | 146 (8.0%) | 3.05 |
| Total Families | 1,835 (100.0%) | 3.30 |
Median Household Size in Cherry Valley
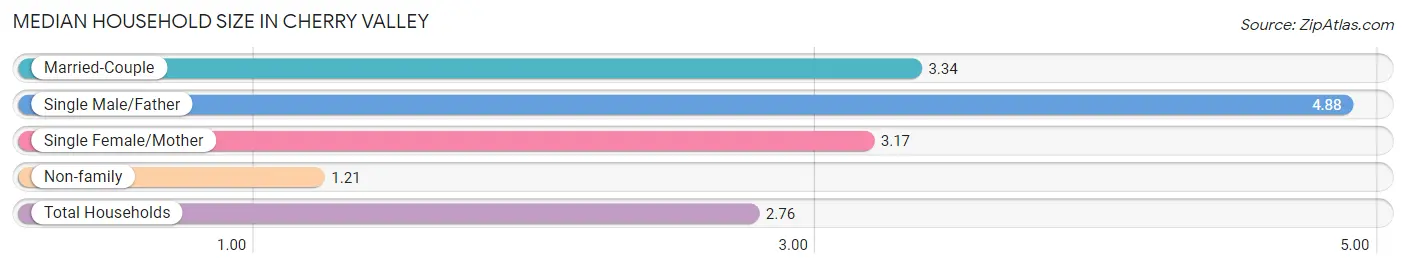
The median household size in Cherry Valley is 2.76 persons per household, with single male/father households (204 | 7.5%) accounting for the largest median household size of 4.88 persons per household. non-family households (872 | 32.2%) represent the smallest median household size with 1.21 persons per household.
| Household Type | # Households | Household Size |
| Married-Couple | 1,485 (54.9%) | 3.34 |
| Single Male/Father | 204 (7.5%) | 4.88 |
| Single Female/Mother | 146 (5.4%) | 3.17 |
| Non-family | 872 (32.2%) | 1.21 |
| Total Households | 2,707 (100.0%) | 2.76 |
Household Size by Marriage Status in Cherry Valley
Out of a total of 2,707 households in Cherry Valley, 1,835 (67.8%) are family households, while 872 (32.2%) are nonfamily households. The most numerous type of family households are 2-person households, comprising 835, and the most common type of nonfamily households are 1-person households, comprising 752.
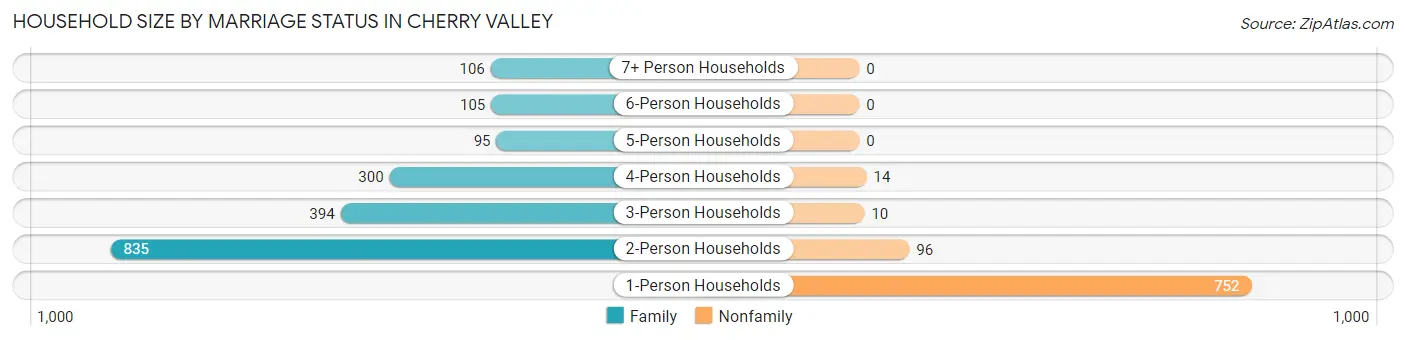
| Household Size | Family Households | Nonfamily Households |
| 1-Person Households | - | 752 (27.8%) |
| 2-Person Households | 835 (30.8%) | 96 (3.5%) |
| 3-Person Households | 394 (14.5%) | 10 (0.4%) |
| 4-Person Households | 300 (11.1%) | 14 (0.5%) |
| 5-Person Households | 95 (3.5%) | 0 (0.0%) |
| 6-Person Households | 105 (3.9%) | 0 (0.0%) |
| 7+ Person Households | 106 (3.9%) | 0 (0.0%) |
| Total | 1,835 (67.8%) | 872 (32.2%) |
Female Fertility in Cherry Valley
Fertility by Age in Cherry Valley
Average fertility rate in Cherry Valley is 74.0 births per 1,000 women. Women in the age bracket of 20 to 34 years have the highest fertility rate with 97.0 births per 1,000 women. Women in the age bracket of 20 to 34 years acount for 56.7% of all women with births.
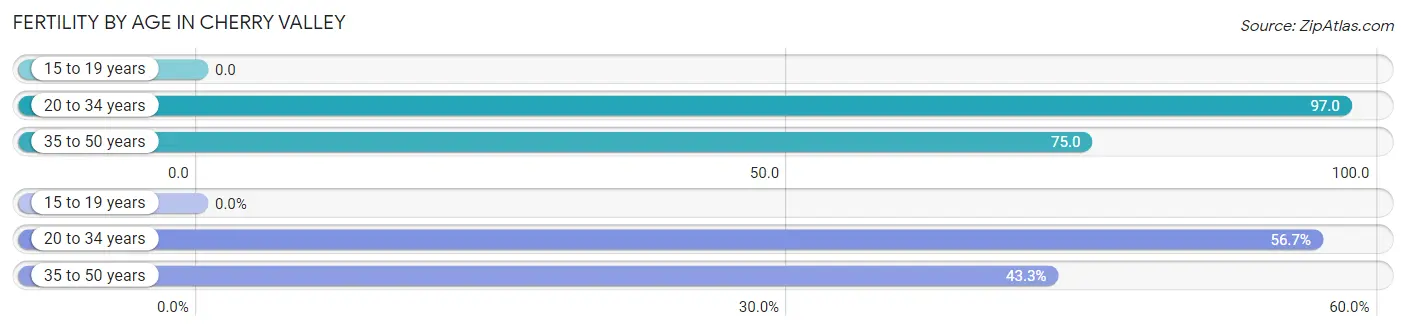
| Age Bracket | Women with Births | Births / 1,000 Women |
| 15 to 19 years | 0 (0.0%) | 0.0 |
| 20 to 34 years | 59 (56.7%) | 97.0 |
| 35 to 50 years | 45 (43.3%) | 75.0 |
| Total | 104 (100.0%) | 74.0 |
Fertility by Age by Marriage Status in Cherry Valley
11.5% of women with births (104) in Cherry Valley are married. The highest percentage of unmarried women with births falls into 35 to 50 years age bracket with 100.0% of them unmarried at the time of birth, while the lowest percentage of unmarried women with births belong to 20 to 34 years age bracket with 79.7% of them unmarried.
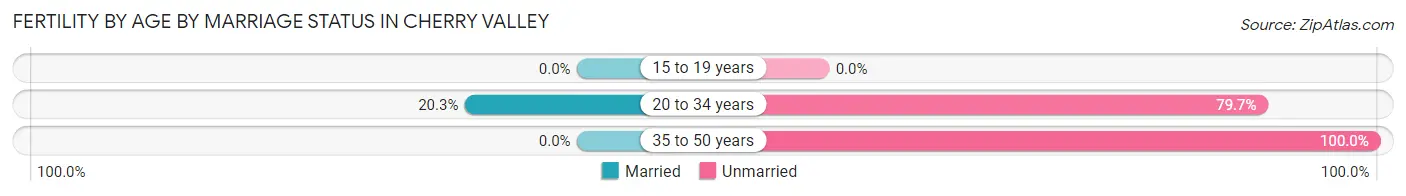
| Age Bracket | Married | Unmarried |
| 15 to 19 years | 0 (0.0%) | 0 (0.0%) |
| 20 to 34 years | 12 (20.3%) | 47 (79.7%) |
| 35 to 50 years | 0 (0.0%) | 45 (100.0%) |
| Total | 12 (11.5%) | 92 (88.5%) |
Fertility by Education in Cherry Valley
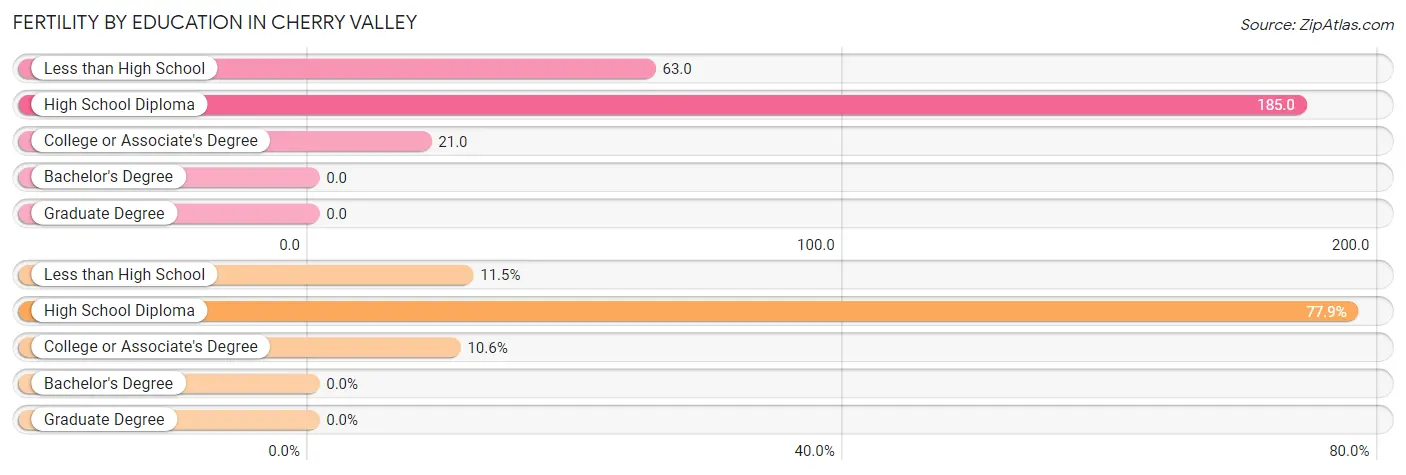
| Educational Attainment | Women with Births | Births / 1,000 Women |
| Less than High School | 12 (11.5%) | 63.0 |
| High School Diploma | 81 (77.9%) | 185.0 |
| College or Associate's Degree | 11 (10.6%) | 21.0 |
| Bachelor's Degree | 0 (0.0%) | 0.0 |
| Graduate Degree | 0 (0.0%) | 0.0 |
| Total | 104 (100.0%) | 74.0 |
Fertility by Education by Marriage Status in Cherry Valley
88.5% of women with births in Cherry Valley are unmarried. Women with the educational attainment of less than high school are most likely to be married with 100.0% of them married at childbirth, while women with the educational attainment of high school diploma are least likely to be married with 100.0% of them unmarried at childbirth.
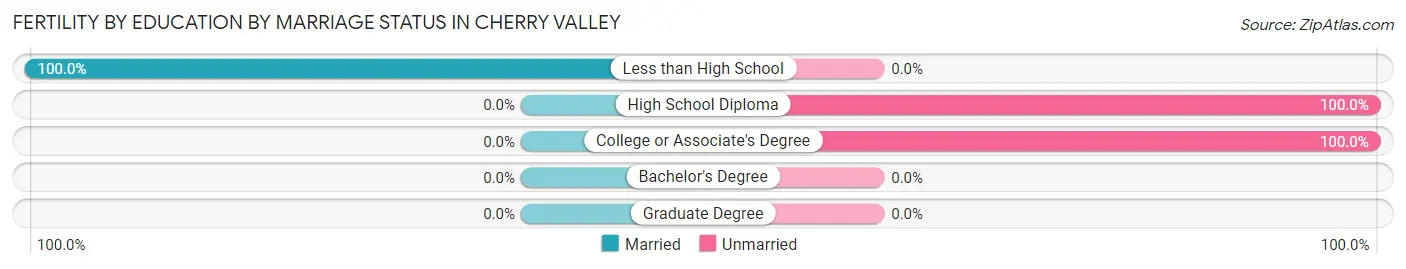
| Educational Attainment | Married | Unmarried |
| Less than High School | 12 (100.0%) | 0 (0.0%) |
| High School Diploma | 0 (0.0%) | 81 (100.0%) |
| College or Associate's Degree | 0 (0.0%) | 11 (100.0%) |
| Bachelor's Degree | 0 (0.0%) | 0 (0.0%) |
| Graduate Degree | 0 (0.0%) | 0 (0.0%) |
| Total | 12 (11.5%) | 92 (88.5%) |
Employment Characteristics in Cherry Valley
Employment by Class of Employer in Cherry Valley
Among the 2,961 employed individuals in Cherry Valley, private company employees (1,873 | 63.3%), local government employees (355 | 12.0%), and not-for-profit organizations (199 | 6.7%) make up the most common classes of employment.
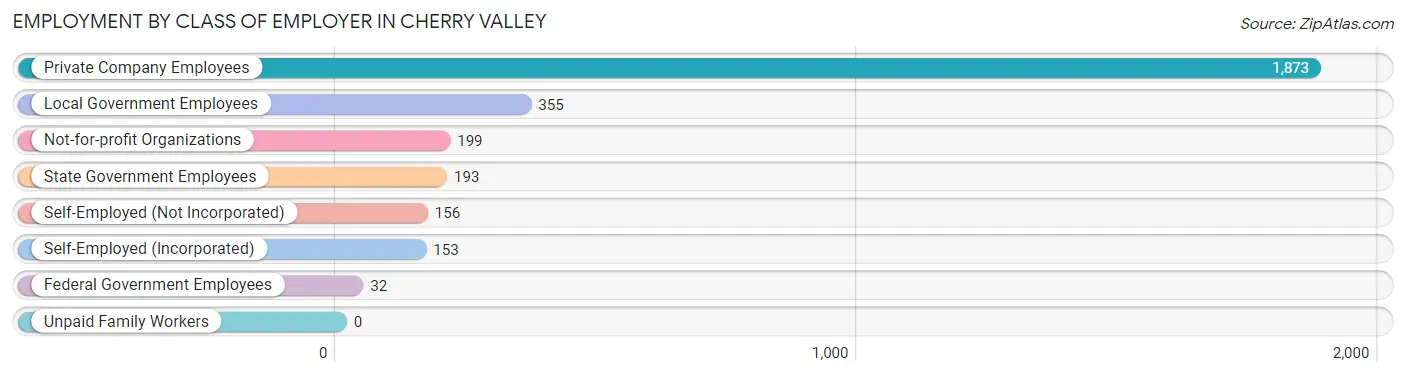
| Employer Class | # Employees | % Employees |
| Private Company Employees | 1,873 | 63.3% |
| Self-Employed (Incorporated) | 153 | 5.2% |
| Self-Employed (Not Incorporated) | 156 | 5.3% |
| Not-for-profit Organizations | 199 | 6.7% |
| Local Government Employees | 355 | 12.0% |
| State Government Employees | 193 | 6.5% |
| Federal Government Employees | 32 | 1.1% |
| Unpaid Family Workers | 0 | 0.0% |
| Total | 2,961 | 100.0% |
Employment Status by Age in Cherry Valley
According to the labor force statistics for Cherry Valley, out of the total population over 16 years of age (6,568), 52.7% or 3,461 individuals are in the labor force, with 11.2% or 388 of them unemployed. The age group with the highest labor force participation rate is 35 to 44 years, with 89.5% or 745 individuals in the labor force. Within the labor force, the 30 to 34 years age range has the highest percentage of unemployed individuals, with 23.9% or 89 of them being unemployed.
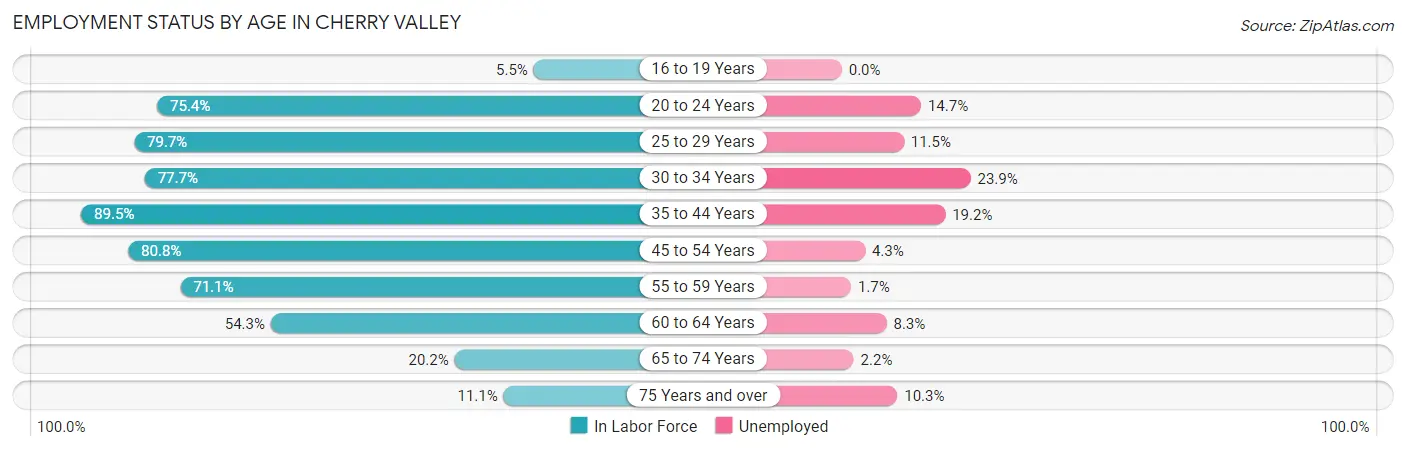
| Age Bracket | In Labor Force | Unemployed |
| 16 to 19 Years | 16 (5.5%) | 0 (0.0%) |
| 20 to 24 Years | 334 (75.4%) | 49 (14.7%) |
| 25 to 29 Years | 278 (79.7%) | 32 (11.5%) |
| 30 to 34 Years | 372 (77.7%) | 89 (23.9%) |
| 35 to 44 Years | 745 (89.5%) | 143 (19.2%) |
| 45 to 54 Years | 560 (80.8%) | 24 (4.3%) |
| 55 to 59 Years | 484 (71.1%) | 8 (1.7%) |
| 60 to 64 Years | 325 (54.3%) | 27 (8.3%) |
| 65 to 74 Years | 233 (20.2%) | 5 (2.2%) |
| 75 Years and over | 117 (11.1%) | 12 (10.3%) |
| Total | 3,461 (52.7%) | 388 (11.2%) |
Employment Status by Educational Attainment in Cherry Valley
According to labor force statistics for Cherry Valley, 76.1% of individuals (2,765) out of the total population between 25 and 64 years of age (3,633) are in the labor force, with 11.7% or 324 of them being unemployed. The group with the highest labor force participation rate are those with the educational attainment of bachelor's degree or higher, with 82.7% or 648 individuals in the labor force. Within the labor force, individuals with less than high school education have the highest percentage of unemployment, with 25.1% or 90 of them being unemployed.
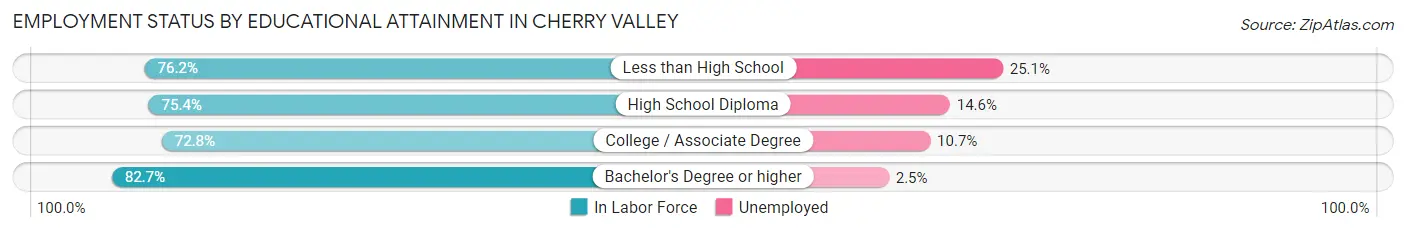
| Educational Attainment | In Labor Force | Unemployed |
| Less than High School | 359 (76.2%) | 118 (25.1%) |
| High School Diploma | 747 (75.4%) | 145 (14.6%) |
| College / Associate Degree | 1,010 (72.8%) | 148 (10.7%) |
| Bachelor's Degree or higher | 648 (82.7%) | 20 (2.5%) |
| Total | 2,765 (76.1%) | 425 (11.7%) |
Employment Occupations by Sex in Cherry Valley
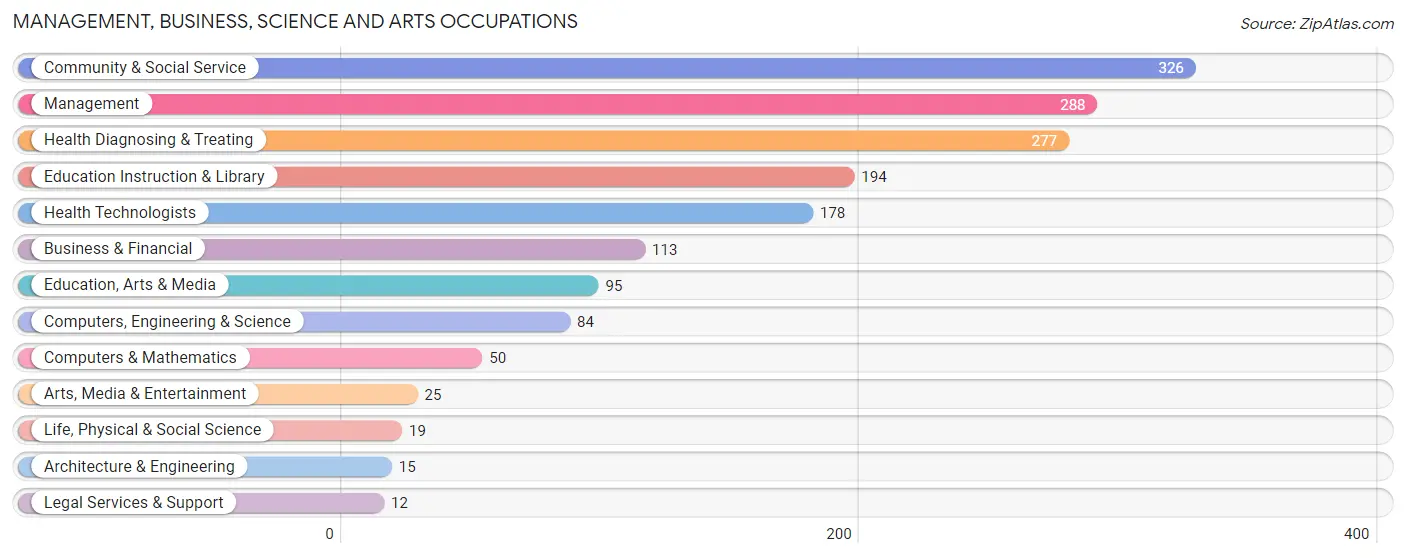
Management, Business, Science and Arts Occupations
The most common Management, Business, Science and Arts occupations in Cherry Valley are Community & Social Service (326 | 10.6%), Management (288 | 9.4%), Health Diagnosing & Treating (277 | 9.0%), Education Instruction & Library (194 | 6.3%), and Health Technologists (178 | 5.8%).
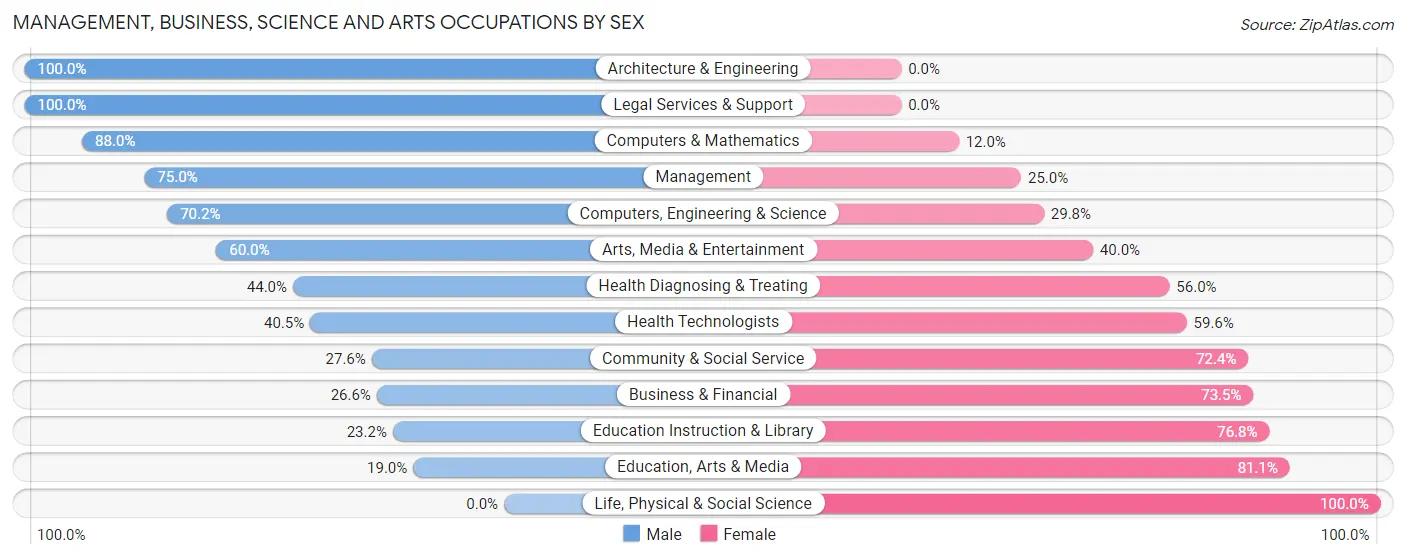
Management, Business, Science and Arts Occupations by Sex
Within the Management, Business, Science and Arts occupations in Cherry Valley, the most male-oriented occupations are Architecture & Engineering (100.0%), Legal Services & Support (100.0%), and Computers & Mathematics (88.0%), while the most female-oriented occupations are Life, Physical & Social Science (100.0%), Education, Arts & Media (81.0%), and Education Instruction & Library (76.8%).
| Occupation | Male | Female |
| Management | 216 (75.0%) | 72 (25.0%) |
| Business & Financial | 30 (26.6%) | 83 (73.5%) |
| Computers, Engineering & Science | 59 (70.2%) | 25 (29.8%) |
| Computers & Mathematics | 44 (88.0%) | 6 (12.0%) |
| Architecture & Engineering | 15 (100.0%) | 0 (0.0%) |
| Life, Physical & Social Science | 0 (0.0%) | 19 (100.0%) |
| Community & Social Service | 90 (27.6%) | 236 (72.4%) |
| Education, Arts & Media | 18 (19.0%) | 77 (81.0%) |
| Legal Services & Support | 12 (100.0%) | 0 (0.0%) |
| Education Instruction & Library | 45 (23.2%) | 149 (76.8%) |
| Arts, Media & Entertainment | 15 (60.0%) | 10 (40.0%) |
| Health Diagnosing & Treating | 122 (44.0%) | 155 (56.0%) |
| Health Technologists | 72 (40.5%) | 106 (59.6%) |
| Total (Category) | 517 (47.5%) | 571 (52.5%) |
| Total (Overall) | 1,579 (51.4%) | 1,495 (48.6%) |
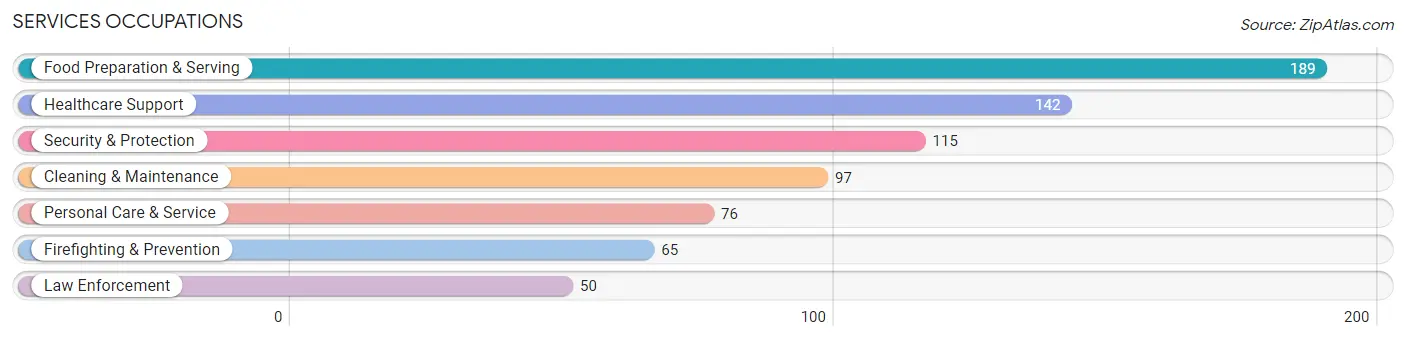
Services Occupations
The most common Services occupations in Cherry Valley are Food Preparation & Serving (189 | 6.1%), Healthcare Support (142 | 4.6%), Security & Protection (115 | 3.7%), Cleaning & Maintenance (97 | 3.2%), and Personal Care & Service (76 | 2.5%).
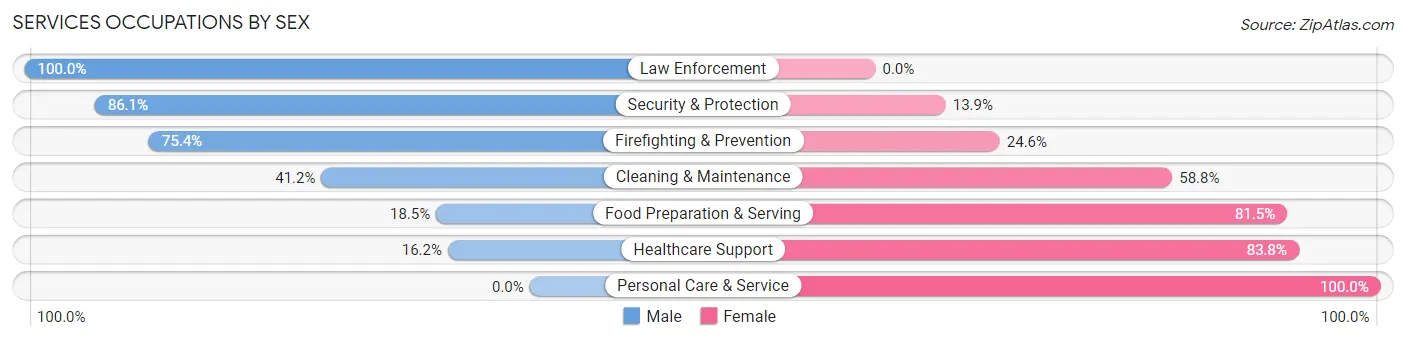
Services Occupations by Sex
Within the Services occupations in Cherry Valley, the most male-oriented occupations are Law Enforcement (100.0%), Security & Protection (86.1%), and Firefighting & Prevention (75.4%), while the most female-oriented occupations are Personal Care & Service (100.0%), Healthcare Support (83.8%), and Food Preparation & Serving (81.5%).
| Occupation | Male | Female |
| Healthcare Support | 23 (16.2%) | 119 (83.8%) |
| Security & Protection | 99 (86.1%) | 16 (13.9%) |
| Firefighting & Prevention | 49 (75.4%) | 16 (24.6%) |
| Law Enforcement | 50 (100.0%) | 0 (0.0%) |
| Food Preparation & Serving | 35 (18.5%) | 154 (81.5%) |
| Cleaning & Maintenance | 40 (41.2%) | 57 (58.8%) |
| Personal Care & Service | 0 (0.0%) | 76 (100.0%) |
| Total (Category) | 197 (31.8%) | 422 (68.2%) |
| Total (Overall) | 1,579 (51.4%) | 1,495 (48.6%) |
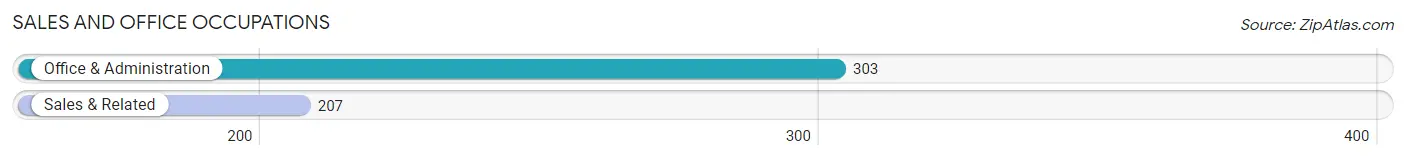
Sales and Office Occupations
The most common Sales and Office occupations in Cherry Valley are Office & Administration (303 | 9.9%), and Sales & Related (207 | 6.7%).
Sales and Office Occupations by Sex
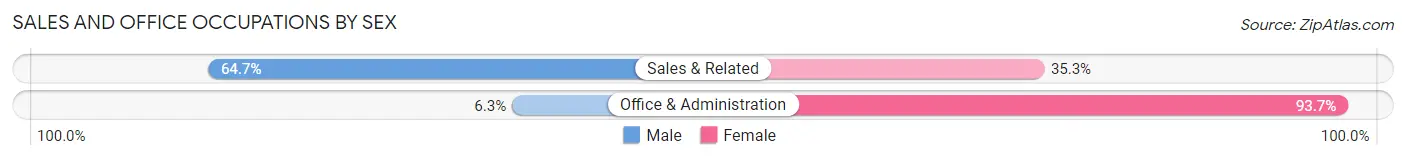
| Occupation | Male | Female |
| Sales & Related | 134 (64.7%) | 73 (35.3%) |
| Office & Administration | 19 (6.3%) | 284 (93.7%) |
| Total (Category) | 153 (30.0%) | 357 (70.0%) |
| Total (Overall) | 1,579 (51.4%) | 1,495 (48.6%) |
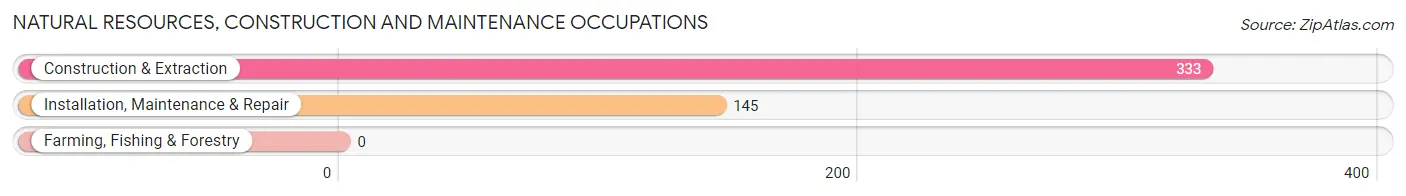
Natural Resources, Construction and Maintenance Occupations
The most common Natural Resources, Construction and Maintenance occupations in Cherry Valley are Construction & Extraction (333 | 10.8%), and Installation, Maintenance & Repair (145 | 4.7%).
Natural Resources, Construction and Maintenance Occupations by Sex
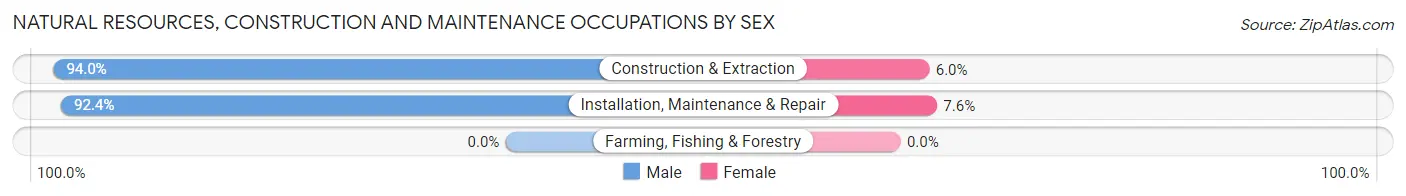
| Occupation | Male | Female |
| Farming, Fishing & Forestry | 0 (0.0%) | 0 (0.0%) |
| Construction & Extraction | 313 (94.0%) | 20 (6.0%) |
| Installation, Maintenance & Repair | 134 (92.4%) | 11 (7.6%) |
| Total (Category) | 447 (93.5%) | 31 (6.5%) |
| Total (Overall) | 1,579 (51.4%) | 1,495 (48.6%) |
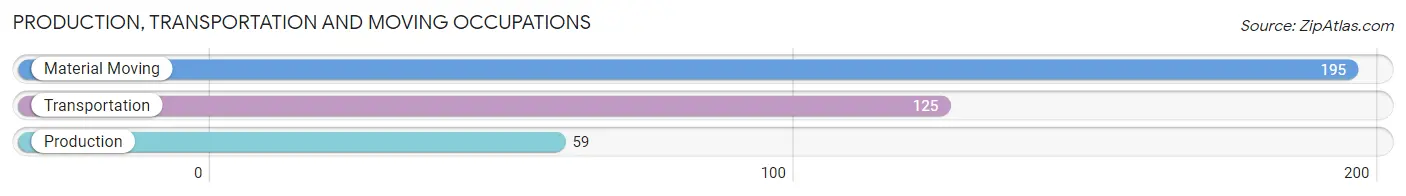
Production, Transportation and Moving Occupations
The most common Production, Transportation and Moving occupations in Cherry Valley are Material Moving (195 | 6.3%), Transportation (125 | 4.1%), and Production (59 | 1.9%).
Production, Transportation and Moving Occupations by Sex
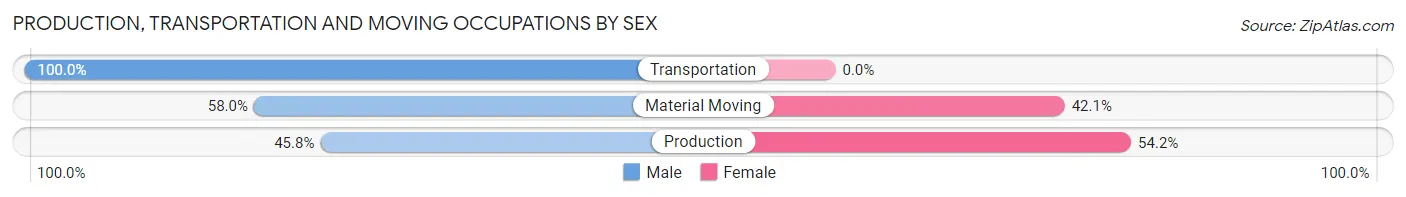
| Occupation | Male | Female |
| Production | 27 (45.8%) | 32 (54.2%) |
| Transportation | 125 (100.0%) | 0 (0.0%) |
| Material Moving | 113 (58.0%) | 82 (42.0%) |
| Total (Category) | 265 (69.9%) | 114 (30.1%) |
| Total (Overall) | 1,579 (51.4%) | 1,495 (48.6%) |
Employment Industries by Sex in Cherry Valley
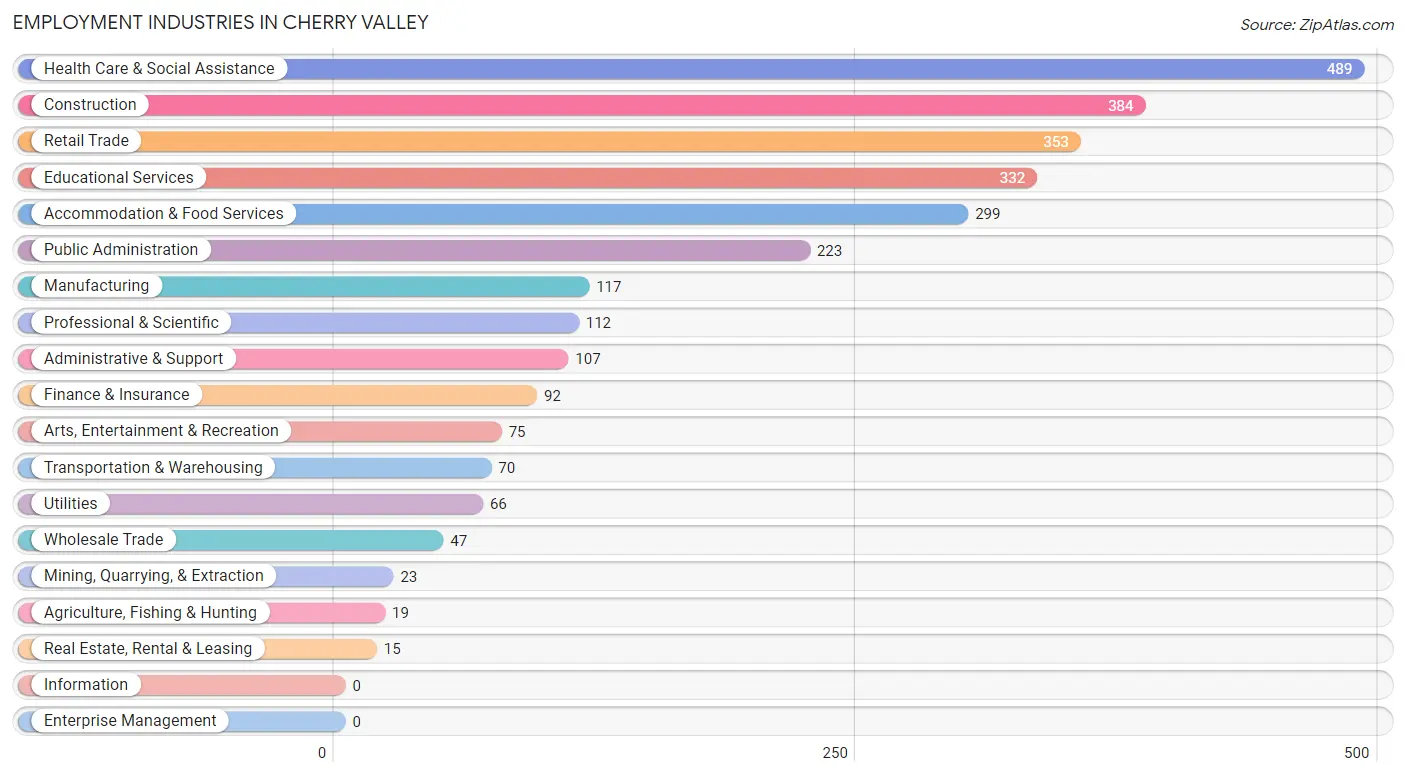
Employment Industries in Cherry Valley
The major employment industries in Cherry Valley include Health Care & Social Assistance (489 | 15.9%), Construction (384 | 12.5%), Retail Trade (353 | 11.5%), Educational Services (332 | 10.8%), and Accommodation & Food Services (299 | 9.7%).
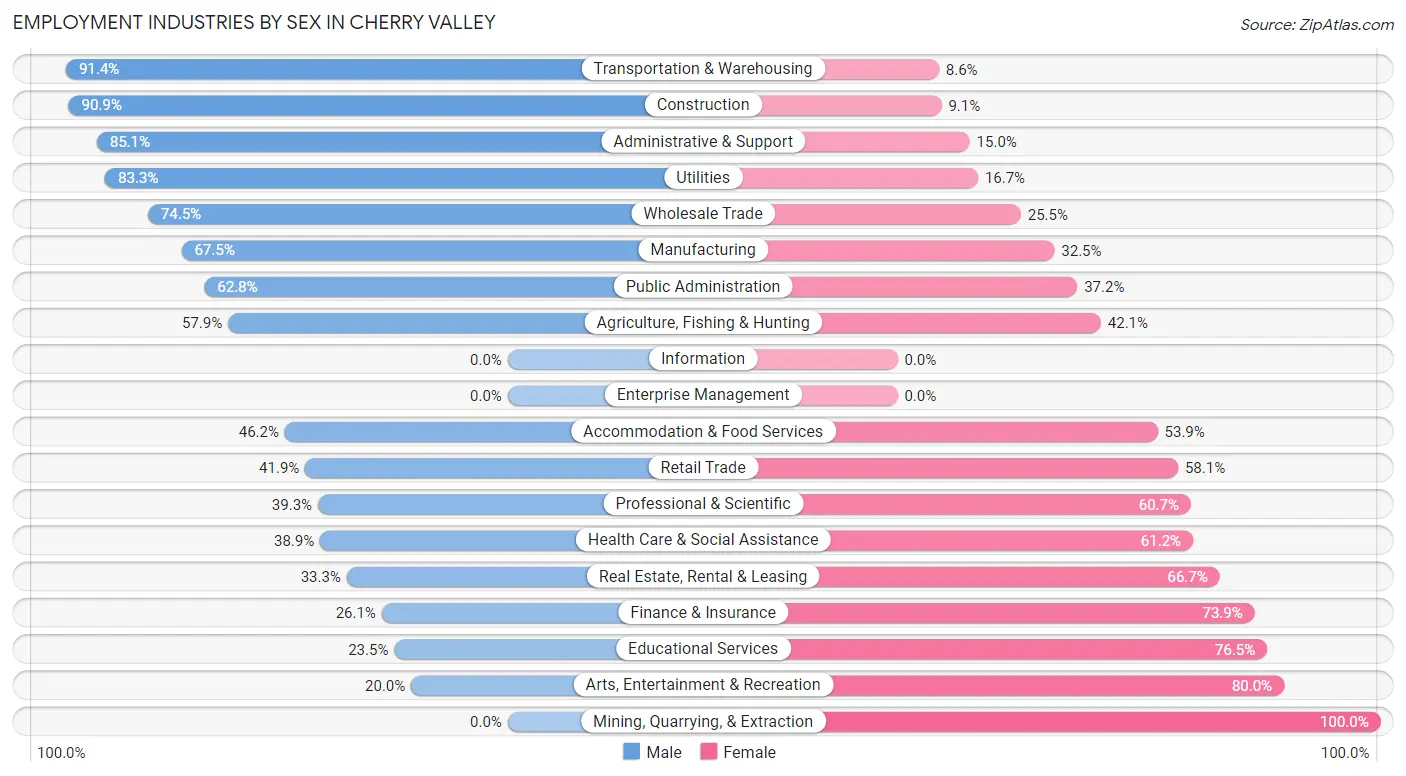
Employment Industries by Sex in Cherry Valley
The Cherry Valley industries that see more men than women are Transportation & Warehousing (91.4%), Construction (90.9%), and Administrative & Support (85.1%), whereas the industries that tend to have a higher number of women are Mining, Quarrying, & Extraction (100.0%), Arts, Entertainment & Recreation (80.0%), and Educational Services (76.5%).
| Industry | Male | Female |
| Agriculture, Fishing & Hunting | 11 (57.9%) | 8 (42.1%) |
| Mining, Quarrying, & Extraction | 0 (0.0%) | 23 (100.0%) |
| Construction | 349 (90.9%) | 35 (9.1%) |
| Manufacturing | 79 (67.5%) | 38 (32.5%) |
| Wholesale Trade | 35 (74.5%) | 12 (25.5%) |
| Retail Trade | 148 (41.9%) | 205 (58.1%) |
| Transportation & Warehousing | 64 (91.4%) | 6 (8.6%) |
| Utilities | 55 (83.3%) | 11 (16.7%) |
| Information | 0 (0.0%) | 0 (0.0%) |
| Finance & Insurance | 24 (26.1%) | 68 (73.9%) |
| Real Estate, Rental & Leasing | 5 (33.3%) | 10 (66.7%) |
| Professional & Scientific | 44 (39.3%) | 68 (60.7%) |
| Enterprise Management | 0 (0.0%) | 0 (0.0%) |
| Administrative & Support | 91 (85.1%) | 16 (14.9%) |
| Educational Services | 78 (23.5%) | 254 (76.5%) |
| Health Care & Social Assistance | 190 (38.9%) | 299 (61.2%) |
| Arts, Entertainment & Recreation | 15 (20.0%) | 60 (80.0%) |
| Accommodation & Food Services | 138 (46.2%) | 161 (53.8%) |
| Public Administration | 140 (62.8%) | 83 (37.2%) |
| Total | 1,579 (51.4%) | 1,495 (48.6%) |
Education in Cherry Valley
School Enrollment in Cherry Valley
The most common levels of schooling among the 1,402 students in Cherry Valley are college / undergraduate (386 | 27.5%), high school (357 | 25.5%), and middle school (273 | 19.5%).
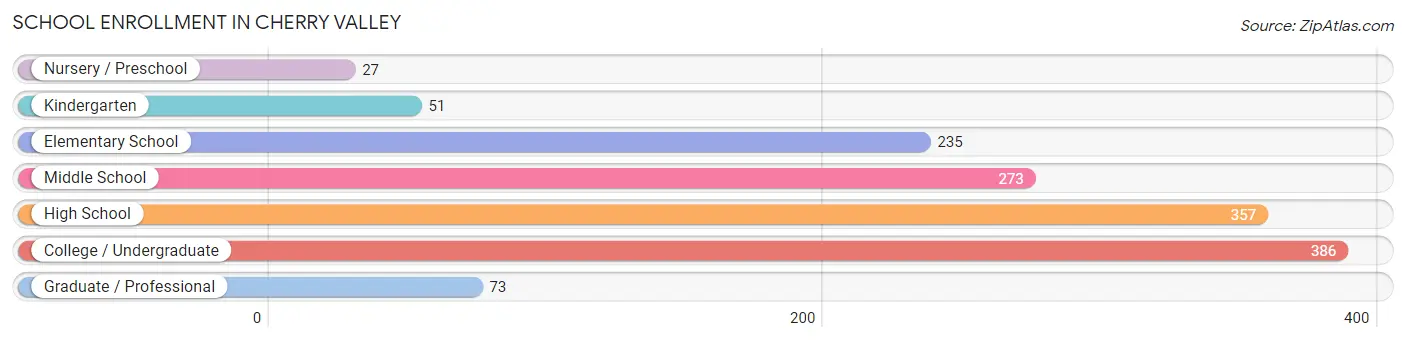
| School Level | # Students | % Students |
| Nursery / Preschool | 27 | 1.9% |
| Kindergarten | 51 | 3.6% |
| Elementary School | 235 | 16.8% |
| Middle School | 273 | 19.5% |
| High School | 357 | 25.5% |
| College / Undergraduate | 386 | 27.5% |
| Graduate / Professional | 73 | 5.2% |
| Total | 1,402 | 100.0% |
School Enrollment by Age by Funding Source in Cherry Valley
Out of a total of 1,402 students who are enrolled in schools in Cherry Valley, 374 (26.7%) attend a private institution, while the remaining 1,028 (73.3%) are enrolled in public schools. The age group of 35 years and over has the highest likelihood of being enrolled in private schools, with 148 (77.1% in the age bracket) enrolled. Conversely, the age group of 15 to 17 year olds has the lowest likelihood of being enrolled in a private school, with 291 (97.3% in the age bracket) attending a public institution.
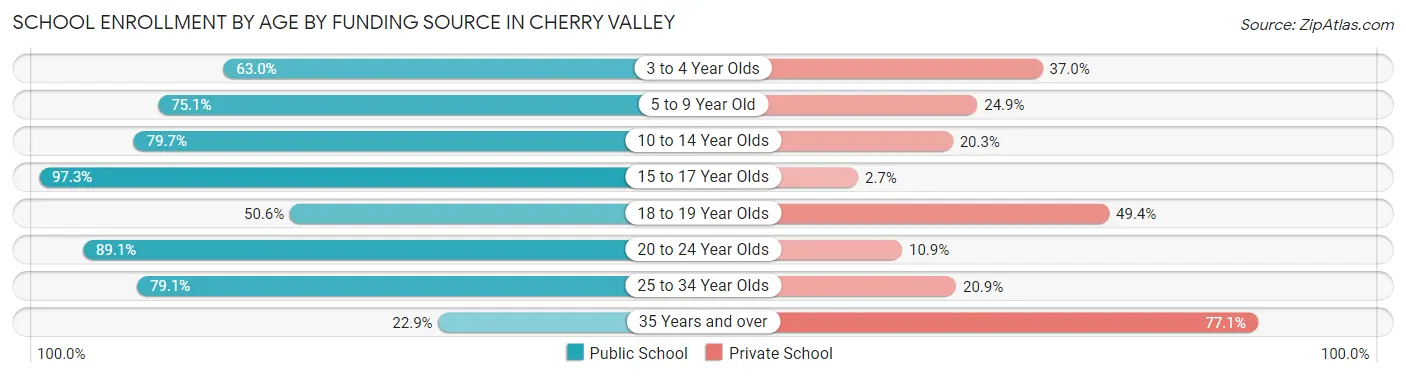
| Age Bracket | Public School | Private School |
| 3 to 4 Year Olds | 17 (63.0%) | 10 (37.0%) |
| 5 to 9 Year Old | 175 (75.1%) | 58 (24.9%) |
| 10 to 14 Year Olds | 306 (79.7%) | 78 (20.3%) |
| 15 to 17 Year Olds | 291 (97.3%) | 8 (2.7%) |
| 18 to 19 Year Olds | 45 (50.6%) | 44 (49.4%) |
| 20 to 24 Year Olds | 82 (89.1%) | 10 (10.9%) |
| 25 to 34 Year Olds | 68 (79.1%) | 18 (20.9%) |
| 35 Years and over | 44 (22.9%) | 148 (77.1%) |
| Total | 1,028 (73.3%) | 374 (26.7%) |
Educational Attainment by Field of Study in Cherry Valley
Business (285 | 22.6%), science & technology (189 | 15.0%), education (129 | 10.2%), social sciences (128 | 10.2%), and liberal arts & history (124 | 9.8%) are the most common fields of study among 1,261 individuals in Cherry Valley who have obtained a bachelor's degree or higher.
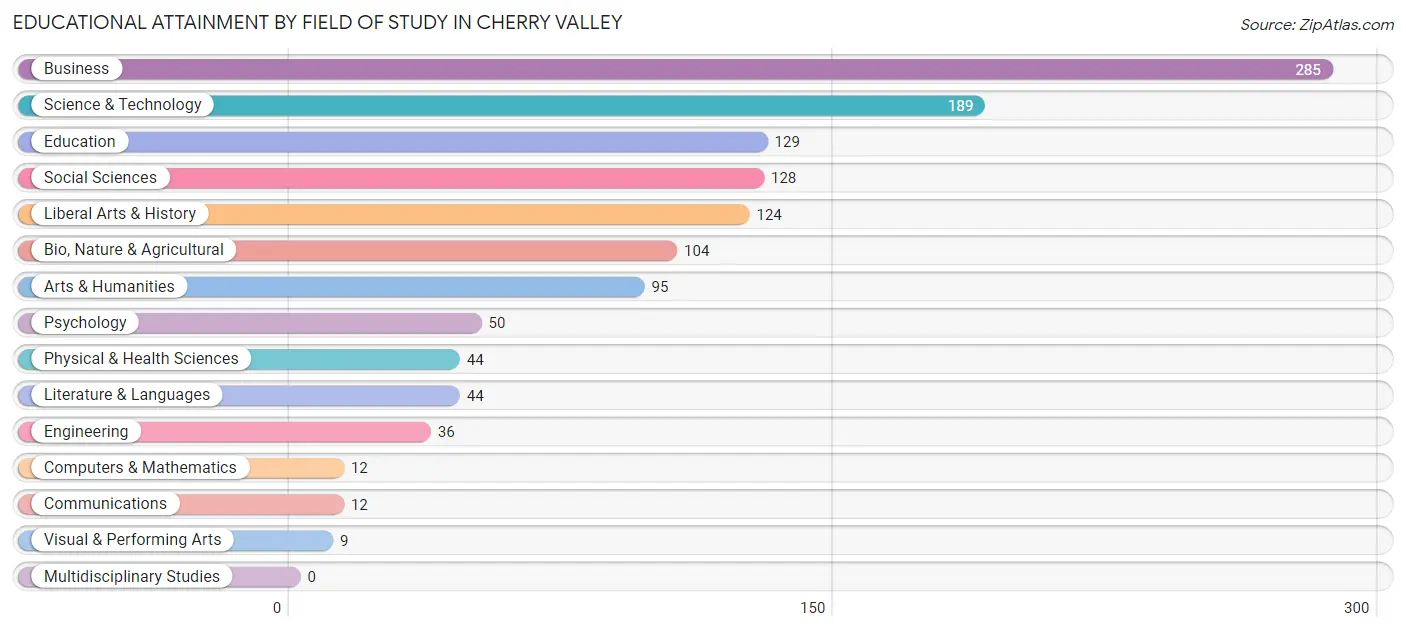
| Field of Study | # Graduates | % Graduates |
| Computers & Mathematics | 12 | 0.9% |
| Bio, Nature & Agricultural | 104 | 8.3% |
| Physical & Health Sciences | 44 | 3.5% |
| Psychology | 50 | 4.0% |
| Social Sciences | 128 | 10.2% |
| Engineering | 36 | 2.9% |
| Multidisciplinary Studies | 0 | 0.0% |
| Science & Technology | 189 | 15.0% |
| Business | 285 | 22.6% |
| Education | 129 | 10.2% |
| Literature & Languages | 44 | 3.5% |
| Liberal Arts & History | 124 | 9.8% |
| Visual & Performing Arts | 9 | 0.7% |
| Communications | 12 | 0.9% |
| Arts & Humanities | 95 | 7.5% |
| Total | 1,261 | 100.0% |
Transportation & Commute in Cherry Valley
Vehicle Availability by Sex in Cherry Valley
The most prevalent vehicle ownership categories in Cherry Valley are males with 5 or more vehicles (365, accounting for 23.8%) and females with 5 or more vehicles (244, making up 25.8%).
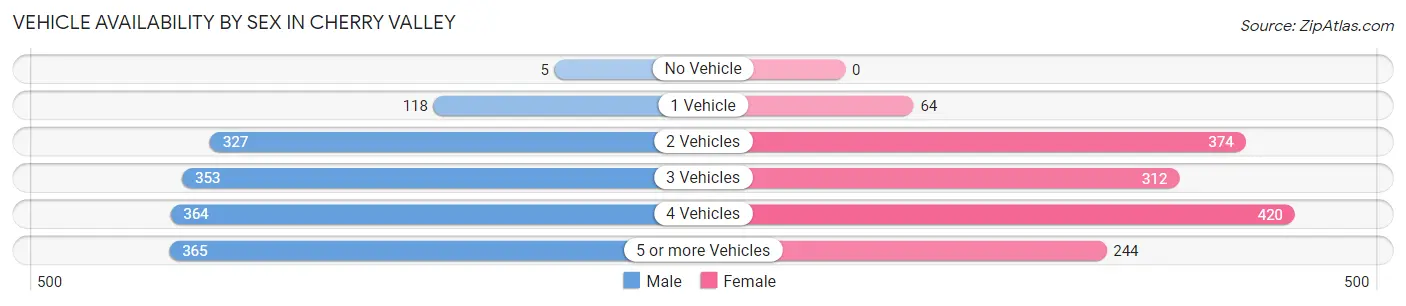
| Vehicles Available | Male | Female |
| No Vehicle | 5 (0.3%) | 0 (0.0%) |
| 1 Vehicle | 118 (7.7%) | 64 (4.5%) |
| 2 Vehicles | 327 (21.3%) | 374 (26.5%) |
| 3 Vehicles | 353 (23.0%) | 312 (22.1%) |
| 4 Vehicles | 364 (23.8%) | 420 (29.7%) |
| 5 or more Vehicles | 365 (23.8%) | 244 (17.3%) |
| Total | 1,532 (100.0%) | 1,414 (100.0%) |
Commute Time in Cherry Valley
The most frequently occuring commute durations in Cherry Valley are 10 to 14 minutes (360 commuters, 13.6%), 30 to 34 minutes (351 commuters, 13.2%), and 90 or more minutes (320 commuters, 12.1%).
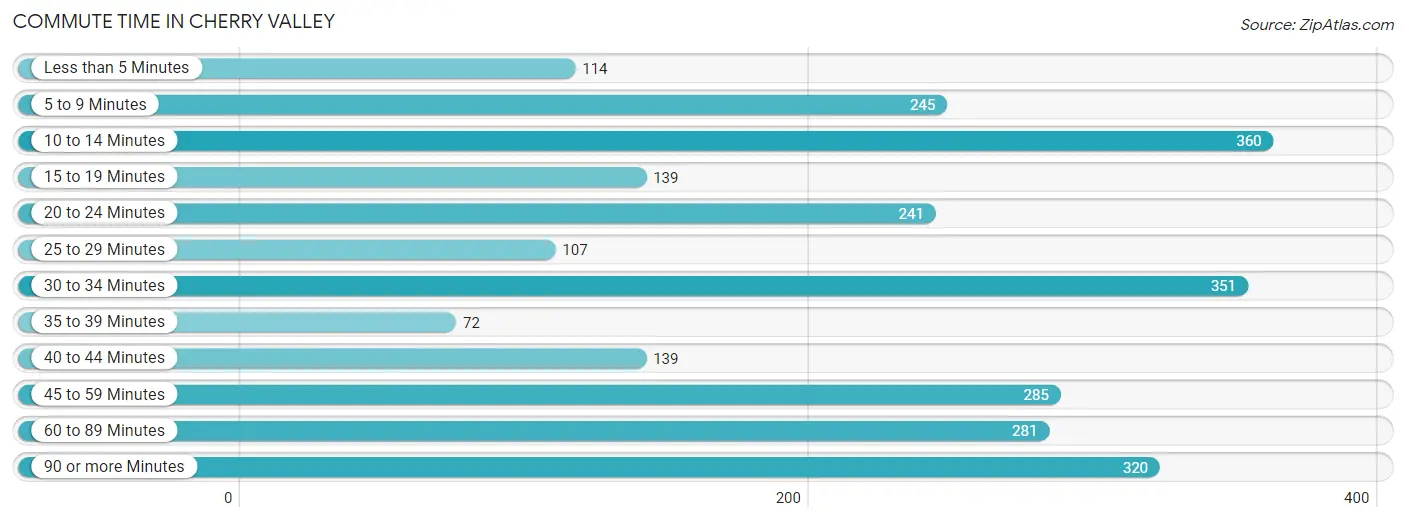
| Commute Time | # Commuters | % Commuters |
| Less than 5 Minutes | 114 | 4.3% |
| 5 to 9 Minutes | 245 | 9.2% |
| 10 to 14 Minutes | 360 | 13.6% |
| 15 to 19 Minutes | 139 | 5.2% |
| 20 to 24 Minutes | 241 | 9.1% |
| 25 to 29 Minutes | 107 | 4.0% |
| 30 to 34 Minutes | 351 | 13.2% |
| 35 to 39 Minutes | 72 | 2.7% |
| 40 to 44 Minutes | 139 | 5.2% |
| 45 to 59 Minutes | 285 | 10.7% |
| 60 to 89 Minutes | 281 | 10.6% |
| 90 or more Minutes | 320 | 12.1% |
Commute Time by Sex in Cherry Valley
The most common commute times in Cherry Valley are 90 or more minutes (238 commuters, 17.7%) for males and 10 to 14 minutes (227 commuters, 17.3%) for females.
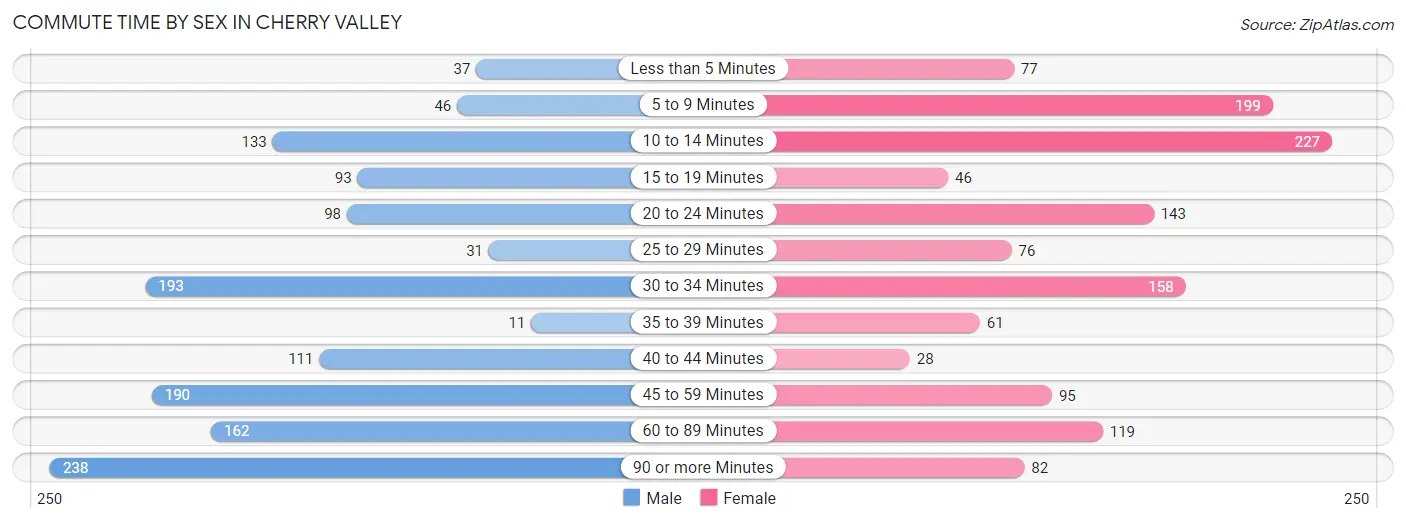
| Commute Time | Male | Female |
| Less than 5 Minutes | 37 (2.8%) | 77 (5.9%) |
| 5 to 9 Minutes | 46 (3.4%) | 199 (15.2%) |
| 10 to 14 Minutes | 133 (9.9%) | 227 (17.3%) |
| 15 to 19 Minutes | 93 (6.9%) | 46 (3.5%) |
| 20 to 24 Minutes | 98 (7.3%) | 143 (10.9%) |
| 25 to 29 Minutes | 31 (2.3%) | 76 (5.8%) |
| 30 to 34 Minutes | 193 (14.4%) | 158 (12.0%) |
| 35 to 39 Minutes | 11 (0.8%) | 61 (4.6%) |
| 40 to 44 Minutes | 111 (8.3%) | 28 (2.1%) |
| 45 to 59 Minutes | 190 (14.1%) | 95 (7.2%) |
| 60 to 89 Minutes | 162 (12.1%) | 119 (9.1%) |
| 90 or more Minutes | 238 (17.7%) | 82 (6.2%) |
Time of Departure to Work by Sex in Cherry Valley
The most frequent times of departure to work in Cherry Valley are 12:00 AM to 4:59 AM (270, 20.1%) for males and 7:30 AM to 7:59 AM (334, 25.5%) for females.
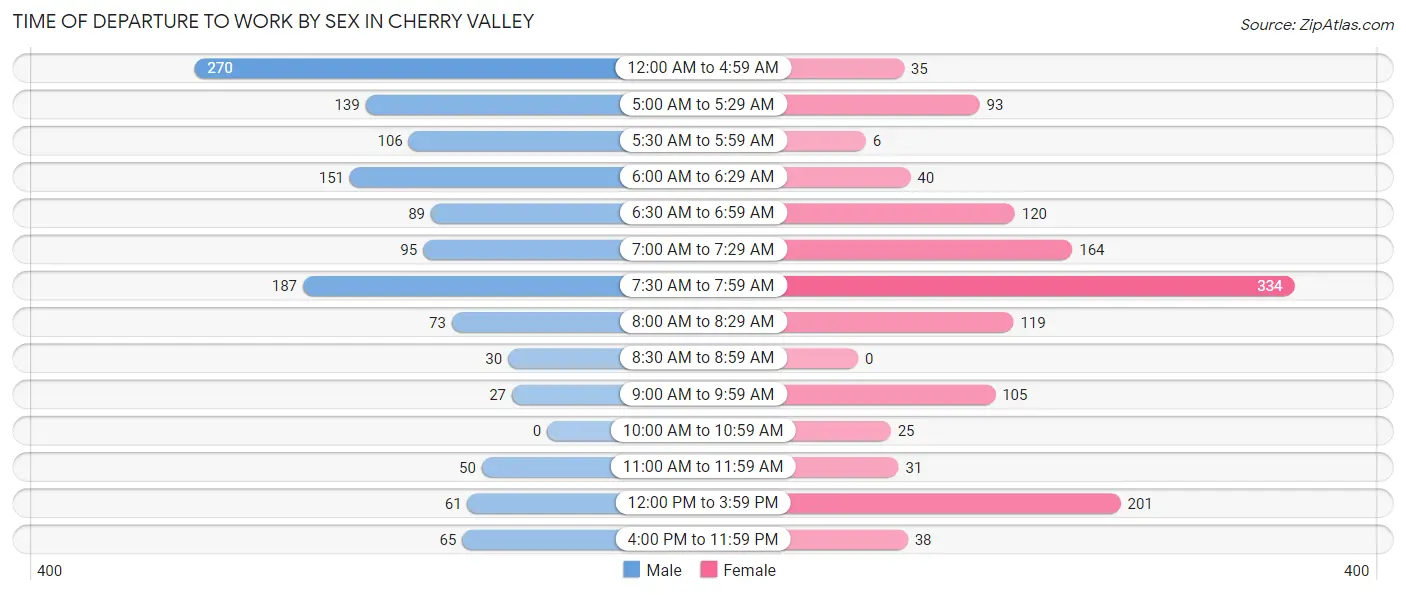
| Time of Departure | Male | Female |
| 12:00 AM to 4:59 AM | 270 (20.1%) | 35 (2.7%) |
| 5:00 AM to 5:29 AM | 139 (10.3%) | 93 (7.1%) |
| 5:30 AM to 5:59 AM | 106 (7.9%) | 6 (0.5%) |
| 6:00 AM to 6:29 AM | 151 (11.2%) | 40 (3.0%) |
| 6:30 AM to 6:59 AM | 89 (6.6%) | 120 (9.1%) |
| 7:00 AM to 7:29 AM | 95 (7.1%) | 164 (12.5%) |
| 7:30 AM to 7:59 AM | 187 (13.9%) | 334 (25.5%) |
| 8:00 AM to 8:29 AM | 73 (5.4%) | 119 (9.1%) |
| 8:30 AM to 8:59 AM | 30 (2.2%) | 0 (0.0%) |
| 9:00 AM to 9:59 AM | 27 (2.0%) | 105 (8.0%) |
| 10:00 AM to 10:59 AM | 0 (0.0%) | 25 (1.9%) |
| 11:00 AM to 11:59 AM | 50 (3.7%) | 31 (2.4%) |
| 12:00 PM to 3:59 PM | 61 (4.5%) | 201 (15.3%) |
| 4:00 PM to 11:59 PM | 65 (4.8%) | 38 (2.9%) |
| Total | 1,343 (100.0%) | 1,311 (100.0%) |
Housing Occupancy in Cherry Valley
Occupancy by Ownership in Cherry Valley
Of the total 2,707 dwellings in Cherry Valley, owner-occupied units account for 2,315 (85.5%), while renter-occupied units make up 392 (14.5%).
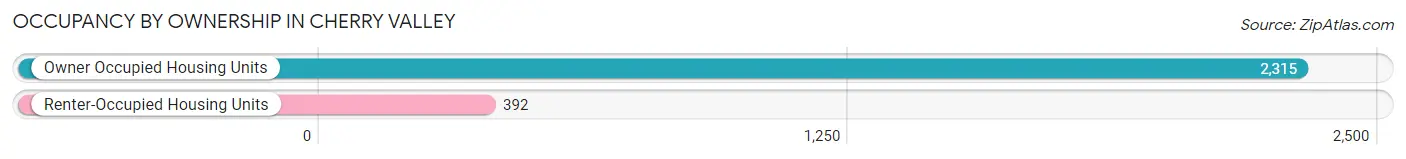
| Occupancy | # Housing Units | % Housing Units |
| Owner Occupied Housing Units | 2,315 | 85.5% |
| Renter-Occupied Housing Units | 392 | 14.5% |
| Total Occupied Housing Units | 2,707 | 100.0% |
Occupancy by Household Size in Cherry Valley
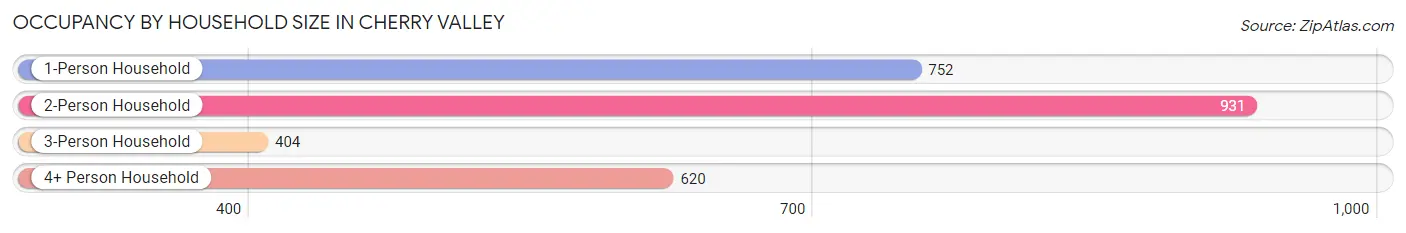
| Household Size | # Housing Units | % Housing Units |
| 1-Person Household | 752 | 27.8% |
| 2-Person Household | 931 | 34.4% |
| 3-Person Household | 404 | 14.9% |
| 4+ Person Household | 620 | 22.9% |
| Total Housing Units | 2,707 | 100.0% |
Occupancy by Ownership by Household Size in Cherry Valley
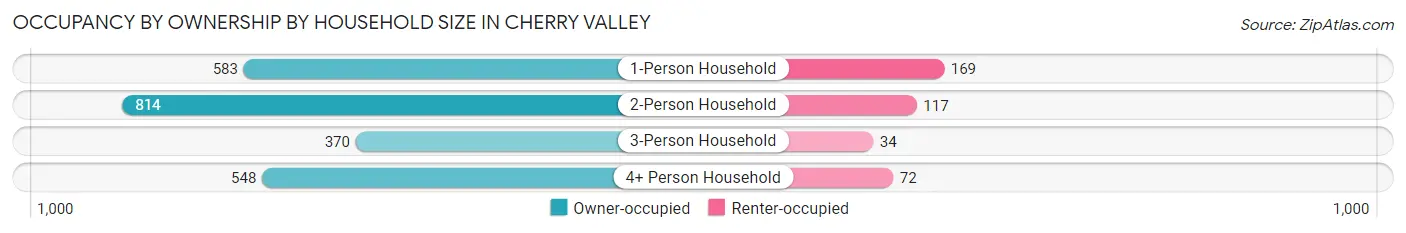
| Household Size | Owner-occupied | Renter-occupied |
| 1-Person Household | 583 (77.5%) | 169 (22.5%) |
| 2-Person Household | 814 (87.4%) | 117 (12.6%) |
| 3-Person Household | 370 (91.6%) | 34 (8.4%) |
| 4+ Person Household | 548 (88.4%) | 72 (11.6%) |
| Total Housing Units | 2,315 (85.5%) | 392 (14.5%) |
Occupancy by Educational Attainment in Cherry Valley
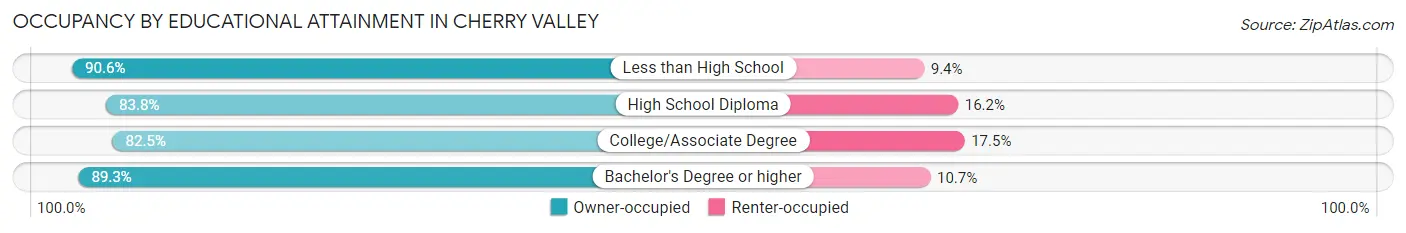
| Household Size | Owner-occupied | Renter-occupied |
| Less than High School | 307 (90.6%) | 32 (9.4%) |
| High School Diploma | 544 (83.8%) | 105 (16.2%) |
| College/Associate Degree | 870 (82.5%) | 184 (17.5%) |
| Bachelor's Degree or higher | 594 (89.3%) | 71 (10.7%) |
Occupancy by Age of Householder in Cherry Valley
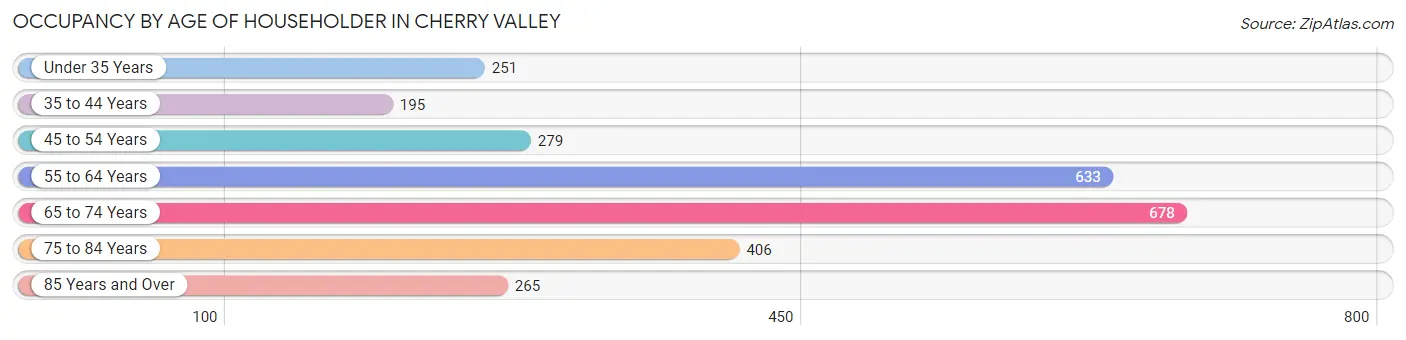
| Age Bracket | # Households | % Households |
| Under 35 Years | 251 | 9.3% |
| 35 to 44 Years | 195 | 7.2% |
| 45 to 54 Years | 279 | 10.3% |
| 55 to 64 Years | 633 | 23.4% |
| 65 to 74 Years | 678 | 25.1% |
| 75 to 84 Years | 406 | 15.0% |
| 85 Years and Over | 265 | 9.8% |
| Total | 2,707 | 100.0% |
Housing Finances in Cherry Valley
Median Income by Occupancy in Cherry Valley
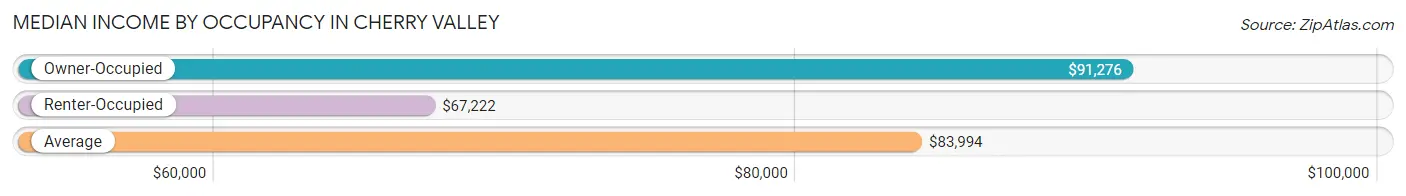
| Occupancy Type | # Households | Median Income |
| Owner-Occupied | 2,315 (85.5%) | $91,276 |
| Renter-Occupied | 392 (14.5%) | $67,222 |
| Average | 2,707 (100.0%) | $83,994 |
Occupancy by Householder Income Bracket in Cherry Valley
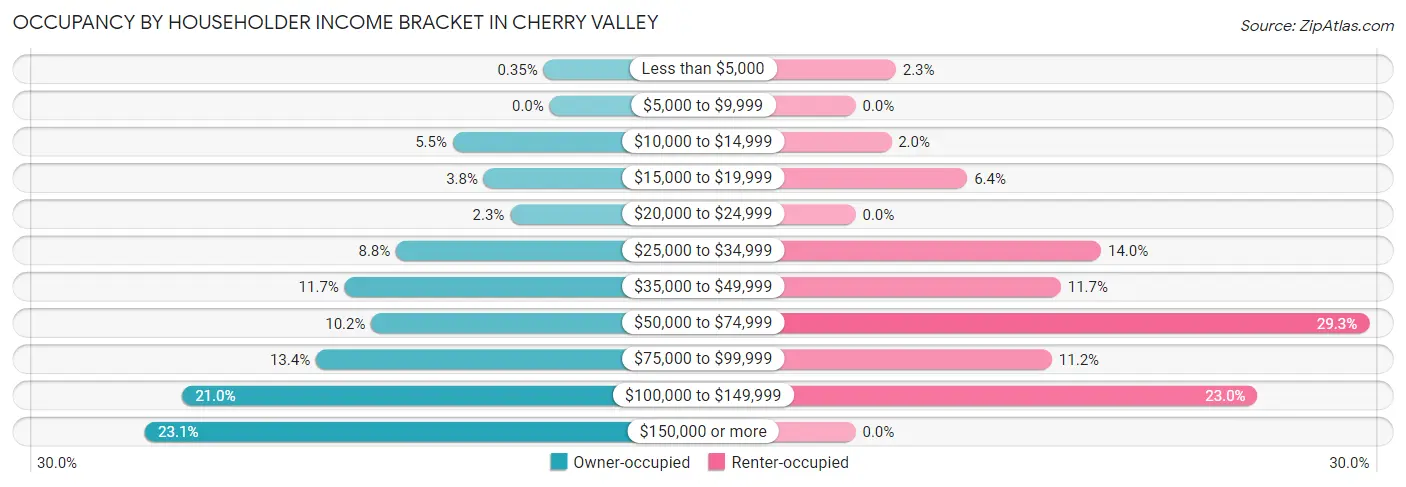
| Income Bracket | Owner-occupied | Renter-occupied |
| Less than $5,000 | 8 (0.4%) | 9 (2.3%) |
| $5,000 to $9,999 | 0 (0.0%) | 0 (0.0%) |
| $10,000 to $14,999 | 128 (5.5%) | 8 (2.0%) |
| $15,000 to $19,999 | 87 (3.8%) | 25 (6.4%) |
| $20,000 to $24,999 | 52 (2.2%) | 0 (0.0%) |
| $25,000 to $34,999 | 203 (8.8%) | 55 (14.0%) |
| $35,000 to $49,999 | 271 (11.7%) | 46 (11.7%) |
| $50,000 to $74,999 | 236 (10.2%) | 115 (29.3%) |
| $75,000 to $99,999 | 309 (13.4%) | 44 (11.2%) |
| $100,000 to $149,999 | 486 (21.0%) | 90 (23.0%) |
| $150,000 or more | 535 (23.1%) | 0 (0.0%) |
| Total | 2,315 (100.0%) | 392 (100.0%) |
Monthly Housing Cost Tiers in Cherry Valley
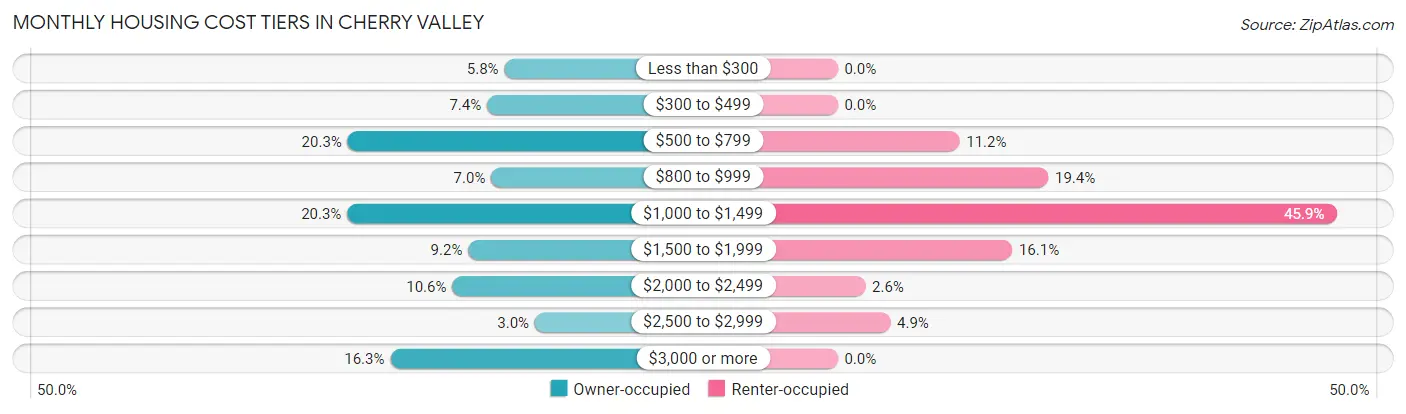
| Monthly Cost | Owner-occupied | Renter-occupied |
| Less than $300 | 135 (5.8%) | 0 (0.0%) |
| $300 to $499 | 172 (7.4%) | 0 (0.0%) |
| $500 to $799 | 469 (20.3%) | 44 (11.2%) |
| $800 to $999 | 163 (7.0%) | 76 (19.4%) |
| $1,000 to $1,499 | 470 (20.3%) | 180 (45.9%) |
| $1,500 to $1,999 | 212 (9.2%) | 63 (16.1%) |
| $2,000 to $2,499 | 246 (10.6%) | 10 (2.5%) |
| $2,500 to $2,999 | 70 (3.0%) | 19 (4.9%) |
| $3,000 or more | 378 (16.3%) | 0 (0.0%) |
| Total | 2,315 (100.0%) | 392 (100.0%) |
Physical Housing Characteristics in Cherry Valley
Housing Structures in Cherry Valley
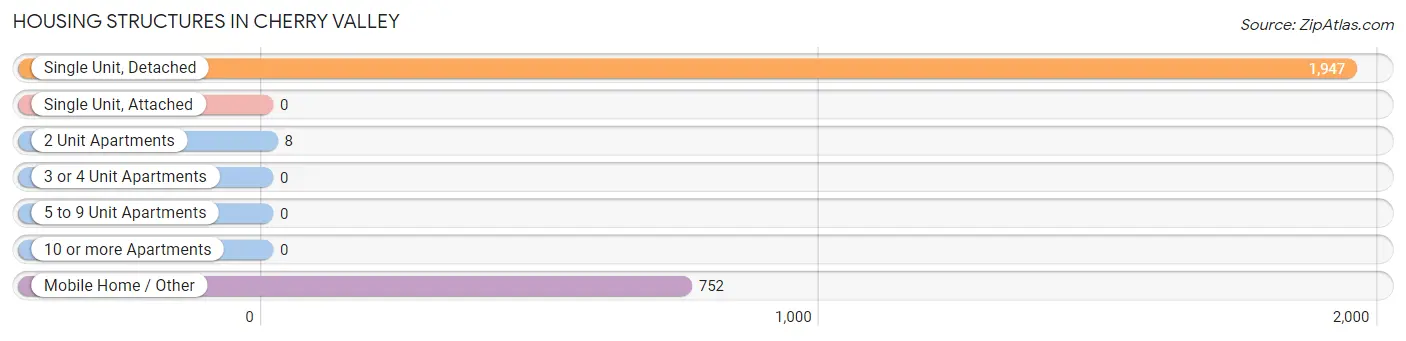
| Structure Type | # Housing Units | % Housing Units |
| Single Unit, Detached | 1,947 | 71.9% |
| Single Unit, Attached | 0 | 0.0% |
| 2 Unit Apartments | 8 | 0.3% |
| 3 or 4 Unit Apartments | 0 | 0.0% |
| 5 to 9 Unit Apartments | 0 | 0.0% |
| 10 or more Apartments | 0 | 0.0% |
| Mobile Home / Other | 752 | 27.8% |
| Total | 2,707 | 100.0% |
Housing Structures by Occupancy in Cherry Valley
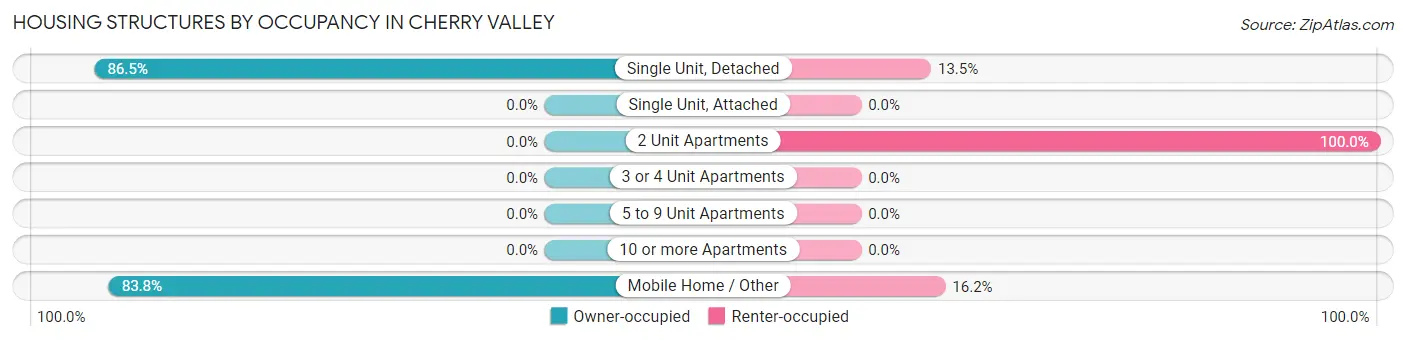
| Structure Type | Owner-occupied | Renter-occupied |
| Single Unit, Detached | 1,685 (86.5%) | 262 (13.5%) |
| Single Unit, Attached | 0 (0.0%) | 0 (0.0%) |
| 2 Unit Apartments | 0 (0.0%) | 8 (100.0%) |
| 3 or 4 Unit Apartments | 0 (0.0%) | 0 (0.0%) |
| 5 to 9 Unit Apartments | 0 (0.0%) | 0 (0.0%) |
| 10 or more Apartments | 0 (0.0%) | 0 (0.0%) |
| Mobile Home / Other | 630 (83.8%) | 122 (16.2%) |
| Total | 2,315 (85.5%) | 392 (14.5%) |
Housing Structures by Number of Rooms in Cherry Valley
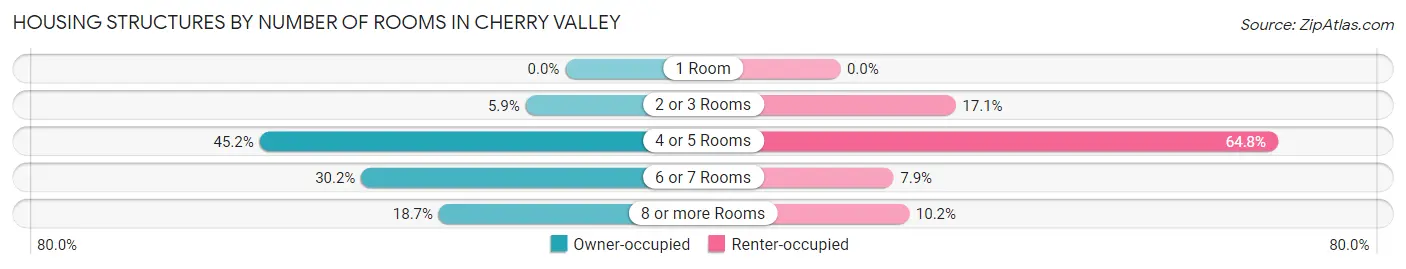
| Number of Rooms | Owner-occupied | Renter-occupied |
| 1 Room | 0 (0.0%) | 0 (0.0%) |
| 2 or 3 Rooms | 136 (5.9%) | 67 (17.1%) |
| 4 or 5 Rooms | 1,047 (45.2%) | 254 (64.8%) |
| 6 or 7 Rooms | 699 (30.2%) | 31 (7.9%) |
| 8 or more Rooms | 433 (18.7%) | 40 (10.2%) |
| Total | 2,315 (100.0%) | 392 (100.0%) |
Housing Structure by Heating Type in Cherry Valley
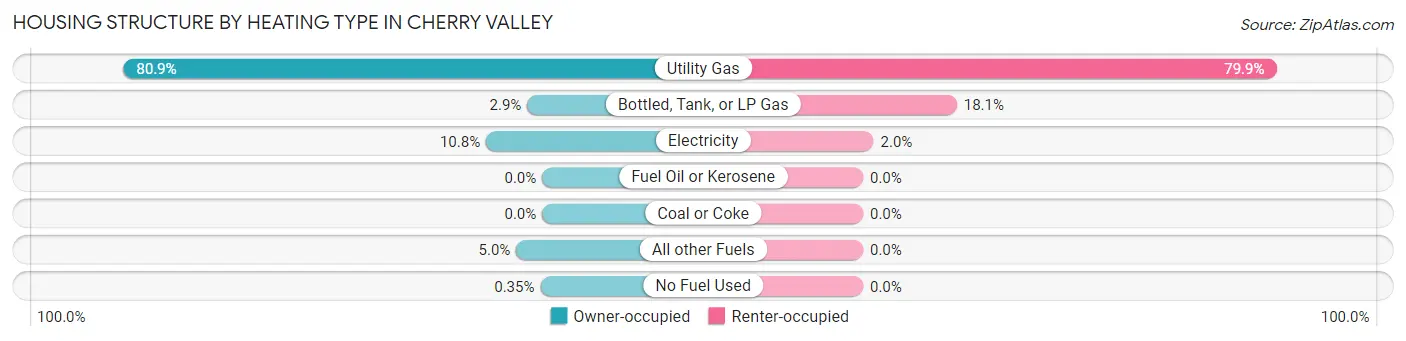
| Heating Type | Owner-occupied | Renter-occupied |
| Utility Gas | 1,873 (80.9%) | 313 (79.8%) |
| Bottled, Tank, or LP Gas | 67 (2.9%) | 71 (18.1%) |
| Electricity | 251 (10.8%) | 8 (2.0%) |
| Fuel Oil or Kerosene | 0 (0.0%) | 0 (0.0%) |
| Coal or Coke | 0 (0.0%) | 0 (0.0%) |
| All other Fuels | 116 (5.0%) | 0 (0.0%) |
| No Fuel Used | 8 (0.4%) | 0 (0.0%) |
| Total | 2,315 (100.0%) | 392 (100.0%) |
Household Vehicle Usage in Cherry Valley
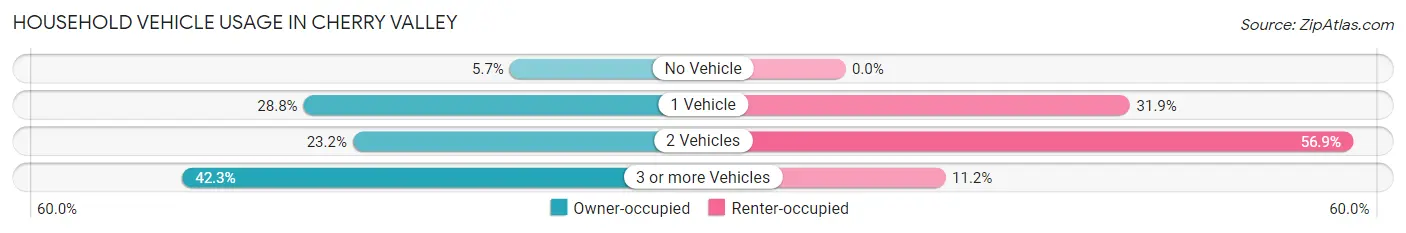
| Vehicles per Household | Owner-occupied | Renter-occupied |
| No Vehicle | 131 (5.7%) | 0 (0.0%) |
| 1 Vehicle | 666 (28.8%) | 125 (31.9%) |
| 2 Vehicles | 538 (23.2%) | 223 (56.9%) |
| 3 or more Vehicles | 980 (42.3%) | 44 (11.2%) |
| Total | 2,315 (100.0%) | 392 (100.0%) |
Real Estate & Mortgages in Cherry Valley
Real Estate and Mortgage Overview in Cherry Valley
| Characteristic | Without Mortgage | With Mortgage |
| Housing Units | 953 | 1,362 |
| Median Property Value | $275,200 | $417,700 |
| Median Household Income | $44,182 | $372 |
| Monthly Housing Costs | $583 | $378 |
| Real Estate Taxes | $2,062 | $0 |
Property Value by Mortgage Status in Cherry Valley
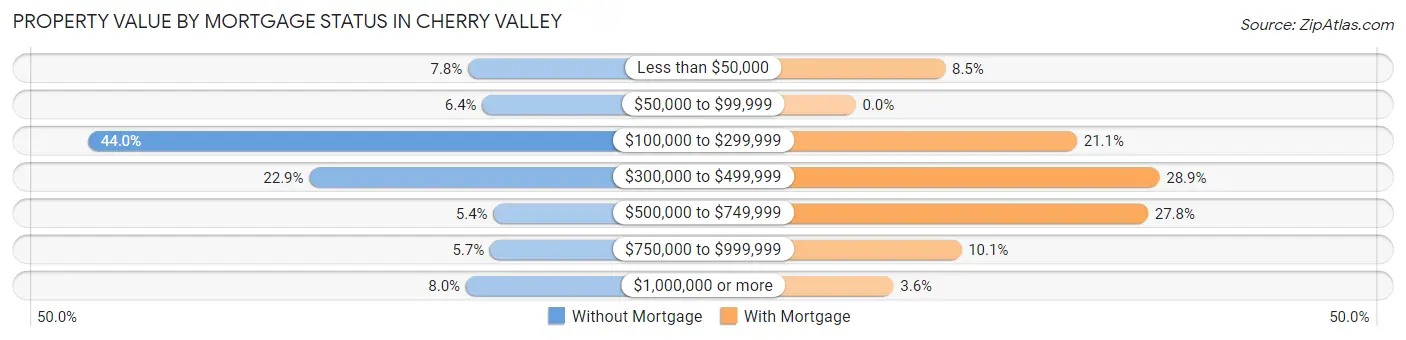
| Property Value | Without Mortgage | With Mortgage |
| Less than $50,000 | 74 (7.8%) | 116 (8.5%) |
| $50,000 to $99,999 | 61 (6.4%) | 0 (0.0%) |
| $100,000 to $299,999 | 419 (44.0%) | 287 (21.1%) |
| $300,000 to $499,999 | 218 (22.9%) | 394 (28.9%) |
| $500,000 to $749,999 | 51 (5.3%) | 379 (27.8%) |
| $750,000 to $999,999 | 54 (5.7%) | 137 (10.1%) |
| $1,000,000 or more | 76 (8.0%) | 49 (3.6%) |
| Total | 953 (100.0%) | 1,362 (100.0%) |
Household Income by Mortgage Status in Cherry Valley
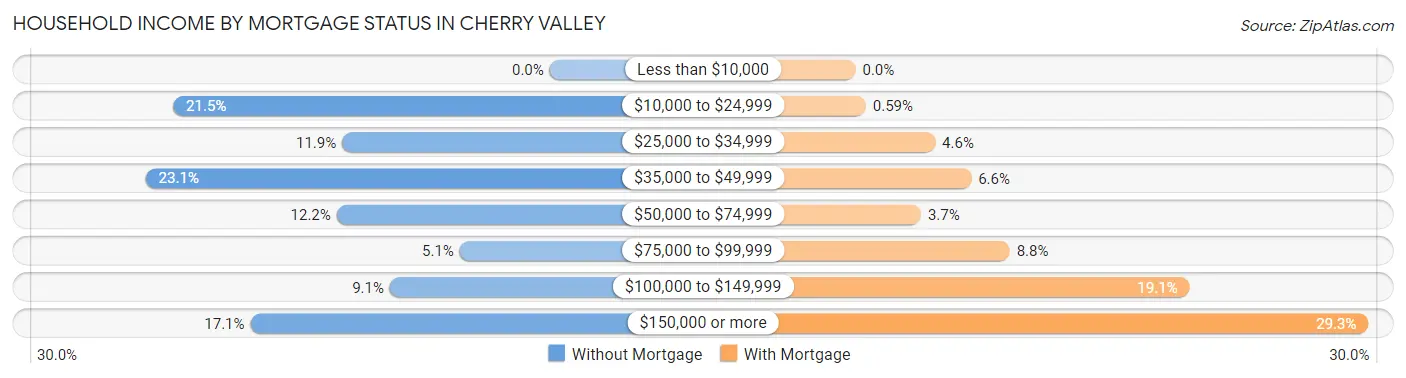
| Household Income | Without Mortgage | With Mortgage |
| Less than $10,000 | 0 (0.0%) | 0 (0.0%) |
| $10,000 to $24,999 | 205 (21.5%) | 8 (0.6%) |
| $25,000 to $34,999 | 113 (11.9%) | 62 (4.5%) |
| $35,000 to $49,999 | 220 (23.1%) | 90 (6.6%) |
| $50,000 to $74,999 | 116 (12.2%) | 51 (3.7%) |
| $75,000 to $99,999 | 49 (5.1%) | 120 (8.8%) |
| $100,000 to $149,999 | 87 (9.1%) | 260 (19.1%) |
| $150,000 or more | 163 (17.1%) | 399 (29.3%) |
| Total | 953 (100.0%) | 1,362 (100.0%) |
Property Value to Household Income Ratio in Cherry Valley
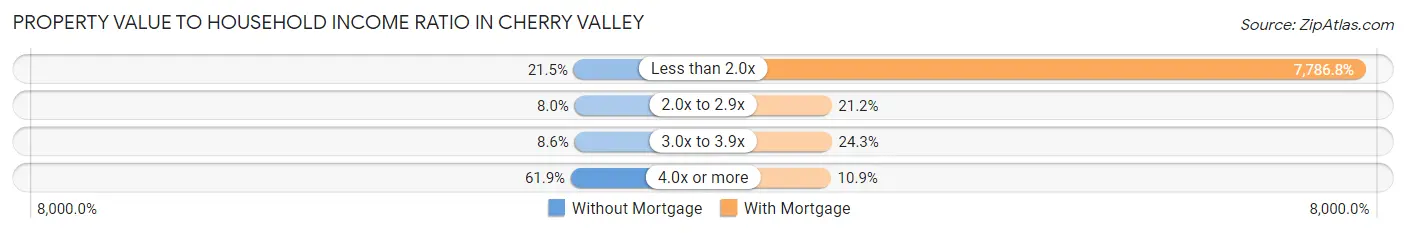
| Value-to-Income Ratio | Without Mortgage | With Mortgage |
| Less than 2.0x | 205 (21.5%) | 106,056 (7,786.8%) |
| 2.0x to 2.9x | 76 (8.0%) | 288 (21.1%) |
| 3.0x to 3.9x | 82 (8.6%) | 331 (24.3%) |
| 4.0x or more | 590 (61.9%) | 148 (10.9%) |
| Total | 953 (100.0%) | 1,362 (100.0%) |
Real Estate Taxes by Mortgage Status in Cherry Valley
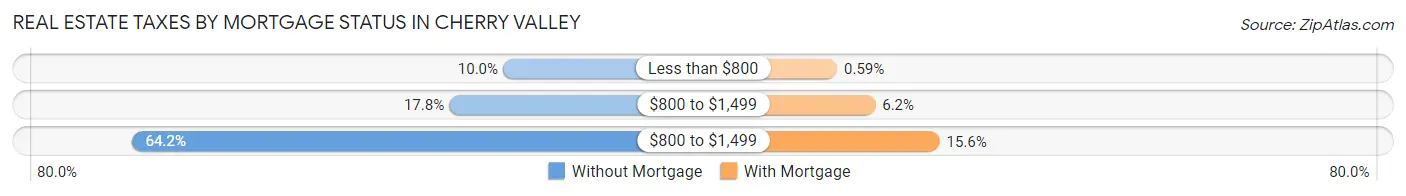
| Property Taxes | Without Mortgage | With Mortgage |
| Less than $800 | 95 (10.0%) | 8 (0.6%) |
| $800 to $1,499 | 170 (17.8%) | 84 (6.2%) |
| $800 to $1,499 | 612 (64.2%) | 212 (15.6%) |
| Total | 953 (100.0%) | 1,362 (100.0%) |
Health & Disability in Cherry Valley
Health Insurance Coverage by Age in Cherry Valley
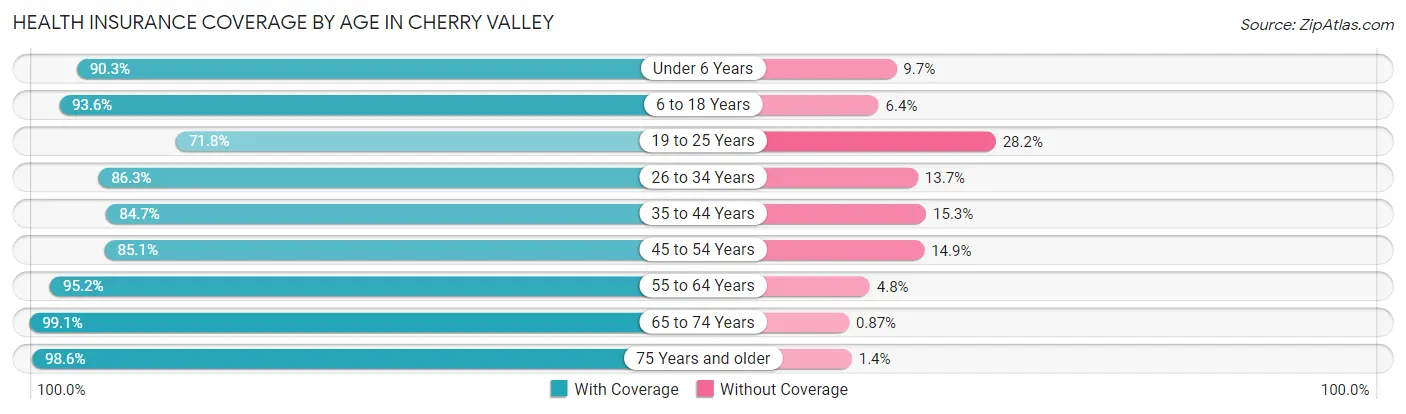
| Age Bracket | With Coverage | Without Coverage |
| Under 6 Years | 325 (90.3%) | 35 (9.7%) |
| 6 to 18 Years | 862 (93.6%) | 59 (6.4%) |
| 19 to 25 Years | 437 (71.8%) | 172 (28.2%) |
| 26 to 34 Years | 647 (86.3%) | 103 (13.7%) |
| 35 to 44 Years | 705 (84.7%) | 127 (15.3%) |
| 45 to 54 Years | 588 (85.1%) | 103 (14.9%) |
| 55 to 64 Years | 1,217 (95.2%) | 61 (4.8%) |
| 65 to 74 Years | 1,133 (99.1%) | 10 (0.9%) |
| 75 Years and older | 986 (98.6%) | 14 (1.4%) |
| Total | 6,900 (91.0%) | 684 (9.0%) |
Health Insurance Coverage by Citizenship Status in Cherry Valley
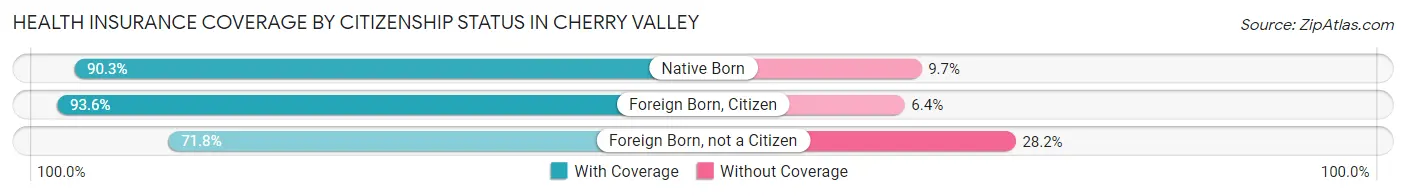
| Citizenship Status | With Coverage | Without Coverage |
| Native Born | 325 (90.3%) | 35 (9.7%) |
| Foreign Born, Citizen | 862 (93.6%) | 59 (6.4%) |
| Foreign Born, not a Citizen | 437 (71.8%) | 172 (28.2%) |
Health Insurance Coverage by Household Income in Cherry Valley
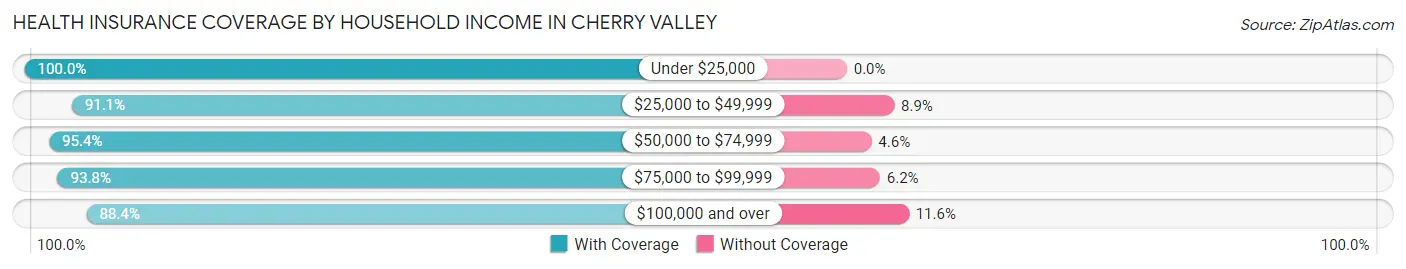
| Household Income | With Coverage | Without Coverage |
| Under $25,000 | 332 (100.0%) | 0 (0.0%) |
| $25,000 to $49,999 | 1,070 (91.1%) | 104 (8.9%) |
| $50,000 to $74,999 | 869 (95.4%) | 42 (4.6%) |
| $75,000 to $99,999 | 940 (93.8%) | 62 (6.2%) |
| $100,000 and over | 3,591 (88.4%) | 471 (11.6%) |
Public vs Private Health Insurance Coverage by Age in Cherry Valley
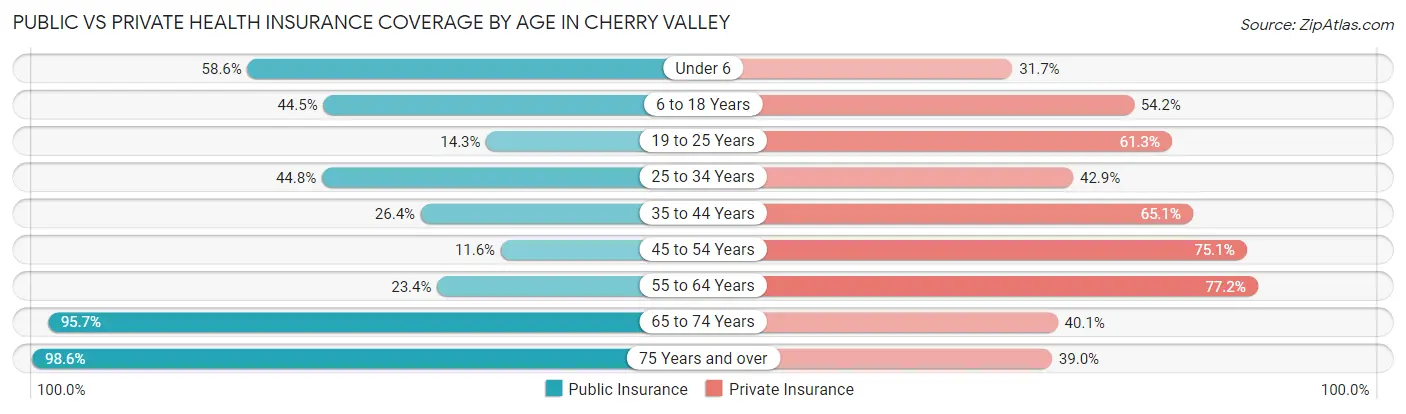
| Age Bracket | Public Insurance | Private Insurance |
| Under 6 | 211 (58.6%) | 114 (31.7%) |
| 6 to 18 Years | 410 (44.5%) | 499 (54.2%) |
| 19 to 25 Years | 87 (14.3%) | 373 (61.3%) |
| 25 to 34 Years | 336 (44.8%) | 322 (42.9%) |
| 35 to 44 Years | 220 (26.4%) | 542 (65.1%) |
| 45 to 54 Years | 80 (11.6%) | 519 (75.1%) |
| 55 to 64 Years | 299 (23.4%) | 986 (77.1%) |
| 65 to 74 Years | 1,094 (95.7%) | 458 (40.1%) |
| 75 Years and over | 986 (98.6%) | 390 (39.0%) |
| Total | 3,723 (49.1%) | 4,203 (55.4%) |
Disability Status by Sex by Age in Cherry Valley
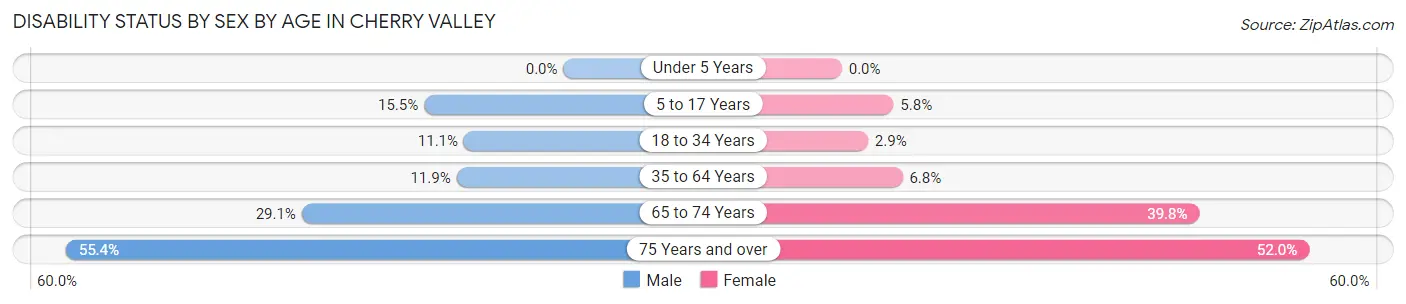
| Age Bracket | Male | Female |
| Under 5 Years | 0 (0.0%) | 0 (0.0%) |
| 5 to 17 Years | 98 (15.5%) | 20 (5.8%) |
| 18 to 34 Years | 79 (11.1%) | 19 (2.9%) |
| 35 to 64 Years | 175 (11.9%) | 90 (6.8%) |
| 65 to 74 Years | 153 (29.1%) | 246 (39.8%) |
| 75 Years and over | 256 (55.4%) | 280 (52.0%) |
Disability Class by Sex by Age in Cherry Valley
Disability Class: Hearing Difficulty
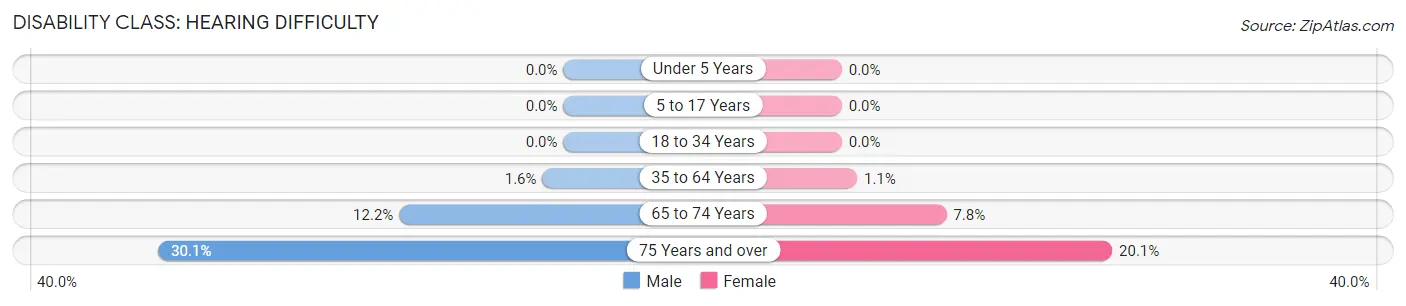
| Age Bracket | Male | Female |
| Under 5 Years | 0 (0.0%) | 0 (0.0%) |
| 5 to 17 Years | 0 (0.0%) | 0 (0.0%) |
| 18 to 34 Years | 0 (0.0%) | 0 (0.0%) |
| 35 to 64 Years | 23 (1.6%) | 15 (1.1%) |
| 65 to 74 Years | 64 (12.2%) | 48 (7.8%) |
| 75 Years and over | 139 (30.1%) | 108 (20.1%) |
Disability Class: Vision Difficulty
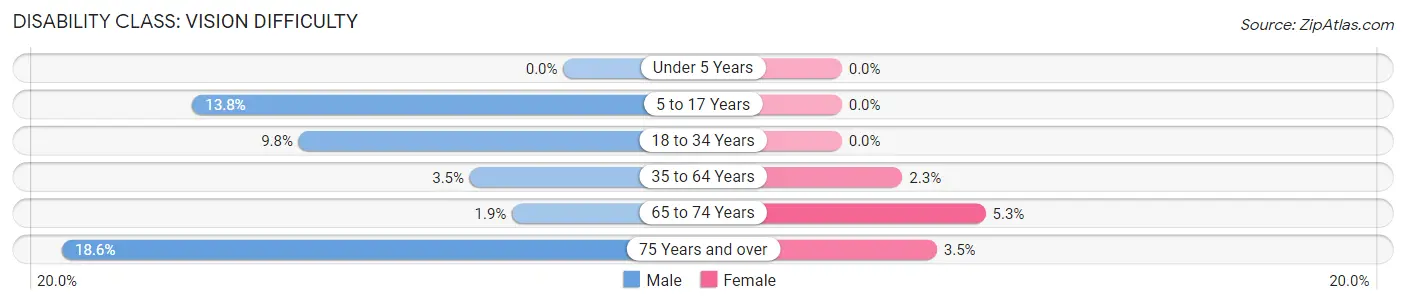
| Age Bracket | Male | Female |
| Under 5 Years | 0 (0.0%) | 0 (0.0%) |
| 5 to 17 Years | 87 (13.8%) | 0 (0.0%) |
| 18 to 34 Years | 70 (9.8%) | 0 (0.0%) |
| 35 to 64 Years | 51 (3.5%) | 30 (2.2%) |
| 65 to 74 Years | 10 (1.9%) | 33 (5.3%) |
| 75 Years and over | 86 (18.6%) | 19 (3.5%) |
Disability Class: Cognitive Difficulty
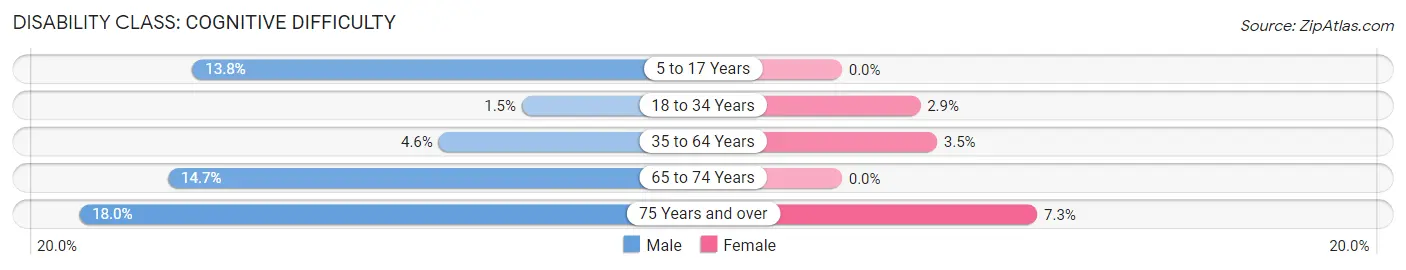
| Age Bracket | Male | Female |
| 5 to 17 Years | 87 (13.8%) | 0 (0.0%) |
| 18 to 34 Years | 11 (1.5%) | 19 (2.9%) |
| 35 to 64 Years | 68 (4.6%) | 47 (3.5%) |
| 65 to 74 Years | 77 (14.7%) | 0 (0.0%) |
| 75 Years and over | 83 (18.0%) | 39 (7.2%) |
Disability Class: Ambulatory Difficulty
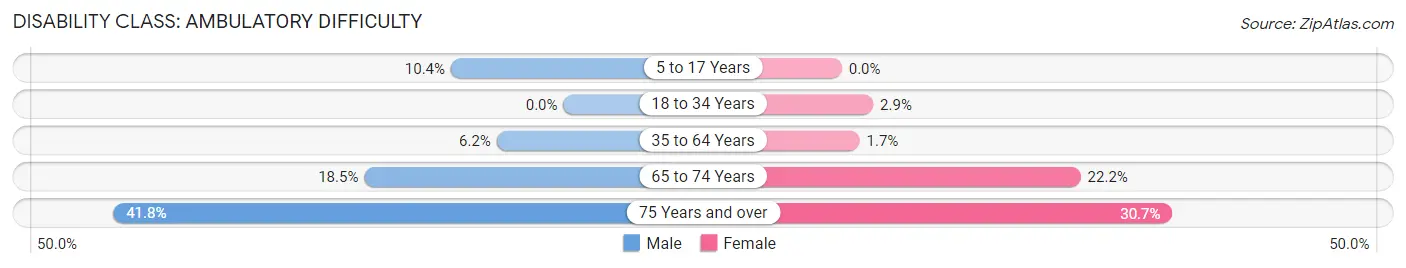
| Age Bracket | Male | Female |
| 5 to 17 Years | 66 (10.4%) | 0 (0.0%) |
| 18 to 34 Years | 0 (0.0%) | 19 (2.9%) |
| 35 to 64 Years | 91 (6.2%) | 22 (1.7%) |
| 65 to 74 Years | 97 (18.5%) | 137 (22.2%) |
| 75 Years and over | 193 (41.8%) | 165 (30.7%) |
Disability Class: Self-Care Difficulty
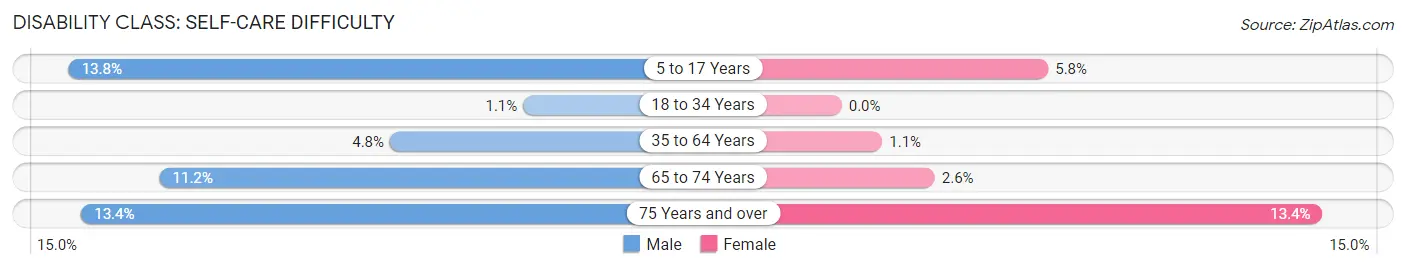
| Age Bracket | Male | Female |
| 5 to 17 Years | 87 (13.8%) | 20 (5.8%) |
| 18 to 34 Years | 8 (1.1%) | 0 (0.0%) |
| 35 to 64 Years | 71 (4.8%) | 15 (1.1%) |
| 65 to 74 Years | 59 (11.2%) | 16 (2.6%) |
| 75 Years and over | 62 (13.4%) | 72 (13.4%) |
Technology Access in Cherry Valley
Computing Device Access in Cherry Valley
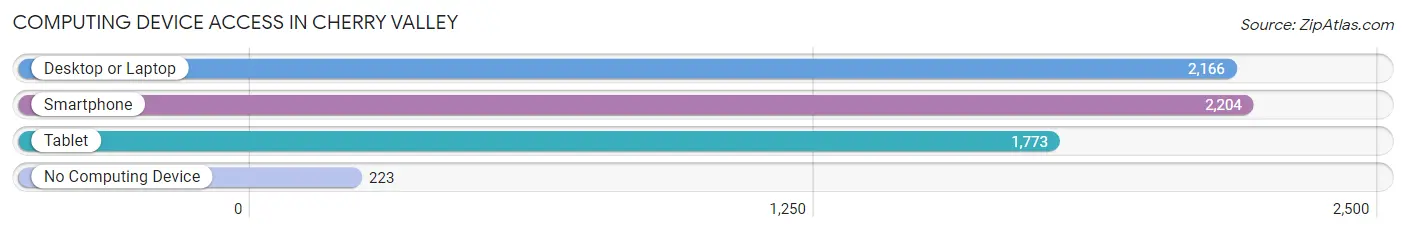
| Device Type | # Households | % Households |
| Desktop or Laptop | 2,166 | 80.0% |
| Smartphone | 2,204 | 81.4% |
| Tablet | 1,773 | 65.5% |
| No Computing Device | 223 | 8.2% |
| Total | 2,707 | 100.0% |
Internet Access in Cherry Valley
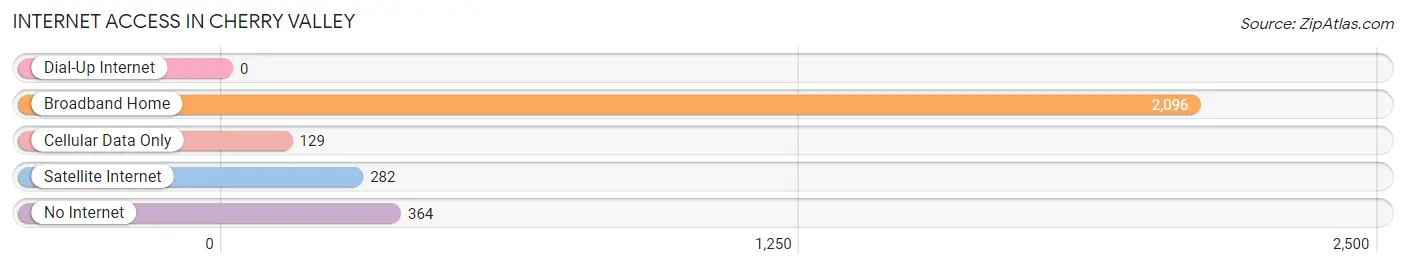
| Internet Type | # Households | % Households |
| Dial-Up Internet | 0 | 0.0% |
| Broadband Home | 2,096 | 77.4% |
| Cellular Data Only | 129 | 4.8% |
| Satellite Internet | 282 | 10.4% |
| No Internet | 364 | 13.5% |
| Total | 2,707 | 100.0% |
Cherry Valley Summary
Cherry Valley is a small unincorporated community located in the San Gorgonio Pass of Riverside County, California. It is situated between the cities of Beaumont and Banning, and is part of the San Gorgonio Pass Area. The population of Cherry Valley was estimated to be 4,711 in 2019.
History
Cherry Valley was originally inhabited by the Cahuilla people, who were the original inhabitants of the San Gorgonio Pass area. The first European settlers arrived in the area in the late 1800s, and the area was officially established as a community in 1891. The community was named after the cherry orchards that were planted in the area by the settlers.
In the early 1900s, the area was known for its cherry orchards and was a popular destination for tourists. The area was also home to a number of resorts, including the Cherry Valley Hotel, which was built in the 1920s.
In the 1950s, the area began to experience rapid growth due to the construction of the San Gorgonio Pass Freeway. This led to an influx of new residents and businesses, and the area began to develop into a suburban community.
Geography
Cherry Valley is located in the San Gorgonio Pass of Riverside County, California. It is situated between the cities of Beaumont and Banning, and is part of the San Gorgonio Pass Area. The area is characterized by rolling hills and is surrounded by the San Bernardino National Forest.
The climate in Cherry Valley is mild and temperate, with hot summers and cool winters. The average annual temperature is around 70°F (21°C). The average annual precipitation is around 11 inches (279 mm).
Economy
Cherry Valley is primarily a residential community, but it is also home to a number of businesses. The area is home to a number of retail stores, restaurants, and other businesses. The area is also home to a number of industrial and manufacturing businesses.
The economy of Cherry Valley is largely driven by the tourism industry. The area is home to a number of resorts and hotels, as well as a number of recreational activities. The area is also home to a number of wineries and vineyards, which attract visitors from all over the world.
Demographics
As of 2019, the population of Cherry Valley was estimated to be 4,711. The racial makeup of the area is predominantly White (77.3%), followed by Hispanic or Latino (14.2%), Asian (3.7%), and African American (2.2%). The median household income in Cherry Valley is $63,945, and the median age is 39.7 years.
Conclusion
Cherry Valley is a small unincorporated community located in the San Gorgonio Pass of Riverside County, California. It is situated between the cities of Beaumont and Banning, and is part of the San Gorgonio Pass Area. The area is characterized by rolling hills and is surrounded by the San Bernardino National Forest. The economy of Cherry Valley is largely driven by the tourism industry, and the population of the area is estimated to be 4,711. The racial makeup of the area is predominantly White, followed by Hispanic or Latino, Asian, and African American. The median household income in Cherry Valley is $63,945, and the median age is 39.7 years.
Common Questions
What is Per Capita Income in Cherry Valley?
Per Capita income in Cherry Valley is $40,655.
What is the Median Family Income in Cherry Valley?
Median Family Income in Cherry Valley is $94,099.
What is the Median Household income in Cherry Valley?
Median Household Income in Cherry Valley is $83,994.
What is Income or Wage Gap in Cherry Valley?
Income or Wage Gap in Cherry Valley is 29.6%.
Women in Cherry Valley earn 70.4 cents for every dollar earned by a man.
What is Inequality or Gini Index in Cherry Valley?
Inequality or Gini Index in Cherry Valley is 0.47.
What is the Total Population of Cherry Valley?
Total Population of Cherry Valley is 7,652.
What is the Total Male Population of Cherry Valley?
Total Male Population of Cherry Valley is 3,988.
What is the Total Female Population of Cherry Valley?
Total Female Population of Cherry Valley is 3,664.
What is the Ratio of Males per 100 Females in Cherry Valley?
There are 108.84 Males per 100 Females in Cherry Valley.
What is the Ratio of Females per 100 Males in Cherry Valley?
There are 91.88 Females per 100 Males in Cherry Valley.
What is the Median Population Age in Cherry Valley?
Median Population Age in Cherry Valley is 49.7 Years.
What is the Average Family Size in Cherry Valley
Average Family Size in Cherry Valley is 3.3 People.
What is the Average Household Size in Cherry Valley
Average Household Size in Cherry Valley is 2.8 People.
How Large is the Labor Force in Cherry Valley?
There are 3,461 People in the Labor Forcein in Cherry Valley.
What is the Percentage of People in the Labor Force in Cherry Valley?
52.7% of People are in the Labor Force in Cherry Valley.
What is the Unemployment Rate in Cherry Valley?
Unemployment Rate in Cherry Valley is 11.2%.