Cities with the Lowest Poverty Level Among Seniors Over the Age of 75 in New Jersey
RELATED REPORTS & OPTIONS
Lowest Poverty | Seniors 75+
New Jersey
Compare Cities
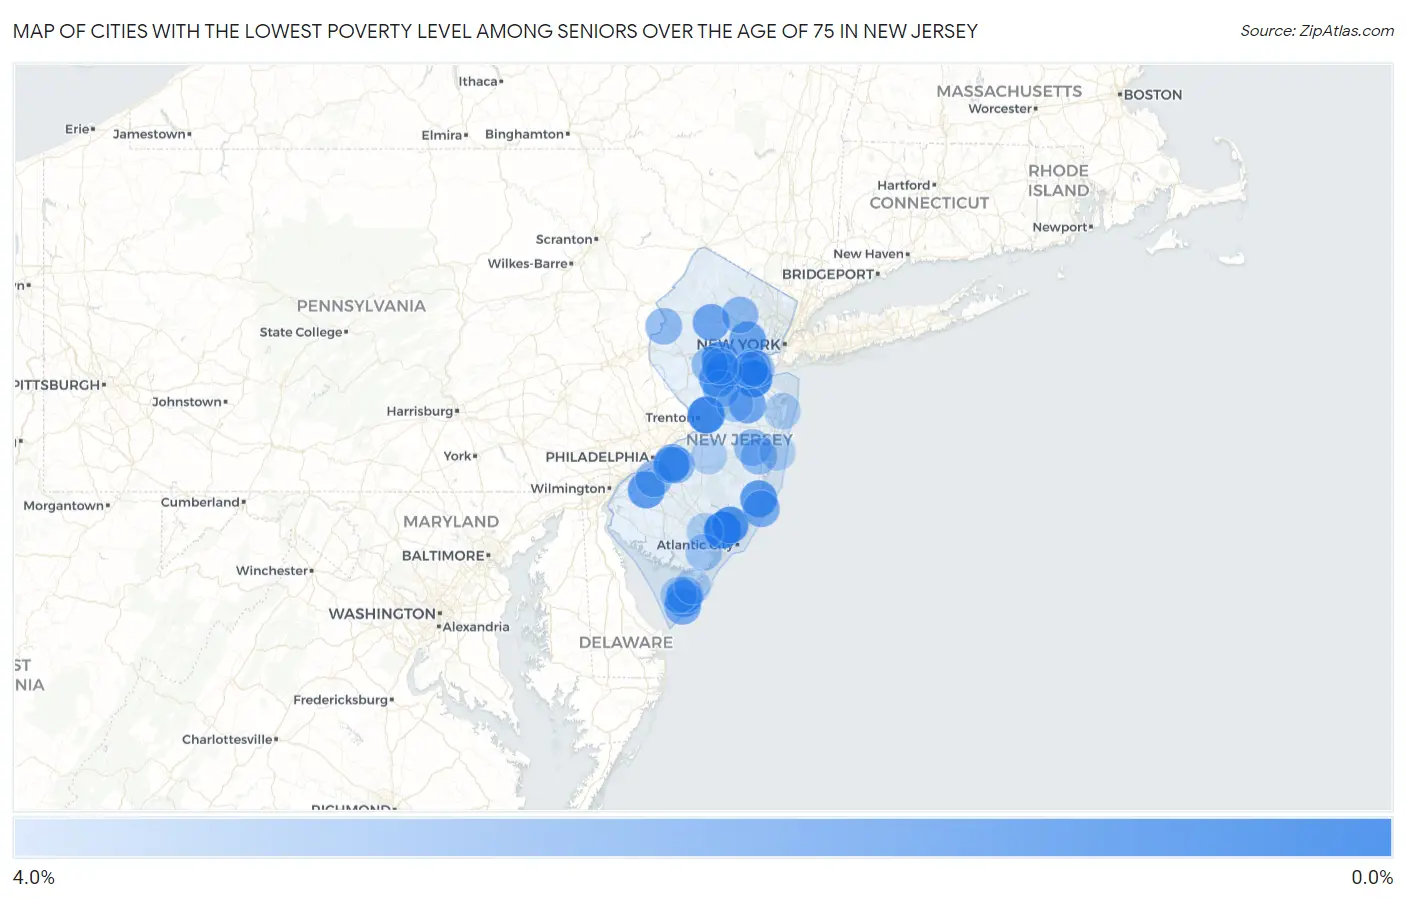
Map of Cities with the Lowest Poverty Level Among Seniors Over the Age of 75 in New Jersey
4.0%
0.0%
Cities with the Lowest Poverty Level Among Seniors Over the Age of 75 in New Jersey
| City | Senior Poverty | vs State | vs National | |
| 1. | Pomona | 0.14% | 10.7%(-10.5)#1 | 11.1%(-10.9)#5 |
| 2. | Hopelawn | 0.17% | 10.7%(-10.5)#2 | 11.1%(-10.9)#10 |
| 3. | Bloomingdale Borough | 0.23% | 10.7%(-10.4)#3 | 11.1%(-10.8)#15 |
| 4. | Upper Saddle River Borough | 0.28% | 10.7%(-10.4)#4 | 11.1%(-10.8)#23 |
| 5. | Mercerville | 0.32% | 10.7%(-10.3)#5 | 11.1%(-10.7)#28 |
| 6. | Pines Lake | 0.36% | 10.7%(-10.3)#6 | 11.1%(-10.7)#35 |
| 7. | South Amboy | 0.37% | 10.7%(-10.3)#7 | 11.1%(-10.7)#36 |
| 8. | Morris Plains Borough | 0.42% | 10.7%(-10.2)#8 | 11.1%(-10.7)#39 |
| 9. | Demarest Borough | 0.44% | 10.7%(-10.2)#9 | 11.1%(-10.6)#43 |
| 10. | Woodcliff Lake Borough | 0.48% | 10.7%(-10.2)#10 | 11.1%(-10.6)#51 |
| 11. | Lyons | 0.74% | 10.7%(-9.93)#11 | 11.1%(-10.3)#92 |
| 12. | Seaville | 0.77% | 10.7%(-9.89)#12 | 11.1%(-10.3)#98 |
| 13. | Magnolia Borough | 0.81% | 10.7%(-9.85)#13 | 11.1%(-10.3)#109 |
| 14. | Martinsville | 0.95% | 10.7%(-9.71)#14 | 11.1%(-10.1)#132 |
| 15. | North Haledon Borough | 0.98% | 10.7%(-9.68)#15 | 11.1%(-10.1)#138 |
| 16. | Smithville | 1.1% | 10.7%(-9.56)#16 | 11.1%(-9.96)#159 |
| 17. | Beach Haven West | 1.2% | 10.7%(-9.43)#17 | 11.1%(-9.83)#197 |
| 18. | National Park Borough | 1.2% | 10.7%(-9.42)#18 | 11.1%(-9.82)#199 |
| 19. | Mantoloking Borough | 1.3% | 10.7%(-9.41)#19 | 11.1%(-9.82)#203 |
| 20. | Mullica Hill | 1.4% | 10.7%(-9.29)#20 | 11.1%(-9.70)#245 |
| 21. | Blackwells Mills | 1.4% | 10.7%(-9.27)#21 | 11.1%(-9.67)#256 |
| 22. | Woodbury Heights Borough | 1.5% | 10.7%(-9.13)#22 | 11.1%(-9.53)#306 |
| 23. | Kinnelon Borough | 1.5% | 10.7%(-9.13)#23 | 11.1%(-9.53)#308 |
| 24. | Sea Girt Borough | 1.5% | 10.7%(-9.13)#24 | 11.1%(-9.53)#311 |
| 25. | Midland Park Borough | 1.7% | 10.7%(-9.00)#25 | 11.1%(-9.40)#372 |
| 26. | Short Hills | 1.7% | 10.7%(-8.95)#26 | 11.1%(-9.36)#386 |
| 27. | Erma | 1.7% | 10.7%(-8.94)#27 | 11.1%(-9.34)#393 |
| 28. | Succasunna | 1.8% | 10.7%(-8.82)#28 | 11.1%(-9.22)#444 |
| 29. | East Newark Borough | 1.9% | 10.7%(-8.80)#29 | 11.1%(-9.20)#460 |
| 30. | Kingston Estates | 1.9% | 10.7%(-8.74)#30 | 11.1%(-9.15)#479 |
| 31. | Yorketown | 2.0% | 10.7%(-8.71)#31 | 11.1%(-9.11)#491 |
| 32. | Marmora | 2.0% | 10.7%(-8.70)#32 | 11.1%(-9.11)#494 |
| 33. | Woodbridge | 2.0% | 10.7%(-8.68)#33 | 11.1%(-9.09)#506 |
| 34. | Ship Bottom Borough | 2.1% | 10.7%(-8.57)#34 | 11.1%(-8.97)#587 |
| 35. | Cape May | 2.1% | 10.7%(-8.52)#35 | 11.1%(-8.92)#612 |
| 36. | Franklin Center | 2.2% | 10.7%(-8.51)#36 | 11.1%(-8.91)#621 |
| 37. | Allentown Borough | 2.2% | 10.7%(-8.51)#37 | 11.1%(-8.91)#623 |
| 38. | Milltown Borough | 2.2% | 10.7%(-8.48)#38 | 11.1%(-8.88)#650 |
| 39. | North Beach Haven | 2.2% | 10.7%(-8.46)#39 | 11.1%(-8.86)#659 |
| 40. | Alpha Borough | 2.2% | 10.7%(-8.44)#40 | 11.1%(-8.84)#667 |
| 41. | South Plainfield Borough | 2.3% | 10.7%(-8.38)#41 | 11.1%(-8.78)#712 |
| 42. | Park Ridge Borough | 2.3% | 10.7%(-8.38)#42 | 11.1%(-8.78)#714 |
| 43. | West Cape May Borough | 2.4% | 10.7%(-8.23)#43 | 11.1%(-8.63)#806 |
| 44. | Roselle Park Borough | 2.5% | 10.7%(-8.20)#44 | 11.1%(-8.60)#830 |
| 45. | Kendall Park | 2.6% | 10.7%(-8.06)#45 | 11.1%(-8.46)#932 |
| 46. | Oak Valley | 2.6% | 10.7%(-8.05)#46 | 11.1%(-8.45)#937 |
| 47. | Hamburg Borough | 2.6% | 10.7%(-8.04)#47 | 11.1%(-8.45)#942 |
| 48. | Pompton Lakes Borough | 2.6% | 10.7%(-8.02)#48 | 11.1%(-8.42)#962 |
| 49. | Lavallette Borough | 2.6% | 10.7%(-8.02)#49 | 11.1%(-8.42)#964 |
| 50. | Greentree | 2.7% | 10.7%(-7.94)#50 | 11.1%(-8.34)#1,024 |
| 51. | Barclay | 2.7% | 10.7%(-7.94)#51 | 11.1%(-8.34)#1,031 |
| 52. | Boonton | 2.8% | 10.7%(-7.86)#52 | 11.1%(-8.27)#1,082 |
| 53. | Belvidere | 2.8% | 10.7%(-7.83)#53 | 11.1%(-8.24)#1,109 |
| 54. | Bradley Gardens | 2.9% | 10.7%(-7.81)#54 | 11.1%(-8.21)#1,121 |
| 55. | South Bound Brook Borough | 2.9% | 10.7%(-7.79)#55 | 11.1%(-8.19)#1,144 |
| 56. | Ledgewood | 2.9% | 10.7%(-7.76)#56 | 11.1%(-8.16)#1,167 |
| 57. | Leisure Knoll | 2.9% | 10.7%(-7.75)#57 | 11.1%(-8.15)#1,173 |
| 58. | Mount Hope | 3.0% | 10.7%(-7.68)#58 | 11.1%(-8.08)#1,221 |
| 59. | Silver Ridge | 3.0% | 10.7%(-7.68)#59 | 11.1%(-8.08)#1,231 |
| 60. | Oakland Borough | 3.0% | 10.7%(-7.65)#60 | 11.1%(-8.05)#1,248 |
| 61. | Troy Hills | 3.1% | 10.7%(-7.61)#61 | 11.1%(-8.01)#1,291 |
| 62. | Sewaren | 3.1% | 10.7%(-7.58)#62 | 11.1%(-7.98)#1,316 |
| 63. | Beachwood Borough | 3.1% | 10.7%(-7.57)#63 | 11.1%(-7.97)#1,320 |
| 64. | Surf City Borough | 3.1% | 10.7%(-7.56)#64 | 11.1%(-7.96)#1,323 |
| 65. | Kenilworth Borough | 3.2% | 10.7%(-7.49)#65 | 11.1%(-7.89)#1,392 |
| 66. | Belmar Borough | 3.2% | 10.7%(-7.44)#66 | 11.1%(-7.84)#1,420 |
| 67. | Chesilhurst Borough | 3.3% | 10.7%(-7.41)#67 | 11.1%(-7.81)#1,465 |
| 68. | Rio Grande | 3.3% | 10.7%(-7.41)#68 | 11.1%(-7.81)#1,468 |
| 69. | Far Hills Borough | 3.3% | 10.7%(-7.40)#69 | 11.1%(-7.81)#1,472 |
| 70. | Corbin City | 3.3% | 10.7%(-7.33)#70 | 11.1%(-7.73)#1,526 |
| 71. | Packanack Lake | 3.3% | 10.7%(-7.32)#71 | 11.1%(-7.73)#1,540 |
| 72. | Folsom Borough | 3.4% | 10.7%(-7.29)#72 | 11.1%(-7.70)#1,562 |
| 73. | Wrightstown Borough | 3.4% | 10.7%(-7.22)#73 | 11.1%(-7.62)#1,641 |
| 74. | Stratford Borough | 3.5% | 10.7%(-7.19)#74 | 11.1%(-7.60)#1,657 |
| 75. | Watchung Borough | 3.5% | 10.7%(-7.19)#75 | 11.1%(-7.59)#1,661 |
| 76. | Concordia | 3.5% | 10.7%(-7.18)#76 | 11.1%(-7.58)#1,666 |
| 77. | Villas | 3.5% | 10.7%(-7.18)#77 | 11.1%(-7.58)#1,667 |
| 78. | Oradell Borough | 3.6% | 10.7%(-7.11)#78 | 11.1%(-7.51)#1,720 |
| 79. | Bay Head Borough | 3.6% | 10.7%(-7.09)#79 | 11.1%(-7.50)#1,741 |
| 80. | Menlo Park Terrace | 3.6% | 10.7%(-7.08)#80 | 11.1%(-7.48)#1,770 |
| 81. | Totowa Borough | 3.6% | 10.7%(-7.07)#81 | 11.1%(-7.48)#1,772 |
| 82. | Haddonfield Borough | 3.6% | 10.7%(-7.05)#82 | 11.1%(-7.45)#1,793 |
| 83. | North Plainfield Borough | 3.6% | 10.7%(-7.05)#83 | 11.1%(-7.45)#1,795 |
| 84. | Medford Lakes Borough | 3.7% | 10.7%(-6.98)#84 | 11.1%(-7.38)#1,851 |
| 85. | Oakhurst | 3.7% | 10.7%(-6.92)#85 | 11.1%(-7.33)#1,908 |
| 86. | Pitman Borough | 3.8% | 10.7%(-6.90)#86 | 11.1%(-7.30)#1,932 |
| 87. | Mays Landing | 3.8% | 10.7%(-6.88)#87 | 11.1%(-7.29)#1,956 |
| 88. | Pemberton Heights | 3.8% | 10.7%(-6.87)#88 | 11.1%(-7.28)#1,962 |
| 89. | Frenchtown Borough | 3.8% | 10.7%(-6.85)#89 | 11.1%(-7.26)#1,982 |
| 90. | Whippany | 3.8% | 10.7%(-6.85)#90 | 11.1%(-7.25)#1,990 |
| 91. | Fords | 3.8% | 10.7%(-6.83)#91 | 11.1%(-7.23)#1,999 |
| 92. | Vincentown | 3.8% | 10.7%(-6.82)#92 | 11.1%(-7.22)#2,020 |
| 93. | Cape May Court House | 3.9% | 10.7%(-6.80)#93 | 11.1%(-7.20)#2,039 |
| 94. | Island Heights Borough | 3.9% | 10.7%(-6.79)#94 | 11.1%(-7.20)#2,047 |
| 95. | Newfield Borough | 3.9% | 10.7%(-6.78)#95 | 11.1%(-7.18)#2,059 |
| 96. | Dover Beaches North | 3.9% | 10.7%(-6.77)#96 | 11.1%(-7.18)#2,064 |
| 97. | Woodstown Borough | 3.9% | 10.7%(-6.76)#97 | 11.1%(-7.17)#2,079 |
| 98. | The Ponds | 3.9% | 10.7%(-6.76)#98 | 11.1%(-7.16)#2,084 |
| 99. | Landing | 3.9% | 10.7%(-6.73)#99 | 11.1%(-7.14)#2,108 |
| 100. | Finderne | 4.0% | 10.7%(-6.71)#100 | 11.1%(-7.12)#2,126 |
Common Questions
What are the Top 10 Cities with the Lowest Poverty Level Among Seniors Over the Age of 75 in New Jersey?
Top 10 Cities with the Lowest Poverty Level Among Seniors Over the Age of 75 in New Jersey are:
#1
0.14%
#2
0.32%
#3
0.37%
#4
0.95%
#5
1.1%
#6
1.2%
#7
1.4%
#8
1.4%
#9
1.7%
#10
1.7%
What city has the Lowest Poverty Level Among Seniors Over the Age of 75 in New Jersey?
Pomona has the Lowest Poverty Level Among Seniors Over the Age of 75 in New Jersey with 0.14%.
What is the Poverty Level Among Seniors Over the Age of 75 in the State of New Jersey?
Poverty Level Among Seniors Over the Age of 75 in New Jersey is 10.7%.
What is the Poverty Level Among Seniors Over the Age of 75 in the United States?
Poverty Level Among Seniors Over the Age of 75 in the United States is 11.1%.