Temelec, CA Map & Demographics
Temelec Map
Temelec Overview
$60,283
PER CAPITA INCOME
$96,346
AVG FAMILY INCOME
$66,773
AVG HOUSEHOLD INCOME
0.45
INEQUALITY / GINI INDEX
1,693
TOTAL POPULATION
690
MALE POPULATION
1,003
FEMALE POPULATION
68.79
MALES / 100 FEMALES
145.36
FEMALES / 100 MALES
74.1
MEDIAN AGE
2.2
AVG FAMILY SIZE
1.6
AVG HOUSEHOLD SIZE
521
LABOR FORCE [ PEOPLE ]
30.8%
PERCENT IN LABOR FORCE
20.3%
UNEMPLOYMENT RATE
Income in Temelec
Income Overview in Temelec
Per Capita Income in Temelec is $60,283, while median incomes of families and households are $96,346 and $66,773 respectively.
| Characteristic | Number | Measure |
| Per Capita Income | 1,693 | $60,283 |
| Median Family Income | 432 | $96,346 |
| Mean Family Income | 432 | $130,472 |
| Median Household Income | 1,043 | $66,773 |
| Mean Household Income | 1,043 | $92,963 |
| Income Deficit | 432 | $0 |
| Wage / Income Gap (%) | 1,693 | 0.00% |
| Wage / Income Gap ($) | 1,693 | 100.00¢ per $1 |
| Gini / Inequality Index | 1,693 | 0.45 |
Earnings by Sex in Temelec
| Sex | Number | Average Earnings |
| Male | 157 (32.3%) | $0 |
| Female | 329 (67.7%) | $0 |
| Total | 486 (100.0%) | $0 |
Earnings by Sex by Income Bracket in Temelec
The most common earnings brackets in Temelec are $100,000+ for men (32 | 20.4%) and $100,000+ for women (151 | 45.9%).
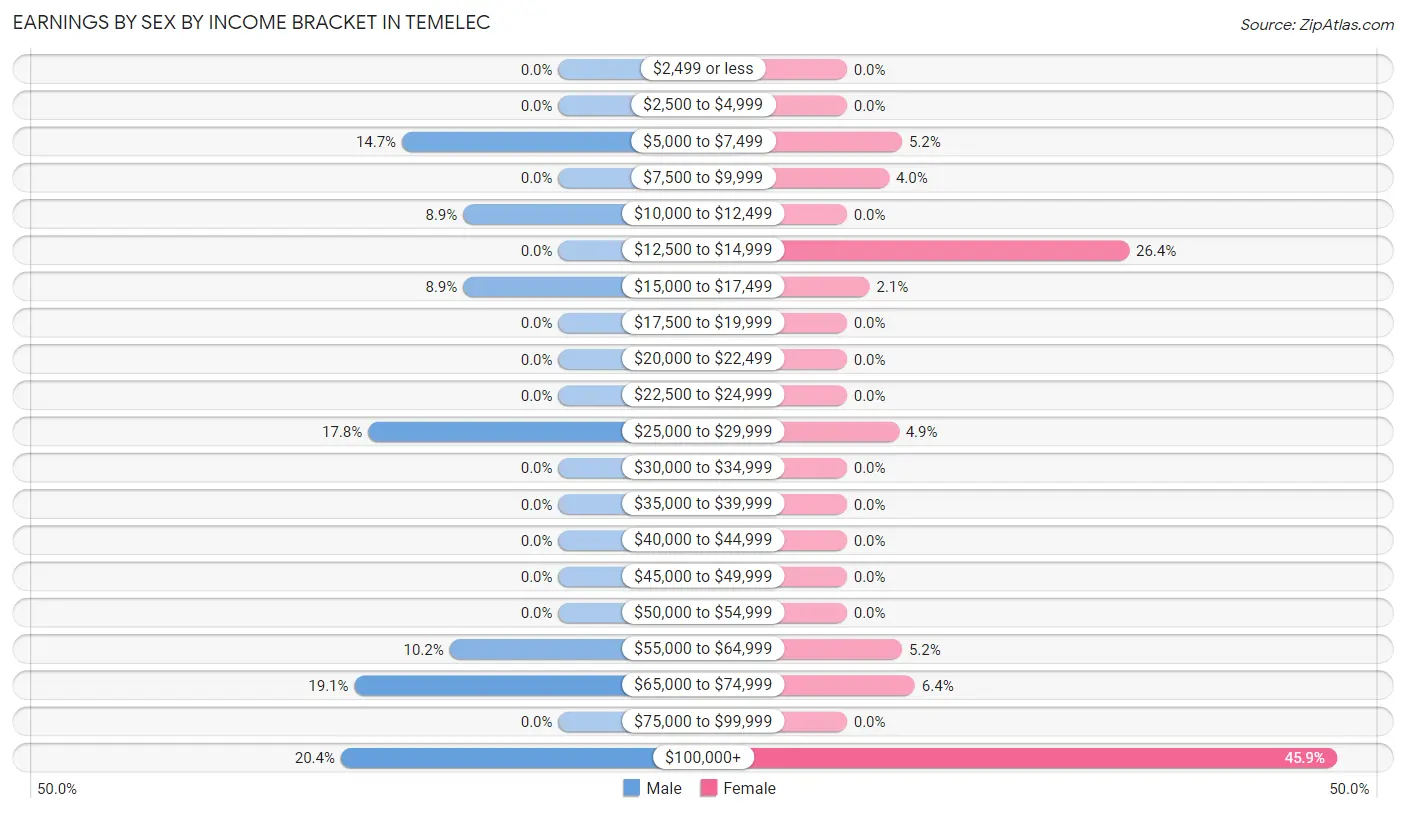
| Income | Male | Female |
| $2,499 or less | 0 (0.0%) | 0 (0.0%) |
| $2,500 to $4,999 | 0 (0.0%) | 0 (0.0%) |
| $5,000 to $7,499 | 23 (14.6%) | 17 (5.2%) |
| $7,500 to $9,999 | 0 (0.0%) | 13 (4.0%) |
| $10,000 to $12,499 | 14 (8.9%) | 0 (0.0%) |
| $12,500 to $14,999 | 0 (0.0%) | 87 (26.4%) |
| $15,000 to $17,499 | 14 (8.9%) | 7 (2.1%) |
| $17,500 to $19,999 | 0 (0.0%) | 0 (0.0%) |
| $20,000 to $22,499 | 0 (0.0%) | 0 (0.0%) |
| $22,500 to $24,999 | 0 (0.0%) | 0 (0.0%) |
| $25,000 to $29,999 | 28 (17.8%) | 16 (4.9%) |
| $30,000 to $34,999 | 0 (0.0%) | 0 (0.0%) |
| $35,000 to $39,999 | 0 (0.0%) | 0 (0.0%) |
| $40,000 to $44,999 | 0 (0.0%) | 0 (0.0%) |
| $45,000 to $49,999 | 0 (0.0%) | 0 (0.0%) |
| $50,000 to $54,999 | 0 (0.0%) | 0 (0.0%) |
| $55,000 to $64,999 | 16 (10.2%) | 17 (5.2%) |
| $65,000 to $74,999 | 30 (19.1%) | 21 (6.4%) |
| $75,000 to $99,999 | 0 (0.0%) | 0 (0.0%) |
| $100,000+ | 32 (20.4%) | 151 (45.9%) |
| Total | 157 (100.0%) | 329 (100.0%) |
Earnings by Sex by Educational Attainment in Temelec
| Educational Attainment | Male Income | Female Income |
| Less than High School | - | - |
| High School Diploma | - | - |
| College or Associate's Degree | - | - |
| Bachelor's Degree | - | - |
| Graduate Degree | - | - |
| Total | - | - |
Family Income in Temelec
Family Income Brackets in Temelec
According to the Temelec family income data, there are 144 families falling into the $35,000 to $49,999 income range, which is the most common income bracket and makes up 33.3% of all families.
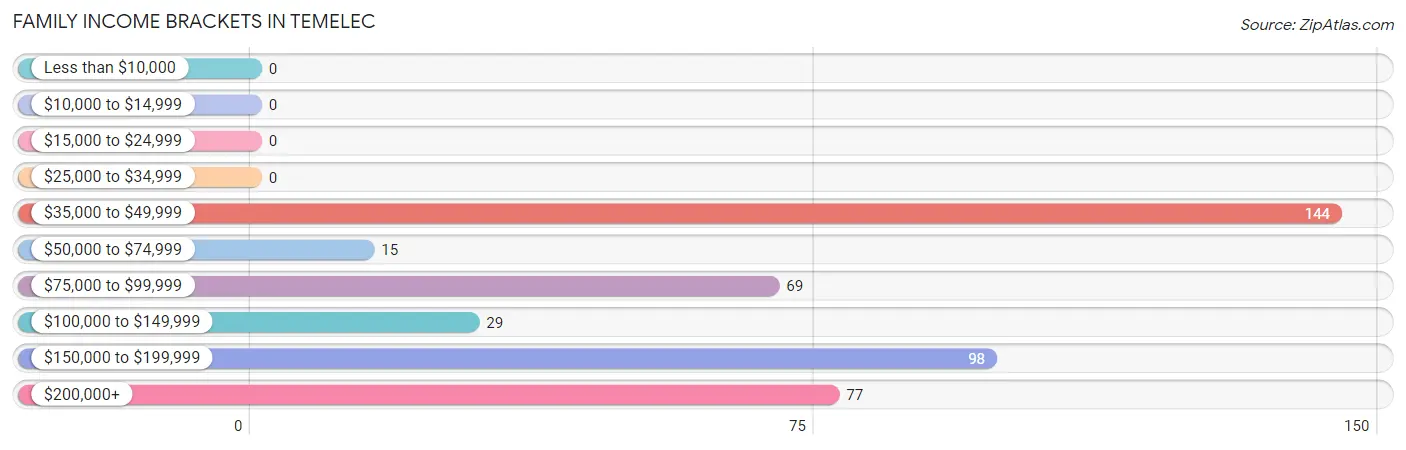
| Income Bracket | # Families | % Families |
| Less than $10,000 | 0 | 0.0% |
| $10,000 to $14,999 | 0 | 0.0% |
| $15,000 to $24,999 | 0 | 0.0% |
| $25,000 to $34,999 | 0 | 0.0% |
| $35,000 to $49,999 | 144 | 33.3% |
| $50,000 to $74,999 | 15 | 3.5% |
| $75,000 to $99,999 | 69 | 16.0% |
| $100,000 to $149,999 | 29 | 6.7% |
| $150,000 to $199,999 | 98 | 22.7% |
| $200,000+ | 77 | 17.8% |
Family Income by Famaliy Size in Temelec
2-person families (414 | 95.8%) account for the highest median family income in Temelec with $95,481 per family, while 2-person families (414 | 95.8%) have the highest median income of $47,740 per family member.
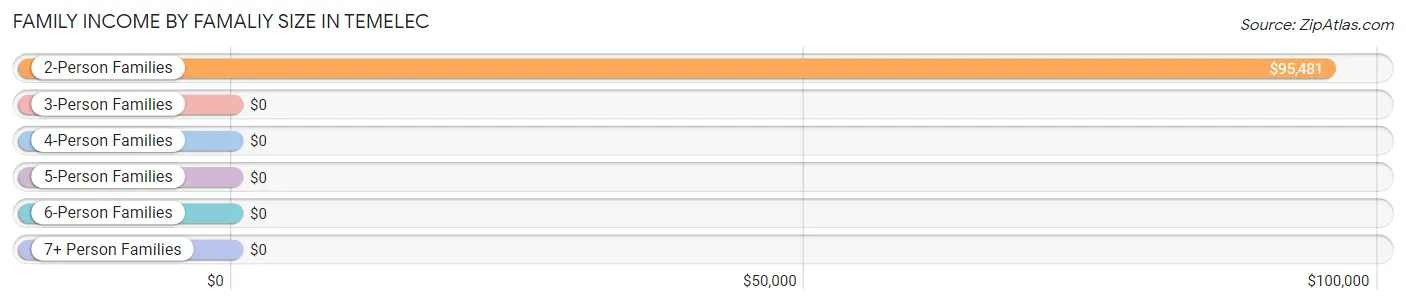
| Income Bracket | # Families | Median Income |
| 2-Person Families | 414 (95.8%) | $95,481 |
| 3-Person Families | 0 (0.0%) | $0 |
| 4-Person Families | 18 (4.2%) | $0 |
| 5-Person Families | 0 (0.0%) | $0 |
| 6-Person Families | 0 (0.0%) | $0 |
| 7+ Person Families | 0 (0.0%) | $0 |
| Total | 432 (100.0%) | $96,346 |
Family Income by Number of Earners in Temelec
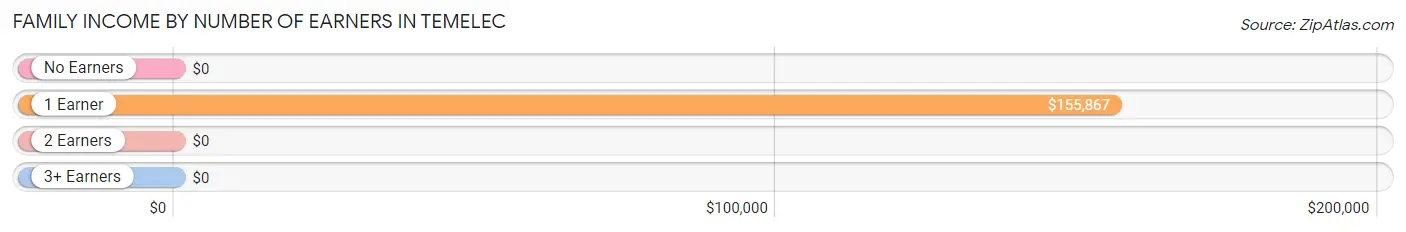
| Number of Earners | # Families | Median Income |
| No Earners | 224 (51.8%) | $0 |
| 1 Earner | 190 (44.0%) | $155,867 |
| 2 Earners | 0 (0.0%) | $0 |
| 3+ Earners | 18 (4.2%) | $0 |
| Total | 432 (100.0%) | $96,346 |
Household Income in Temelec
Household Income Brackets in Temelec
With 254 households falling in the category, the $35,000 to $49,999 income range is the most frequent in Temelec, accounting for 24.3% of all households.
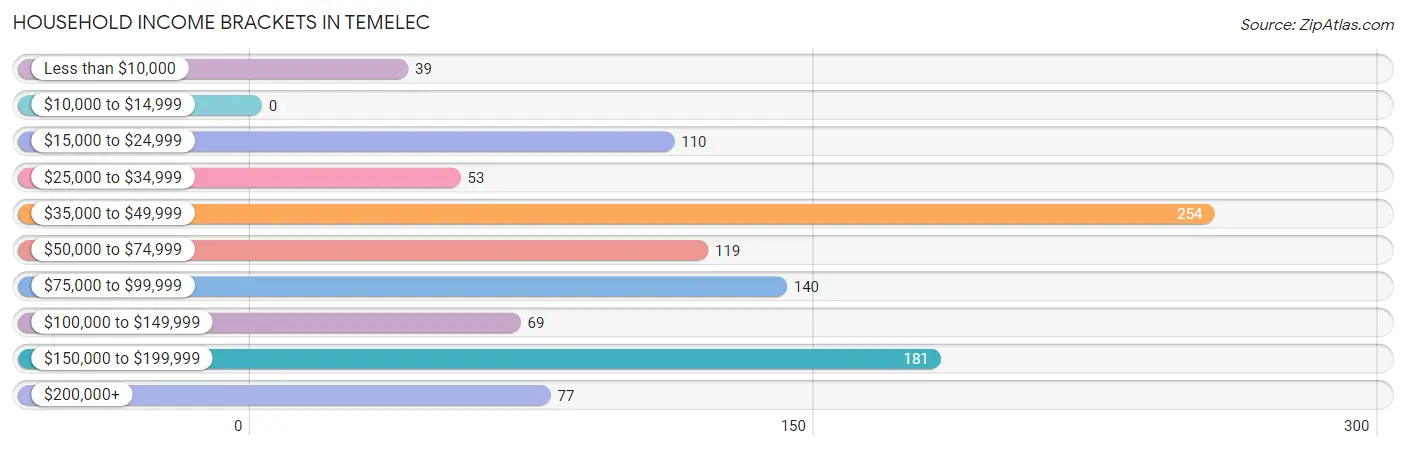
| Income Bracket | # Households | % Households |
| Less than $10,000 | 39 | 3.7% |
| $10,000 to $14,999 | 0 | 0.0% |
| $15,000 to $24,999 | 110 | 10.5% |
| $25,000 to $34,999 | 53 | 5.1% |
| $35,000 to $49,999 | 254 | 24.4% |
| $50,000 to $74,999 | 119 | 11.4% |
| $75,000 to $99,999 | 140 | 13.4% |
| $100,000 to $149,999 | 69 | 6.6% |
| $150,000 to $199,999 | 181 | 17.4% |
| $200,000+ | 77 | 7.4% |
Household Income by Householder Age in Temelec
The median household income in Temelec is $66,773, with the highest median household income of $65,378 found in the 65+ years age bracket for the primary householder. A total of 995 households (95.4%) fall into this category.
| Income Bracket | # Households | Median Income |
| 15 to 24 Years | 0 (0.0%) | $0 |
| 25 to 44 Years | 0 (0.0%) | $0 |
| 45 to 64 Years | 48 (4.6%) | $0 |
| 65+ Years | 995 (95.4%) | $65,378 |
| Total | 1,043 (100.0%) | $66,773 |
Poverty in Temelec
Income Below Poverty by Sex and Age in Temelec
With 1.9% poverty level for males and 2.6% for females among the residents of Temelec, 65 to 74 year old males and 75 year old and over females are the most vulnerable to poverty, with 13 males (4.3%) and 26 females (6.3%) in their respective age groups living below the poverty level.
| Age Bracket | Male | Female |
| Under 5 Years | 0 (0.0%) | 0 (0.0%) |
| 5 Years | 0 (0.0%) | 0 (0.0%) |
| 6 to 11 Years | 0 (0.0%) | 0 (0.0%) |
| 12 to 14 Years | 0 (0.0%) | 0 (0.0%) |
| 15 Years | 0 (0.0%) | 0 (0.0%) |
| 16 and 17 Years | 0 (0.0%) | 0 (0.0%) |
| 18 to 24 Years | 0 (0.0%) | 0 (0.0%) |
| 25 to 34 Years | 0 (0.0%) | 0 (0.0%) |
| 35 to 44 Years | 0 (0.0%) | 0 (0.0%) |
| 45 to 54 Years | 0 (0.0%) | 0 (0.0%) |
| 55 to 64 Years | 0 (0.0%) | 0 (0.0%) |
| 65 to 74 Years | 13 (4.3%) | 0 (0.0%) |
| 75 Years and over | 0 (0.0%) | 26 (6.3%) |
| Total | 13 (1.9%) | 26 (2.6%) |
Income Above Poverty by Sex and Age in Temelec
According to the poverty statistics in Temelec, males aged 55 to 64 years and females aged 55 to 64 years are the age groups that are most secure financially, with 100.0% of males and 100.0% of females in these age groups living above the poverty line.
| Age Bracket | Male | Female |
| Under 5 Years | 0 (0.0%) | 0 (0.0%) |
| 5 Years | 0 (0.0%) | 0 (0.0%) |
| 6 to 11 Years | 0 (0.0%) | 0 (0.0%) |
| 12 to 14 Years | 0 (0.0%) | 0 (0.0%) |
| 15 Years | 0 (0.0%) | 0 (0.0%) |
| 16 and 17 Years | 0 (0.0%) | 0 (0.0%) |
| 18 to 24 Years | 0 (0.0%) | 0 (0.0%) |
| 25 to 34 Years | 0 (0.0%) | 0 (0.0%) |
| 35 to 44 Years | 0 (0.0%) | 0 (0.0%) |
| 45 to 54 Years | 0 (0.0%) | 0 (0.0%) |
| 55 to 64 Years | 36 (100.0%) | 238 (100.0%) |
| 65 to 74 Years | 291 (95.7%) | 350 (100.0%) |
| 75 Years and over | 350 (100.0%) | 389 (93.7%) |
| Total | 677 (98.1%) | 977 (97.4%) |
Income Below Poverty Among Married-Couple Families in Temelec
| Children | Above Poverty | Below Poverty |
| No Children | 432 (100.0%) | 0 (0.0%) |
| 1 or 2 Children | 0 (0.0%) | 0 (0.0%) |
| 3 or 4 Children | 0 (0.0%) | 0 (0.0%) |
| 5 or more Children | 0 (0.0%) | 0 (0.0%) |
| Total | 432 (100.0%) | 0 (0.0%) |
Income Below Poverty Among Single-Parent Households in Temelec
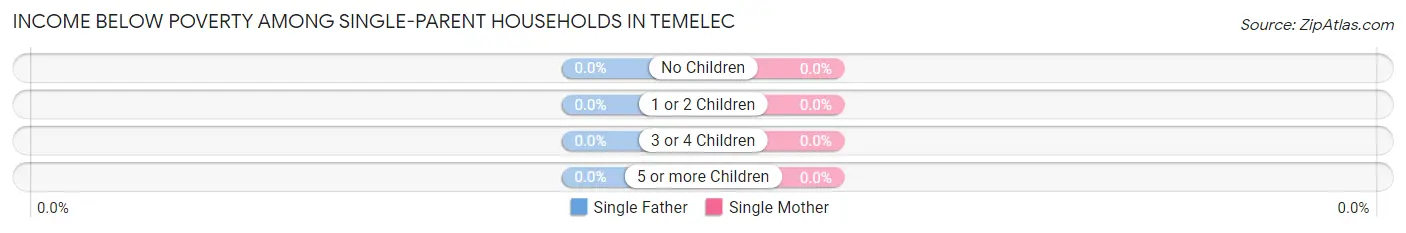
| Children | Single Father | Single Mother |
| No Children | 0 (0.0%) | 0 (0.0%) |
| 1 or 2 Children | 0 (0.0%) | 0 (0.0%) |
| 3 or 4 Children | 0 (0.0%) | 0 (0.0%) |
| 5 or more Children | 0 (0.0%) | 0 (0.0%) |
| Total | 0 (0.0%) | 0 (0.0%) |
Income Below Poverty Among Married-Couple vs Single-Parent Households in Temelec
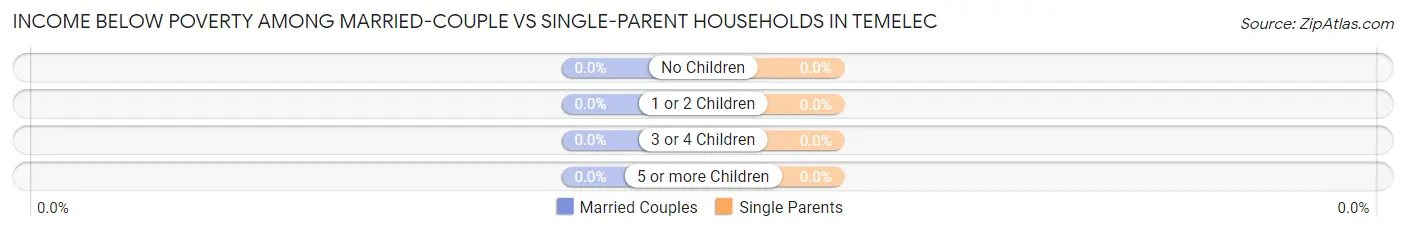
| Children | Married-Couple Families | Single-Parent Households |
| No Children | 0 (0.0%) | 0 (0.0%) |
| 1 or 2 Children | 0 (0.0%) | 0 (0.0%) |
| 3 or 4 Children | 0 (0.0%) | 0 (0.0%) |
| 5 or more Children | 0 (0.0%) | 0 (0.0%) |
| Total | 0 (0.0%) | 0 (0.0%) |
Race in Temelec
The most populous races in Temelec are White / Caucasian (1,554 | 91.8%), Hispanic or Latino (84 | 5.0%), and Two or more Races (75 | 4.4%).
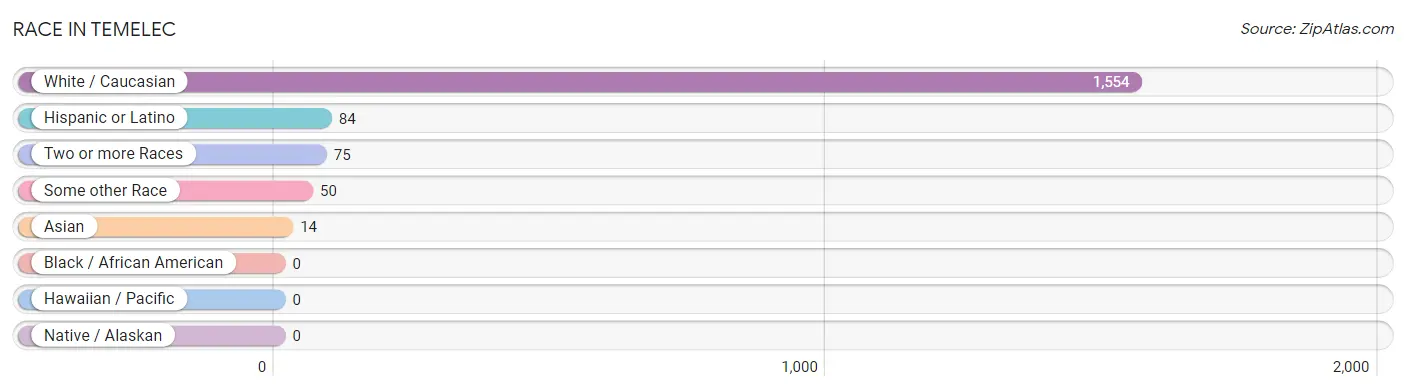
| Race | # Population | % Population |
| Asian | 14 | 0.8% |
| Black / African American | 0 | 0.0% |
| Hawaiian / Pacific | 0 | 0.0% |
| Hispanic or Latino | 84 | 5.0% |
| Native / Alaskan | 0 | 0.0% |
| White / Caucasian | 1,554 | 91.8% |
| Two or more Races | 75 | 4.4% |
| Some other Race | 50 | 2.9% |
| Total | 1,693 | 100.0% |
Ancestry in Temelec
The most populous ancestries reported in Temelec are German (480 | 28.3%), French (244 | 14.4%), Irish (241 | 14.2%), English (228 | 13.5%), and British (162 | 9.6%), together accounting for 80.0% of all Temelec residents.
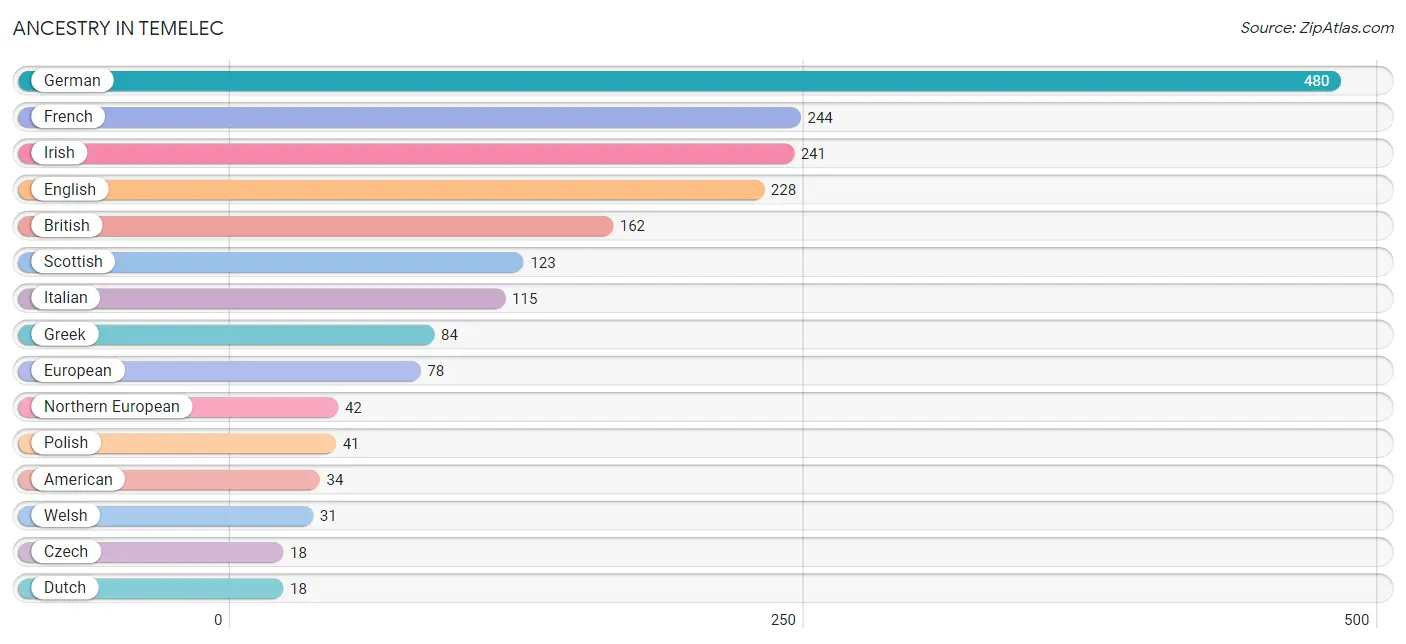
| Ancestry | # Population | % Population |
| American | 34 | 2.0% |
| Bhutanese | 14 | 0.8% |
| British | 162 | 9.6% |
| Cherokee | 13 | 0.8% |
| Czech | 18 | 1.1% |
| Danish | 15 | 0.9% |
| Dutch | 18 | 1.1% |
| English | 228 | 13.5% |
| European | 78 | 4.6% |
| French | 244 | 14.4% |
| German | 480 | 28.3% |
| Greek | 84 | 5.0% |
| Hungarian | 11 | 0.6% |
| Irish | 241 | 14.2% |
| Italian | 115 | 6.8% |
| Lithuanian | 16 | 0.9% |
| Mexican | 17 | 1.0% |
| Northern European | 42 | 2.5% |
| Norwegian | 14 | 0.8% |
| Polish | 41 | 2.4% |
| Portuguese | 15 | 0.9% |
| Scottish | 123 | 7.3% |
| Swedish | 14 | 0.8% |
| Swiss | 18 | 1.1% |
| Ukrainian | 16 | 0.9% |
| Welsh | 31 | 1.8% | View All 26 Rows |
Immigrants in Temelec
The most numerous immigrant groups reported in Temelec came from Europe (93 | 5.5%), Germany (39 | 2.3%), Western Europe (39 | 2.3%), Eastern Europe (29 | 1.7%), and England (25 | 1.5%), together accounting for 13.3% of all Temelec residents.
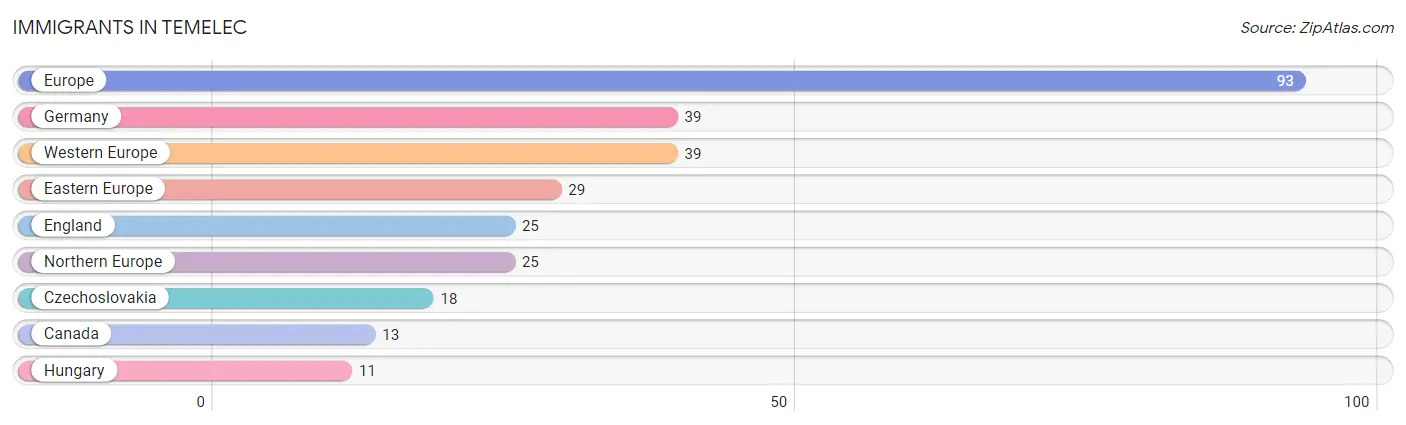
| Immigration Origin | # Population | % Population |
| Canada | 13 | 0.8% |
| Czechoslovakia | 18 | 1.1% |
| Eastern Europe | 29 | 1.7% |
| England | 25 | 1.5% |
| Europe | 93 | 5.5% |
| Germany | 39 | 2.3% |
| Hungary | 11 | 0.6% |
| Northern Europe | 25 | 1.5% |
| Western Europe | 39 | 2.3% | View All 9 Rows |
Sex and Age in Temelec
Sex and Age in Temelec
The most populous age groups in Temelec are 85 Years and over (223 | 32.3%) for men and 85 Years and over (196 | 19.5%) for women.
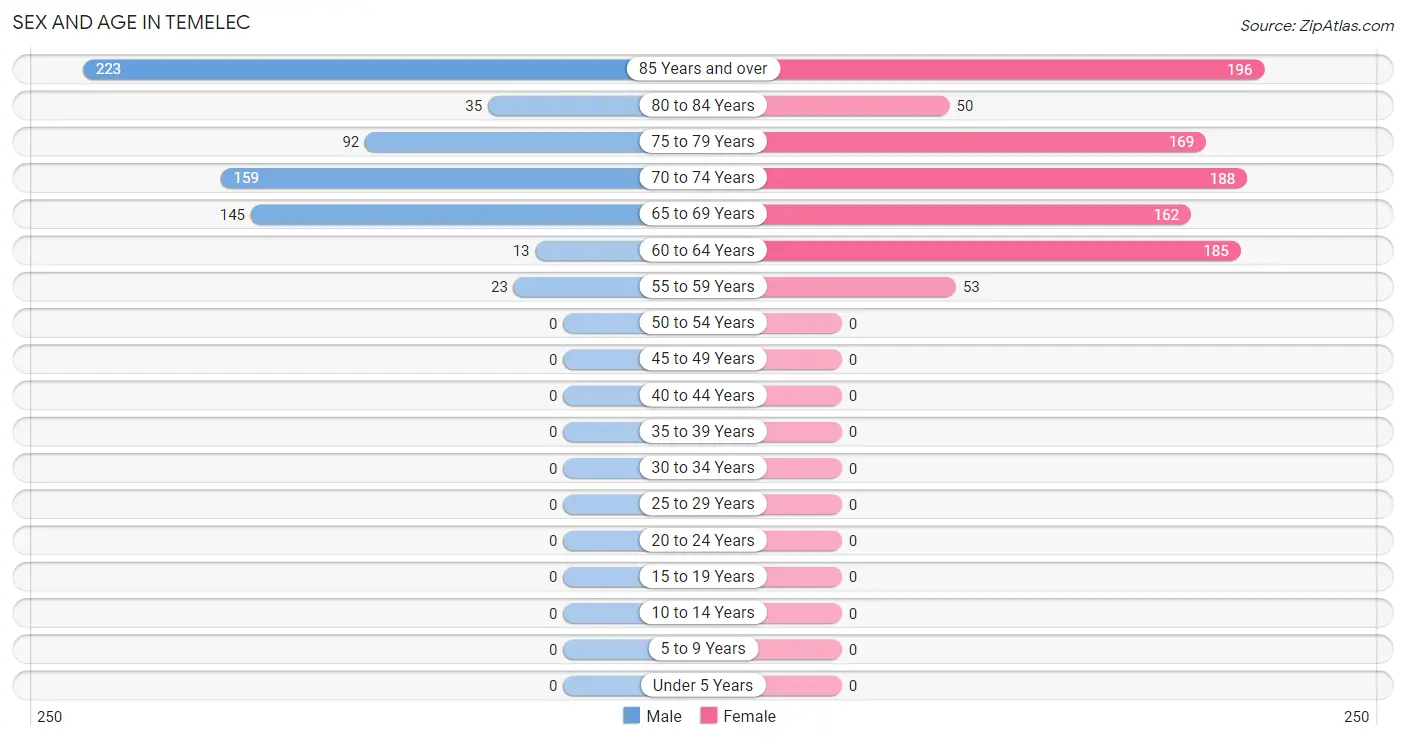
| Age Bracket | Male | Female |
| Under 5 Years | 0 (0.0%) | 0 (0.0%) |
| 5 to 9 Years | 0 (0.0%) | 0 (0.0%) |
| 10 to 14 Years | 0 (0.0%) | 0 (0.0%) |
| 15 to 19 Years | 0 (0.0%) | 0 (0.0%) |
| 20 to 24 Years | 0 (0.0%) | 0 (0.0%) |
| 25 to 29 Years | 0 (0.0%) | 0 (0.0%) |
| 30 to 34 Years | 0 (0.0%) | 0 (0.0%) |
| 35 to 39 Years | 0 (0.0%) | 0 (0.0%) |
| 40 to 44 Years | 0 (0.0%) | 0 (0.0%) |
| 45 to 49 Years | 0 (0.0%) | 0 (0.0%) |
| 50 to 54 Years | 0 (0.0%) | 0 (0.0%) |
| 55 to 59 Years | 23 (3.3%) | 53 (5.3%) |
| 60 to 64 Years | 13 (1.9%) | 185 (18.4%) |
| 65 to 69 Years | 145 (21.0%) | 162 (16.2%) |
| 70 to 74 Years | 159 (23.0%) | 188 (18.7%) |
| 75 to 79 Years | 92 (13.3%) | 169 (16.9%) |
| 80 to 84 Years | 35 (5.1%) | 50 (5.0%) |
| 85 Years and over | 223 (32.3%) | 196 (19.5%) |
| Total | 690 (100.0%) | 1,003 (100.0%) |
Families and Households in Temelec
Median Family Size in Temelec
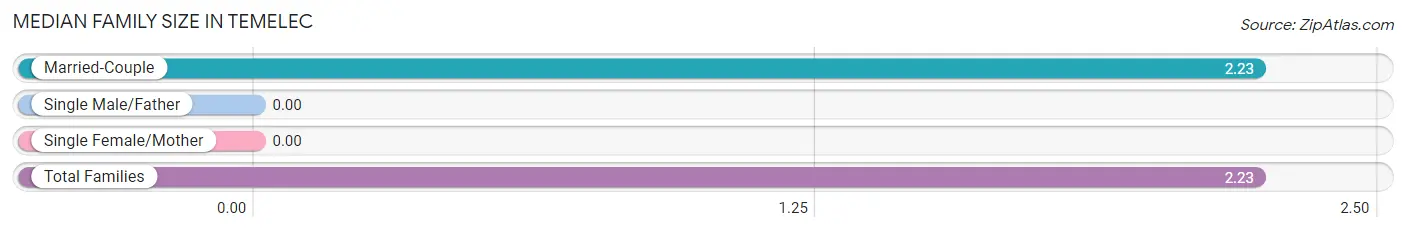
| Family Type | # Families | Family Size |
| Married-Couple | 432 (100.0%) | 2.23 |
| Single Male/Father | 0 (0.0%) | - |
| Single Female/Mother | 0 (0.0%) | - |
| Total Families | 432 (100.0%) | 2.23 |
Median Household Size in Temelec
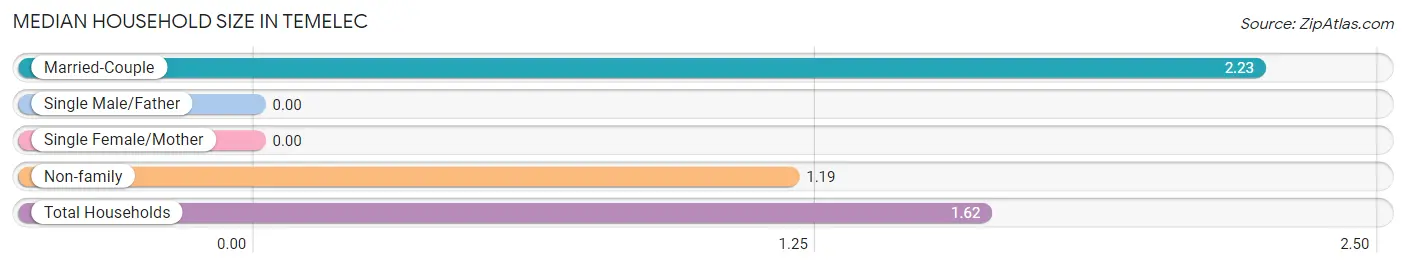
| Household Type | # Households | Household Size |
| Married-Couple | 432 (41.4%) | 2.23 |
| Single Male/Father | 0 (0.0%) | - |
| Single Female/Mother | 0 (0.0%) | - |
| Non-family | 611 (58.6%) | 1.19 |
| Total Households | 1,043 (100.0%) | 1.62 |
Household Size by Marriage Status in Temelec
Out of a total of 1,043 households in Temelec, 432 (41.4%) are family households, while 611 (58.6%) are nonfamily households. The most numerous type of family households are 2-person households, comprising 414, and the most common type of nonfamily households are 1-person households, comprising 505.
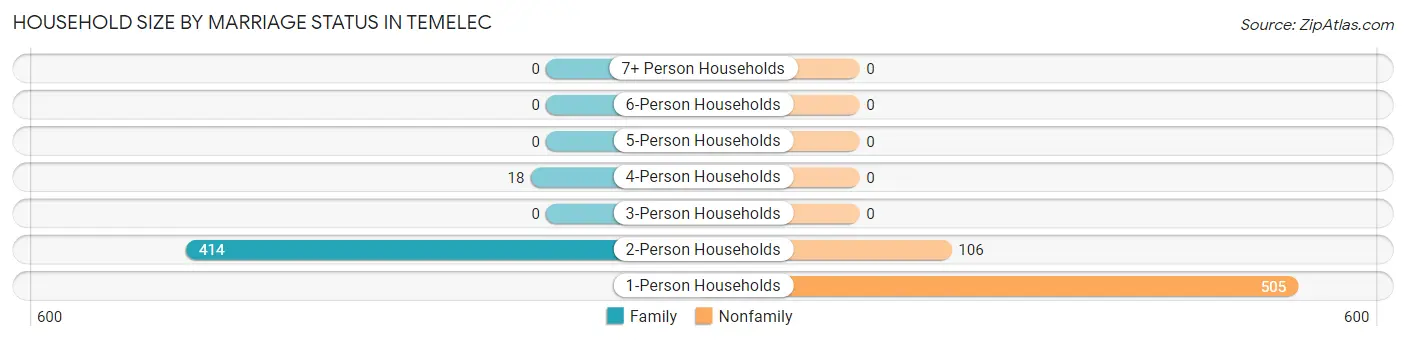
| Household Size | Family Households | Nonfamily Households |
| 1-Person Households | - | 505 (48.4%) |
| 2-Person Households | 414 (39.7%) | 106 (10.2%) |
| 3-Person Households | 0 (0.0%) | 0 (0.0%) |
| 4-Person Households | 18 (1.7%) | 0 (0.0%) |
| 5-Person Households | 0 (0.0%) | 0 (0.0%) |
| 6-Person Households | 0 (0.0%) | 0 (0.0%) |
| 7+ Person Households | 0 (0.0%) | 0 (0.0%) |
| Total | 432 (41.4%) | 611 (58.6%) |
Female Fertility in Temelec
Fertility by Age in Temelec
| Age Bracket | Women with Births | Births / 1,000 Women |
| 15 to 19 years | 0 (0.0%) | 0.0 |
| 20 to 34 years | 0 (0.0%) | 0.0 |
| 35 to 50 years | 0 (0.0%) | 0.0 |
| Total | 0 (0.0%) | 0.0 |
Fertility by Age by Marriage Status in Temelec
| Age Bracket | Married | Unmarried |
| 15 to 19 years | 0 (0.0%) | 0 (0.0%) |
| 20 to 34 years | 0 (0.0%) | 0 (0.0%) |
| 35 to 50 years | 0 (0.0%) | 0 (0.0%) |
| Total | 0 (0.0%) | 0 (0.0%) |
Fertility by Education in Temelec
| Educational Attainment | Women with Births | Births / 1,000 Women |
| Less than High School | 0 (0.0%) | 0.0 |
| High School Diploma | 0 (0.0%) | 0.0 |
| College or Associate's Degree | 0 (0.0%) | 0.0 |
| Bachelor's Degree | 0 (0.0%) | 0.0 |
| Graduate Degree | 0 (0.0%) | 0.0 |
| Total | 0 (0.0%) | 0.0 |
Fertility by Education by Marriage Status in Temelec
| Educational Attainment | Married | Unmarried |
| Less than High School | 0 (0.0%) | 0 (0.0%) |
| High School Diploma | 0 (0.0%) | 0 (0.0%) |
| College or Associate's Degree | 0 (0.0%) | 0 (0.0%) |
| Bachelor's Degree | 0 (0.0%) | 0 (0.0%) |
| Graduate Degree | 0 (0.0%) | 0 (0.0%) |
| Total | 0 (0.0%) | 0 (0.0%) |
Employment Characteristics in Temelec
Employment by Class of Employer in Temelec
Among the 416 employed individuals in Temelec, private company employees (145 | 34.9%), not-for-profit organizations (138 | 33.2%), and self-employed (not incorporated) (85 | 20.4%) make up the most common classes of employment.
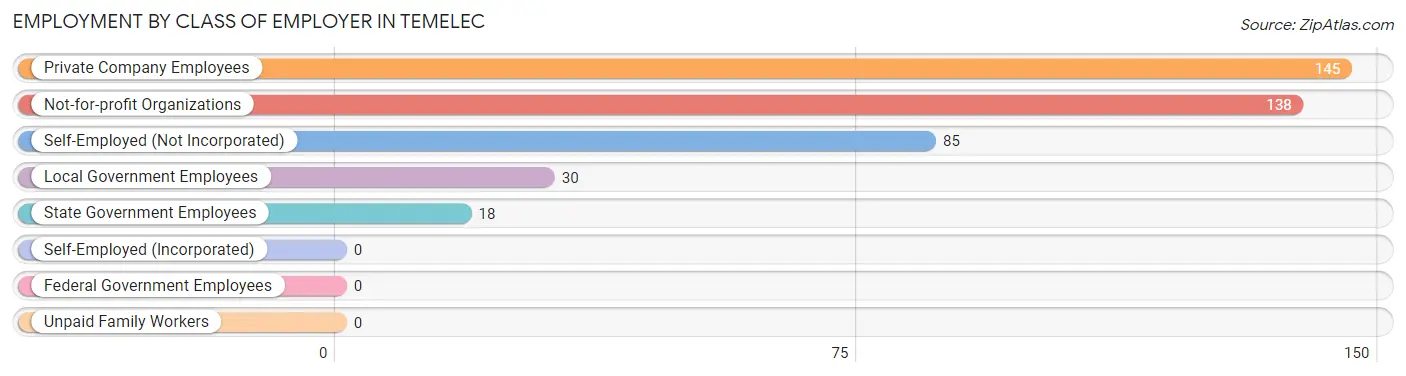
| Employer Class | # Employees | % Employees |
| Private Company Employees | 145 | 34.9% |
| Self-Employed (Incorporated) | 0 | 0.0% |
| Self-Employed (Not Incorporated) | 85 | 20.4% |
| Not-for-profit Organizations | 138 | 33.2% |
| Local Government Employees | 30 | 7.2% |
| State Government Employees | 18 | 4.3% |
| Federal Government Employees | 0 | 0.0% |
| Unpaid Family Workers | 0 | 0.0% |
| Total | 416 | 100.0% |
Employment Status by Age in Temelec
According to the labor force statistics for Temelec, out of the total population over 16 years of age (1,693), 30.8% or 521 individuals are in the labor force, with 20.3% or 106 of them unemployed. The age group with the highest labor force participation rate is 60 to 64 years, with 100.0% or 198 individuals in the labor force. Within the labor force, the 60 to 64 years age range has the highest percentage of unemployed individuals, with 31.8% or 63 of them being unemployed.
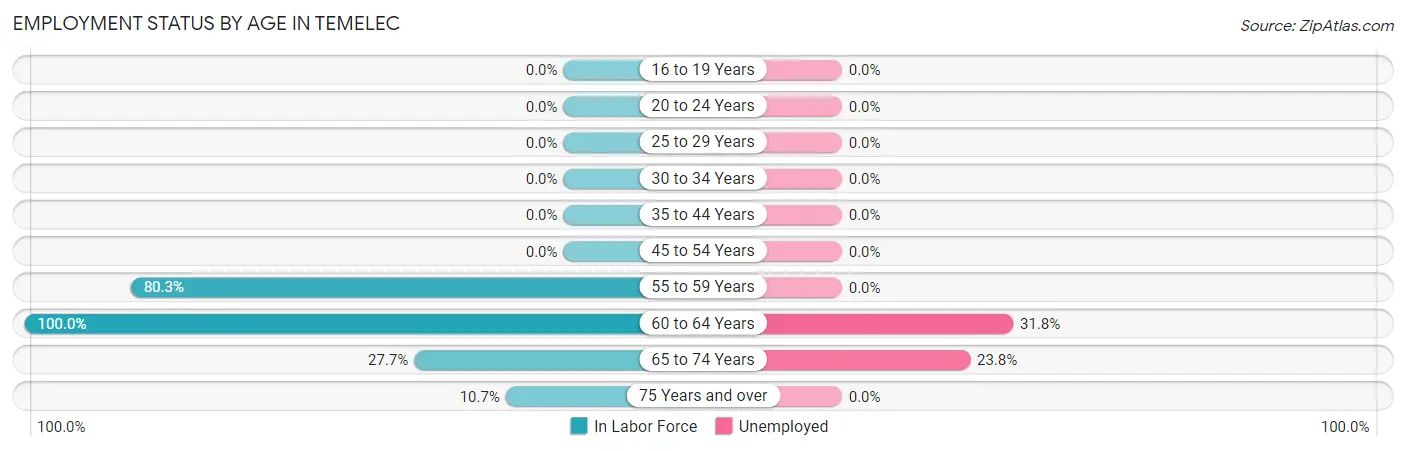
| Age Bracket | In Labor Force | Unemployed |
| 16 to 19 Years | 0 (0.0%) | 0 (0.0%) |
| 20 to 24 Years | 0 (0.0%) | 0 (0.0%) |
| 25 to 29 Years | 0 (0.0%) | 0 (0.0%) |
| 30 to 34 Years | 0 (0.0%) | 0 (0.0%) |
| 35 to 44 Years | 0 (0.0%) | 0 (0.0%) |
| 45 to 54 Years | 0 (0.0%) | 0 (0.0%) |
| 55 to 59 Years | 61 (80.3%) | 0 (0.0%) |
| 60 to 64 Years | 198 (100.0%) | 63 (31.8%) |
| 65 to 74 Years | 181 (27.7%) | 43 (23.8%) |
| 75 Years and over | 82 (10.7%) | 0 (0.0%) |
| Total | 521 (30.8%) | 106 (20.3%) |
Employment Status by Educational Attainment in Temelec
According to labor force statistics for Temelec, 94.5% of individuals (259) out of the total population between 25 and 64 years of age (274) are in the labor force, with 24.3% or 63 of them being unemployed. The group with the highest labor force participation rate are those with the educational attainment of high school diploma, with 100.0% or 23 individuals in the labor force. Within the labor force, individuals with bachelor's degree or higher education have the highest percentage of unemployment, with 32.0% or 63 of them being unemployed.
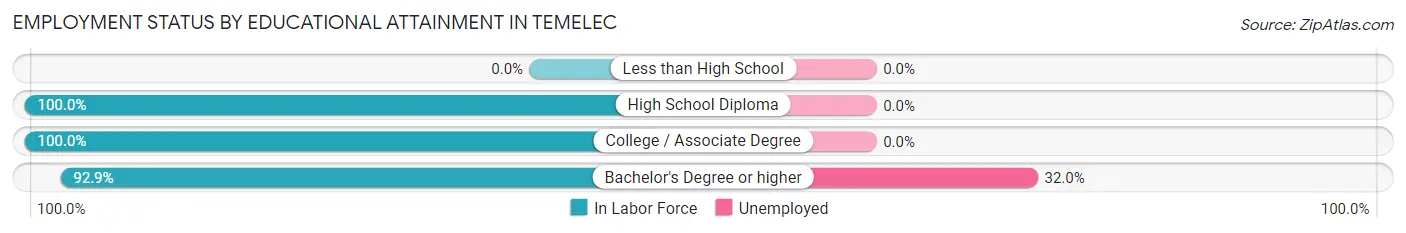
| Educational Attainment | In Labor Force | Unemployed |
| Less than High School | 0 (0.0%) | 0 (0.0%) |
| High School Diploma | 23 (100.0%) | 0 (0.0%) |
| College / Associate Degree | 39 (100.0%) | 0 (0.0%) |
| Bachelor's Degree or higher | 197 (92.9%) | 68 (32.0%) |
| Total | 259 (94.5%) | 67 (24.3%) |
Employment Occupations by Sex in Temelec
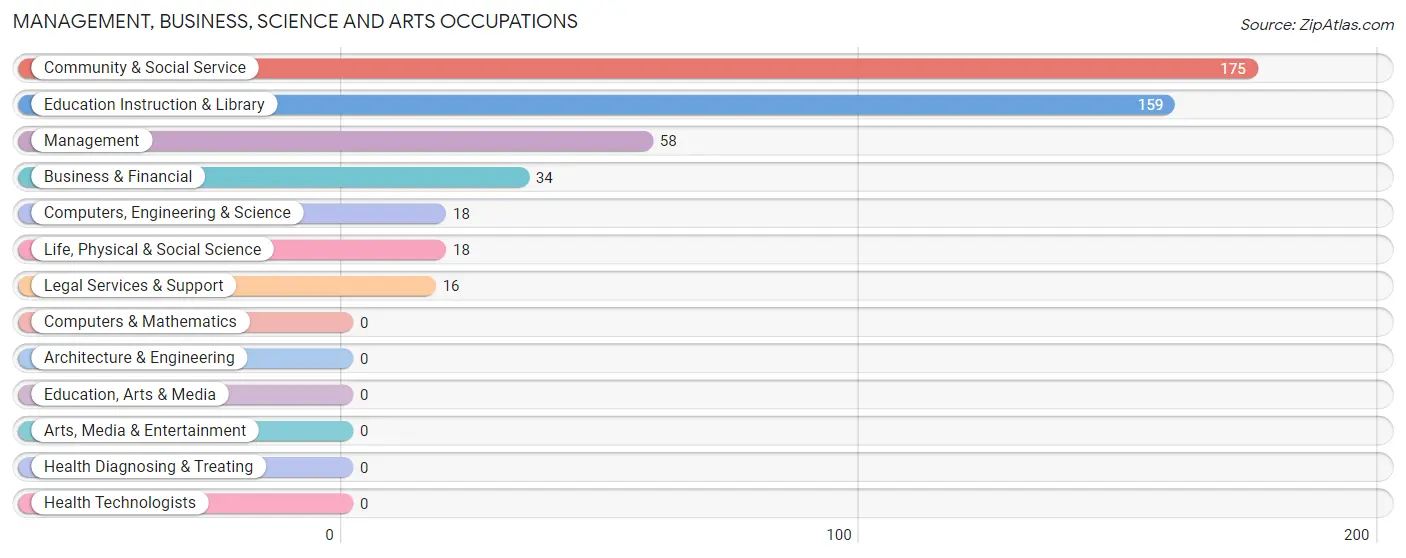
Management, Business, Science and Arts Occupations
The most common Management, Business, Science and Arts occupations in Temelec are Community & Social Service (175 | 42.1%), Education Instruction & Library (159 | 38.2%), Management (58 | 13.9%), Business & Financial (34 | 8.2%), and Computers, Engineering & Science (18 | 4.3%).
Management, Business, Science and Arts Occupations by Sex
Within the Management, Business, Science and Arts occupations in Temelec, the most male-oriented occupations are Computers, Engineering & Science (100.0%), Life, Physical & Social Science (100.0%), and Management (63.8%), while the most female-oriented occupations are Business & Financial (100.0%), Legal Services & Support (100.0%), and Community & Social Service (83.4%).
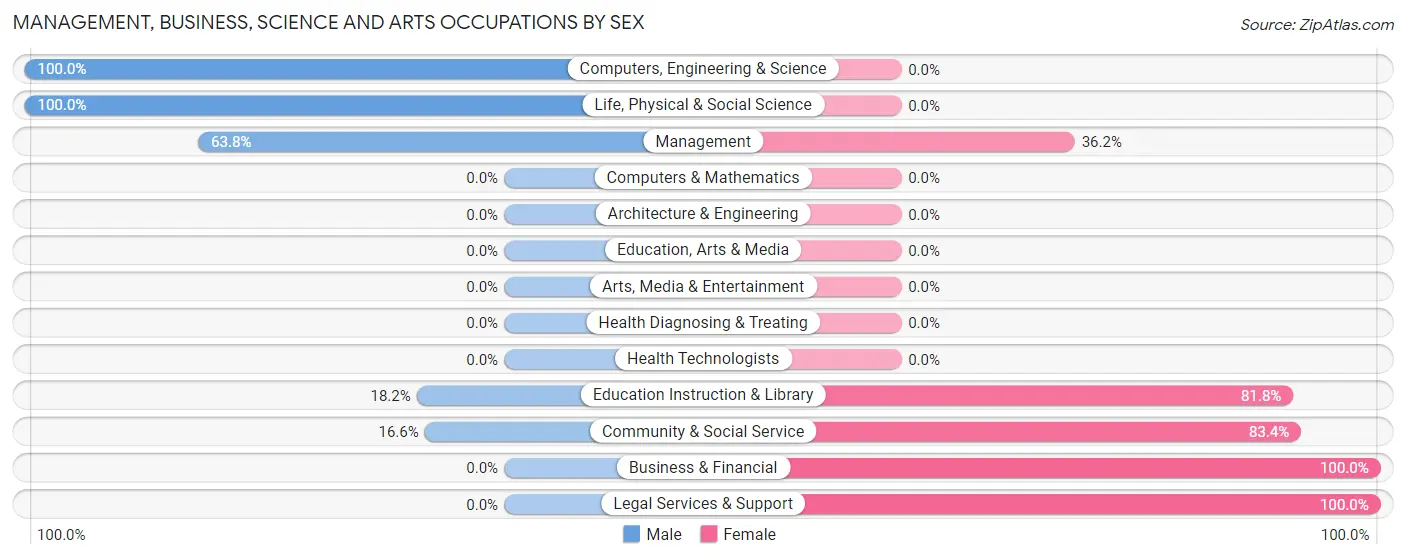
| Occupation | Male | Female |
| Management | 37 (63.8%) | 21 (36.2%) |
| Business & Financial | 0 (0.0%) | 34 (100.0%) |
| Computers, Engineering & Science | 18 (100.0%) | 0 (0.0%) |
| Computers & Mathematics | 0 (0.0%) | 0 (0.0%) |
| Architecture & Engineering | 0 (0.0%) | 0 (0.0%) |
| Life, Physical & Social Science | 18 (100.0%) | 0 (0.0%) |
| Community & Social Service | 29 (16.6%) | 146 (83.4%) |
| Education, Arts & Media | 0 (0.0%) | 0 (0.0%) |
| Legal Services & Support | 0 (0.0%) | 16 (100.0%) |
| Education Instruction & Library | 29 (18.2%) | 130 (81.8%) |
| Arts, Media & Entertainment | 0 (0.0%) | 0 (0.0%) |
| Health Diagnosing & Treating | 0 (0.0%) | 0 (0.0%) |
| Health Technologists | 0 (0.0%) | 0 (0.0%) |
| Total (Category) | 84 (29.5%) | 201 (70.5%) |
| Total (Overall) | 131 (31.5%) | 285 (68.5%) |
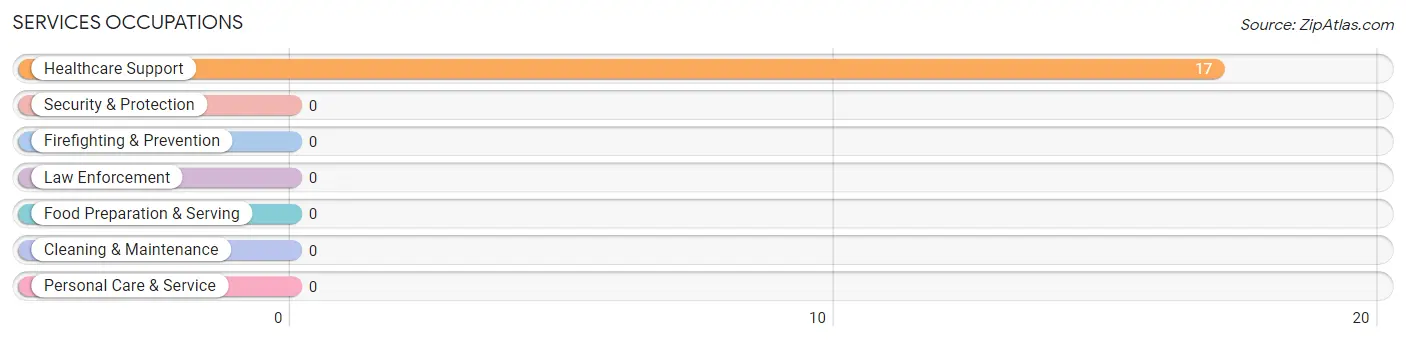
Services Occupations
The most common Services occupations in Temelec are , and Healthcare Support (17 | 4.1%).
Services Occupations by Sex
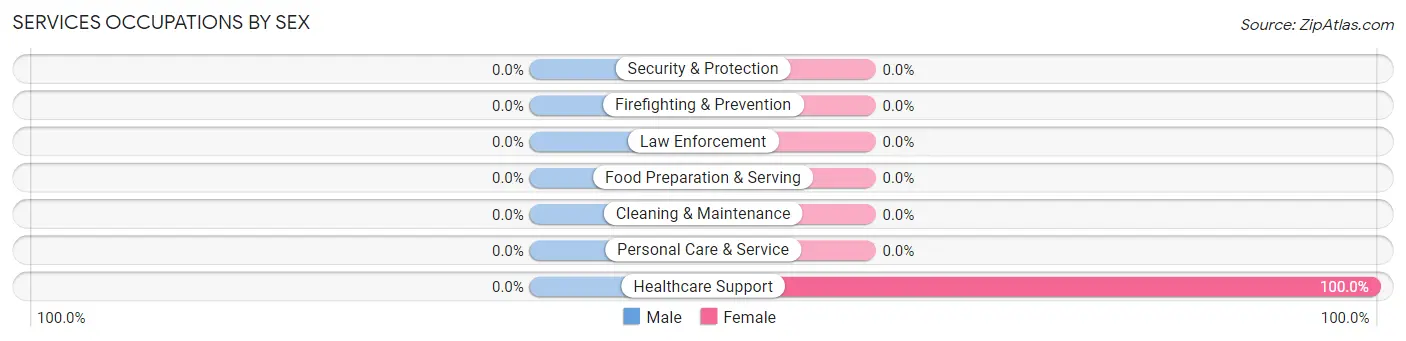
| Occupation | Male | Female |
| Healthcare Support | 0 (0.0%) | 17 (100.0%) |
| Security & Protection | 0 (0.0%) | 0 (0.0%) |
| Firefighting & Prevention | 0 (0.0%) | 0 (0.0%) |
| Law Enforcement | 0 (0.0%) | 0 (0.0%) |
| Food Preparation & Serving | 0 (0.0%) | 0 (0.0%) |
| Cleaning & Maintenance | 0 (0.0%) | 0 (0.0%) |
| Personal Care & Service | 0 (0.0%) | 0 (0.0%) |
| Total (Category) | 0 (0.0%) | 17 (100.0%) |
| Total (Overall) | 131 (31.5%) | 285 (68.5%) |
Sales and Office Occupations
The most common Sales and Office occupations in Temelec are Sales & Related (48 | 11.5%), and Office & Administration (35 | 8.4%).
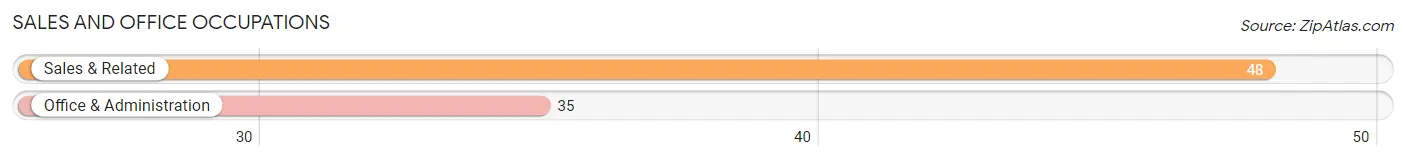
Sales and Office Occupations by Sex
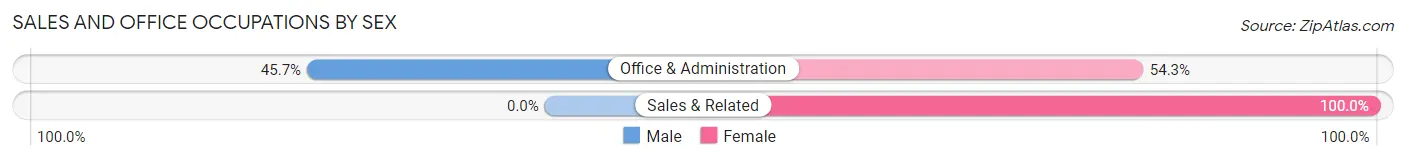
| Occupation | Male | Female |
| Sales & Related | 0 (0.0%) | 48 (100.0%) |
| Office & Administration | 16 (45.7%) | 19 (54.3%) |
| Total (Category) | 16 (19.3%) | 67 (80.7%) |
| Total (Overall) | 131 (31.5%) | 285 (68.5%) |
Natural Resources, Construction and Maintenance Occupations
The most common Natural Resources, Construction and Maintenance occupations in Temelec are , and Construction & Extraction (31 | 7.4%).
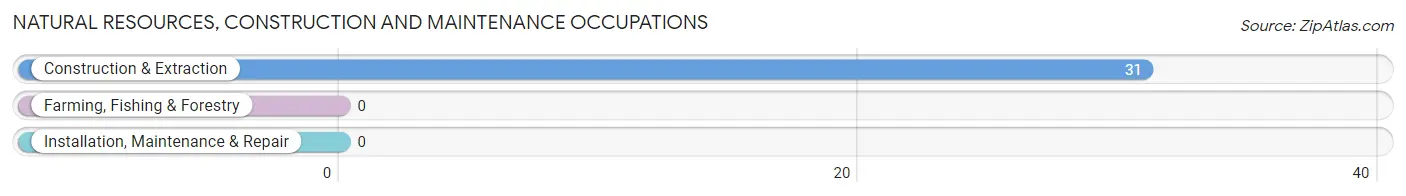
Natural Resources, Construction and Maintenance Occupations by Sex
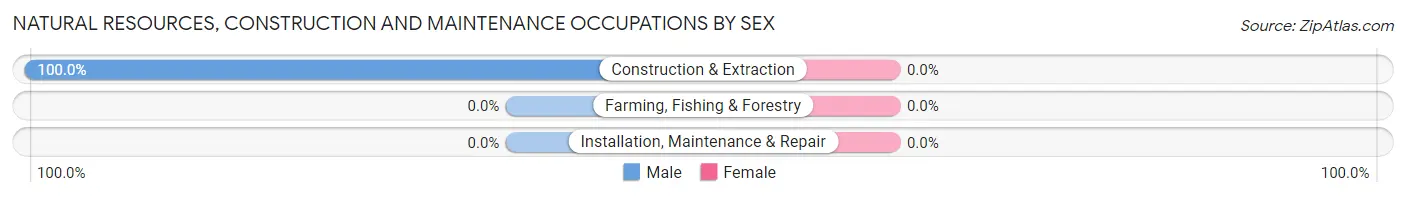
| Occupation | Male | Female |
| Farming, Fishing & Forestry | 0 (0.0%) | 0 (0.0%) |
| Construction & Extraction | 31 (100.0%) | 0 (0.0%) |
| Installation, Maintenance & Repair | 0 (0.0%) | 0 (0.0%) |
| Total (Category) | 31 (100.0%) | 0 (0.0%) |
| Total (Overall) | 131 (31.5%) | 285 (68.5%) |
Production, Transportation and Moving Occupations
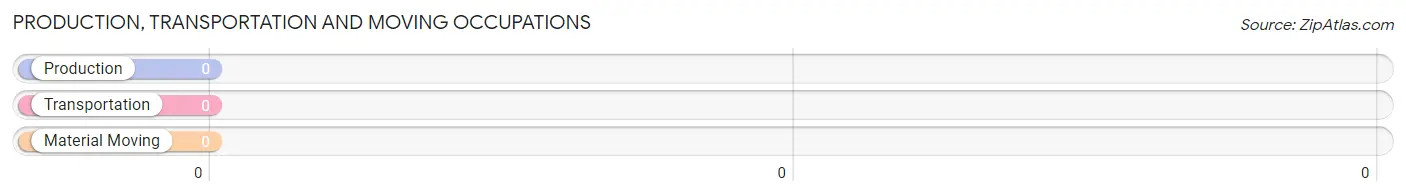
Production, Transportation and Moving Occupations by Sex
| Occupation | Male | Female |
| Production | 0 (0.0%) | 0 (0.0%) |
| Transportation | 0 (0.0%) | 0 (0.0%) |
| Material Moving | 0 (0.0%) | 0 (0.0%) |
| Total (Category) | 0 (0.0%) | 0 (0.0%) |
| Total (Overall) | 131 (31.5%) | 285 (68.5%) |
Employment Industries by Sex in Temelec
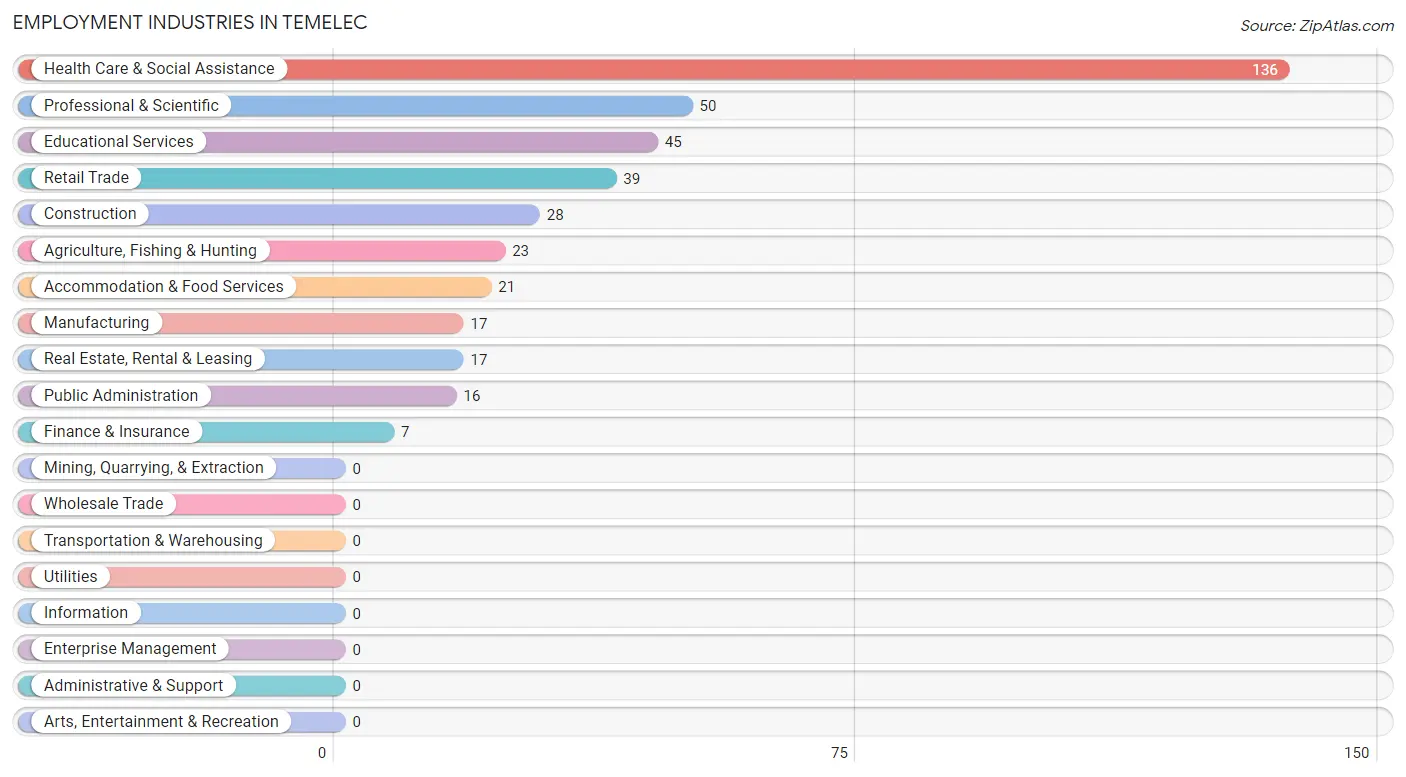
Employment Industries in Temelec
The major employment industries in Temelec include Health Care & Social Assistance (136 | 32.7%), Professional & Scientific (50 | 12.0%), Educational Services (45 | 10.8%), Retail Trade (39 | 9.4%), and Construction (28 | 6.7%).
Employment Industries by Sex in Temelec
The Temelec industries that see more men than women are Agriculture, Fishing & Hunting (100.0%), Construction (100.0%), and Manufacturing (100.0%), whereas the industries that tend to have a higher number of women are Finance & Insurance (100.0%), Real Estate, Rental & Leasing (100.0%), and Professional & Scientific (100.0%).
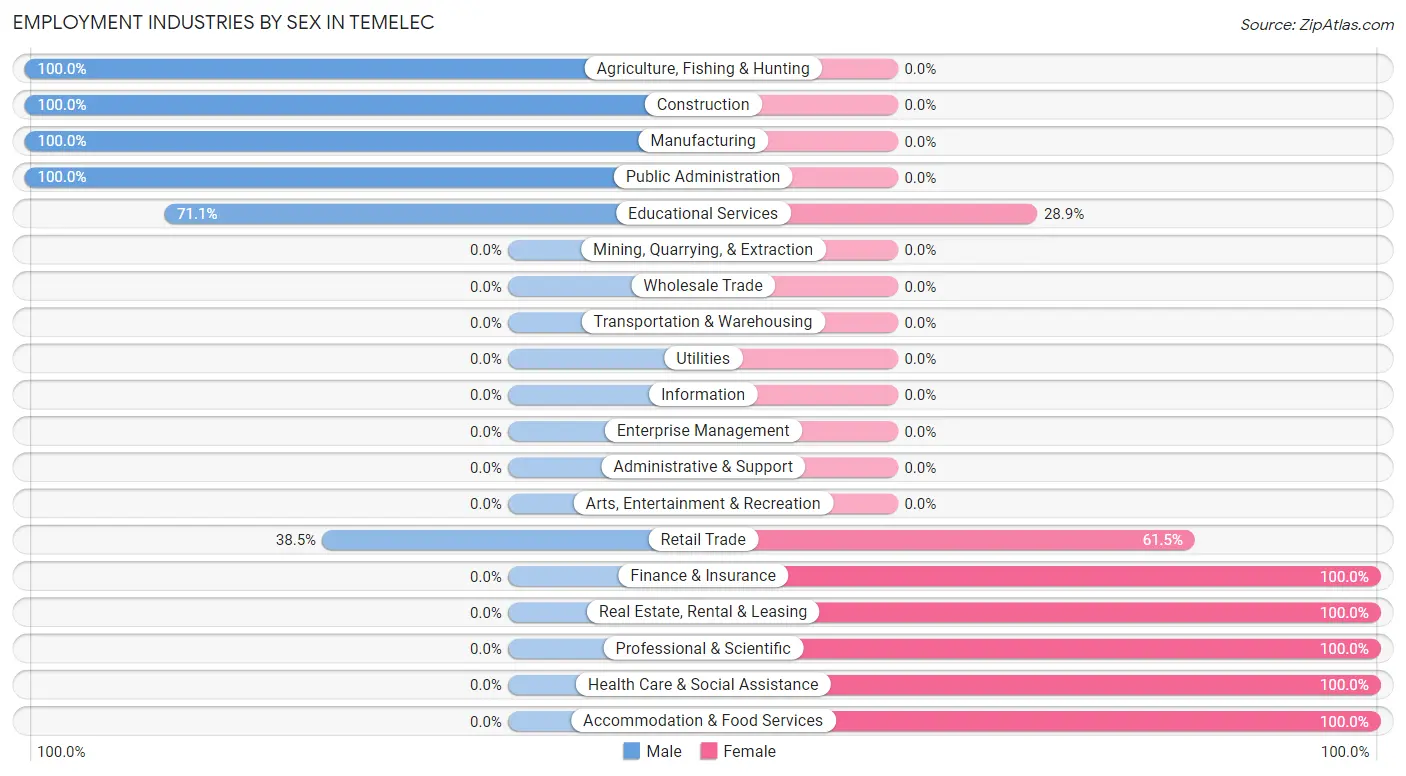
| Industry | Male | Female |
| Agriculture, Fishing & Hunting | 23 (100.0%) | 0 (0.0%) |
| Mining, Quarrying, & Extraction | 0 (0.0%) | 0 (0.0%) |
| Construction | 28 (100.0%) | 0 (0.0%) |
| Manufacturing | 17 (100.0%) | 0 (0.0%) |
| Wholesale Trade | 0 (0.0%) | 0 (0.0%) |
| Retail Trade | 15 (38.5%) | 24 (61.5%) |
| Transportation & Warehousing | 0 (0.0%) | 0 (0.0%) |
| Utilities | 0 (0.0%) | 0 (0.0%) |
| Information | 0 (0.0%) | 0 (0.0%) |
| Finance & Insurance | 0 (0.0%) | 7 (100.0%) |
| Real Estate, Rental & Leasing | 0 (0.0%) | 17 (100.0%) |
| Professional & Scientific | 0 (0.0%) | 50 (100.0%) |
| Enterprise Management | 0 (0.0%) | 0 (0.0%) |
| Administrative & Support | 0 (0.0%) | 0 (0.0%) |
| Educational Services | 32 (71.1%) | 13 (28.9%) |
| Health Care & Social Assistance | 0 (0.0%) | 136 (100.0%) |
| Arts, Entertainment & Recreation | 0 (0.0%) | 0 (0.0%) |
| Accommodation & Food Services | 0 (0.0%) | 21 (100.0%) |
| Public Administration | 16 (100.0%) | 0 (0.0%) |
| Total | 131 (31.5%) | 285 (68.5%) |
Education in Temelec
School Enrollment in Temelec
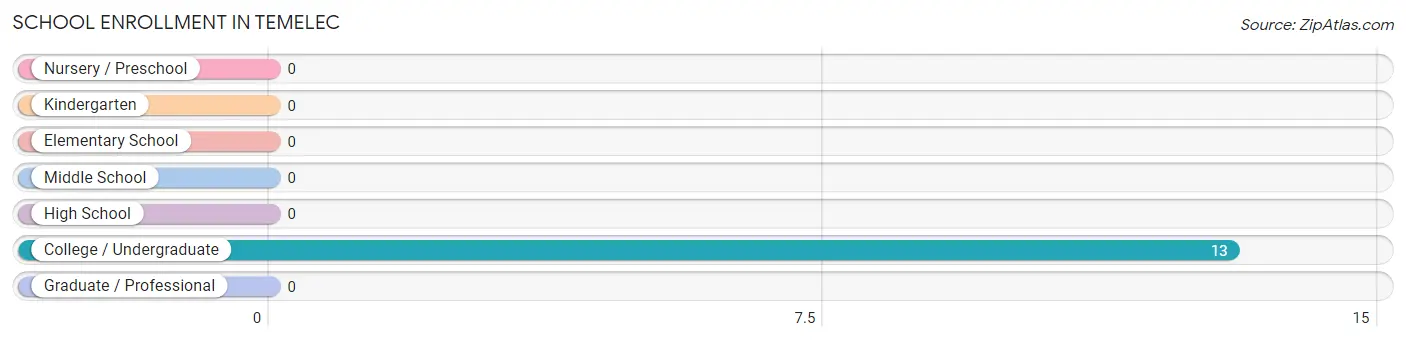
| School Level | # Students | % Students |
| Nursery / Preschool | 0 | 0.0% |
| Kindergarten | 0 | 0.0% |
| Elementary School | 0 | 0.0% |
| Middle School | 0 | 0.0% |
| High School | 0 | 0.0% |
| College / Undergraduate | 13 | 100.0% |
| Graduate / Professional | 0 | 0.0% |
| Total | 13 | 100.0% |
School Enrollment by Age by Funding Source in Temelec
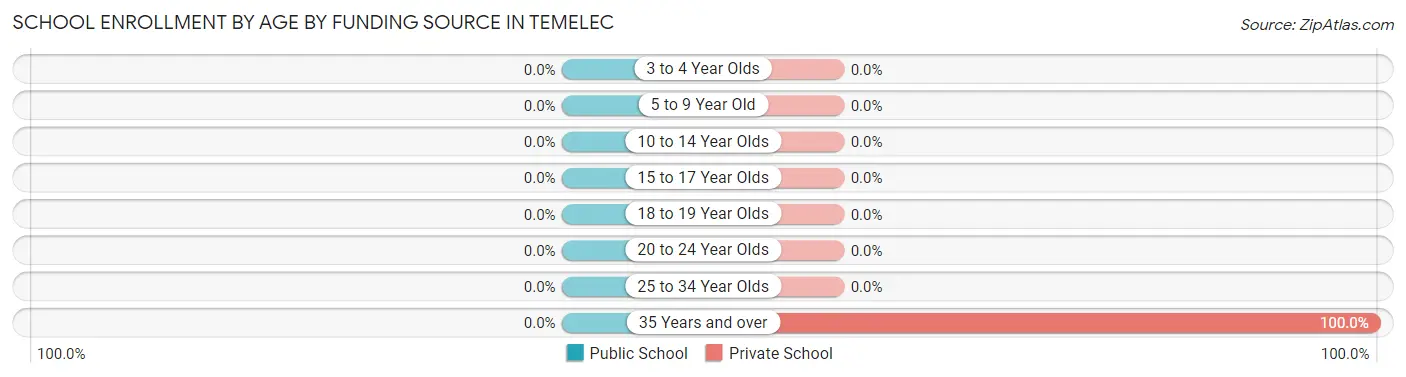
| Age Bracket | Public School | Private School |
| 3 to 4 Year Olds | 0 (0.0%) | 0 (0.0%) |
| 5 to 9 Year Old | 0 (0.0%) | 0 (0.0%) |
| 10 to 14 Year Olds | 0 (0.0%) | 0 (0.0%) |
| 15 to 17 Year Olds | 0 (0.0%) | 0 (0.0%) |
| 18 to 19 Year Olds | 0 (0.0%) | 0 (0.0%) |
| 20 to 24 Year Olds | 0 (0.0%) | 0 (0.0%) |
| 25 to 34 Year Olds | 0 (0.0%) | 0 (0.0%) |
| 35 Years and over | 0 (0.0%) | 13 (100.0%) |
| Total | 0 (0.0%) | 13 (100.0%) |
Educational Attainment by Field of Study in Temelec
Social sciences (212 | 19.4%), literature & languages (155 | 14.2%), arts & humanities (151 | 13.8%), liberal arts & history (115 | 10.5%), and bio, nature & agricultural (104 | 9.5%) are the most common fields of study among 1,095 individuals in Temelec who have obtained a bachelor's degree or higher.
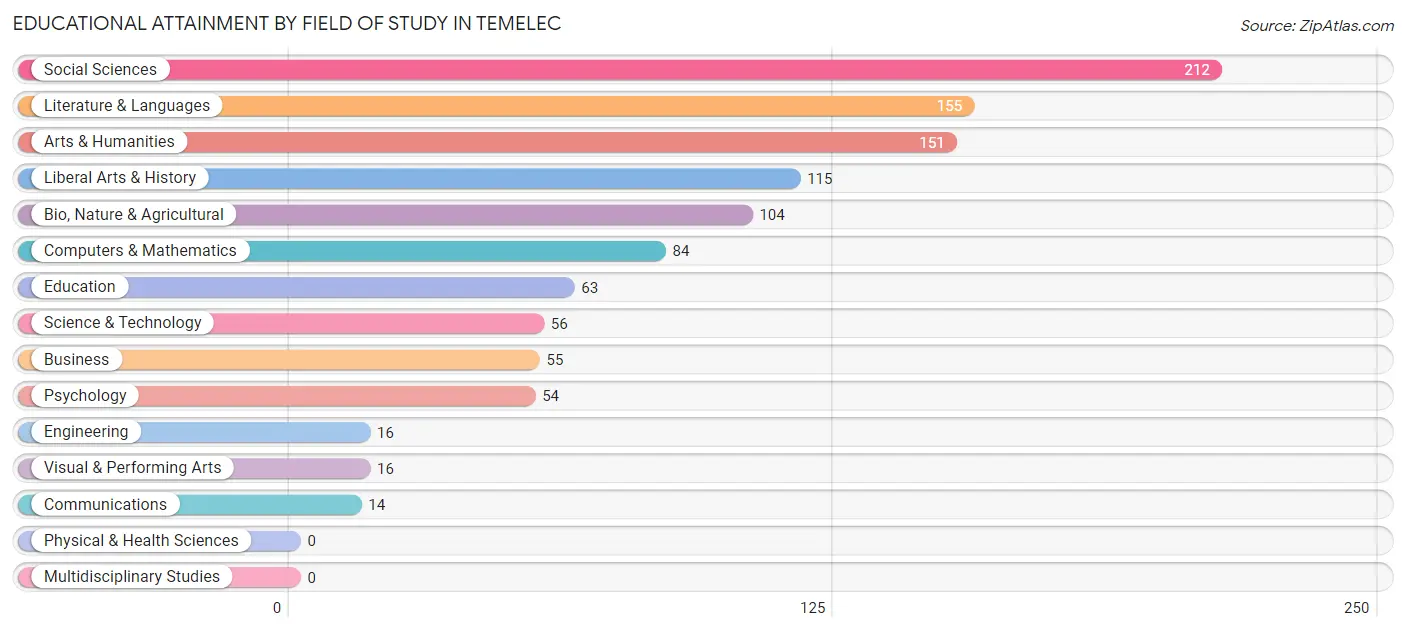
| Field of Study | # Graduates | % Graduates |
| Computers & Mathematics | 84 | 7.7% |
| Bio, Nature & Agricultural | 104 | 9.5% |
| Physical & Health Sciences | 0 | 0.0% |
| Psychology | 54 | 4.9% |
| Social Sciences | 212 | 19.4% |
| Engineering | 16 | 1.5% |
| Multidisciplinary Studies | 0 | 0.0% |
| Science & Technology | 56 | 5.1% |
| Business | 55 | 5.0% |
| Education | 63 | 5.8% |
| Literature & Languages | 155 | 14.2% |
| Liberal Arts & History | 115 | 10.5% |
| Visual & Performing Arts | 16 | 1.5% |
| Communications | 14 | 1.3% |
| Arts & Humanities | 151 | 13.8% |
| Total | 1,095 | 100.0% |
Transportation & Commute in Temelec
Vehicle Availability by Sex in Temelec
The most prevalent vehicle ownership categories in Temelec are males with 3 vehicles (72, accounting for 55.0%) and females with 3 vehicles (21, making up 25.3%).
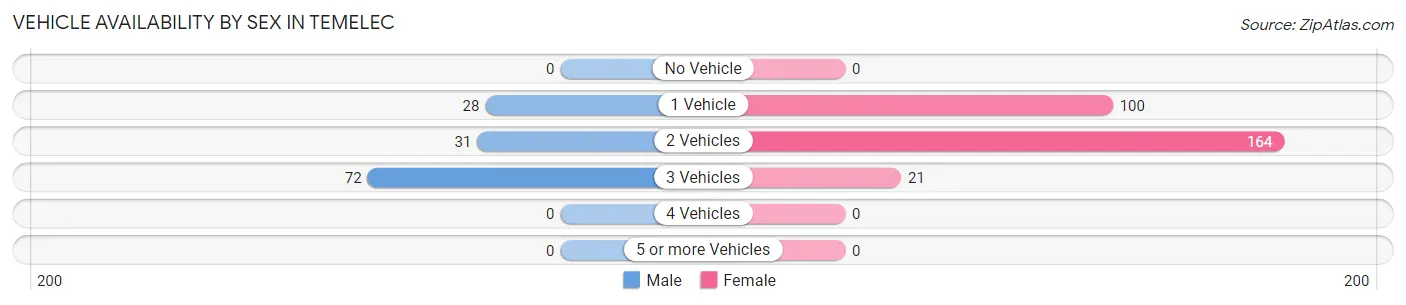
| Vehicles Available | Male | Female |
| No Vehicle | 0 (0.0%) | 0 (0.0%) |
| 1 Vehicle | 28 (21.4%) | 100 (35.1%) |
| 2 Vehicles | 31 (23.7%) | 164 (57.5%) |
| 3 Vehicles | 72 (55.0%) | 21 (7.4%) |
| 4 Vehicles | 0 (0.0%) | 0 (0.0%) |
| 5 or more Vehicles | 0 (0.0%) | 0 (0.0%) |
| Total | 131 (100.0%) | 285 (100.0%) |
Commute Time in Temelec
The most frequently occuring commute durations in Temelec are 10 to 14 minutes (59 commuters, 32.4%), 90 or more minutes (35 commuters, 19.2%), and 45 to 59 minutes (29 commuters, 15.9%).
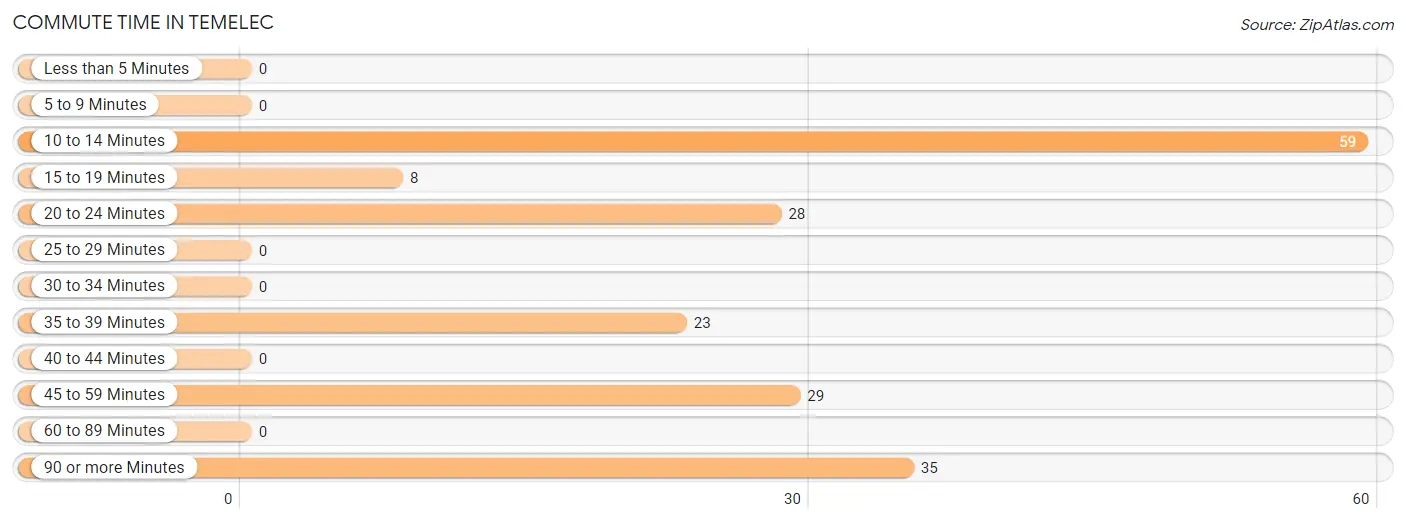
| Commute Time | # Commuters | % Commuters |
| Less than 5 Minutes | 0 | 0.0% |
| 5 to 9 Minutes | 0 | 0.0% |
| 10 to 14 Minutes | 59 | 32.4% |
| 15 to 19 Minutes | 8 | 4.4% |
| 20 to 24 Minutes | 28 | 15.4% |
| 25 to 29 Minutes | 0 | 0.0% |
| 30 to 34 Minutes | 0 | 0.0% |
| 35 to 39 Minutes | 23 | 12.6% |
| 40 to 44 Minutes | 0 | 0.0% |
| 45 to 59 Minutes | 29 | 15.9% |
| 60 to 89 Minutes | 0 | 0.0% |
| 90 or more Minutes | 35 | 19.2% |
Commute Time by Sex in Temelec
The most common commute times in Temelec are 10 to 14 minutes (33 commuters, 32.7%) for males and 45 to 59 minutes (29 commuters, 35.8%) for females.
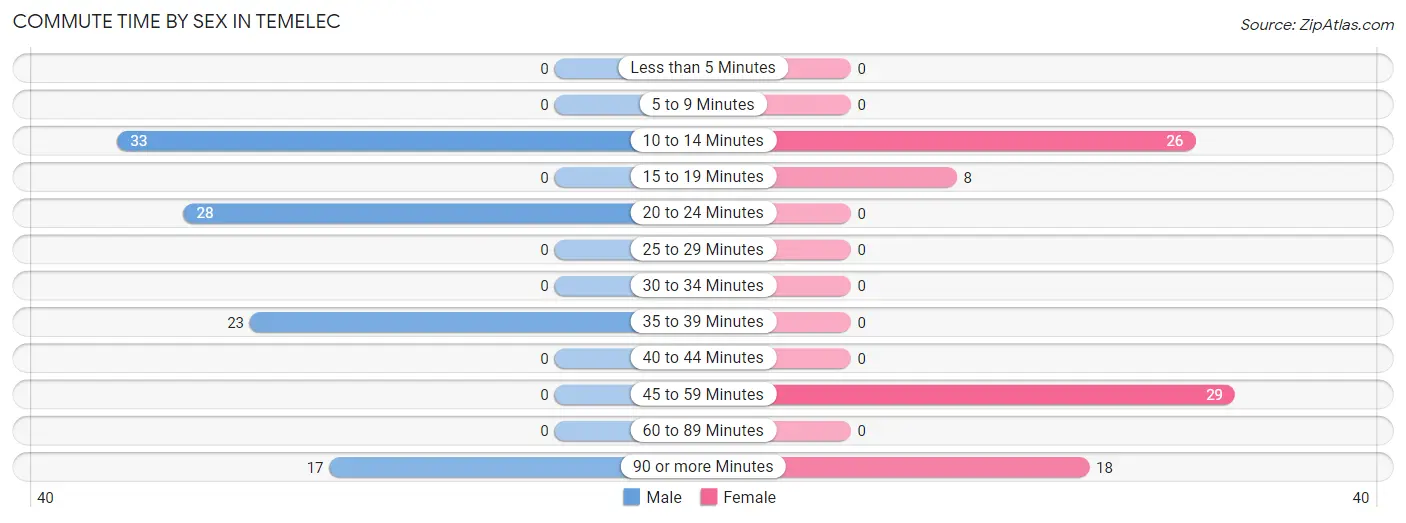
| Commute Time | Male | Female |
| Less than 5 Minutes | 0 (0.0%) | 0 (0.0%) |
| 5 to 9 Minutes | 0 (0.0%) | 0 (0.0%) |
| 10 to 14 Minutes | 33 (32.7%) | 26 (32.1%) |
| 15 to 19 Minutes | 0 (0.0%) | 8 (9.9%) |
| 20 to 24 Minutes | 28 (27.7%) | 0 (0.0%) |
| 25 to 29 Minutes | 0 (0.0%) | 0 (0.0%) |
| 30 to 34 Minutes | 0 (0.0%) | 0 (0.0%) |
| 35 to 39 Minutes | 23 (22.8%) | 0 (0.0%) |
| 40 to 44 Minutes | 0 (0.0%) | 0 (0.0%) |
| 45 to 59 Minutes | 0 (0.0%) | 29 (35.8%) |
| 60 to 89 Minutes | 0 (0.0%) | 0 (0.0%) |
| 90 or more Minutes | 17 (16.8%) | 18 (22.2%) |
Time of Departure to Work by Sex in Temelec
The most frequent times of departure to work in Temelec are 9:00 AM to 9:59 AM (33, 32.7%) for males and 8:30 AM to 8:59 AM (35, 43.2%) for females.
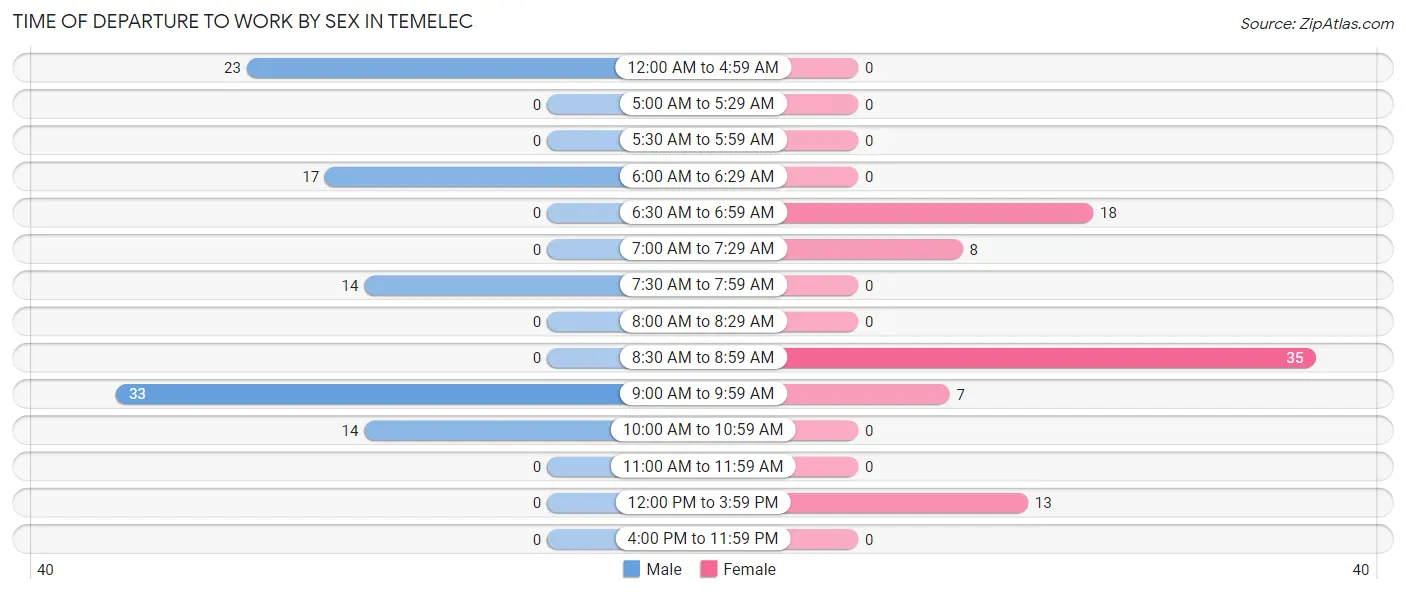
| Time of Departure | Male | Female |
| 12:00 AM to 4:59 AM | 23 (22.8%) | 0 (0.0%) |
| 5:00 AM to 5:29 AM | 0 (0.0%) | 0 (0.0%) |
| 5:30 AM to 5:59 AM | 0 (0.0%) | 0 (0.0%) |
| 6:00 AM to 6:29 AM | 17 (16.8%) | 0 (0.0%) |
| 6:30 AM to 6:59 AM | 0 (0.0%) | 18 (22.2%) |
| 7:00 AM to 7:29 AM | 0 (0.0%) | 8 (9.9%) |
| 7:30 AM to 7:59 AM | 14 (13.9%) | 0 (0.0%) |
| 8:00 AM to 8:29 AM | 0 (0.0%) | 0 (0.0%) |
| 8:30 AM to 8:59 AM | 0 (0.0%) | 35 (43.2%) |
| 9:00 AM to 9:59 AM | 33 (32.7%) | 7 (8.6%) |
| 10:00 AM to 10:59 AM | 14 (13.9%) | 0 (0.0%) |
| 11:00 AM to 11:59 AM | 0 (0.0%) | 0 (0.0%) |
| 12:00 PM to 3:59 PM | 0 (0.0%) | 13 (16.1%) |
| 4:00 PM to 11:59 PM | 0 (0.0%) | 0 (0.0%) |
| Total | 101 (100.0%) | 81 (100.0%) |
Housing Occupancy in Temelec
Occupancy by Ownership in Temelec
Of the total 1,043 dwellings in Temelec, owner-occupied units account for 943 (90.4%), while renter-occupied units make up 100 (9.6%).
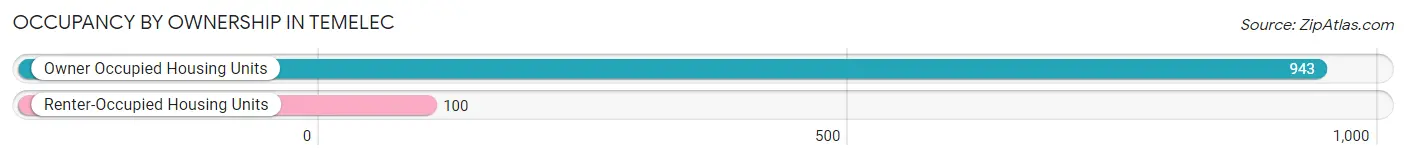
| Occupancy | # Housing Units | % Housing Units |
| Owner Occupied Housing Units | 943 | 90.4% |
| Renter-Occupied Housing Units | 100 | 9.6% |
| Total Occupied Housing Units | 1,043 | 100.0% |
Occupancy by Household Size in Temelec
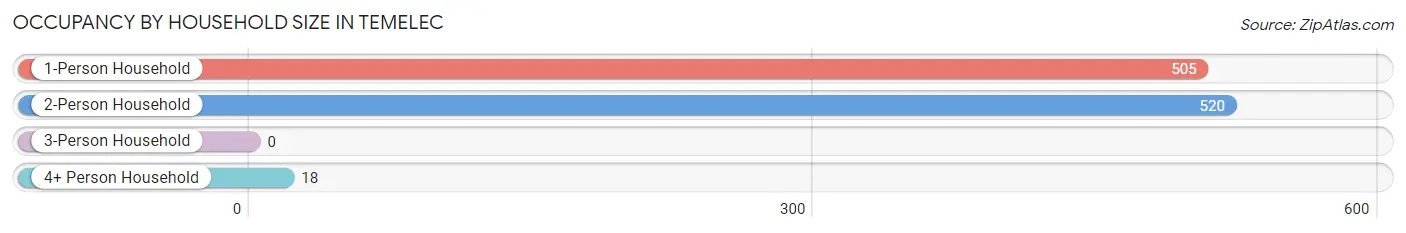
| Household Size | # Housing Units | % Housing Units |
| 1-Person Household | 505 | 48.4% |
| 2-Person Household | 520 | 49.9% |
| 3-Person Household | 0 | 0.0% |
| 4+ Person Household | 18 | 1.7% |
| Total Housing Units | 1,043 | 100.0% |
Occupancy by Ownership by Household Size in Temelec
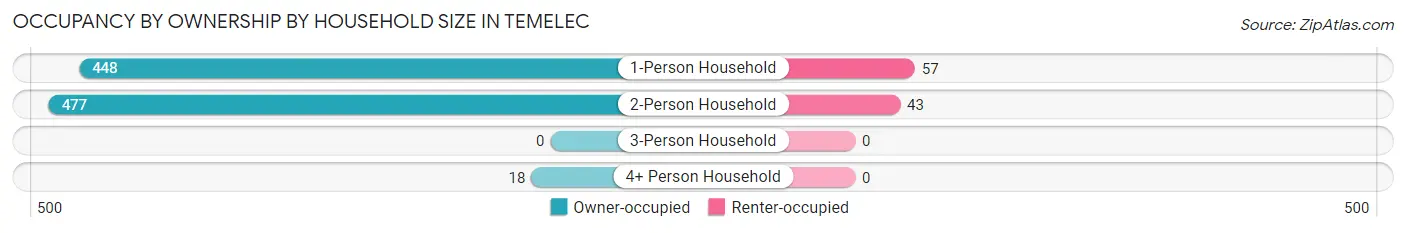
| Household Size | Owner-occupied | Renter-occupied |
| 1-Person Household | 448 (88.7%) | 57 (11.3%) |
| 2-Person Household | 477 (91.7%) | 43 (8.3%) |
| 3-Person Household | 0 (0.0%) | 0 (0.0%) |
| 4+ Person Household | 18 (100.0%) | 0 (0.0%) |
| Total Housing Units | 943 (90.4%) | 100 (9.6%) |
Occupancy by Educational Attainment in Temelec
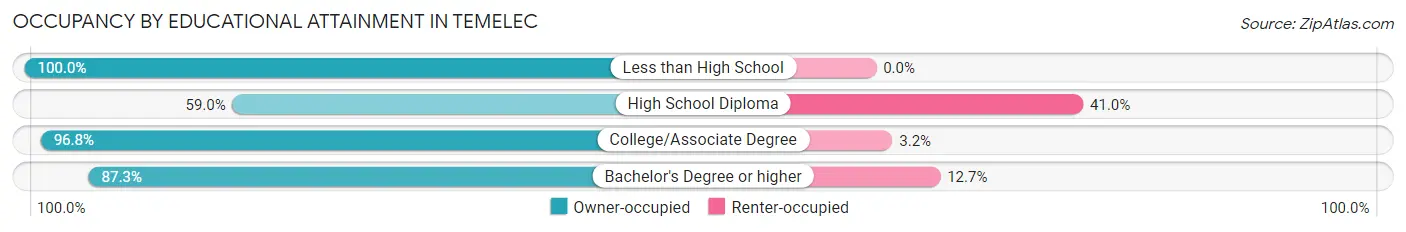
| Household Size | Owner-occupied | Renter-occupied |
| Less than High School | 15 (100.0%) | 0 (0.0%) |
| High School Diploma | 23 (59.0%) | 16 (41.0%) |
| College/Associate Degree | 424 (96.8%) | 14 (3.2%) |
| Bachelor's Degree or higher | 481 (87.3%) | 70 (12.7%) |
Occupancy by Age of Householder in Temelec
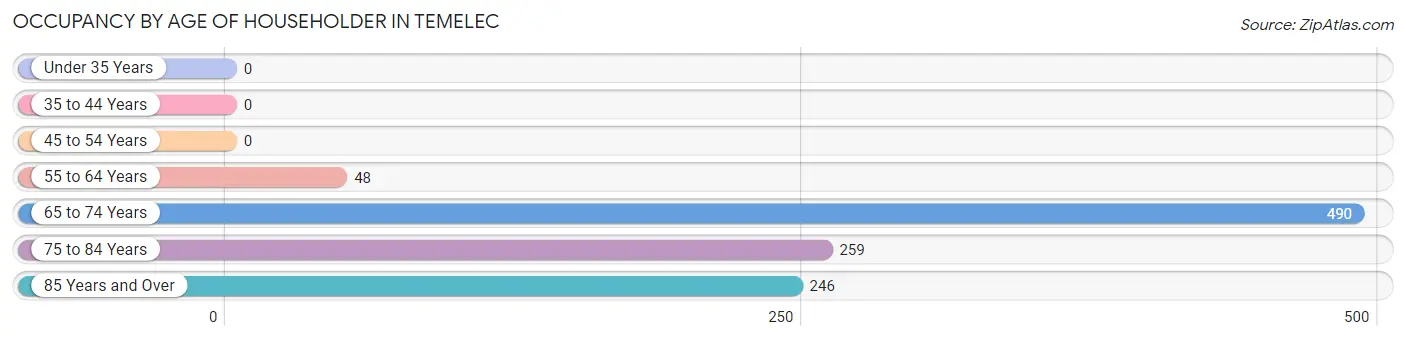
| Age Bracket | # Households | % Households |
| Under 35 Years | 0 | 0.0% |
| 35 to 44 Years | 0 | 0.0% |
| 45 to 54 Years | 0 | 0.0% |
| 55 to 64 Years | 48 | 4.6% |
| 65 to 74 Years | 490 | 47.0% |
| 75 to 84 Years | 259 | 24.8% |
| 85 Years and Over | 246 | 23.6% |
| Total | 1,043 | 100.0% |
Housing Finances in Temelec
Median Income by Occupancy in Temelec
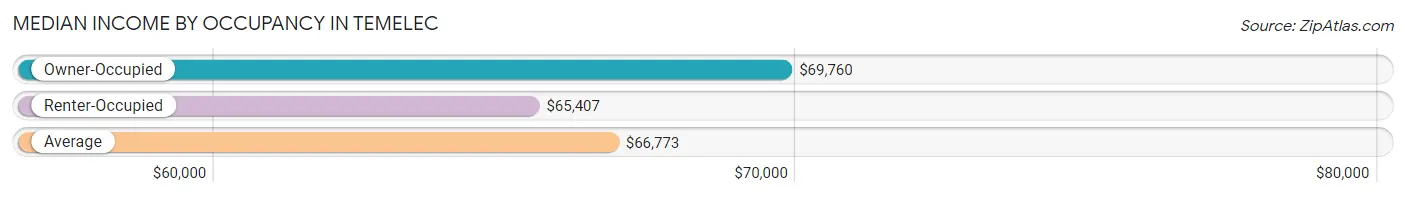
| Occupancy Type | # Households | Median Income |
| Owner-Occupied | 943 (90.4%) | $69,760 |
| Renter-Occupied | 100 (9.6%) | $65,407 |
| Average | 1,043 (100.0%) | $66,773 |
Occupancy by Householder Income Bracket in Temelec
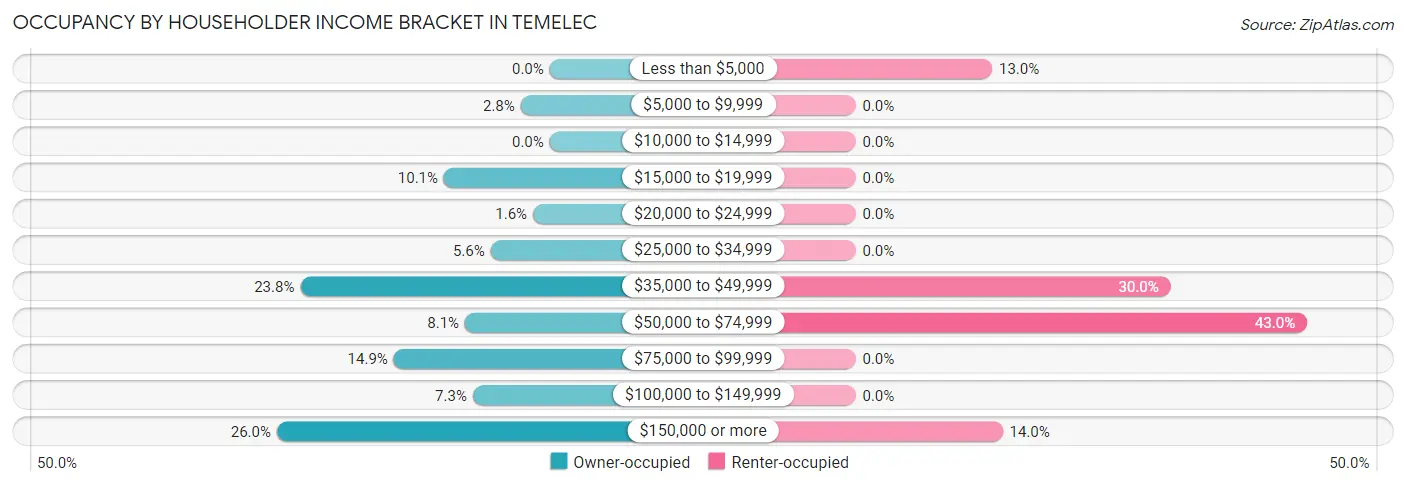
| Income Bracket | Owner-occupied | Renter-occupied |
| Less than $5,000 | 0 (0.0%) | 13 (13.0%) |
| $5,000 to $9,999 | 26 (2.8%) | 0 (0.0%) |
| $10,000 to $14,999 | 0 (0.0%) | 0 (0.0%) |
| $15,000 to $19,999 | 95 (10.1%) | 0 (0.0%) |
| $20,000 to $24,999 | 15 (1.6%) | 0 (0.0%) |
| $25,000 to $34,999 | 53 (5.6%) | 0 (0.0%) |
| $35,000 to $49,999 | 224 (23.7%) | 30 (30.0%) |
| $50,000 to $74,999 | 76 (8.1%) | 43 (43.0%) |
| $75,000 to $99,999 | 140 (14.8%) | 0 (0.0%) |
| $100,000 to $149,999 | 69 (7.3%) | 0 (0.0%) |
| $150,000 or more | 245 (26.0%) | 14 (14.0%) |
| Total | 943 (100.0%) | 100 (100.0%) |
Monthly Housing Cost Tiers in Temelec
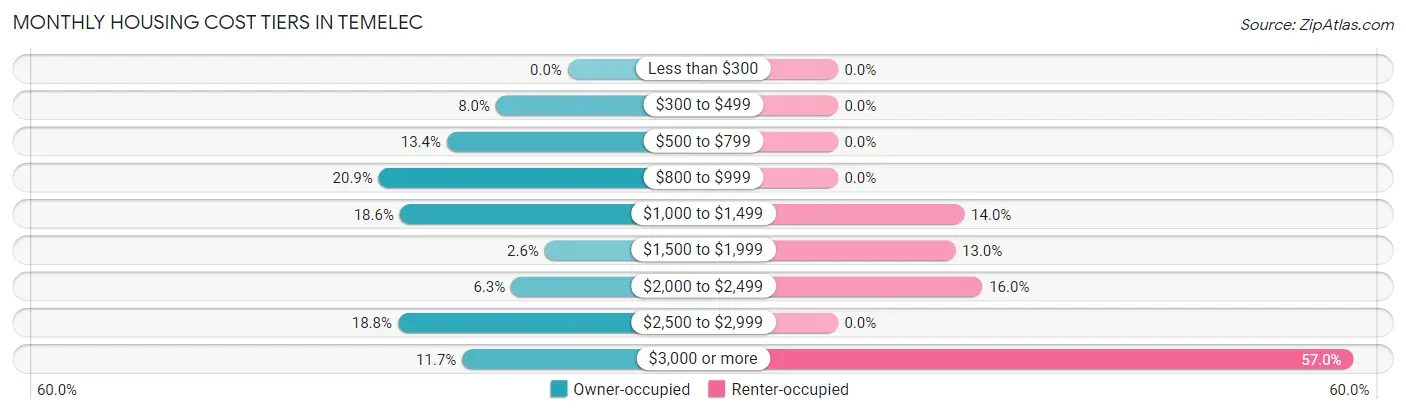
| Monthly Cost | Owner-occupied | Renter-occupied |
| Less than $300 | 0 (0.0%) | 0 (0.0%) |
| $300 to $499 | 75 (8.0%) | 0 (0.0%) |
| $500 to $799 | 126 (13.4%) | 0 (0.0%) |
| $800 to $999 | 197 (20.9%) | 0 (0.0%) |
| $1,000 to $1,499 | 175 (18.6%) | 14 (14.0%) |
| $1,500 to $1,999 | 24 (2.5%) | 13 (13.0%) |
| $2,000 to $2,499 | 59 (6.3%) | 16 (16.0%) |
| $2,500 to $2,999 | 177 (18.8%) | 0 (0.0%) |
| $3,000 or more | 110 (11.7%) | 57 (57.0%) |
| Total | 943 (100.0%) | 100 (100.0%) |
Physical Housing Characteristics in Temelec
Housing Structures in Temelec
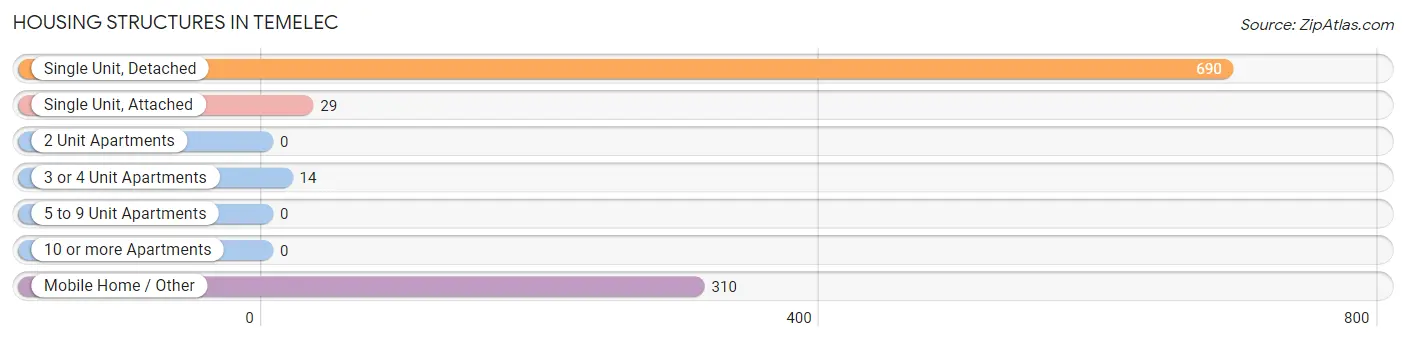
| Structure Type | # Housing Units | % Housing Units |
| Single Unit, Detached | 690 | 66.2% |
| Single Unit, Attached | 29 | 2.8% |
| 2 Unit Apartments | 0 | 0.0% |
| 3 or 4 Unit Apartments | 14 | 1.3% |
| 5 to 9 Unit Apartments | 0 | 0.0% |
| 10 or more Apartments | 0 | 0.0% |
| Mobile Home / Other | 310 | 29.7% |
| Total | 1,043 | 100.0% |
Housing Structures by Occupancy in Temelec
| Structure Type | Owner-occupied | Renter-occupied |
| Single Unit, Detached | 604 (87.5%) | 86 (12.5%) |
| Single Unit, Attached | 29 (100.0%) | 0 (0.0%) |
| 2 Unit Apartments | 0 (0.0%) | 0 (0.0%) |
| 3 or 4 Unit Apartments | 0 (0.0%) | 14 (100.0%) |
| 5 to 9 Unit Apartments | 0 (0.0%) | 0 (0.0%) |
| 10 or more Apartments | 0 (0.0%) | 0 (0.0%) |
| Mobile Home / Other | 310 (100.0%) | 0 (0.0%) |
| Total | 943 (90.4%) | 100 (9.6%) |
Housing Structures by Number of Rooms in Temelec
| Number of Rooms | Owner-occupied | Renter-occupied |
| 1 Room | 0 (0.0%) | 0 (0.0%) |
| 2 or 3 Rooms | 31 (3.3%) | 14 (14.0%) |
| 4 or 5 Rooms | 740 (78.5%) | 13 (13.0%) |
| 6 or 7 Rooms | 172 (18.2%) | 73 (73.0%) |
| 8 or more Rooms | 0 (0.0%) | 0 (0.0%) |
| Total | 943 (100.0%) | 100 (100.0%) |
Housing Structure by Heating Type in Temelec
| Heating Type | Owner-occupied | Renter-occupied |
| Utility Gas | 789 (83.7%) | 100 (100.0%) |
| Bottled, Tank, or LP Gas | 15 (1.6%) | 0 (0.0%) |
| Electricity | 121 (12.8%) | 0 (0.0%) |
| Fuel Oil or Kerosene | 0 (0.0%) | 0 (0.0%) |
| Coal or Coke | 0 (0.0%) | 0 (0.0%) |
| All other Fuels | 18 (1.9%) | 0 (0.0%) |
| No Fuel Used | 0 (0.0%) | 0 (0.0%) |
| Total | 943 (100.0%) | 100 (100.0%) |
Household Vehicle Usage in Temelec
| Vehicles per Household | Owner-occupied | Renter-occupied |
| No Vehicle | 234 (24.8%) | 0 (0.0%) |
| 1 Vehicle | 408 (43.3%) | 57 (57.0%) |
| 2 Vehicles | 253 (26.8%) | 43 (43.0%) |
| 3 or more Vehicles | 48 (5.1%) | 0 (0.0%) |
| Total | 943 (100.0%) | 100 (100.0%) |
Real Estate & Mortgages in Temelec
Real Estate and Mortgage Overview in Temelec
| Characteristic | Without Mortgage | With Mortgage |
| Housing Units | 573 | 370 |
| Median Property Value | $543,900 | $774,400 |
| Median Household Income | $41,904 | $199 |
| Monthly Housing Costs | $943 | $110 |
| Real Estate Taxes | $5,619 | $39 |
Property Value by Mortgage Status in Temelec
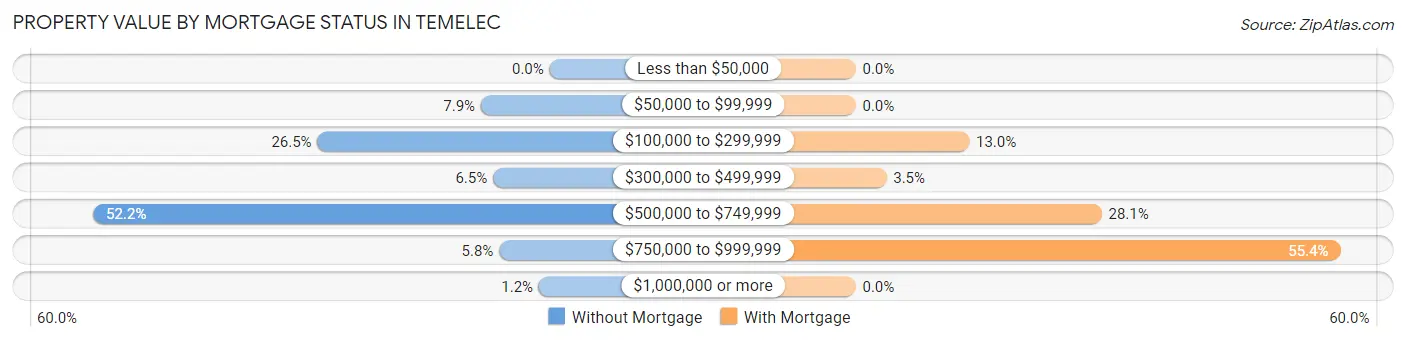
| Property Value | Without Mortgage | With Mortgage |
| Less than $50,000 | 0 (0.0%) | 0 (0.0%) |
| $50,000 to $99,999 | 45 (7.9%) | 0 (0.0%) |
| $100,000 to $299,999 | 152 (26.5%) | 48 (13.0%) |
| $300,000 to $499,999 | 37 (6.5%) | 13 (3.5%) |
| $500,000 to $749,999 | 299 (52.2%) | 104 (28.1%) |
| $750,000 to $999,999 | 33 (5.8%) | 205 (55.4%) |
| $1,000,000 or more | 7 (1.2%) | 0 (0.0%) |
| Total | 573 (100.0%) | 370 (100.0%) |
Household Income by Mortgage Status in Temelec
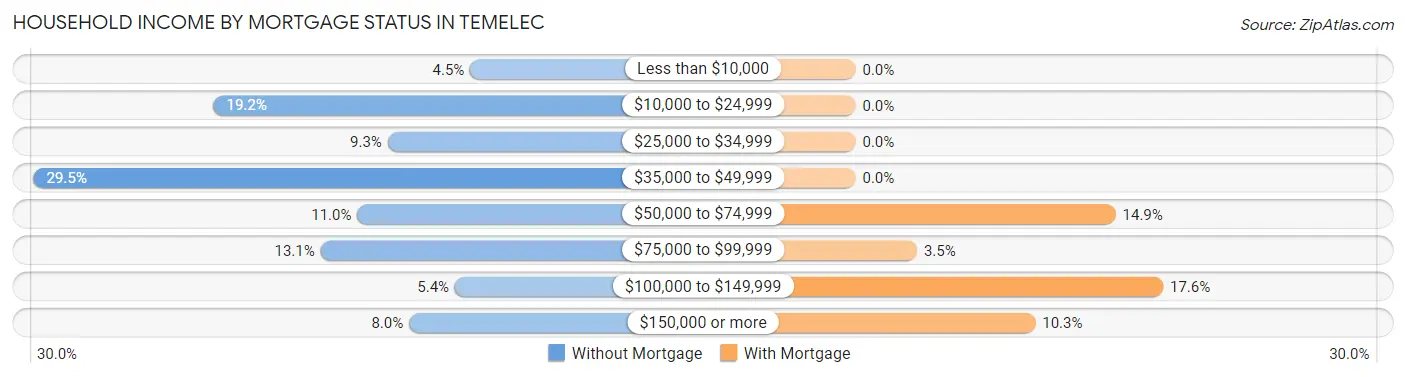
| Household Income | Without Mortgage | With Mortgage |
| Less than $10,000 | 26 (4.5%) | 0 (0.0%) |
| $10,000 to $24,999 | 110 (19.2%) | 0 (0.0%) |
| $25,000 to $34,999 | 53 (9.2%) | 0 (0.0%) |
| $35,000 to $49,999 | 169 (29.5%) | 0 (0.0%) |
| $50,000 to $74,999 | 63 (11.0%) | 55 (14.9%) |
| $75,000 to $99,999 | 75 (13.1%) | 13 (3.5%) |
| $100,000 to $149,999 | 31 (5.4%) | 65 (17.6%) |
| $150,000 or more | 46 (8.0%) | 38 (10.3%) |
| Total | 573 (100.0%) | 370 (100.0%) |
Property Value to Household Income Ratio in Temelec
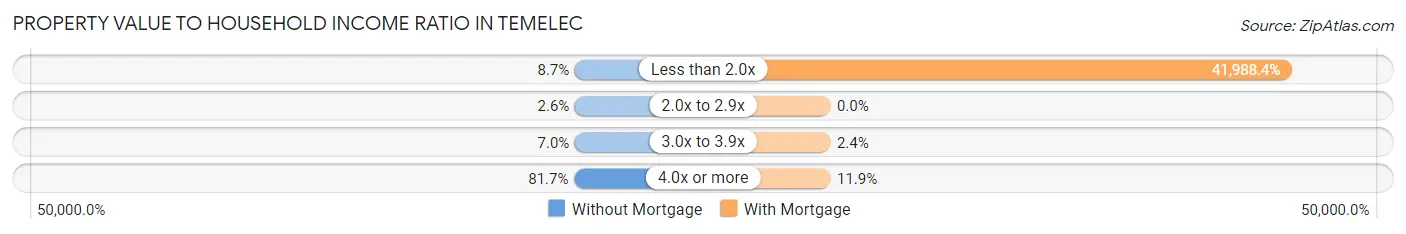
| Value-to-Income Ratio | Without Mortgage | With Mortgage |
| Less than 2.0x | 50 (8.7%) | 155,357 (41,988.4%) |
| 2.0x to 2.9x | 15 (2.6%) | 0 (0.0%) |
| 3.0x to 3.9x | 40 (7.0%) | 9 (2.4%) |
| 4.0x or more | 468 (81.7%) | 44 (11.9%) |
| Total | 573 (100.0%) | 370 (100.0%) |
Real Estate Taxes by Mortgage Status in Temelec
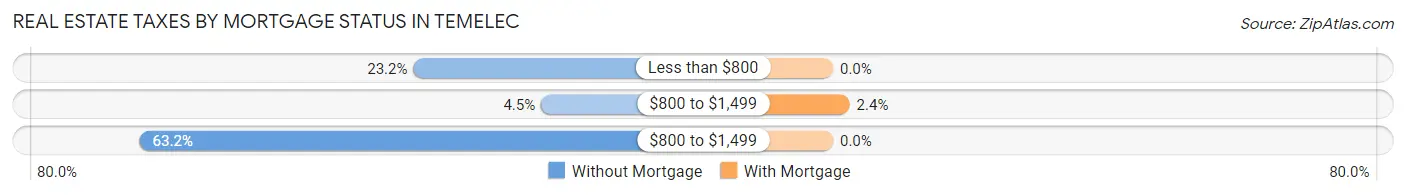
| Property Taxes | Without Mortgage | With Mortgage |
| Less than $800 | 133 (23.2%) | 0 (0.0%) |
| $800 to $1,499 | 26 (4.5%) | 9 (2.4%) |
| $800 to $1,499 | 362 (63.2%) | 0 (0.0%) |
| Total | 573 (100.0%) | 370 (100.0%) |
Health & Disability in Temelec
Health Insurance Coverage by Age in Temelec
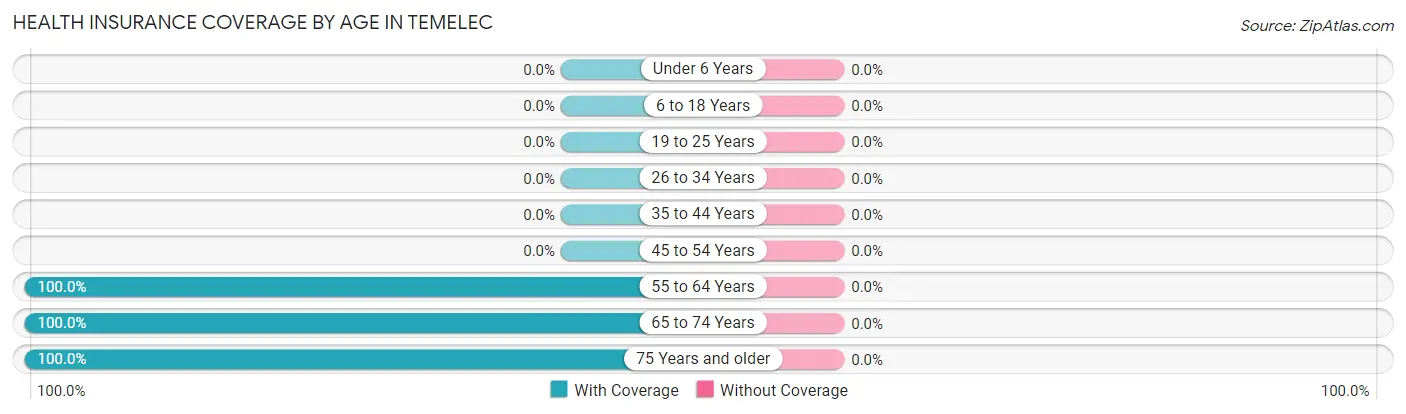
| Age Bracket | With Coverage | Without Coverage |
| Under 6 Years | 0 (0.0%) | 0 (0.0%) |
| 6 to 18 Years | 0 (0.0%) | 0 (0.0%) |
| 19 to 25 Years | 0 (0.0%) | 0 (0.0%) |
| 26 to 34 Years | 0 (0.0%) | 0 (0.0%) |
| 35 to 44 Years | 0 (0.0%) | 0 (0.0%) |
| 45 to 54 Years | 0 (0.0%) | 0 (0.0%) |
| 55 to 64 Years | 274 (100.0%) | 0 (0.0%) |
| 65 to 74 Years | 654 (100.0%) | 0 (0.0%) |
| 75 Years and older | 765 (100.0%) | 0 (0.0%) |
| Total | 1,693 (100.0%) | 0 (0.0%) |
Health Insurance Coverage by Citizenship Status in Temelec
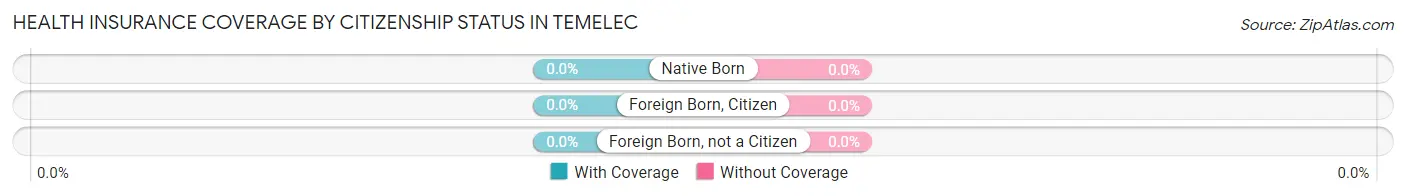
| Citizenship Status | With Coverage | Without Coverage |
| Native Born | 0 (0.0%) | 0 (0.0%) |
| Foreign Born, Citizen | 0 (0.0%) | 0 (0.0%) |
| Foreign Born, not a Citizen | 0 (0.0%) | 0 (0.0%) |
Health Insurance Coverage by Household Income in Temelec
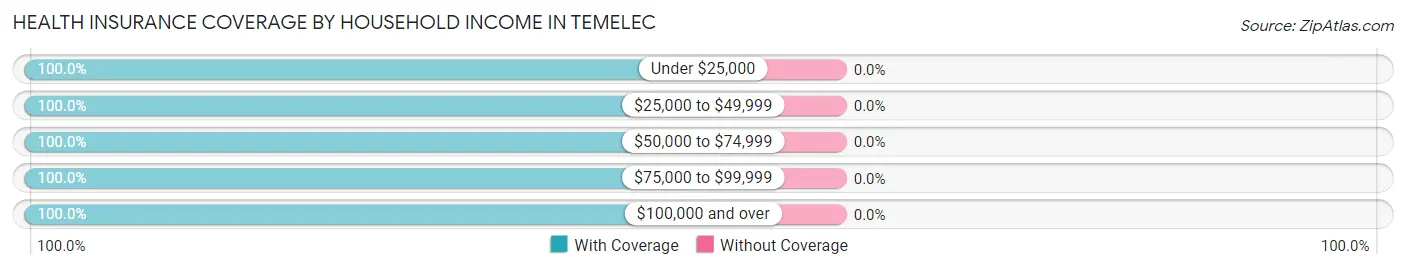
| Household Income | With Coverage | Without Coverage |
| Under $25,000 | 149 (100.0%) | 0 (0.0%) |
| $25,000 to $49,999 | 435 (100.0%) | 0 (0.0%) |
| $50,000 to $74,999 | 184 (100.0%) | 0 (0.0%) |
| $75,000 to $99,999 | 218 (100.0%) | 0 (0.0%) |
| $100,000 and over | 707 (100.0%) | 0 (0.0%) |
Public vs Private Health Insurance Coverage by Age in Temelec
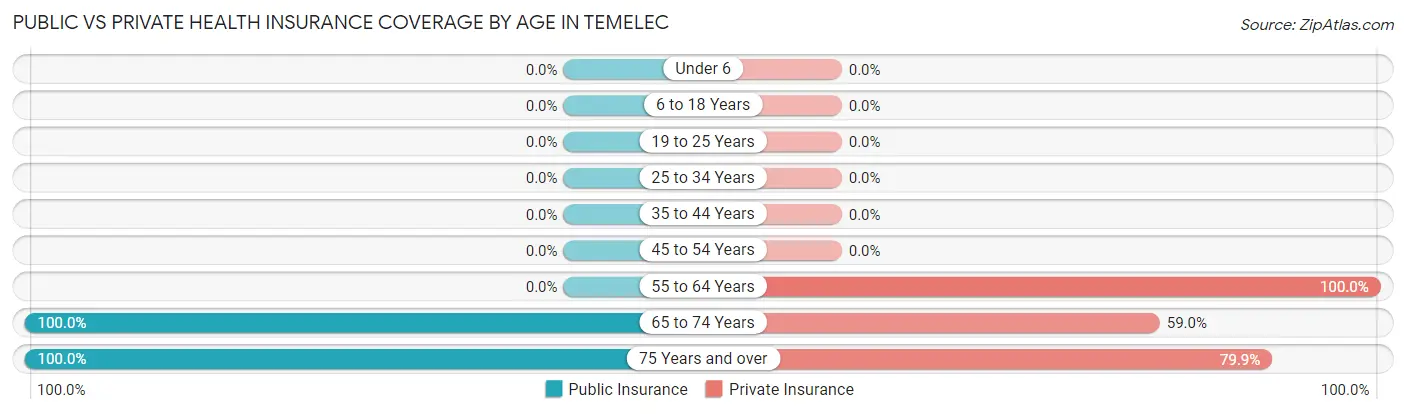
| Age Bracket | Public Insurance | Private Insurance |
| Under 6 | 0 (0.0%) | 0 (0.0%) |
| 6 to 18 Years | 0 (0.0%) | 0 (0.0%) |
| 19 to 25 Years | 0 (0.0%) | 0 (0.0%) |
| 25 to 34 Years | 0 (0.0%) | 0 (0.0%) |
| 35 to 44 Years | 0 (0.0%) | 0 (0.0%) |
| 45 to 54 Years | 0 (0.0%) | 0 (0.0%) |
| 55 to 64 Years | 0 (0.0%) | 274 (100.0%) |
| 65 to 74 Years | 654 (100.0%) | 386 (59.0%) |
| 75 Years and over | 765 (100.0%) | 611 (79.9%) |
| Total | 1,419 (83.8%) | 1,271 (75.1%) |
Disability Status by Sex by Age in Temelec
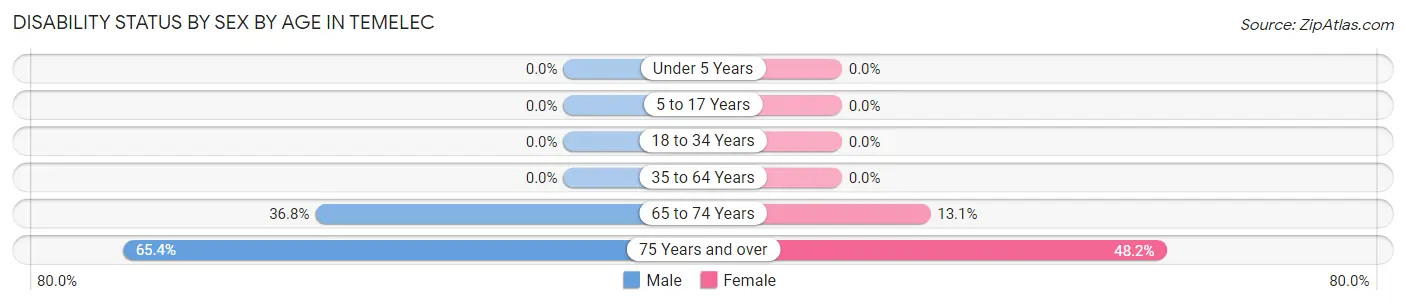
| Age Bracket | Male | Female |
| Under 5 Years | 0 (0.0%) | 0 (0.0%) |
| 5 to 17 Years | 0 (0.0%) | 0 (0.0%) |
| 18 to 34 Years | 0 (0.0%) | 0 (0.0%) |
| 35 to 64 Years | 0 (0.0%) | 0 (0.0%) |
| 65 to 74 Years | 112 (36.8%) | 46 (13.1%) |
| 75 Years and over | 229 (65.4%) | 200 (48.2%) |
Disability Class by Sex by Age in Temelec
Disability Class: Hearing Difficulty
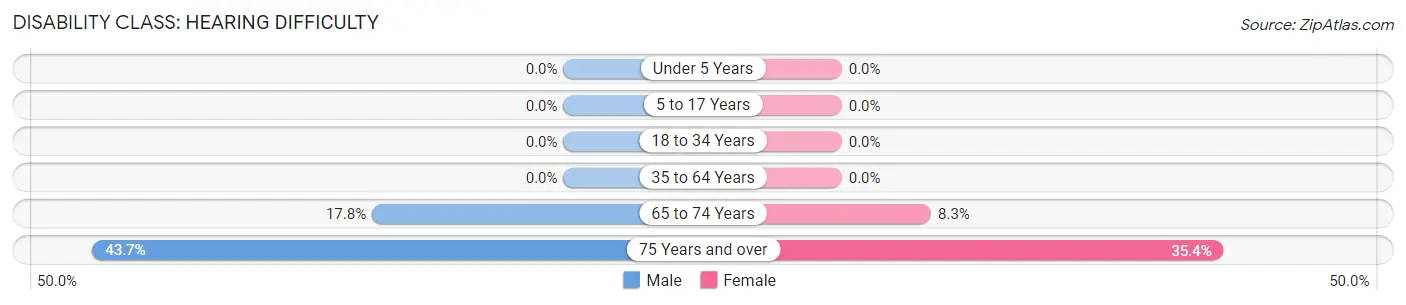
| Age Bracket | Male | Female |
| Under 5 Years | 0 (0.0%) | 0 (0.0%) |
| 5 to 17 Years | 0 (0.0%) | 0 (0.0%) |
| 18 to 34 Years | 0 (0.0%) | 0 (0.0%) |
| 35 to 64 Years | 0 (0.0%) | 0 (0.0%) |
| 65 to 74 Years | 54 (17.8%) | 29 (8.3%) |
| 75 Years and over | 153 (43.7%) | 147 (35.4%) |
Disability Class: Vision Difficulty
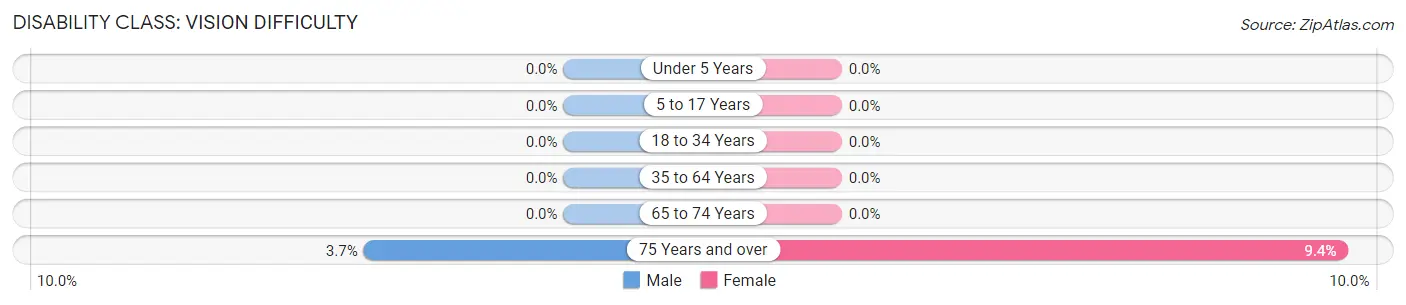
| Age Bracket | Male | Female |
| Under 5 Years | 0 (0.0%) | 0 (0.0%) |
| 5 to 17 Years | 0 (0.0%) | 0 (0.0%) |
| 18 to 34 Years | 0 (0.0%) | 0 (0.0%) |
| 35 to 64 Years | 0 (0.0%) | 0 (0.0%) |
| 65 to 74 Years | 0 (0.0%) | 0 (0.0%) |
| 75 Years and over | 13 (3.7%) | 39 (9.4%) |
Disability Class: Cognitive Difficulty
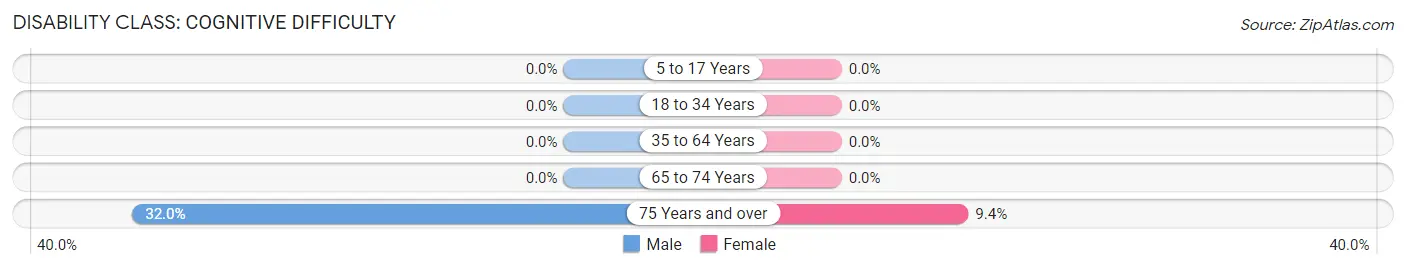
| Age Bracket | Male | Female |
| 5 to 17 Years | 0 (0.0%) | 0 (0.0%) |
| 18 to 34 Years | 0 (0.0%) | 0 (0.0%) |
| 35 to 64 Years | 0 (0.0%) | 0 (0.0%) |
| 65 to 74 Years | 0 (0.0%) | 0 (0.0%) |
| 75 Years and over | 112 (32.0%) | 39 (9.4%) |
Disability Class: Ambulatory Difficulty
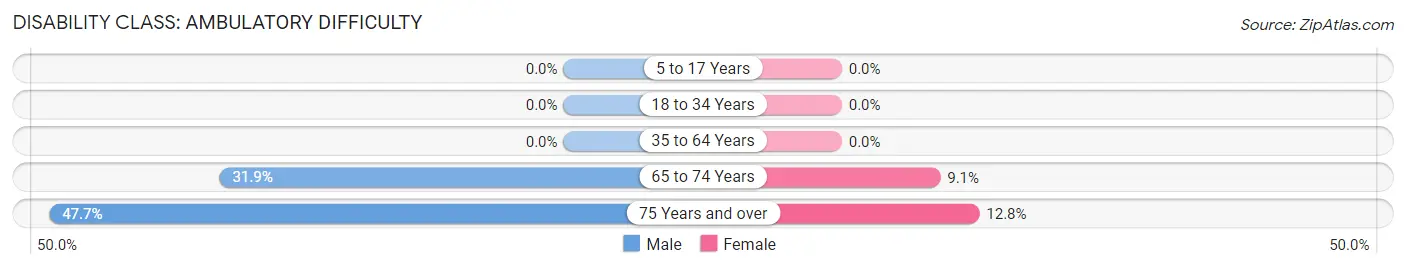
| Age Bracket | Male | Female |
| 5 to 17 Years | 0 (0.0%) | 0 (0.0%) |
| 18 to 34 Years | 0 (0.0%) | 0 (0.0%) |
| 35 to 64 Years | 0 (0.0%) | 0 (0.0%) |
| 65 to 74 Years | 97 (31.9%) | 32 (9.1%) |
| 75 Years and over | 167 (47.7%) | 53 (12.8%) |
Disability Class: Self-Care Difficulty
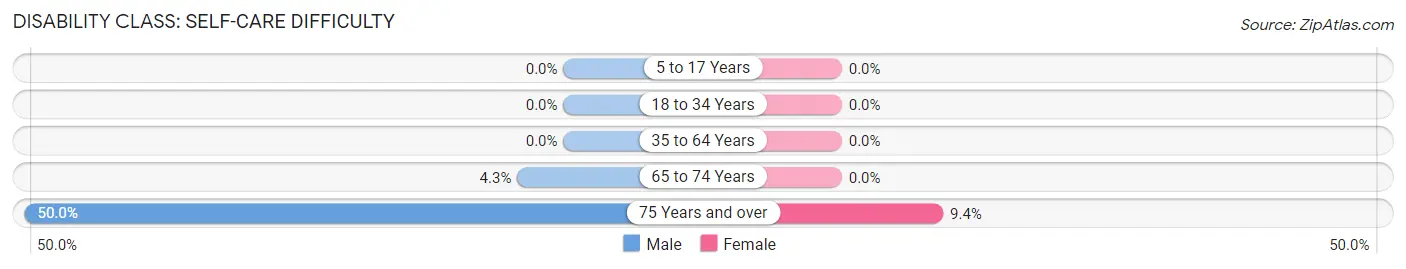
| Age Bracket | Male | Female |
| 5 to 17 Years | 0 (0.0%) | 0 (0.0%) |
| 18 to 34 Years | 0 (0.0%) | 0 (0.0%) |
| 35 to 64 Years | 0 (0.0%) | 0 (0.0%) |
| 65 to 74 Years | 13 (4.3%) | 0 (0.0%) |
| 75 Years and over | 175 (50.0%) | 39 (9.4%) |
Technology Access in Temelec
Computing Device Access in Temelec
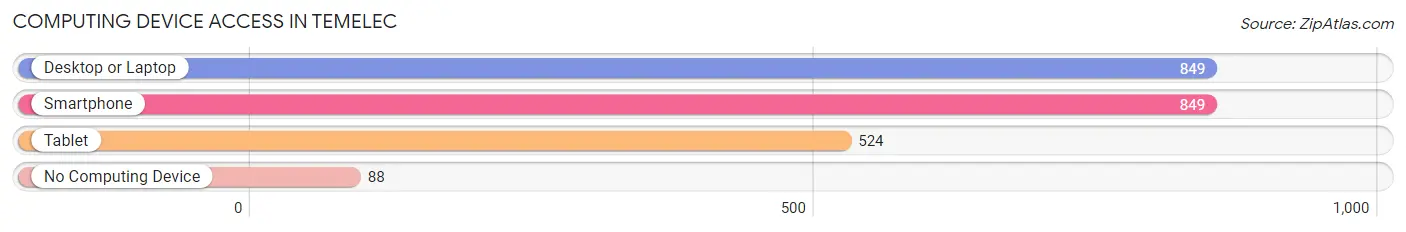
| Device Type | # Households | % Households |
| Desktop or Laptop | 849 | 81.4% |
| Smartphone | 849 | 81.4% |
| Tablet | 524 | 50.2% |
| No Computing Device | 88 | 8.4% |
| Total | 1,043 | 100.0% |
Internet Access in Temelec
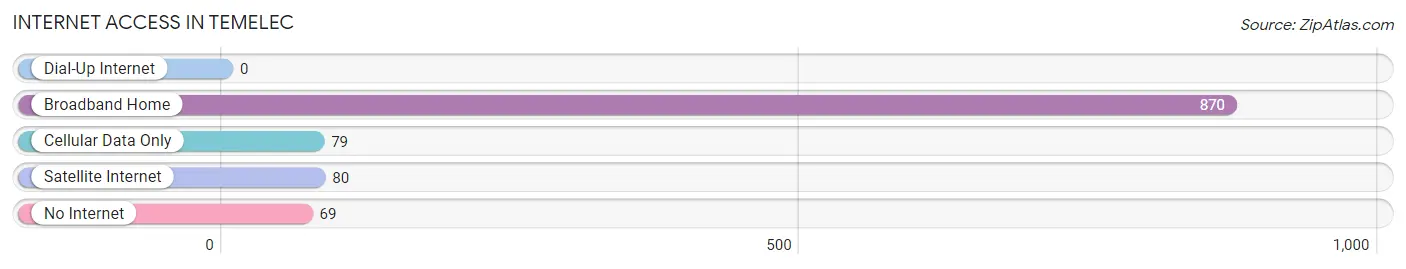
| Internet Type | # Households | % Households |
| Dial-Up Internet | 0 | 0.0% |
| Broadband Home | 870 | 83.4% |
| Cellular Data Only | 79 | 7.6% |
| Satellite Internet | 80 | 7.7% |
| No Internet | 69 | 6.6% |
| Total | 1,043 | 100.0% |
Temelec Summary
Temelec is a census-designated place (CDP) located in Sonoma County, California. It is situated in the heart of the Sonoma Valley, just north of the city of Sonoma. The population of Temelec was 1,845 at the 2010 census.
Geography
Temelec is located at 38°17'25" North, 122°27'45" West (38.290278, -122.4625). It is situated in the Sonoma Valley, just north of the city of Sonoma. The CDP has a total area of 1.2 square miles, all of which is land.
History
Temelec was originally inhabited by the Coast Miwok Native American tribe. The first European settlers arrived in the area in the early 19th century. The area was originally known as “Temelec”, which is derived from the Miwok word for “meeting place”.
In 1823, the Mexican government granted the land to Don Jose de Jesus Vallejo, who was the brother of General Mariano Vallejo. The Vallejo family owned the land until 1867, when it was sold to a group of settlers from the East Coast.
The settlers established a small farming community and named it “Temelec”. The community grew slowly over the years, and by the early 20th century, it had become a popular destination for tourists.
Economy
The economy of Temelec is largely based on agriculture and tourism. The area is home to several wineries, and the local economy is supported by the wine industry. The area is also popular with tourists, who come to enjoy the scenic beauty of the Sonoma Valley.
Demographics
As of the 2010 census, the population of Temelec was 1,845. The racial makeup of the CDP was 79.2% White, 0.7% African American, 0.7% Native American, 0.7% Asian, 0.1% Pacific Islander, 15.2% from other races, and 3.4% from two or more races. Hispanic or Latino of any race were 28.2% of the population.
The median household income in Temelec was $63,750, and the median family income was $71,250. The per capita income for the CDP was $31,945. About 8.2% of families and 11.2% of the population were below the poverty line, including 15.2% of those under age 18 and 4.2% of those age 65 or over.
Conclusion
Temelec is a small census-designated place located in Sonoma County, California. It is situated in the heart of the Sonoma Valley, just north of the city of Sonoma. The population of Temelec was 1,845 at the 2010 census. The economy of Temelec is largely based on agriculture and tourism, and the area is home to several wineries. The racial makeup of the CDP was 79.2% White, 0.7% African American, 0.7% Native American, 0.7% Asian, 0.1% Pacific Islander, 15.2% from other races, and 3.4% from two or more races. The median household income in Temelec was $63,750, and the median family income was $71,250. The per capita income for the CDP was $31,945.
Common Questions
What is Per Capita Income in Temelec?
Per Capita income in Temelec is $60,283.
What is the Median Family Income in Temelec?
Median Family Income in Temelec is $96,346.
What is the Median Household income in Temelec?
Median Household Income in Temelec is $66,773.
What is Inequality or Gini Index in Temelec?
Inequality or Gini Index in Temelec is 0.45.
What is the Total Population of Temelec?
Total Population of Temelec is 1,693.
What is the Total Male Population of Temelec?
Total Male Population of Temelec is 690.
What is the Total Female Population of Temelec?
Total Female Population of Temelec is 1,003.
What is the Ratio of Males per 100 Females in Temelec?
There are 68.79 Males per 100 Females in Temelec.
What is the Ratio of Females per 100 Males in Temelec?
There are 145.36 Females per 100 Males in Temelec.
What is the Median Population Age in Temelec?
Median Population Age in Temelec is 74.1 Years.
What is the Average Family Size in Temelec
Average Family Size in Temelec is 2.2 People.
What is the Average Household Size in Temelec
Average Household Size in Temelec is 1.6 People.
How Large is the Labor Force in Temelec?
There are 521 People in the Labor Forcein in Temelec.
What is the Percentage of People in the Labor Force in Temelec?
30.8% of People are in the Labor Force in Temelec.
What is the Unemployment Rate in Temelec?
Unemployment Rate in Temelec is 20.3%.