Cities with the Lowest Poverty Level Among Seniors Over the Age of 75 in Alaska
RELATED REPORTS & OPTIONS
Lowest Poverty | Seniors 75+
Alaska
Compare Cities
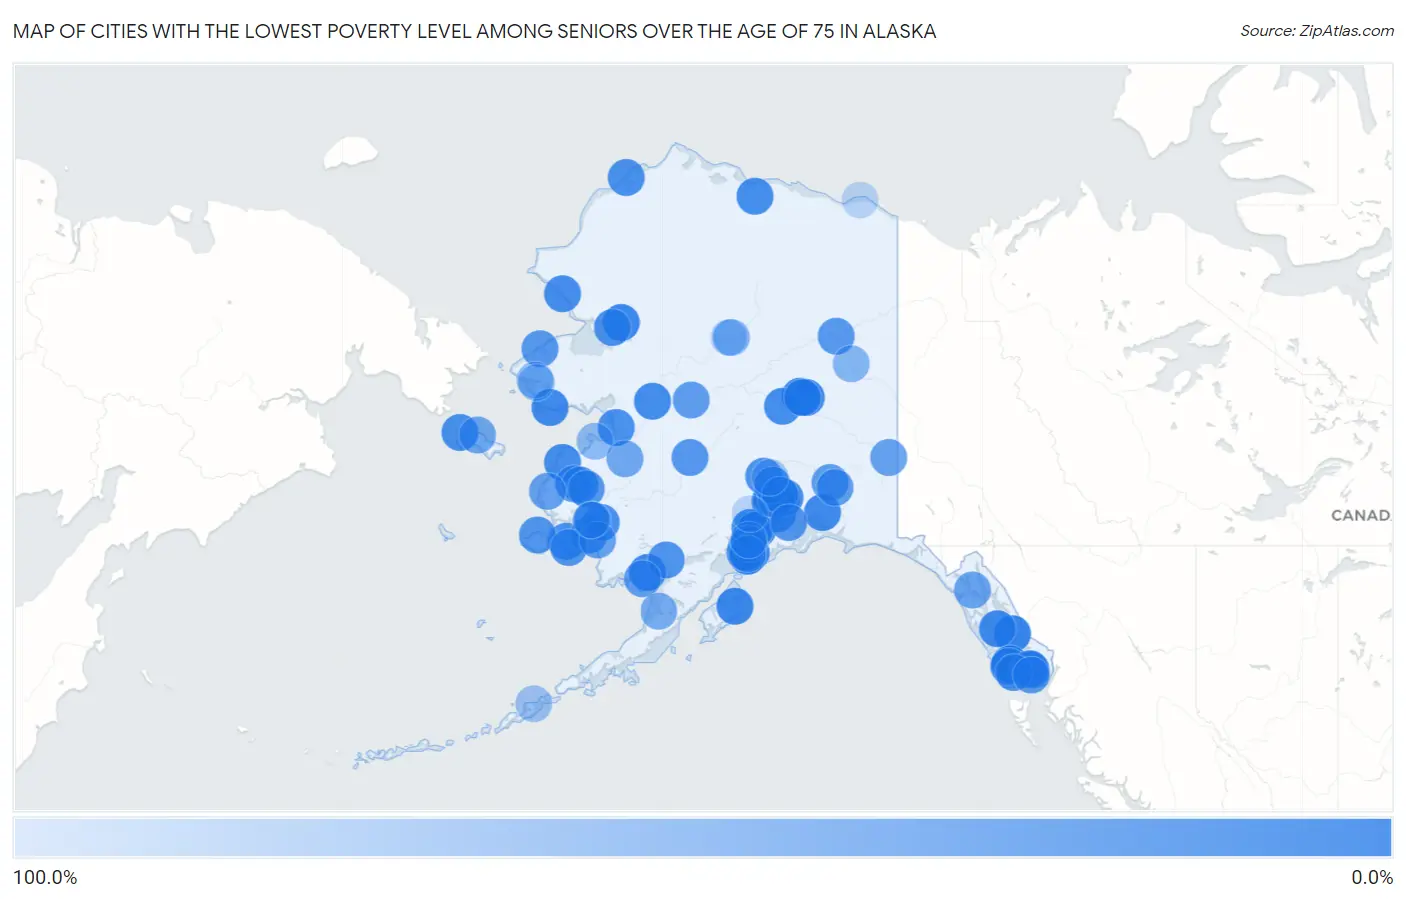
Map of Cities with the Lowest Poverty Level Among Seniors Over the Age of 75 in Alaska
100.0%
0.0%
Cities with the Lowest Poverty Level Among Seniors Over the Age of 75 in Alaska
| City | Senior Poverty | vs State | vs National | |
| 1. | Petersburg | 1.5% | 8.1%(-6.58)#1 | 11.1%(-9.54)#303 |
| 2. | Sterling | 2.3% | 8.1%(-5.81)#2 | 11.1%(-8.77)#717 |
| 3. | Meadow Lakes | 2.6% | 8.1%(-5.53)#3 | 11.1%(-8.50)#908 |
| 4. | Sitka City And Borough | 2.9% | 8.1%(-5.19)#4 | 11.1%(-8.15)#1,172 |
| 5. | Klawock | 3.0% | 8.1%(-5.12)#5 | 11.1%(-8.08)#1,226 |
| 6. | Tanaina | 3.6% | 8.1%(-4.46)#6 | 11.1%(-7.42)#1,818 |
| 7. | Kenai | 3.9% | 8.1%(-4.25)#7 | 11.1%(-7.21)#2,038 |
| 8. | Juneau City And Borough | 4.1% | 8.1%(-4.01)#8 | 11.1%(-6.97)#2,279 |
| 9. | Kodiak | 4.5% | 8.1%(-3.56)#9 | 11.1%(-6.52)#2,717 |
| 10. | Kiana | 4.8% | 8.1%(-3.34)#10 | 11.1%(-6.31)#2,955 |
| 11. | Wrangell City And Borough | 5.2% | 8.1%(-2.86)#11 | 11.1%(-5.82)#3,432 |
| 12. | Kachemak | 5.4% | 8.1%(-2.75)#12 | 11.1%(-5.71)#3,570 |
| 13. | Fritz Creek | 5.5% | 8.1%(-2.59)#13 | 11.1%(-5.56)#3,703 |
| 14. | Valdez | 5.7% | 8.1%(-2.39)#14 | 11.1%(-5.35)#3,927 |
| 15. | Big Lake | 6.0% | 8.1%(-2.14)#15 | 11.1%(-5.10)#4,218 |
| 16. | Kake | 6.1% | 8.1%(-2.05)#16 | 11.1%(-5.01)#4,330 |
| 17. | College | 6.2% | 8.1%(-1.94)#17 | 11.1%(-4.90)#4,441 |
| 18. | Badger | 6.5% | 8.1%(-1.60)#18 | 11.1%(-4.56)#4,826 |
| 19. | Nome | 6.8% | 8.1%(-1.33)#19 | 11.1%(-4.29)#5,100 |
| 20. | Homer | 6.9% | 8.1%(-1.16)#20 | 11.1%(-4.12)#5,283 |
| 21. | Farm Loop | 7.1% | 8.1%(-1.03)#21 | 11.1%(-4.00)#5,390 |
| 22. | Dillingham | 7.3% | 8.1%(-0.833)#22 | 11.1%(-3.79)#5,593 |
| 23. | Knik Fairview | 7.8% | 8.1%(-0.348)#23 | 11.1%(-3.31)#6,071 |
| 24. | Happy Valley | 7.9% | 8.1%(-0.169)#24 | 11.1%(-3.13)#6,212 |
| 25. | North Lakes | 8.3% | 8.1%(+0.204)#25 | 11.1%(-2.76)#6,556 |
| 26. | Cohoe | 9.1% | 8.1%(+0.985)#26 | 11.1%(-1.98)#7,305 |
| 27. | Nulato | 9.1% | 8.1%(+0.985)#27 | 11.1%(-1.98)#7,371 |
| 28. | Anchorage | 9.6% | 8.1%(+1.45)#28 | 11.1%(-1.51)#7,801 |
| 29. | Soldotna | 9.7% | 8.1%(+1.55)#29 | 11.1%(-1.41)#7,877 |
| 30. | Kalifornsky | 10.0% | 8.1%(+1.87)#30 | 11.1%(-1.09)#8,130 |
| 31. | South Lakes | 10.1% | 8.1%(+1.95)#31 | 11.1%(-1.01)#8,289 |
| 32. | Saxman | 10.2% | 8.1%(+2.10)#32 | 11.1%(-0.863)#8,404 |
| 33. | Salamatof | 10.3% | 8.1%(+2.24)#33 | 11.1%(-0.722)#8,520 |
| 34. | Ridgeway | 10.6% | 8.1%(+2.48)#34 | 11.1%(-0.485)#8,767 |
| 35. | Nenana | 10.7% | 8.1%(+2.61)#35 | 11.1%(-0.353)#8,872 |
| 36. | Nuiqsut | 11.1% | 8.1%(+3.01)#36 | 11.1%(+0.044)#9,229 |
| 37. | Palmer | 11.6% | 8.1%(+3.48)#37 | 11.1%(+0.522)#9,625 |
| 38. | Emmonak | 11.8% | 8.1%(+3.66)#38 | 11.1%(+0.698)#9,752 |
| 39. | Fairbanks | 11.8% | 8.1%(+3.68)#39 | 11.1%(+0.719)#9,801 |
| 40. | Gambell | 12.5% | 8.1%(+4.39)#40 | 11.1%(+1.43)#10,347 |
| 41. | Lazy Mountain | 12.7% | 8.1%(+4.59)#41 | 11.1%(+1.63)#10,533 |
| 42. | Houston | 13.0% | 8.1%(+4.86)#42 | 11.1%(+1.90)#10,737 |
| 43. | Anchor Point | 13.0% | 8.1%(+4.89)#43 | 11.1%(+1.93)#10,767 |
| 44. | Kivalina | 13.3% | 8.1%(+5.23)#44 | 11.1%(+2.27)#11,006 |
| 45. | Craig | 14.3% | 8.1%(+6.18)#45 | 11.1%(+3.22)#11,641 |
| 46. | Chefornak | 14.3% | 8.1%(+6.18)#46 | 11.1%(+3.22)#11,668 |
| 47. | Ketchikan | 14.8% | 8.1%(+6.69)#47 | 11.1%(+3.73)#12,017 |
| 48. | Unalakleet | 14.8% | 8.1%(+6.71)#48 | 11.1%(+3.75)#12,043 |
| 49. | Tuntutuliak | 15.8% | 8.1%(+7.68)#49 | 11.1%(+4.72)#12,573 |
| 50. | Noorvik | 15.8% | 8.1%(+7.68)#50 | 11.1%(+4.72)#12,575 |
| 51. | Bethel | 16.1% | 8.1%(+7.97)#51 | 11.1%(+5.00)#12,720 |
| 52. | Wainwright | 16.7% | 8.1%(+8.56)#52 | 11.1%(+5.60)#13,029 |
| 53. | Mountain Village | 17.2% | 8.1%(+9.14)#53 | 11.1%(+6.17)#13,342 |
| 54. | Trapper Creek | 17.2% | 8.1%(+9.14)#54 | 11.1%(+6.17)#13,352 |
| 55. | Hydaburg | 18.2% | 8.1%(+10.1)#55 | 11.1%(+7.11)#13,786 |
| 56. | Wasilla | 18.4% | 8.1%(+10.3)#56 | 11.1%(+7.32)#13,896 |
| 57. | New Stuyahok | 20.0% | 8.1%(+11.9)#57 | 11.1%(+8.93)#14,531 |
| 58. | Mekoryuk | 21.1% | 8.1%(+12.9)#58 | 11.1%(+9.99)#14,957 |
| 59. | Kipnuk | 21.4% | 8.1%(+13.3)#59 | 11.1%(+10.4)#15,056 |
| 60. | Susitna North | 21.6% | 8.1%(+13.5)#60 | 11.1%(+10.5)#15,104 |
| 61. | Ninilchik | 21.9% | 8.1%(+13.8)#61 | 11.1%(+10.9)#15,217 |
| 62. | St Mary S | 22.2% | 8.1%(+14.1)#62 | 11.1%(+11.2)#15,291 |
| 63. | Pilot Station | 22.2% | 8.1%(+14.1)#63 | 11.1%(+11.2)#15,309 |
| 64. | Fishhook | 22.4% | 8.1%(+14.3)#64 | 11.1%(+11.4)#15,385 |
| 65. | Shishmaref | 25.0% | 8.1%(+16.9)#65 | 11.1%(+13.9)#16,052 |
| 66. | Whittier | 25.0% | 8.1%(+16.9)#66 | 11.1%(+13.9)#16,069 |
| 67. | Mcgrath | 25.0% | 8.1%(+16.9)#67 | 11.1%(+13.9)#16,094 |
| 68. | Fort Yukon | 26.2% | 8.1%(+18.1)#68 | 11.1%(+15.1)#16,374 |
| 69. | Metlakatla | 27.9% | 8.1%(+19.8)#69 | 11.1%(+16.9)#16,730 |
| 70. | Nunapitchuk | 28.0% | 8.1%(+19.9)#70 | 11.1%(+16.9)#16,741 |
| 71. | Glennallen | 31.0% | 8.1%(+22.9)#71 | 11.1%(+20.0)#17,247 |
| 72. | Copper Center | 31.2% | 8.1%(+23.1)#72 | 11.1%(+20.2)#17,277 |
| 73. | Diamond Ridge | 31.7% | 8.1%(+23.6)#73 | 11.1%(+20.6)#17,324 |
| 74. | Manokotak | 33.3% | 8.1%(+25.2)#74 | 11.1%(+22.3)#17,510 |
| 75. | Ruby | 33.3% | 8.1%(+25.2)#75 | 11.1%(+22.3)#17,581 |
| 76. | Scammon Bay | 36.4% | 8.1%(+28.3)#76 | 11.1%(+25.3)#17,918 |
| 77. | Eek | 36.4% | 8.1%(+28.3)#77 | 11.1%(+25.3)#17,919 |
| 78. | Northway | 37.1% | 8.1%(+29.0)#78 | 11.1%(+26.1)#17,989 |
| 79. | Gustavus | 40.4% | 8.1%(+32.2)#79 | 11.1%(+29.3)#18,325 |
| 80. | Savoonga | 42.4% | 8.1%(+34.3)#80 | 11.1%(+31.4)#18,472 |
| 81. | Grayling | 43.8% | 8.1%(+35.6)#81 | 11.1%(+32.7)#18,585 |
| 82. | Kasigluk | 50.0% | 8.1%(+41.9)#82 | 11.1%(+38.9)#18,920 |
| 83. | Allakaket | 50.0% | 8.1%(+41.9)#83 | 11.1%(+38.9)#18,952 |
| 84. | Pilot Point | 50.0% | 8.1%(+41.9)#84 | 11.1%(+38.9)#19,011 |
| 85. | Circle | 61.5% | 8.1%(+53.4)#85 | 11.1%(+50.5)#19,405 |
| 86. | Stebbins | 66.7% | 8.1%(+58.6)#86 | 11.1%(+55.6)#19,496 |
| 87. | Brevig Mission | 66.7% | 8.1%(+58.6)#87 | 11.1%(+55.6)#19,497 |
| 88. | Clam Gulch | 66.7% | 8.1%(+58.6)#88 | 11.1%(+55.6)#19,508 |
| 89. | Unalaska | 76.5% | 8.1%(+68.4)#89 | 11.1%(+65.4)#19,666 |
| 90. | Teller | 78.6% | 8.1%(+70.5)#90 | 11.1%(+67.5)#19,694 |
| 91. | Talkeetna | 81.8% | 8.1%(+73.7)#91 | 11.1%(+70.8)#19,724 |
| 92. | Tyonek | 100.0% | 8.1%(+91.9)#92 | 11.1%(+88.9)#19,945 |
| 93. | Kaktovik | 100.0% | 8.1%(+91.9)#93 | 11.1%(+88.9)#19,981 |
| 94. | Alatna | 100.0% | 8.1%(+91.9)#94 | 11.1%(+88.9)#20,158 |
Common Questions
What are the Top 10 Cities with the Lowest Poverty Level Among Seniors Over the Age of 75 in Alaska?
Top 10 Cities with the Lowest Poverty Level Among Seniors Over the Age of 75 in Alaska are:
#1
0.0%
#2
0.0%
#3
0.0%
#4
0.0%
#5
0.0%
#6
1.5%
#7
2.3%
#8
2.6%
#9
3.0%
#10
3.6%
What city has the Lowest Poverty Level Among Seniors Over the Age of 75 in Alaska?
Petersburg has the Lowest Poverty Level Among Seniors Over the Age of 75 in Alaska with 1.5%.
What is the Poverty Level Among Seniors Over the Age of 75 in the State of Alaska?
Poverty Level Among Seniors Over the Age of 75 in Alaska is 8.1%.
What is the Poverty Level Among Seniors Over the Age of 75 in the United States?
Poverty Level Among Seniors Over the Age of 75 in the United States is 11.1%.