Cities with the Lowest Poverty Level Among Seniors Over the Age of 75 in Utah
RELATED REPORTS & OPTIONS
Lowest Poverty | Seniors 75+
Utah
Compare Cities
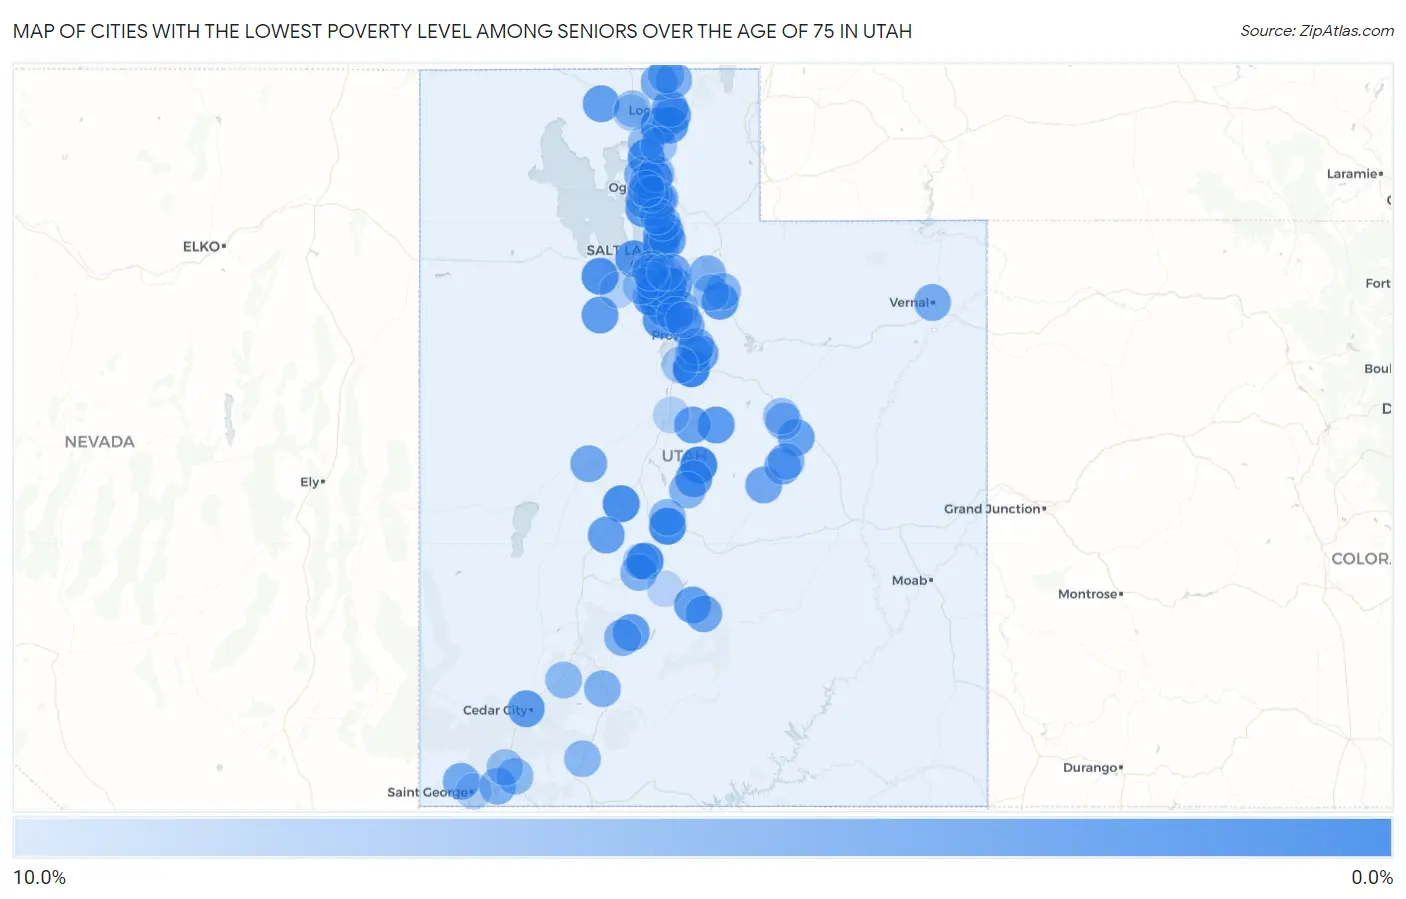
Map of Cities with the Lowest Poverty Level Among Seniors Over the Age of 75 in Utah
10.0%
0.0%
Cities with the Lowest Poverty Level Among Seniors Over the Age of 75 in Utah
| City | Senior Poverty | vs State | vs National | |
| 1. | Woodland Hills | 1.1% | 7.5%(-6.40)#1 | 11.1%(-9.97)#157 |
| 2. | Ephraim | 1.6% | 7.5%(-5.89)#2 | 11.1%(-9.45)#341 |
| 3. | Salina | 1.7% | 7.5%(-5.78)#3 | 11.1%(-9.34)#392 |
| 4. | Annabella | 1.8% | 7.5%(-5.68)#4 | 11.1%(-9.25)#431 |
| 5. | Wellsville | 2.0% | 7.5%(-5.52)#5 | 11.1%(-9.09)#507 |
| 6. | Centerville | 2.2% | 7.5%(-5.32)#6 | 11.1%(-8.89)#647 |
| 7. | Holden | 2.3% | 7.5%(-5.23)#7 | 11.1%(-8.79)#706 |
| 8. | Willard | 2.3% | 7.5%(-5.16)#8 | 11.1%(-8.72)#745 |
| 9. | Bluffdale | 2.4% | 7.5%(-5.11)#9 | 11.1%(-8.67)#773 |
| 10. | Grantsville | 2.5% | 7.5%(-5.00)#10 | 11.1%(-8.57)#854 |
| 11. | Magna | 2.9% | 7.5%(-4.60)#11 | 11.1%(-8.17)#1,158 |
| 12. | Saratoga Springs | 3.0% | 7.5%(-4.51)#12 | 11.1%(-8.07)#1,237 |
| 13. | Harrisville | 3.1% | 7.5%(-4.41)#13 | 11.1%(-7.98)#1,315 |
| 14. | Daniel | 3.3% | 7.5%(-4.22)#14 | 11.1%(-7.79)#1,483 |
| 15. | West Bountiful | 3.4% | 7.5%(-4.08)#15 | 11.1%(-7.65)#1,610 |
| 16. | Fairview | 3.4% | 7.5%(-4.05)#16 | 11.1%(-7.62)#1,631 |
| 17. | Granite | 3.4% | 7.5%(-4.05)#17 | 11.1%(-7.62)#1,636 |
| 18. | Syracuse | 3.5% | 7.5%(-4.00)#18 | 11.1%(-7.56)#1,677 |
| 19. | Cedar City | 3.5% | 7.5%(-3.96)#19 | 11.1%(-7.53)#1,703 |
| 20. | Manti | 3.6% | 7.5%(-3.94)#20 | 11.1%(-7.51)#1,718 |
| 21. | Rush Valley | 3.7% | 7.5%(-3.80)#21 | 11.1%(-7.36)#1,877 |
| 22. | Providence | 3.8% | 7.5%(-3.74)#22 | 11.1%(-7.31)#1,918 |
| 23. | Kingston | 3.8% | 7.5%(-3.70)#23 | 11.1%(-7.27)#1,976 |
| 24. | Hyrum | 3.8% | 7.5%(-3.67)#24 | 11.1%(-7.23)#1,997 |
| 25. | Loa | 3.8% | 7.5%(-3.65)#25 | 11.1%(-7.22)#2,015 |
| 26. | Howell | 3.8% | 7.5%(-3.65)#26 | 11.1%(-7.22)#2,022 |
| 27. | Lehi | 3.9% | 7.5%(-3.60)#27 | 11.1%(-7.17)#2,071 |
| 28. | Riverton | 3.9% | 7.5%(-3.60)#28 | 11.1%(-7.17)#2,074 |
| 29. | Mapleton | 4.0% | 7.5%(-3.51)#29 | 11.1%(-7.08)#2,158 |
| 30. | Meadow | 4.2% | 7.5%(-3.33)#30 | 11.1%(-6.90)#2,357 |
| 31. | Herriman | 4.2% | 7.5%(-3.30)#31 | 11.1%(-6.86)#2,389 |
| 32. | Fountain Green | 4.3% | 7.5%(-3.24)#32 | 11.1%(-6.81)#2,436 |
| 33. | Wellington | 4.4% | 7.5%(-3.11)#33 | 11.1%(-6.68)#2,571 |
| 34. | Draper | 4.4% | 7.5%(-3.08)#34 | 11.1%(-6.64)#2,609 |
| 35. | North Salt Lake | 4.5% | 7.5%(-3.00)#35 | 11.1%(-6.56)#2,680 |
| 36. | Cedar Hills | 4.6% | 7.5%(-2.93)#36 | 11.1%(-6.49)#2,773 |
| 37. | Logan | 4.7% | 7.5%(-2.76)#37 | 11.1%(-6.33)#2,914 |
| 38. | Bountiful | 4.7% | 7.5%(-2.76)#38 | 11.1%(-6.33)#2,920 |
| 39. | South Jordan | 4.8% | 7.5%(-2.72)#39 | 11.1%(-6.29)#2,983 |
| 40. | Delta | 4.8% | 7.5%(-2.72)#40 | 11.1%(-6.28)#2,988 |
| 41. | Taylorsville | 4.8% | 7.5%(-2.71)#41 | 11.1%(-6.28)#2,990 |
| 42. | Castle Dale | 4.8% | 7.5%(-2.69)#42 | 11.1%(-6.26)#3,001 |
| 43. | Holladay | 4.8% | 7.5%(-2.67)#43 | 11.1%(-6.24)#3,030 |
| 44. | Orem | 4.9% | 7.5%(-2.64)#44 | 11.1%(-6.21)#3,053 |
| 45. | South Weber | 4.9% | 7.5%(-2.57)#45 | 11.1%(-6.14)#3,119 |
| 46. | Bicknell | 5.0% | 7.5%(-2.50)#46 | 11.1%(-6.07)#3,209 |
| 47. | Layton | 5.0% | 7.5%(-2.49)#47 | 11.1%(-6.06)#3,232 |
| 48. | Roy | 5.2% | 7.5%(-2.34)#48 | 11.1%(-5.91)#3,366 |
| 49. | Ivins | 5.2% | 7.5%(-2.33)#49 | 11.1%(-5.90)#3,371 |
| 50. | Sandy | 5.2% | 7.5%(-2.32)#50 | 11.1%(-5.89)#3,385 |
| 51. | Vernal | 5.2% | 7.5%(-2.25)#51 | 11.1%(-5.82)#3,435 |
| 52. | Clinton | 5.3% | 7.5%(-2.23)#52 | 11.1%(-5.80)#3,505 |
| 53. | Trenton | 5.4% | 7.5%(-2.09)#53 | 11.1%(-5.66)#3,609 |
| 54. | Cleveland | 5.4% | 7.5%(-2.09)#54 | 11.1%(-5.66)#3,611 |
| 55. | Spanish Fork | 5.6% | 7.5%(-1.89)#55 | 11.1%(-5.46)#3,828 |
| 56. | Uintah | 5.7% | 7.5%(-1.84)#56 | 11.1%(-5.41)#3,884 |
| 57. | Washington Terrace | 5.7% | 7.5%(-1.83)#57 | 11.1%(-5.40)#3,897 |
| 58. | Richmond | 5.7% | 7.5%(-1.75)#58 | 11.1%(-5.32)#3,974 |
| 59. | Monroe | 5.8% | 7.5%(-1.75)#59 | 11.1%(-5.32)#3,980 |
| 60. | Hurricane | 5.8% | 7.5%(-1.71)#60 | 11.1%(-5.28)#4,015 |
| 61. | Park City | 5.8% | 7.5%(-1.66)#61 | 11.1%(-5.23)#4,058 |
| 62. | Plain City | 5.9% | 7.5%(-1.64)#62 | 11.1%(-5.21)#4,084 |
| 63. | Circleville | 5.9% | 7.5%(-1.62)#63 | 11.1%(-5.18)#4,131 |
| 64. | Springville | 5.9% | 7.5%(-1.60)#64 | 11.1%(-5.17)#4,155 |
| 65. | American Fork | 6.0% | 7.5%(-1.50)#65 | 11.1%(-5.07)#4,247 |
| 66. | Panguitch | 6.0% | 7.5%(-1.50)#66 | 11.1%(-5.07)#4,255 |
| 67. | Elmo | 6.1% | 7.5%(-1.44)#67 | 11.1%(-5.01)#4,329 |
| 68. | Spring Glen | 6.2% | 7.5%(-1.30)#68 | 11.1%(-4.87)#4,462 |
| 69. | Sterling | 6.2% | 7.5%(-1.25)#69 | 11.1%(-4.82)#4,558 |
| 70. | Farmington | 6.3% | 7.5%(-1.21)#70 | 11.1%(-4.78)#4,592 |
| 71. | Redmond | 6.5% | 7.5%(-1.05)#71 | 11.1%(-4.62)#4,753 |
| 72. | Glendale | 6.5% | 7.5%(-1.05)#72 | 11.1%(-4.62)#4,767 |
| 73. | Virgin | 6.5% | 7.5%(-0.978)#73 | 11.1%(-4.55)#4,843 |
| 74. | Heber | 6.5% | 7.5%(-0.967)#74 | 11.1%(-4.53)#4,850 |
| 75. | Paragonah | 6.6% | 7.5%(-0.920)#75 | 11.1%(-4.49)#4,892 |
| 76. | Lewiston | 6.7% | 7.5%(-0.833)#76 | 11.1%(-4.40)#4,952 |
| 77. | Marriott Slaterville | 6.8% | 7.5%(-0.703)#77 | 11.1%(-4.27)#5,113 |
| 78. | North Ogden | 6.9% | 7.5%(-0.590)#78 | 11.1%(-4.16)#5,249 |
| 79. | Toquerville | 7.3% | 7.5%(-0.227)#79 | 11.1%(-3.79)#5,594 |
| 80. | Brigham City | 7.3% | 7.5%(-0.162)#80 | 11.1%(-3.73)#5,653 |
| 81. | Midway | 7.3% | 7.5%(-0.160)#81 | 11.1%(-3.73)#5,655 |
| 82. | Garland | 7.4% | 7.5%(-0.146)#82 | 11.1%(-3.71)#5,667 |
| 83. | West Valley City | 7.6% | 7.5%(+0.077)#83 | 11.1%(-3.49)#5,884 |
| 84. | Mantua | 7.7% | 7.5%(+0.193)#84 | 11.1%(-3.37)#5,970 |
| 85. | Copperton | 7.7% | 7.5%(+0.193)#85 | 11.1%(-3.37)#5,981 |
| 86. | Helper | 7.8% | 7.5%(+0.273)#86 | 11.1%(-3.29)#6,083 |
| 87. | Payson | 7.9% | 7.5%(+0.360)#87 | 11.1%(-3.21)#6,150 |
| 88. | West Jordan | 8.1% | 7.5%(+0.574)#88 | 11.1%(-2.99)#6,352 |
| 89. | Lindon | 8.1% | 7.5%(+0.649)#89 | 11.1%(-2.92)#6,417 |
| 90. | Central Valley | 8.3% | 7.5%(+0.834)#90 | 11.1%(-2.73)#6,602 |
| 91. | Kearns | 8.7% | 7.5%(+1.16)#91 | 11.1%(-2.41)#6,927 |
| 92. | Murray | 8.8% | 7.5%(+1.29)#92 | 11.1%(-2.28)#7,057 |
| 93. | Riverdale | 8.8% | 7.5%(+1.35)#93 | 11.1%(-2.22)#7,111 |
| 94. | Tremonton | 8.9% | 7.5%(+1.36)#94 | 11.1%(-2.20)#7,129 |
| 95. | St George | 8.9% | 7.5%(+1.38)#95 | 11.1%(-2.19)#7,145 |
| 96. | Nephi | 9.0% | 7.5%(+1.52)#96 | 11.1%(-2.04)#7,256 |
| 97. | Tooele | 9.1% | 7.5%(+1.62)#97 | 11.1%(-1.94)#7,420 |
| 98. | Kaysville | 9.3% | 7.5%(+1.80)#98 | 11.1%(-1.77)#7,548 |
| 99. | Koosharem | 9.4% | 7.5%(+1.88)#99 | 11.1%(-1.69)#7,635 |
| 100. | West Haven | 9.4% | 7.5%(+1.89)#100 | 11.1%(-1.67)#7,642 |
Common Questions
What are the Top 10 Cities with the Lowest Poverty Level Among Seniors Over the Age of 75 in Utah?
Top 10 Cities with the Lowest Poverty Level Among Seniors Over the Age of 75 in Utah are:
#1
1.1%
#2
1.6%
#3
1.7%
#4
1.8%
#5
2.0%
#6
2.2%
#7
2.3%
#8
2.3%
#9
2.4%
#10
2.5%
What city has the Lowest Poverty Level Among Seniors Over the Age of 75 in Utah?
Woodland Hills has the Lowest Poverty Level Among Seniors Over the Age of 75 in Utah with 1.1%.
What is the Poverty Level Among Seniors Over the Age of 75 in the State of Utah?
Poverty Level Among Seniors Over the Age of 75 in Utah is 7.5%.
What is the Poverty Level Among Seniors Over the Age of 75 in the United States?
Poverty Level Among Seniors Over the Age of 75 in the United States is 11.1%.