Lake Sherwood, CA Map & Demographics
Lake Sherwood Map
Lake Sherwood Overview
$143,678
PER CAPITA INCOME
$234,263
AVG FAMILY INCOME
$233,462
AVG HOUSEHOLD INCOME
0.52
INEQUALITY / GINI INDEX
1,617
TOTAL POPULATION
787
MALE POPULATION
830
FEMALE POPULATION
94.82
MALES / 100 FEMALES
105.46
FEMALES / 100 MALES
55.9
MEDIAN AGE
2.8
AVG FAMILY SIZE
2.6
AVG HOUSEHOLD SIZE
733
LABOR FORCE [ PEOPLE ]
49.9%
PERCENT IN LABOR FORCE
7.1%
UNEMPLOYMENT RATE
Income in Lake Sherwood
Income Overview in Lake Sherwood
Per Capita Income in Lake Sherwood is $143,678, while median incomes of families and households are $234,263 and $233,462 respectively.
| Characteristic | Number | Measure |
| Per Capita Income | 1,617 | $143,678 |
| Median Family Income | 519 | $234,263 |
| Mean Family Income | 519 | $393,915 |
| Median Household Income | 616 | $233,462 |
| Mean Household Income | 616 | $366,673 |
| Income Deficit | 519 | $0 |
| Wage / Income Gap (%) | 1,617 | 0.00% |
| Wage / Income Gap ($) | 1,617 | 100.00¢ per $1 |
| Gini / Inequality Index | 1,617 | 0.52 |
Earnings by Sex in Lake Sherwood

| Sex | Number | Average Earnings |
| Male | 500 (70.4%) | $0 |
| Female | 210 (29.6%) | $55,167 |
| Total | 710 (100.0%) | $75,588 |
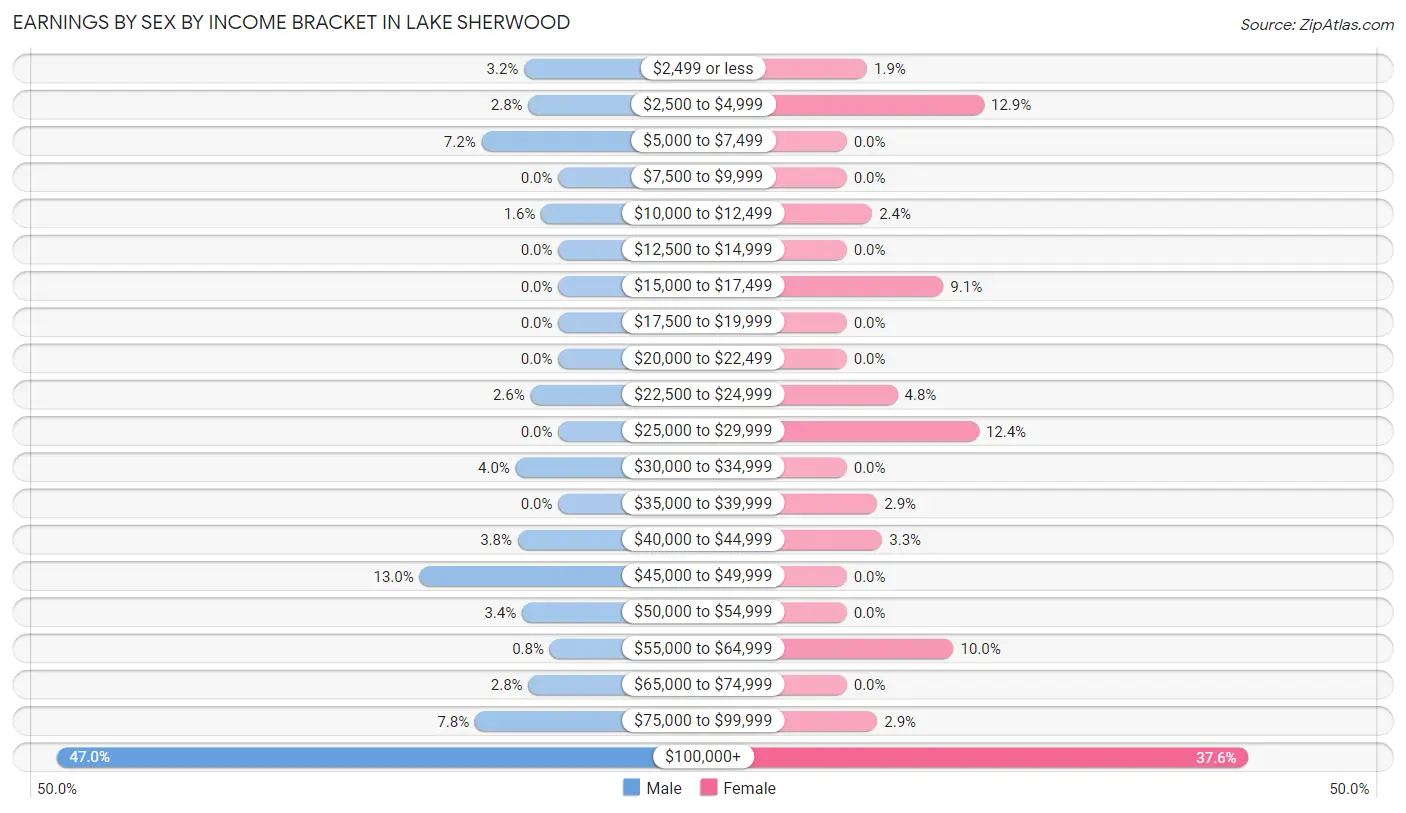
Earnings by Sex by Income Bracket in Lake Sherwood
The most common earnings brackets in Lake Sherwood are $100,000+ for men (235 | 47.0%) and $100,000+ for women (79 | 37.6%).
| Income | Male | Female |
| $2,499 or less | 16 (3.2%) | 4 (1.9%) |
| $2,500 to $4,999 | 14 (2.8%) | 27 (12.9%) |
| $5,000 to $7,499 | 36 (7.2%) | 0 (0.0%) |
| $7,500 to $9,999 | 0 (0.0%) | 0 (0.0%) |
| $10,000 to $12,499 | 8 (1.6%) | 5 (2.4%) |
| $12,500 to $14,999 | 0 (0.0%) | 0 (0.0%) |
| $15,000 to $17,499 | 0 (0.0%) | 19 (9.0%) |
| $17,500 to $19,999 | 0 (0.0%) | 0 (0.0%) |
| $20,000 to $22,499 | 0 (0.0%) | 0 (0.0%) |
| $22,500 to $24,999 | 13 (2.6%) | 10 (4.8%) |
| $25,000 to $29,999 | 0 (0.0%) | 26 (12.4%) |
| $30,000 to $34,999 | 20 (4.0%) | 0 (0.0%) |
| $35,000 to $39,999 | 0 (0.0%) | 6 (2.9%) |
| $40,000 to $44,999 | 19 (3.8%) | 7 (3.3%) |
| $45,000 to $49,999 | 65 (13.0%) | 0 (0.0%) |
| $50,000 to $54,999 | 17 (3.4%) | 0 (0.0%) |
| $55,000 to $64,999 | 4 (0.8%) | 21 (10.0%) |
| $65,000 to $74,999 | 14 (2.8%) | 0 (0.0%) |
| $75,000 to $99,999 | 39 (7.8%) | 6 (2.9%) |
| $100,000+ | 235 (47.0%) | 79 (37.6%) |
| Total | 500 (100.0%) | 210 (100.0%) |
Earnings by Sex by Educational Attainment in Lake Sherwood
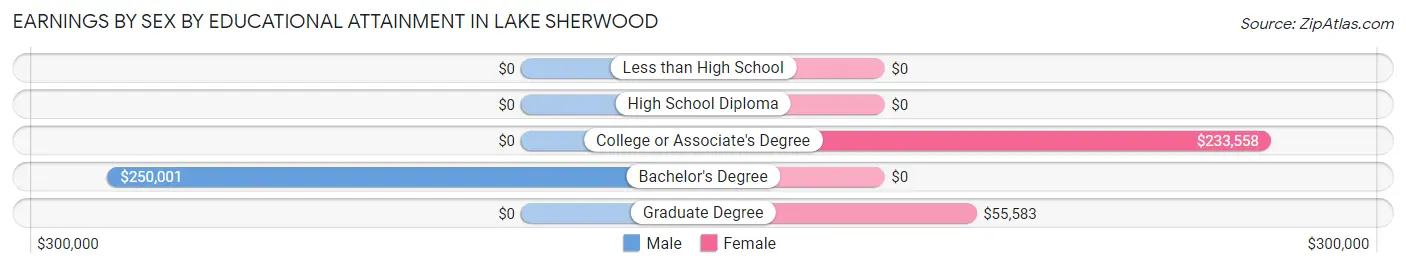
| Educational Attainment | Male Income | Female Income |
| Less than High School | - | - |
| High School Diploma | - | - |
| College or Associate's Degree | - | - |
| Bachelor's Degree | $250,001 | $0 |
| Graduate Degree | - | - |
| Total | - | - |
Family Income in Lake Sherwood
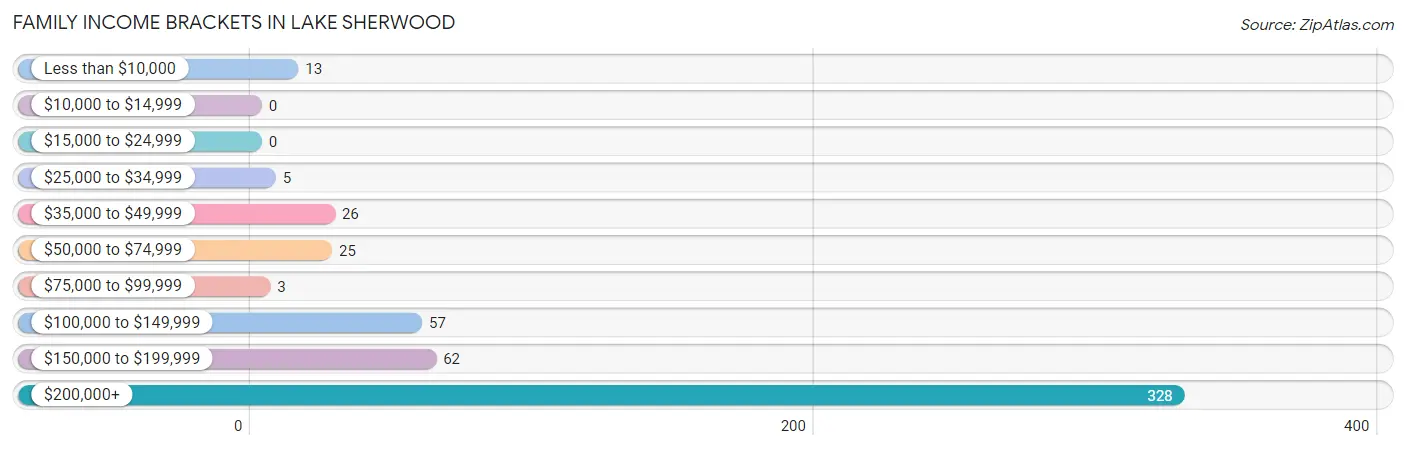
Family Income Brackets in Lake Sherwood
According to the Lake Sherwood family income data, there are 328 families falling into the $200,000+ income range, which is the most common income bracket and makes up 63.2% of all families.
| Income Bracket | # Families | % Families |
| Less than $10,000 | 13 | 2.5% |
| $10,000 to $14,999 | 0 | 0.0% |
| $15,000 to $24,999 | 0 | 0.0% |
| $25,000 to $34,999 | 5 | 1.0% |
| $35,000 to $49,999 | 26 | 5.0% |
| $50,000 to $74,999 | 25 | 4.8% |
| $75,000 to $99,999 | 3 | 0.6% |
| $100,000 to $149,999 | 57 | 11.0% |
| $150,000 to $199,999 | 62 | 11.9% |
| $200,000+ | 328 | 63.2% |
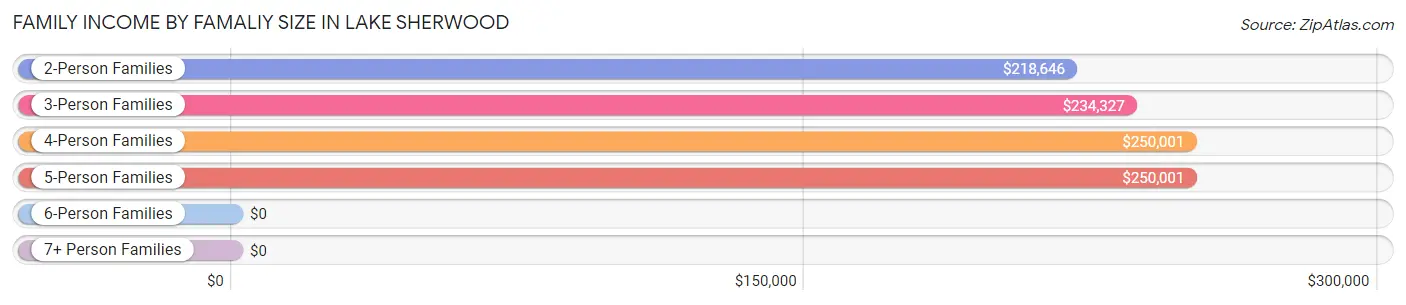
Family Income by Famaliy Size in Lake Sherwood
4-person families (55 | 10.6%) account for the highest median family income in Lake Sherwood with $250,001 per family, while 2-person families (303 | 58.4%) have the highest median income of $109,323 per family member.
| Income Bracket | # Families | Median Income |
| 2-Person Families | 303 (58.4%) | $218,646 |
| 3-Person Families | 127 (24.5%) | $234,327 |
| 4-Person Families | 55 (10.6%) | $250,001 |
| 5-Person Families | 32 (6.2%) | $250,001 |
| 6-Person Families | 2 (0.4%) | $0 |
| 7+ Person Families | 0 (0.0%) | $0 |
| Total | 519 (100.0%) | $234,263 |
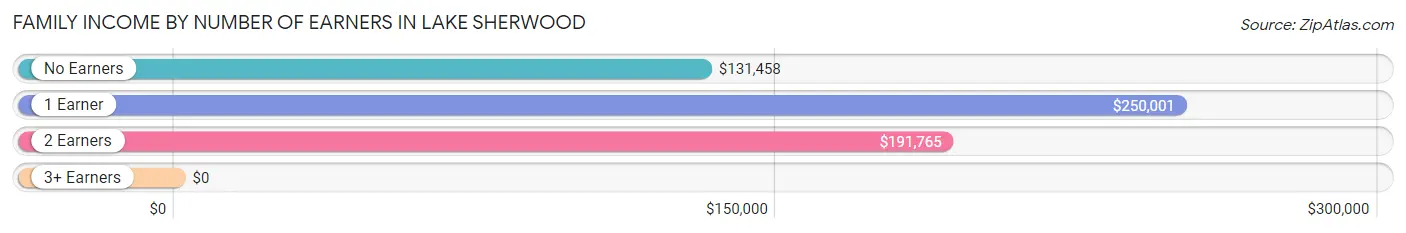
Family Income by Number of Earners in Lake Sherwood
| Number of Earners | # Families | Median Income |
| No Earners | 63 (12.1%) | $131,458 |
| 1 Earner | 280 (53.9%) | $250,001 |
| 2 Earners | 176 (33.9%) | $191,765 |
| 3+ Earners | 0 (0.0%) | $0 |
| Total | 519 (100.0%) | $234,263 |
Household Income in Lake Sherwood
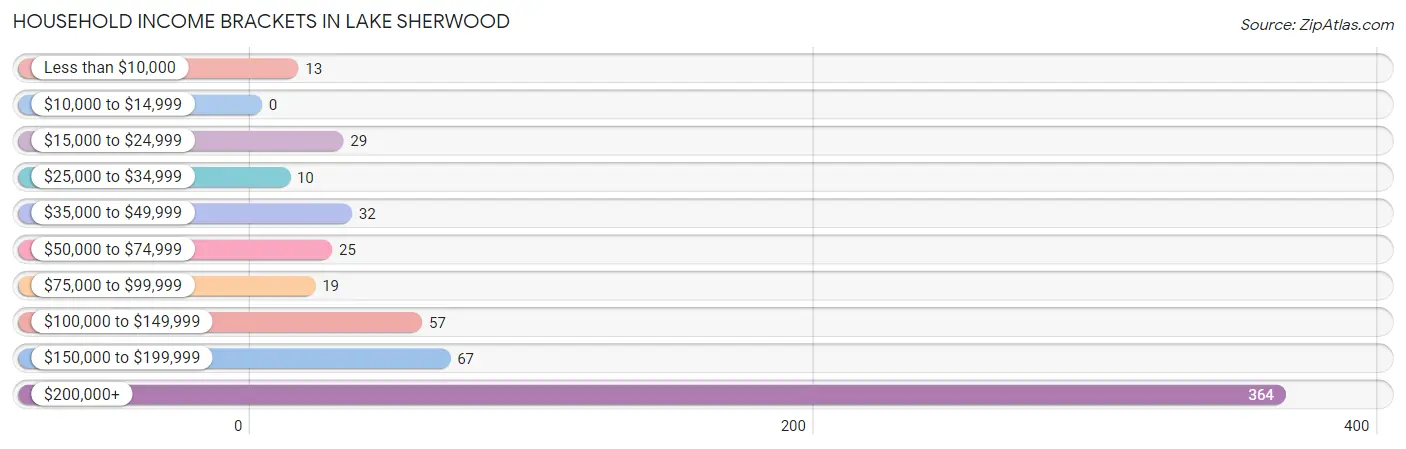
Household Income Brackets in Lake Sherwood
With 364 households falling in the category, the $200,000+ income range is the most frequent in Lake Sherwood, accounting for 59.1% of all households.
| Income Bracket | # Households | % Households |
| Less than $10,000 | 13 | 2.1% |
| $10,000 to $14,999 | 0 | 0.0% |
| $15,000 to $24,999 | 29 | 4.7% |
| $25,000 to $34,999 | 10 | 1.6% |
| $35,000 to $49,999 | 32 | 5.2% |
| $50,000 to $74,999 | 25 | 4.1% |
| $75,000 to $99,999 | 19 | 3.1% |
| $100,000 to $149,999 | 57 | 9.3% |
| $150,000 to $199,999 | 67 | 10.9% |
| $200,000+ | 364 | 59.1% |
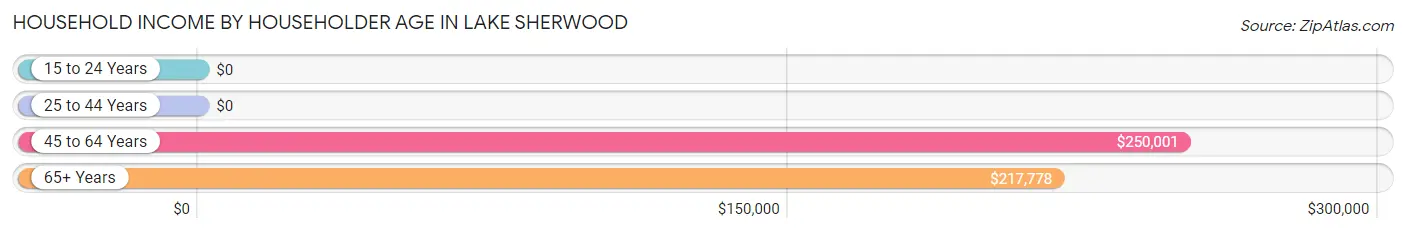
Household Income by Householder Age in Lake Sherwood
The median household income in Lake Sherwood is $233,462, with the highest median household income of $250,001 found in the 45 to 64 years age bracket for the primary householder. A total of 275 households (44.6%) fall into this category.
| Income Bracket | # Households | Median Income |
| 15 to 24 Years | 0 (0.0%) | $0 |
| 25 to 44 Years | 39 (6.3%) | $0 |
| 45 to 64 Years | 275 (44.6%) | $250,001 |
| 65+ Years | 302 (49.0%) | $217,778 |
| Total | 616 (100.0%) | $233,462 |
Poverty in Lake Sherwood
Income Below Poverty by Sex and Age in Lake Sherwood
With 2.0% poverty level for males and 4.3% for females among the residents of Lake Sherwood, 35 to 44 year old males and 35 to 44 year old females are the most vulnerable to poverty, with 5 males (17.9%) and 23 females (18.4%) in their respective age groups living below the poverty level.
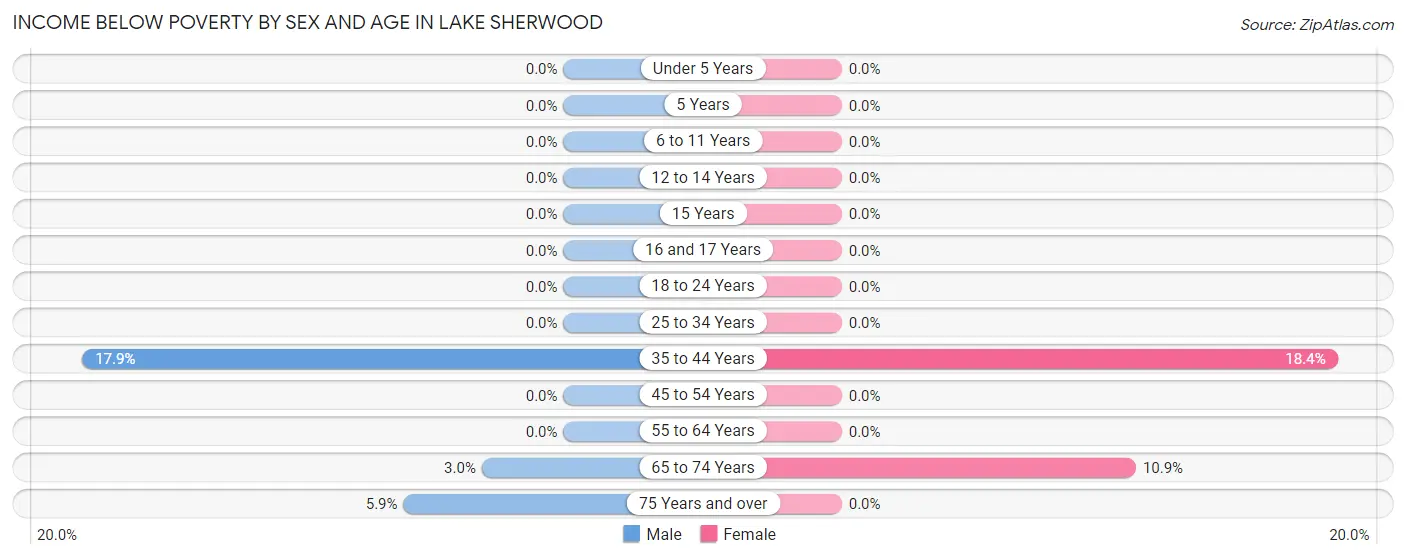
| Age Bracket | Male | Female |
| Under 5 Years | 0 (0.0%) | 0 (0.0%) |
| 5 Years | 0 (0.0%) | 0 (0.0%) |
| 6 to 11 Years | 0 (0.0%) | 0 (0.0%) |
| 12 to 14 Years | 0 (0.0%) | 0 (0.0%) |
| 15 Years | 0 (0.0%) | 0 (0.0%) |
| 16 and 17 Years | 0 (0.0%) | 0 (0.0%) |
| 18 to 24 Years | 0 (0.0%) | 0 (0.0%) |
| 25 to 34 Years | 0 (0.0%) | 0 (0.0%) |
| 35 to 44 Years | 5 (17.9%) | 23 (18.4%) |
| 45 to 54 Years | 0 (0.0%) | 0 (0.0%) |
| 55 to 64 Years | 0 (0.0%) | 0 (0.0%) |
| 65 to 74 Years | 5 (3.0%) | 13 (10.9%) |
| 75 Years and over | 6 (5.9%) | 0 (0.0%) |
| Total | 16 (2.0%) | 36 (4.3%) |
Income Above Poverty by Sex and Age in Lake Sherwood
According to the poverty statistics in Lake Sherwood, males aged 6 to 11 years and females aged 6 to 11 years are the age groups that are most secure financially, with 100.0% of males and 100.0% of females in these age groups living above the poverty line.
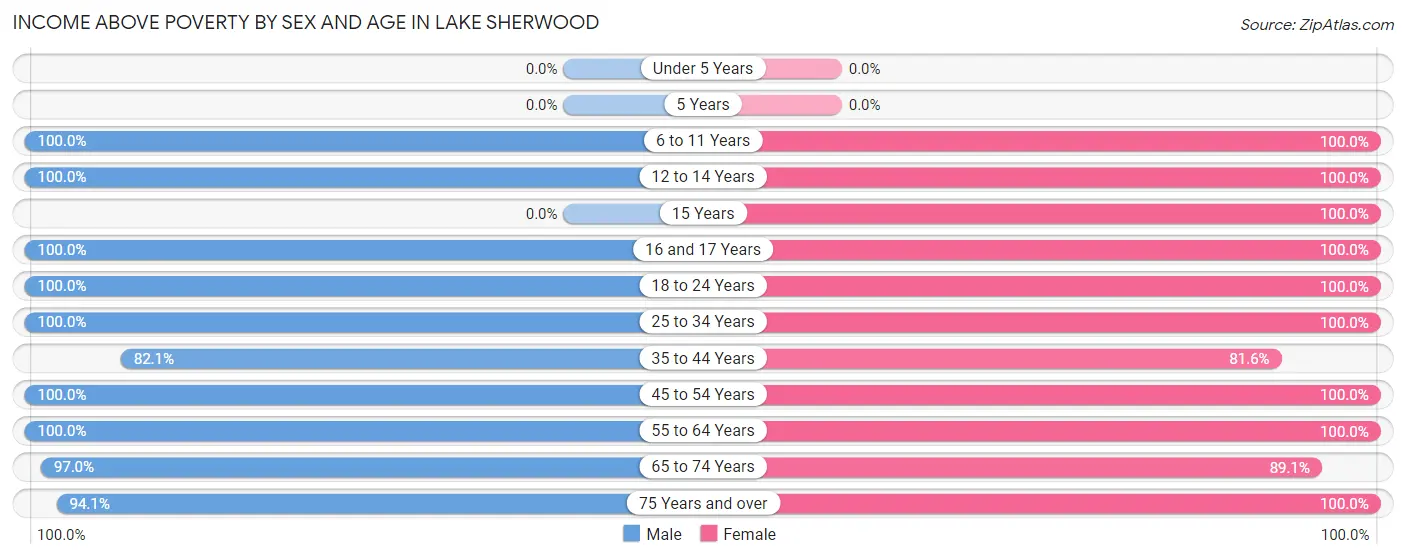
| Age Bracket | Male | Female |
| Under 5 Years | 0 (0.0%) | 0 (0.0%) |
| 5 Years | 0 (0.0%) | 0 (0.0%) |
| 6 to 11 Years | 22 (100.0%) | 35 (100.0%) |
| 12 to 14 Years | 72 (100.0%) | 18 (100.0%) |
| 15 Years | 0 (0.0%) | 2 (100.0%) |
| 16 and 17 Years | 41 (100.0%) | 16 (100.0%) |
| 18 to 24 Years | 53 (100.0%) | 102 (100.0%) |
| 25 to 34 Years | 34 (100.0%) | 30 (100.0%) |
| 35 to 44 Years | 23 (82.1%) | 102 (81.6%) |
| 45 to 54 Years | 73 (100.0%) | 123 (100.0%) |
| 55 to 64 Years | 198 (100.0%) | 162 (100.0%) |
| 65 to 74 Years | 160 (97.0%) | 106 (89.1%) |
| 75 Years and over | 95 (94.1%) | 98 (100.0%) |
| Total | 771 (98.0%) | 794 (95.7%) |
Income Below Poverty Among Married-Couple Families in Lake Sherwood
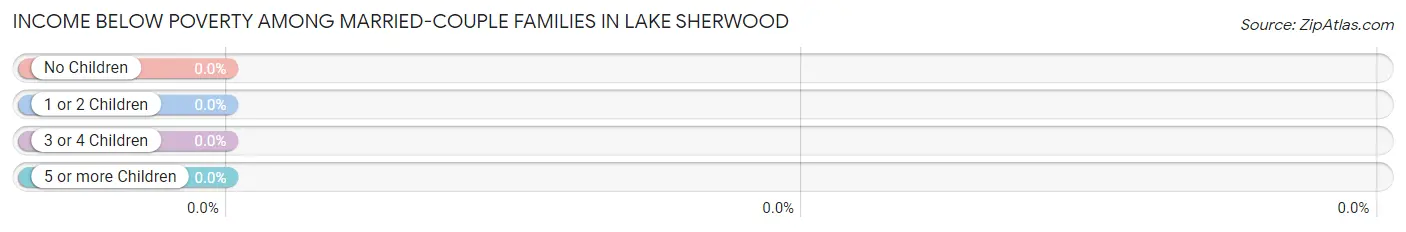
| Children | Above Poverty | Below Poverty |
| No Children | 365 (100.0%) | 0 (0.0%) |
| 1 or 2 Children | 62 (100.0%) | 0 (0.0%) |
| 3 or 4 Children | 20 (100.0%) | 0 (0.0%) |
| 5 or more Children | 0 (0.0%) | 0 (0.0%) |
| Total | 447 (100.0%) | 0 (0.0%) |
Income Below Poverty Among Single-Parent Households in Lake Sherwood
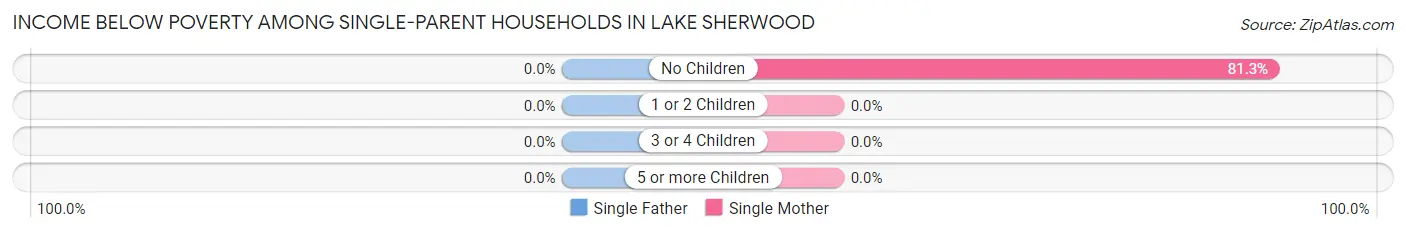
| Children | Single Father | Single Mother |
| No Children | 0 (0.0%) | 13 (81.2%) |
| 1 or 2 Children | 0 (0.0%) | 0 (0.0%) |
| 3 or 4 Children | 0 (0.0%) | 0 (0.0%) |
| 5 or more Children | 0 (0.0%) | 0 (0.0%) |
| Total | 0 (0.0%) | 13 (21.7%) |
Income Below Poverty Among Married-Couple vs Single-Parent Households in Lake Sherwood
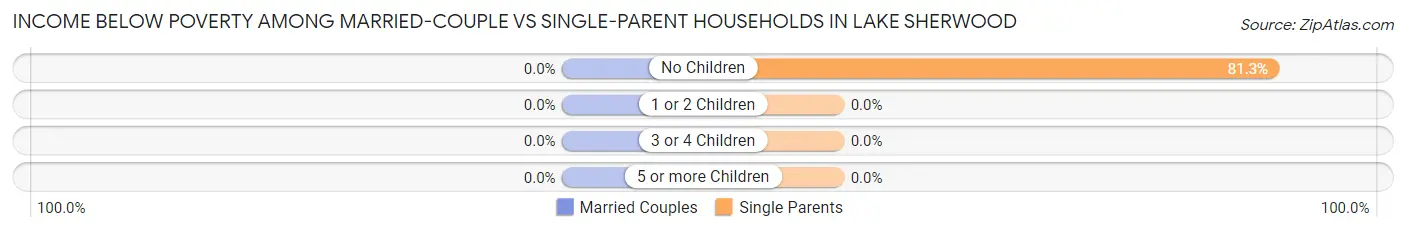
| Children | Married-Couple Families | Single-Parent Households |
| No Children | 0 (0.0%) | 13 (81.2%) |
| 1 or 2 Children | 0 (0.0%) | 0 (0.0%) |
| 3 or 4 Children | 0 (0.0%) | 0 (0.0%) |
| 5 or more Children | 0 (0.0%) | 0 (0.0%) |
| Total | 0 (0.0%) | 13 (18.1%) |
Race in Lake Sherwood
The most populous races in Lake Sherwood are White / Caucasian (1,336 | 82.6%), Two or more Races (185 | 11.4%), and Hispanic or Latino (163 | 10.1%).
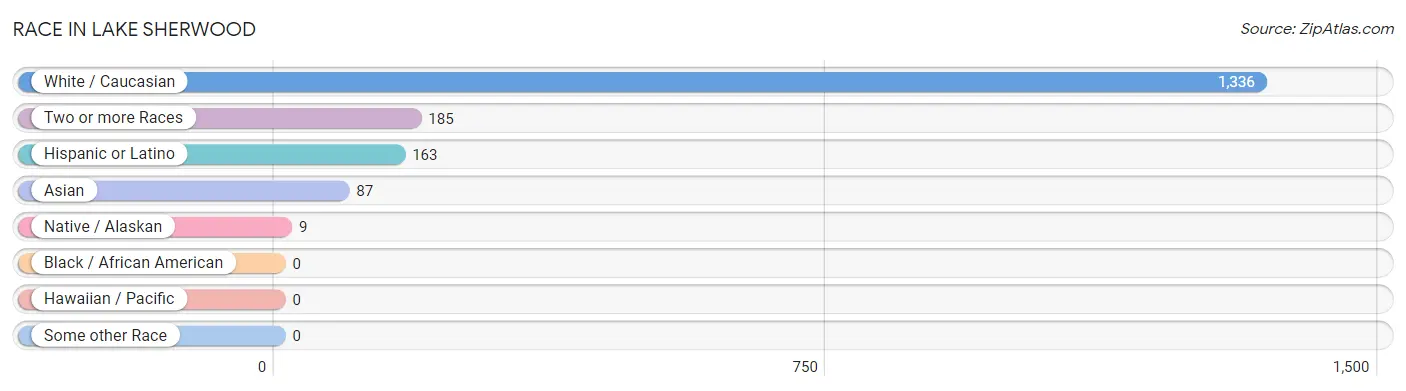
| Race | # Population | % Population |
| Asian | 87 | 5.4% |
| Black / African American | 0 | 0.0% |
| Hawaiian / Pacific | 0 | 0.0% |
| Hispanic or Latino | 163 | 10.1% |
| Native / Alaskan | 9 | 0.6% |
| White / Caucasian | 1,336 | 82.6% |
| Two or more Races | 185 | 11.4% |
| Some other Race | 0 | 0.0% |
| Total | 1,617 | 100.0% |
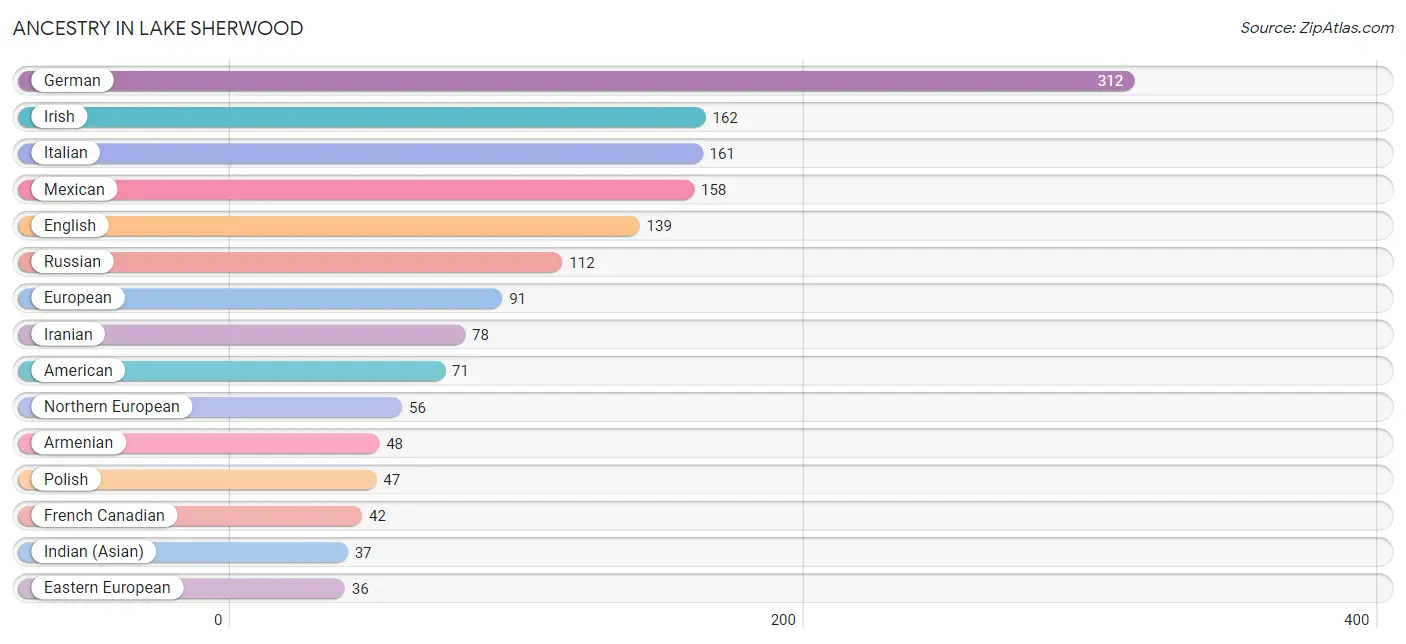
Ancestry in Lake Sherwood
The most populous ancestries reported in Lake Sherwood are German (312 | 19.3%), Irish (162 | 10.0%), Italian (161 | 10.0%), Mexican (158 | 9.8%), and English (139 | 8.6%), together accounting for 57.6% of all Lake Sherwood residents.
| Ancestry | # Population | % Population |
| American | 71 | 4.4% |
| Argentinean | 5 | 0.3% |
| Armenian | 48 | 3.0% |
| Austrian | 19 | 1.2% |
| Bhutanese | 23 | 1.4% |
| British | 6 | 0.4% |
| Burmese | 21 | 1.3% |
| Cherokee | 9 | 0.6% |
| Danish | 3 | 0.2% |
| Dutch | 5 | 0.3% |
| Eastern European | 36 | 2.2% |
| English | 139 | 8.6% |
| European | 91 | 5.6% |
| French | 23 | 1.4% |
| French Canadian | 42 | 2.6% |
| German | 312 | 19.3% |
| Greek | 7 | 0.4% |
| Hungarian | 6 | 0.4% |
| Indian (Asian) | 37 | 2.3% |
| Iranian | 78 | 4.8% |
| Irish | 162 | 10.0% |
| Italian | 161 | 10.0% |
| Korean | 13 | 0.8% |
| Mexican | 158 | 9.8% |
| Northern European | 56 | 3.5% |
| Norwegian | 7 | 0.4% |
| Polish | 47 | 2.9% |
| Russian | 112 | 6.9% |
| Scandinavian | 15 | 0.9% |
| Scotch-Irish | 29 | 1.8% |
| Scottish | 13 | 0.8% |
| South American | 5 | 0.3% |
| Swedish | 12 | 0.7% |
| Swiss | 6 | 0.4% |
| Turkish | 12 | 0.7% |
| Ukrainian | 10 | 0.6% |
| Welsh | 6 | 0.4% | View All 37 Rows |
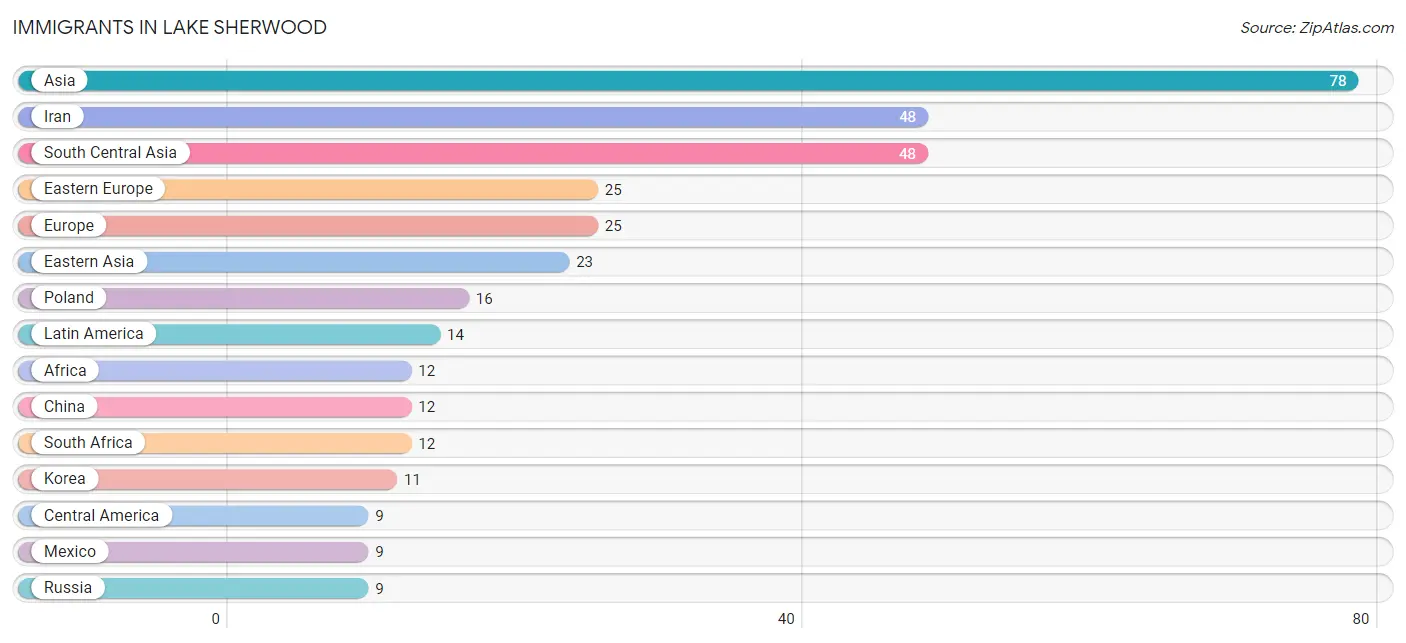
Immigrants in Lake Sherwood
The most numerous immigrant groups reported in Lake Sherwood came from Asia (78 | 4.8%), Iran (48 | 3.0%), South Central Asia (48 | 3.0%), Eastern Europe (25 | 1.5%), and Europe (25 | 1.5%), together accounting for 13.9% of all Lake Sherwood residents.
| Immigration Origin | # Population | % Population |
| Africa | 12 | 0.7% |
| Argentina | 5 | 0.3% |
| Asia | 78 | 4.8% |
| Canada | 7 | 0.4% |
| Central America | 9 | 0.6% |
| China | 12 | 0.7% |
| Eastern Asia | 23 | 1.4% |
| Eastern Europe | 25 | 1.5% |
| Europe | 25 | 1.5% |
| Iran | 48 | 3.0% |
| Korea | 11 | 0.7% |
| Latin America | 14 | 0.9% |
| Mexico | 9 | 0.6% |
| Philippines | 7 | 0.4% |
| Poland | 16 | 1.0% |
| Russia | 9 | 0.6% |
| South Africa | 12 | 0.7% |
| South America | 5 | 0.3% |
| South Central Asia | 48 | 3.0% |
| South Eastern Asia | 7 | 0.4% | View All 20 Rows |
Sex and Age in Lake Sherwood
Sex and Age in Lake Sherwood
The most populous age groups in Lake Sherwood are 70 to 74 Years (128 | 16.3%) for men and 50 to 54 Years (93 | 11.2%) for women.
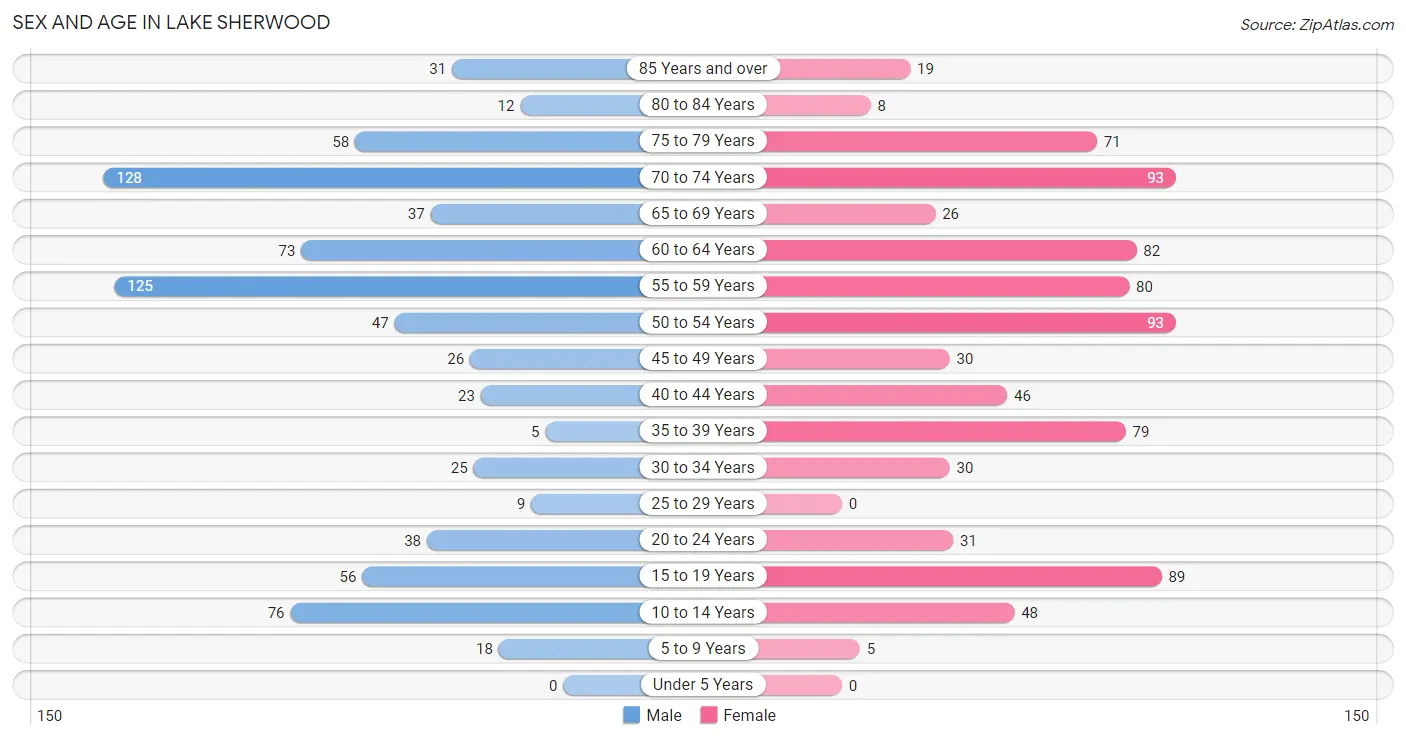
| Age Bracket | Male | Female |
| Under 5 Years | 0 (0.0%) | 0 (0.0%) |
| 5 to 9 Years | 18 (2.3%) | 5 (0.6%) |
| 10 to 14 Years | 76 (9.7%) | 48 (5.8%) |
| 15 to 19 Years | 56 (7.1%) | 89 (10.7%) |
| 20 to 24 Years | 38 (4.8%) | 31 (3.7%) |
| 25 to 29 Years | 9 (1.1%) | 0 (0.0%) |
| 30 to 34 Years | 25 (3.2%) | 30 (3.6%) |
| 35 to 39 Years | 5 (0.6%) | 79 (9.5%) |
| 40 to 44 Years | 23 (2.9%) | 46 (5.5%) |
| 45 to 49 Years | 26 (3.3%) | 30 (3.6%) |
| 50 to 54 Years | 47 (6.0%) | 93 (11.2%) |
| 55 to 59 Years | 125 (15.9%) | 80 (9.6%) |
| 60 to 64 Years | 73 (9.3%) | 82 (9.9%) |
| 65 to 69 Years | 37 (4.7%) | 26 (3.1%) |
| 70 to 74 Years | 128 (16.3%) | 93 (11.2%) |
| 75 to 79 Years | 58 (7.4%) | 71 (8.6%) |
| 80 to 84 Years | 12 (1.5%) | 8 (1.0%) |
| 85 Years and over | 31 (3.9%) | 19 (2.3%) |
| Total | 787 (100.0%) | 830 (100.0%) |
Families and Households in Lake Sherwood
Median Family Size in Lake Sherwood
The median family size in Lake Sherwood is 2.83 persons per family, with single female/mother families (60 | 11.6%) accounting for the largest median family size of 3.07 persons per family. On the other hand, single male/father families (12 | 2.3%) represent the smallest median family size with 2.42 persons per family.
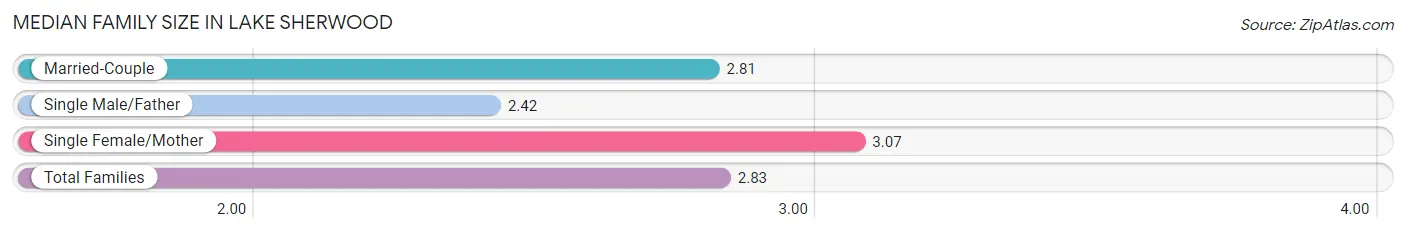
| Family Type | # Families | Family Size |
| Married-Couple | 447 (86.1%) | 2.81 |
| Single Male/Father | 12 (2.3%) | 2.42 |
| Single Female/Mother | 60 (11.6%) | 3.07 |
| Total Families | 519 (100.0%) | 2.83 |
Median Household Size in Lake Sherwood
The median household size in Lake Sherwood is 2.63 persons per household, with single female/mother households (60 | 9.7%) accounting for the largest median household size of 3.15 persons per household. non-family households (97 | 15.8%) represent the smallest median household size with 1.29 persons per household.
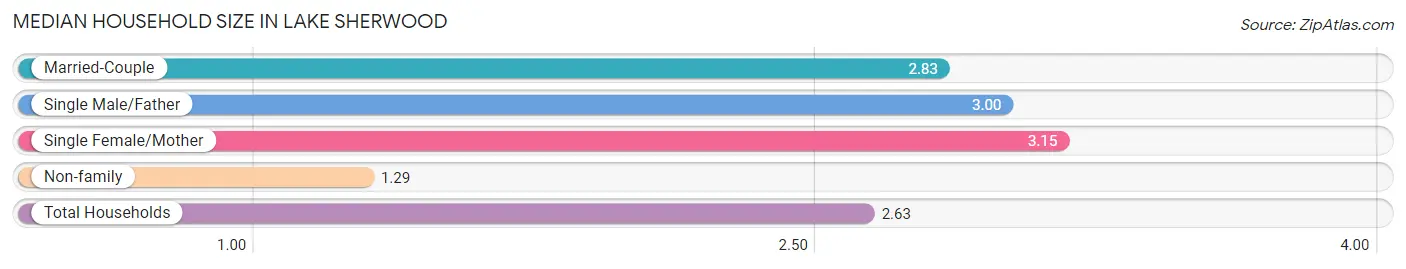
| Household Type | # Households | Household Size |
| Married-Couple | 447 (72.6%) | 2.83 |
| Single Male/Father | 12 (1.9%) | 3.00 |
| Single Female/Mother | 60 (9.7%) | 3.15 |
| Non-family | 97 (15.8%) | 1.29 |
| Total Households | 616 (100.0%) | 2.63 |
Household Size by Marriage Status in Lake Sherwood
Out of a total of 616 households in Lake Sherwood, 519 (84.3%) are family households, while 97 (15.8%) are nonfamily households. The most numerous type of family households are 2-person households, comprising 289, and the most common type of nonfamily households are 1-person households, comprising 68.
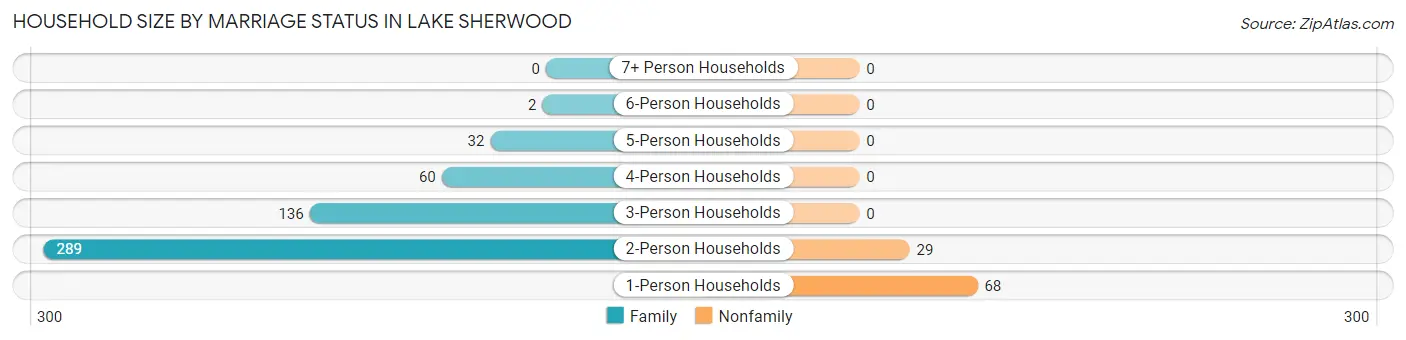
| Household Size | Family Households | Nonfamily Households |
| 1-Person Households | - | 68 (11.0%) |
| 2-Person Households | 289 (46.9%) | 29 (4.7%) |
| 3-Person Households | 136 (22.1%) | 0 (0.0%) |
| 4-Person Households | 60 (9.7%) | 0 (0.0%) |
| 5-Person Households | 32 (5.2%) | 0 (0.0%) |
| 6-Person Households | 2 (0.3%) | 0 (0.0%) |
| 7+ Person Households | 0 (0.0%) | 0 (0.0%) |
| Total | 519 (84.3%) | 97 (15.8%) |
Female Fertility in Lake Sherwood
Fertility by Age in Lake Sherwood
| Age Bracket | Women with Births | Births / 1,000 Women |
| 15 to 19 years | 0 (0.0%) | 0.0 |
| 20 to 34 years | 0 (0.0%) | 0.0 |
| 35 to 50 years | 0 (0.0%) | 0.0 |
| Total | 0 (0.0%) | 0.0 |
Fertility by Age by Marriage Status in Lake Sherwood
| Age Bracket | Married | Unmarried |
| 15 to 19 years | 0 (0.0%) | 0 (0.0%) |
| 20 to 34 years | 0 (0.0%) | 0 (0.0%) |
| 35 to 50 years | 0 (0.0%) | 0 (0.0%) |
| Total | 0 (0.0%) | 0 (0.0%) |
Fertility by Education in Lake Sherwood
| Educational Attainment | Women with Births | Births / 1,000 Women |
| Less than High School | 0 (0.0%) | 0.0 |
| High School Diploma | 0 (0.0%) | 0.0 |
| College or Associate's Degree | 0 (0.0%) | 0.0 |
| Bachelor's Degree | 0 (0.0%) | 0.0 |
| Graduate Degree | 0 (0.0%) | 0.0 |
| Total | 0 (0.0%) | 0.0 |
Fertility by Education by Marriage Status in Lake Sherwood
| Educational Attainment | Married | Unmarried |
| Less than High School | 0 (0.0%) | 0 (0.0%) |
| High School Diploma | 0 (0.0%) | 0 (0.0%) |
| College or Associate's Degree | 0 (0.0%) | 0 (0.0%) |
| Bachelor's Degree | 0 (0.0%) | 0 (0.0%) |
| Graduate Degree | 0 (0.0%) | 0 (0.0%) |
| Total | 0 (0.0%) | 0 (0.0%) |
Employment Characteristics in Lake Sherwood
Employment by Class of Employer in Lake Sherwood
Among the 680 employed individuals in Lake Sherwood, private company employees (264 | 38.8%), self-employed (incorporated) (167 | 24.6%), and self-employed (not incorporated) (106 | 15.6%) make up the most common classes of employment.
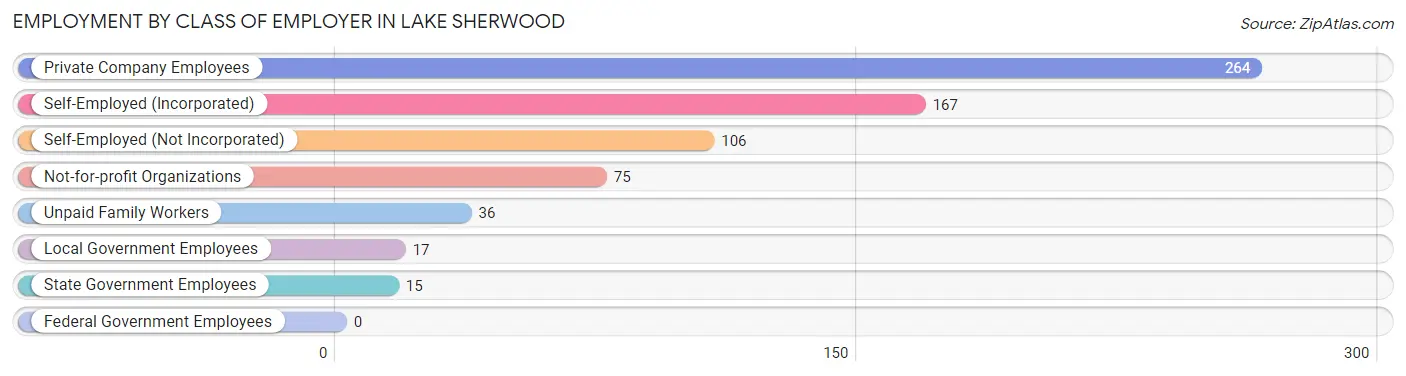
| Employer Class | # Employees | % Employees |
| Private Company Employees | 264 | 38.8% |
| Self-Employed (Incorporated) | 167 | 24.6% |
| Self-Employed (Not Incorporated) | 106 | 15.6% |
| Not-for-profit Organizations | 75 | 11.0% |
| Local Government Employees | 17 | 2.5% |
| State Government Employees | 15 | 2.2% |
| Federal Government Employees | 0 | 0.0% |
| Unpaid Family Workers | 36 | 5.3% |
| Total | 680 | 100.0% |
Employment Status by Age in Lake Sherwood
According to the labor force statistics for Lake Sherwood, out of the total population over 16 years of age (1,468), 49.9% or 733 individuals are in the labor force, with 7.1% or 52 of them unemployed. The age group with the highest labor force participation rate is 25 to 29 years, with 100.0% or 9 individuals in the labor force. Within the labor force, the 30 to 34 years age range has the highest percentage of unemployed individuals, with 54.5% or 30 of them being unemployed.
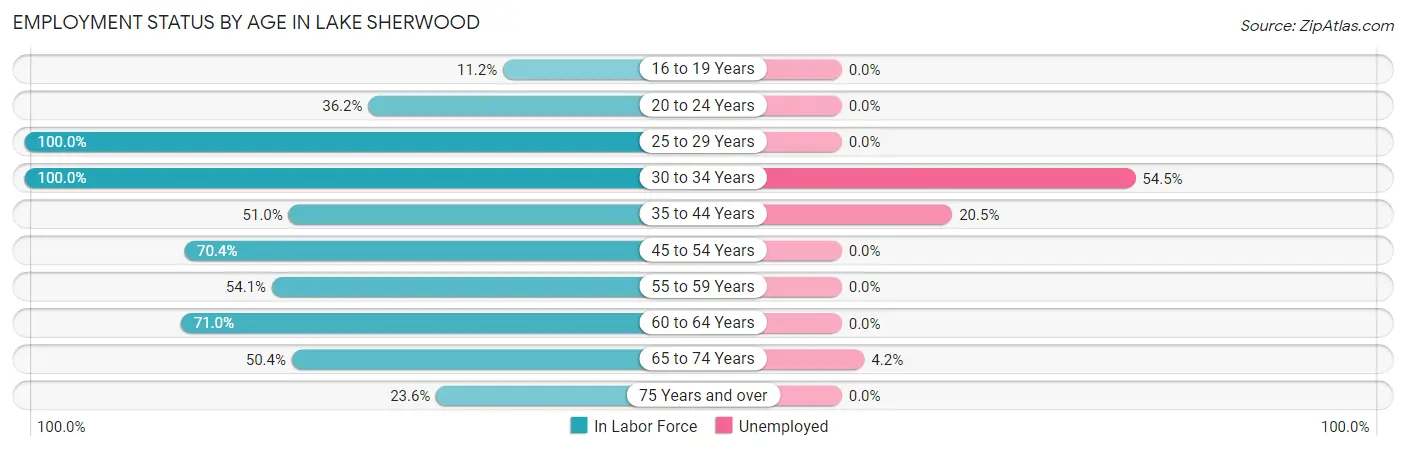
| Age Bracket | In Labor Force | Unemployed |
| 16 to 19 Years | 16 (11.2%) | 0 (0.0%) |
| 20 to 24 Years | 25 (36.2%) | 0 (0.0%) |
| 25 to 29 Years | 9 (100.0%) | 0 (0.0%) |
| 30 to 34 Years | 55 (100.0%) | 30 (54.5%) |
| 35 to 44 Years | 78 (51.0%) | 16 (20.5%) |
| 45 to 54 Years | 138 (70.4%) | 0 (0.0%) |
| 55 to 59 Years | 111 (54.1%) | 0 (0.0%) |
| 60 to 64 Years | 110 (71.0%) | 0 (0.0%) |
| 65 to 74 Years | 143 (50.4%) | 6 (4.2%) |
| 75 Years and over | 47 (23.6%) | 0 (0.0%) |
| Total | 733 (49.9%) | 52 (7.1%) |
Employment Status by Educational Attainment in Lake Sherwood
According to labor force statistics for Lake Sherwood, 64.8% of individuals (501) out of the total population between 25 and 64 years of age (773) are in the labor force, with 9.2% or 46 of them being unemployed. The group with the highest labor force participation rate are those with the educational attainment of less than high school, with 84.4% or 27 individuals in the labor force. Within the labor force, individuals with bachelor's degree or higher education have the highest percentage of unemployment, with 13.1% or 46 of them being unemployed.
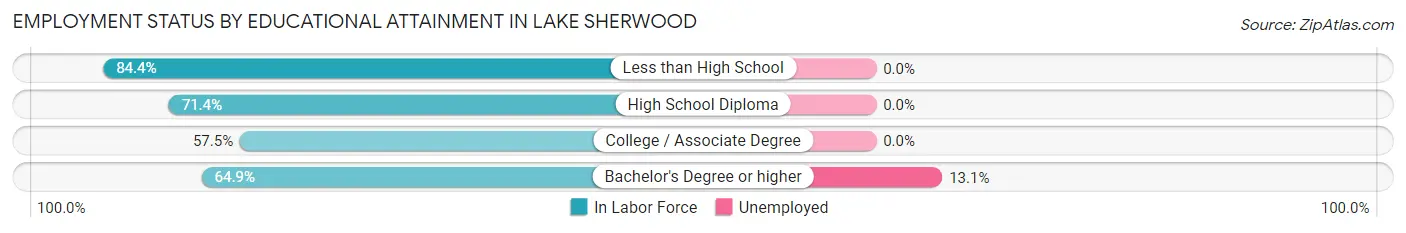
| Educational Attainment | In Labor Force | Unemployed |
| Less than High School | 27 (84.4%) | 0 (0.0%) |
| High School Diploma | 40 (71.4%) | 0 (0.0%) |
| College / Associate Degree | 84 (57.5%) | 0 (0.0%) |
| Bachelor's Degree or higher | 350 (64.9%) | 71 (13.1%) |
| Total | 501 (64.8%) | 71 (9.2%) |
Employment Occupations by Sex in Lake Sherwood
Management, Business, Science and Arts Occupations
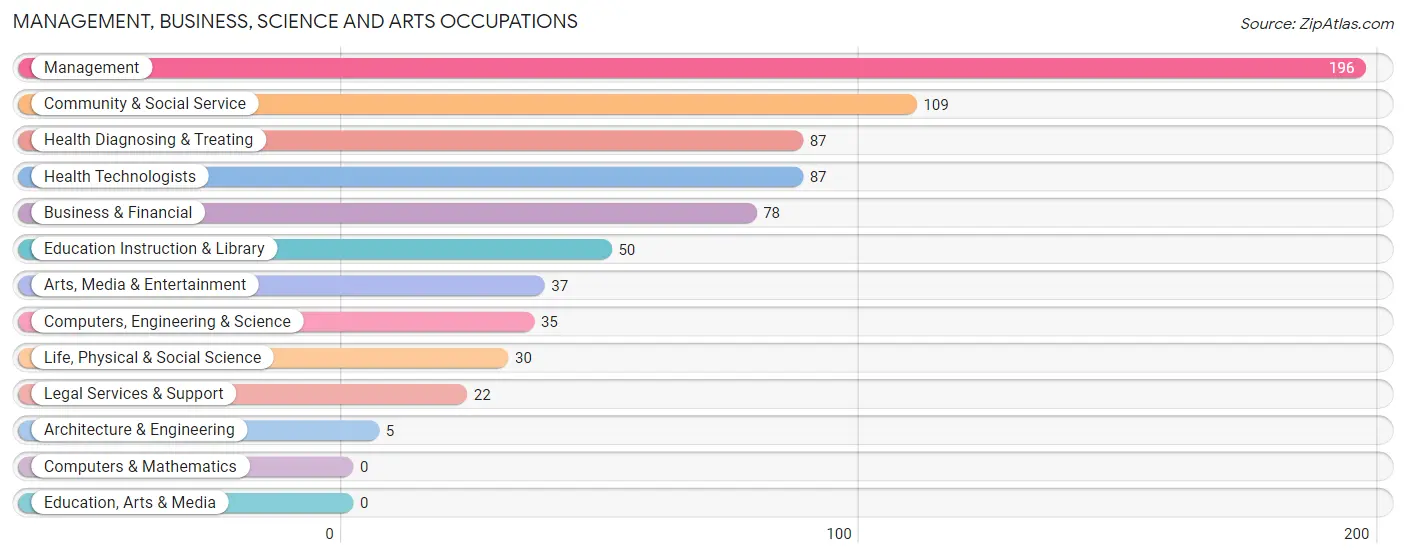
The most common Management, Business, Science and Arts occupations in Lake Sherwood are Management (196 | 28.8%), Community & Social Service (109 | 16.0%), Health Diagnosing & Treating (87 | 12.8%), Health Technologists (87 | 12.8%), and Business & Financial (78 | 11.5%).
Management, Business, Science and Arts Occupations by Sex
Within the Management, Business, Science and Arts occupations in Lake Sherwood, the most male-oriented occupations are Architecture & Engineering (100.0%), Legal Services & Support (100.0%), and Business & Financial (92.3%), while the most female-oriented occupations are Education Instruction & Library (72.0%), Health Diagnosing & Treating (59.8%), and Health Technologists (59.8%).
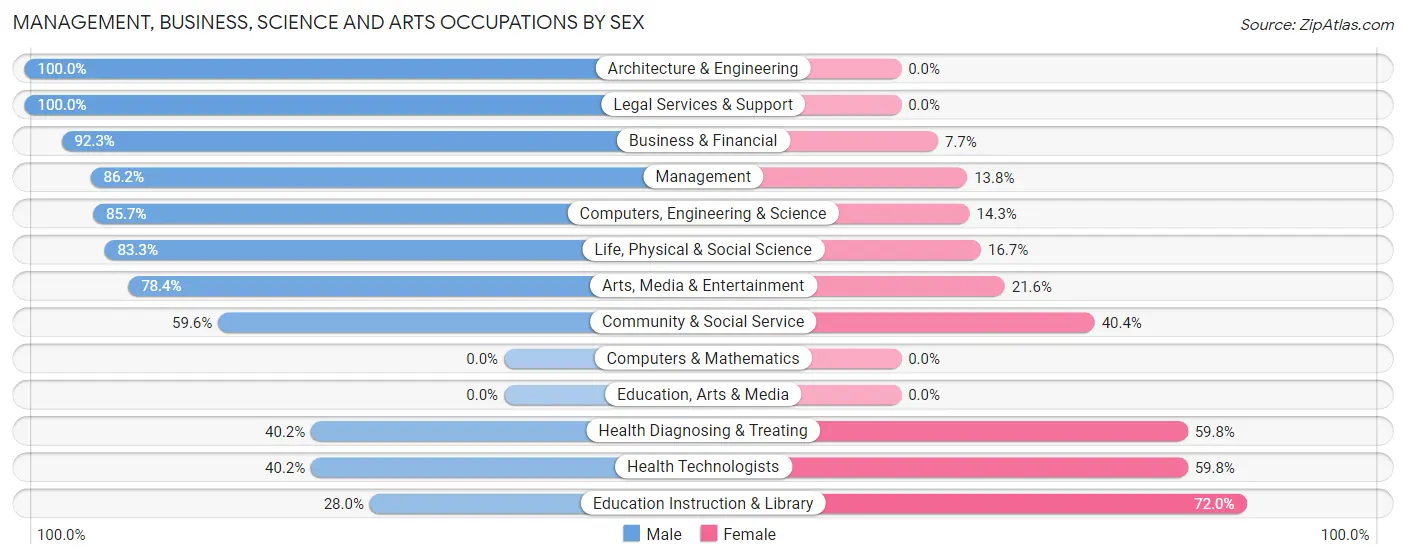
| Occupation | Male | Female |
| Management | 169 (86.2%) | 27 (13.8%) |
| Business & Financial | 72 (92.3%) | 6 (7.7%) |
| Computers, Engineering & Science | 30 (85.7%) | 5 (14.3%) |
| Computers & Mathematics | 0 (0.0%) | 0 (0.0%) |
| Architecture & Engineering | 5 (100.0%) | 0 (0.0%) |
| Life, Physical & Social Science | 25 (83.3%) | 5 (16.7%) |
| Community & Social Service | 65 (59.6%) | 44 (40.4%) |
| Education, Arts & Media | 0 (0.0%) | 0 (0.0%) |
| Legal Services & Support | 22 (100.0%) | 0 (0.0%) |
| Education Instruction & Library | 14 (28.0%) | 36 (72.0%) |
| Arts, Media & Entertainment | 29 (78.4%) | 8 (21.6%) |
| Health Diagnosing & Treating | 35 (40.2%) | 52 (59.8%) |
| Health Technologists | 35 (40.2%) | 52 (59.8%) |
| Total (Category) | 371 (73.5%) | 134 (26.5%) |
| Total (Overall) | 480 (70.6%) | 200 (29.4%) |
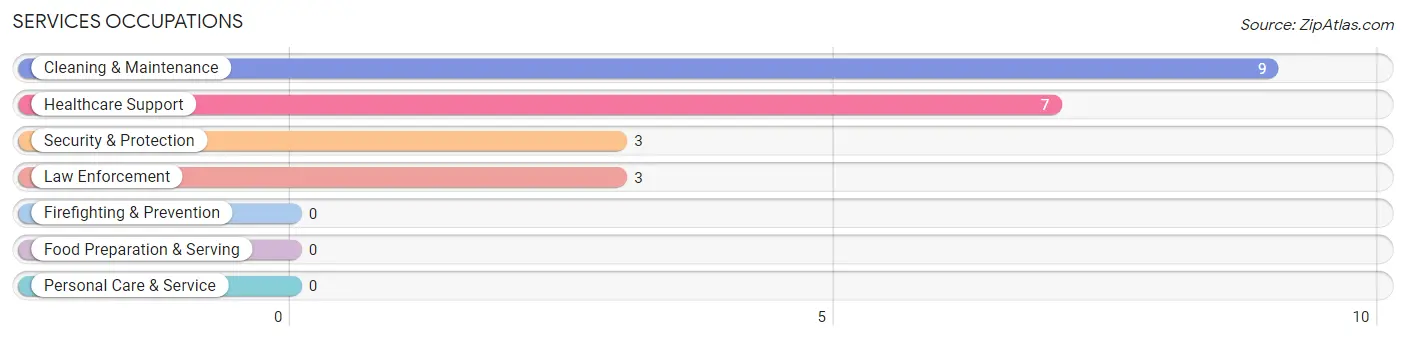
Services Occupations
The most common Services occupations in Lake Sherwood are Cleaning & Maintenance (9 | 1.3%), Healthcare Support (7 | 1.0%), Security & Protection (3 | 0.4%), and Law Enforcement (3 | 0.4%).
Services Occupations by Sex
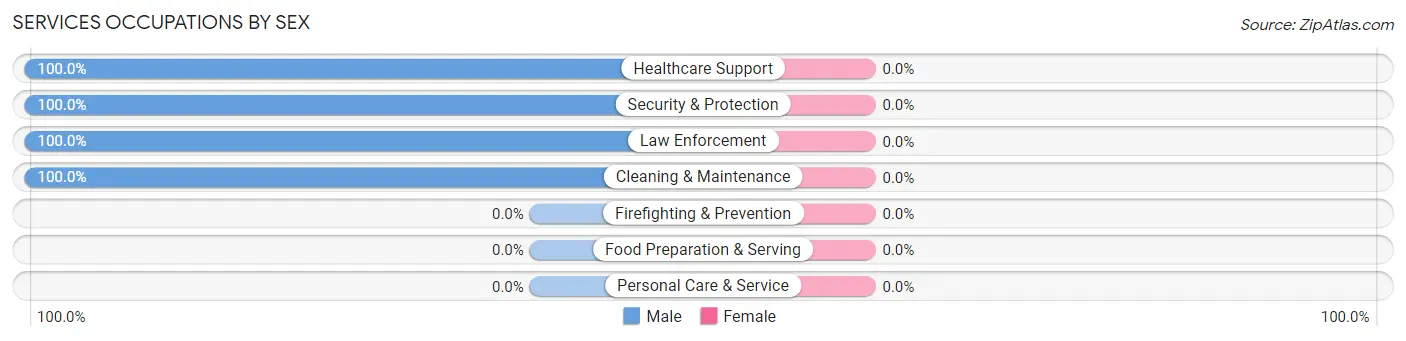
| Occupation | Male | Female |
| Healthcare Support | 7 (100.0%) | 0 (0.0%) |
| Security & Protection | 3 (100.0%) | 0 (0.0%) |
| Firefighting & Prevention | 0 (0.0%) | 0 (0.0%) |
| Law Enforcement | 3 (100.0%) | 0 (0.0%) |
| Food Preparation & Serving | 0 (0.0%) | 0 (0.0%) |
| Cleaning & Maintenance | 9 (100.0%) | 0 (0.0%) |
| Personal Care & Service | 0 (0.0%) | 0 (0.0%) |
| Total (Category) | 19 (100.0%) | 0 (0.0%) |
| Total (Overall) | 480 (70.6%) | 200 (29.4%) |
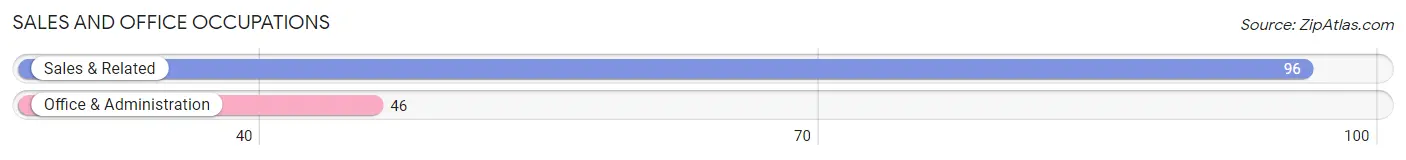
Sales and Office Occupations
The most common Sales and Office occupations in Lake Sherwood are Sales & Related (96 | 14.1%), and Office & Administration (46 | 6.8%).
Sales and Office Occupations by Sex
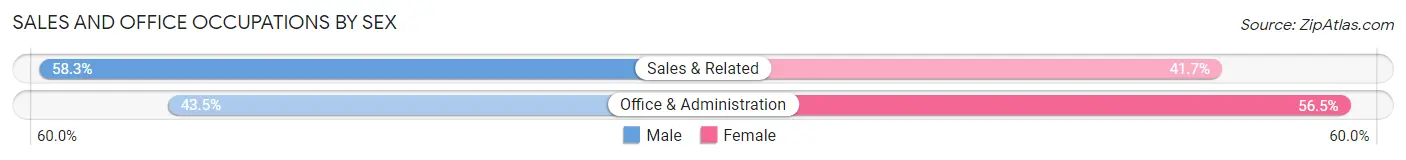
| Occupation | Male | Female |
| Sales & Related | 56 (58.3%) | 40 (41.7%) |
| Office & Administration | 20 (43.5%) | 26 (56.5%) |
| Total (Category) | 76 (53.5%) | 66 (46.5%) |
| Total (Overall) | 480 (70.6%) | 200 (29.4%) |
Natural Resources, Construction and Maintenance Occupations
Natural Resources, Construction and Maintenance Occupations by Sex
| Occupation | Male | Female |
| Farming, Fishing & Forestry | 0 (0.0%) | 0 (0.0%) |
| Construction & Extraction | 0 (0.0%) | 0 (0.0%) |
| Installation, Maintenance & Repair | 0 (0.0%) | 0 (0.0%) |
| Total (Category) | 0 (0.0%) | 0 (0.0%) |
| Total (Overall) | 480 (70.6%) | 200 (29.4%) |
Production, Transportation and Moving Occupations
The most common Production, Transportation and Moving occupations in Lake Sherwood are , and Production (14 | 2.1%).
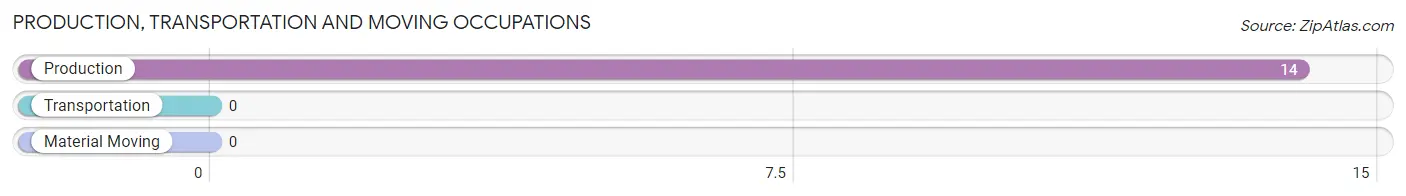
Production, Transportation and Moving Occupations by Sex
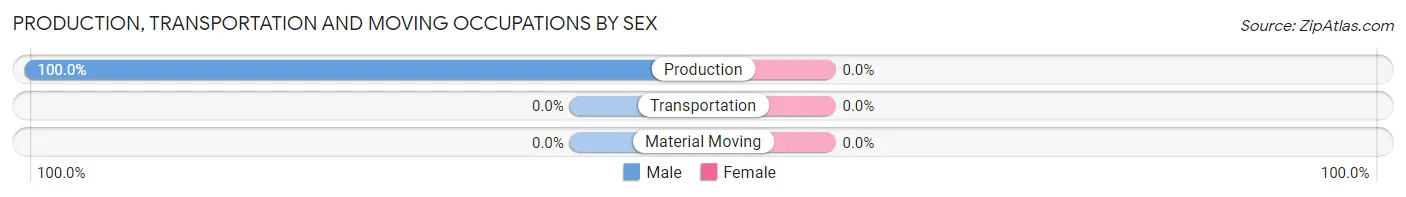
| Occupation | Male | Female |
| Production | 14 (100.0%) | 0 (0.0%) |
| Transportation | 0 (0.0%) | 0 (0.0%) |
| Material Moving | 0 (0.0%) | 0 (0.0%) |
| Total (Category) | 14 (100.0%) | 0 (0.0%) |
| Total (Overall) | 480 (70.6%) | 200 (29.4%) |
Employment Industries by Sex in Lake Sherwood
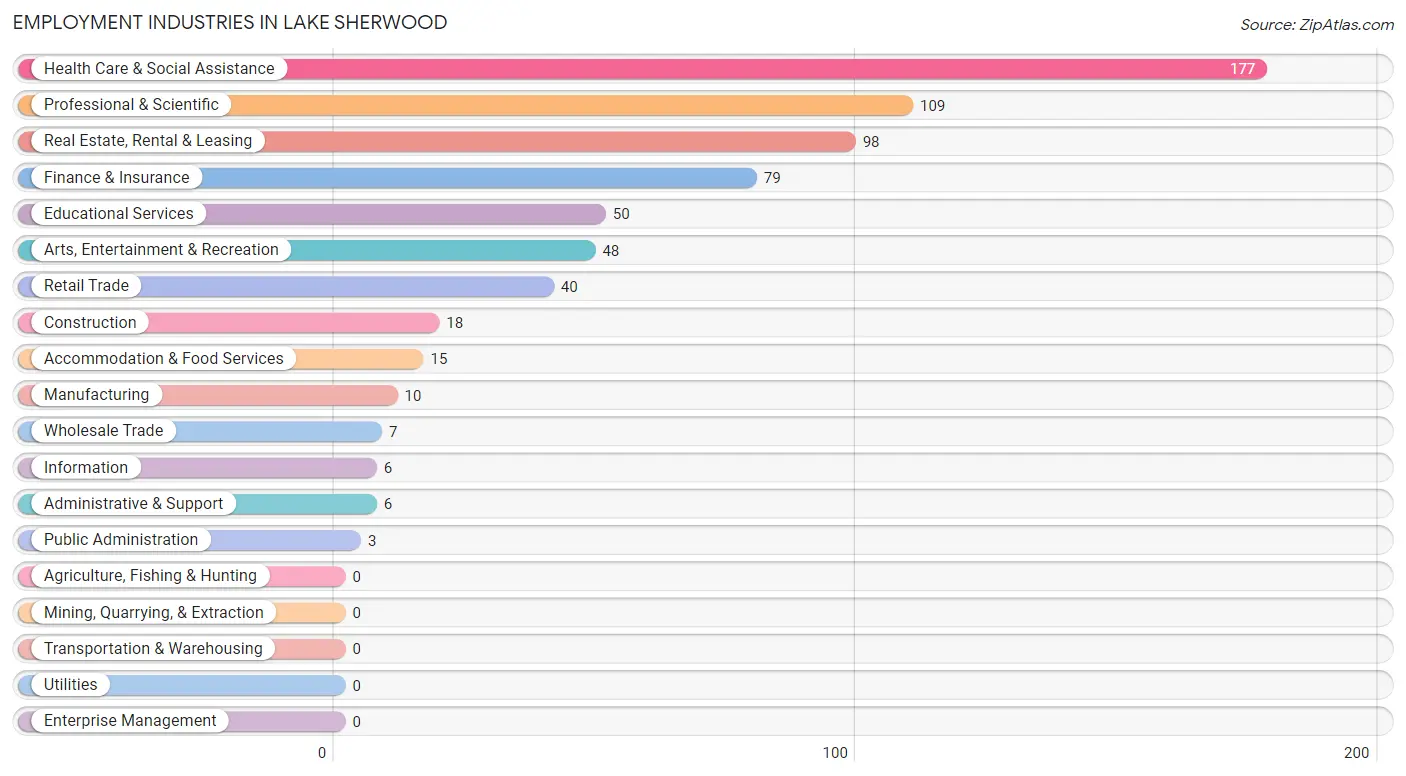
Employment Industries in Lake Sherwood
The major employment industries in Lake Sherwood include Health Care & Social Assistance (177 | 26.0%), Professional & Scientific (109 | 16.0%), Real Estate, Rental & Leasing (98 | 14.4%), Finance & Insurance (79 | 11.6%), and Educational Services (50 | 7.3%).
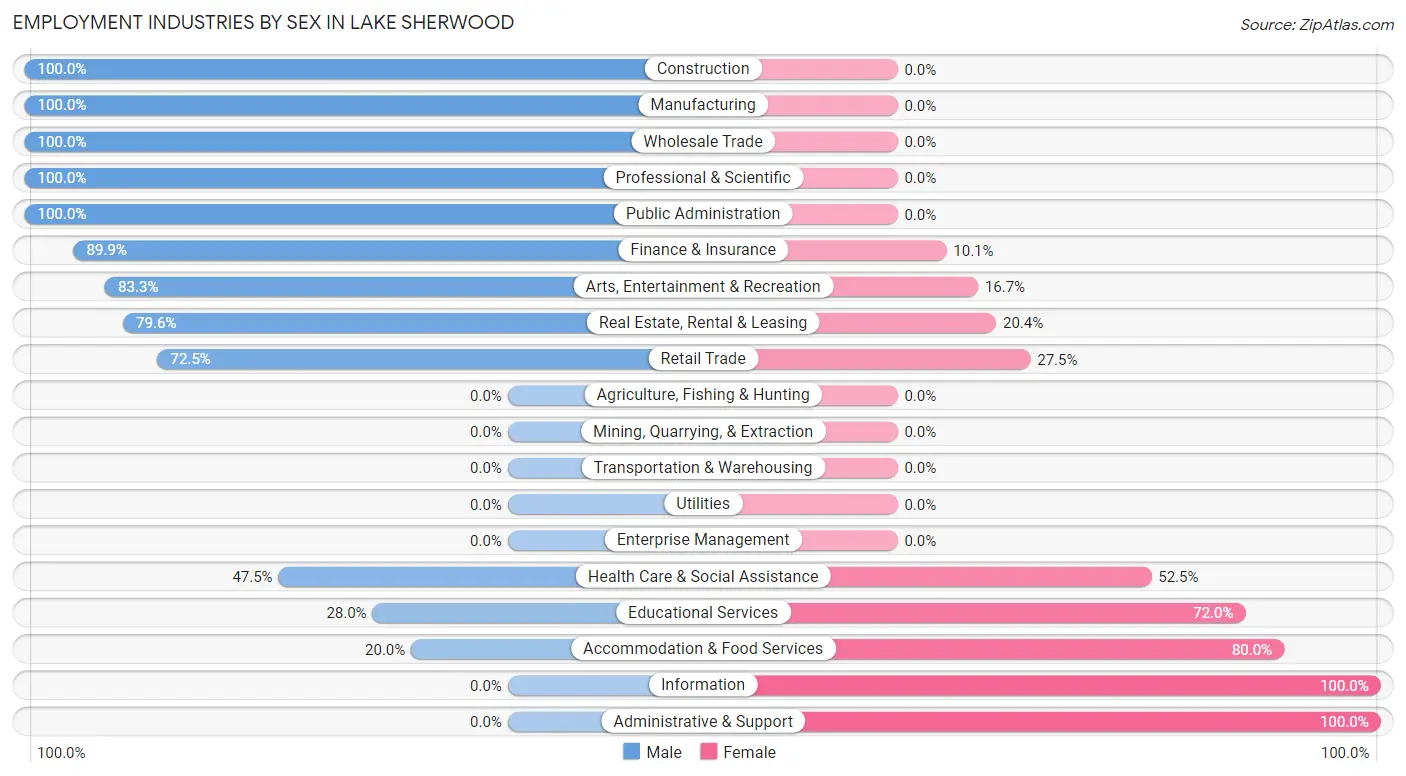
Employment Industries by Sex in Lake Sherwood
The Lake Sherwood industries that see more men than women are Construction (100.0%), Manufacturing (100.0%), and Wholesale Trade (100.0%), whereas the industries that tend to have a higher number of women are Information (100.0%), Administrative & Support (100.0%), and Accommodation & Food Services (80.0%).
| Industry | Male | Female |
| Agriculture, Fishing & Hunting | 0 (0.0%) | 0 (0.0%) |
| Mining, Quarrying, & Extraction | 0 (0.0%) | 0 (0.0%) |
| Construction | 18 (100.0%) | 0 (0.0%) |
| Manufacturing | 10 (100.0%) | 0 (0.0%) |
| Wholesale Trade | 7 (100.0%) | 0 (0.0%) |
| Retail Trade | 29 (72.5%) | 11 (27.5%) |
| Transportation & Warehousing | 0 (0.0%) | 0 (0.0%) |
| Utilities | 0 (0.0%) | 0 (0.0%) |
| Information | 0 (0.0%) | 6 (100.0%) |
| Finance & Insurance | 71 (89.9%) | 8 (10.1%) |
| Real Estate, Rental & Leasing | 78 (79.6%) | 20 (20.4%) |
| Professional & Scientific | 109 (100.0%) | 0 (0.0%) |
| Enterprise Management | 0 (0.0%) | 0 (0.0%) |
| Administrative & Support | 0 (0.0%) | 6 (100.0%) |
| Educational Services | 14 (28.0%) | 36 (72.0%) |
| Health Care & Social Assistance | 84 (47.5%) | 93 (52.5%) |
| Arts, Entertainment & Recreation | 40 (83.3%) | 8 (16.7%) |
| Accommodation & Food Services | 3 (20.0%) | 12 (80.0%) |
| Public Administration | 3 (100.0%) | 0 (0.0%) |
| Total | 480 (70.6%) | 200 (29.4%) |
Education in Lake Sherwood
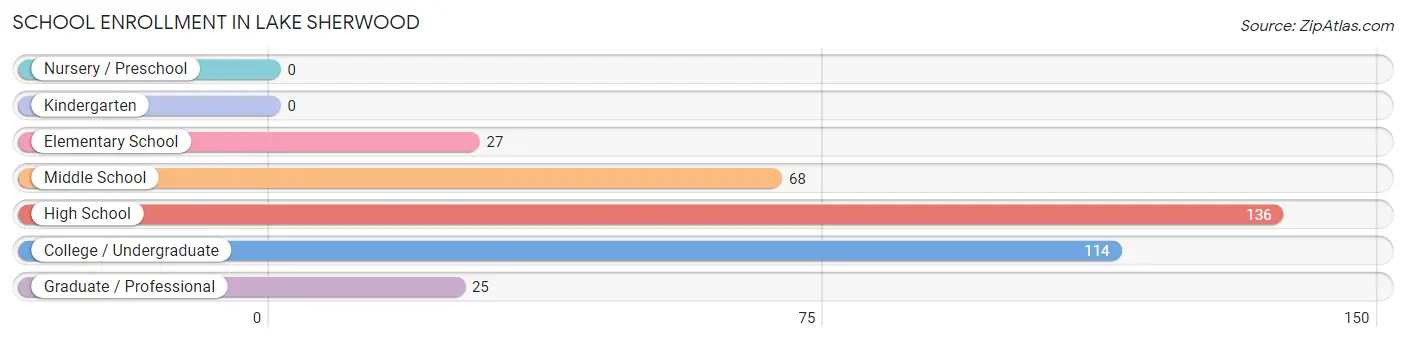
School Enrollment in Lake Sherwood
The most common levels of schooling among the 370 students in Lake Sherwood are high school (136 | 36.8%), college / undergraduate (114 | 30.8%), and middle school (68 | 18.4%).
| School Level | # Students | % Students |
| Nursery / Preschool | 0 | 0.0% |
| Kindergarten | 0 | 0.0% |
| Elementary School | 27 | 7.3% |
| Middle School | 68 | 18.4% |
| High School | 136 | 36.8% |
| College / Undergraduate | 114 | 30.8% |
| Graduate / Professional | 25 | 6.8% |
| Total | 370 | 100.0% |
School Enrollment by Age by Funding Source in Lake Sherwood
Out of a total of 370 students who are enrolled in schools in Lake Sherwood, 143 (38.6%) attend a private institution, while the remaining 227 (61.4%) are enrolled in public schools. The age group of 25 to 34 year olds has the highest likelihood of being enrolled in private schools, with 25 (100.0% in the age bracket) enrolled. Conversely, the age group of 5 to 9 year old has the lowest likelihood of being enrolled in a private school, with 18 (78.3% in the age bracket) attending a public institution.
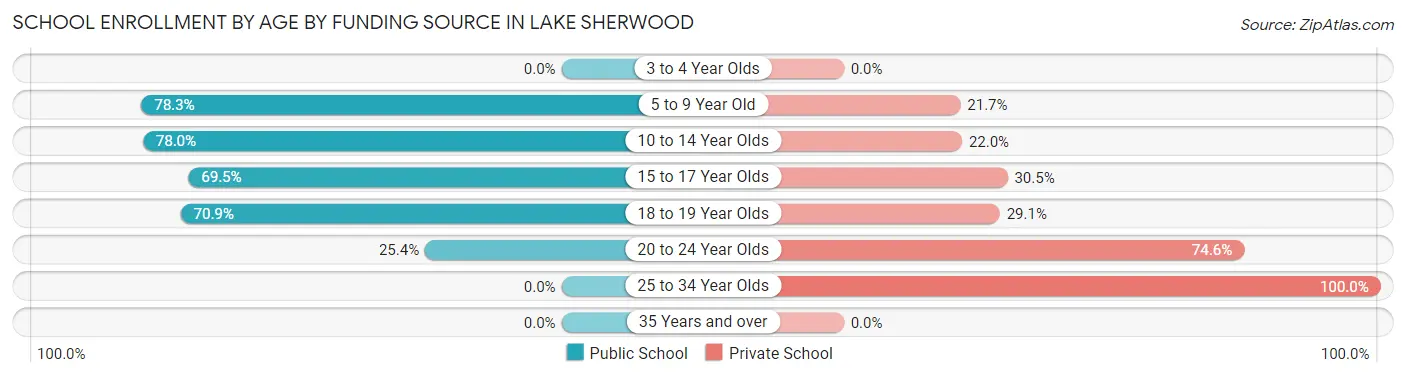
| Age Bracket | Public School | Private School |
| 3 to 4 Year Olds | 0 (0.0%) | 0 (0.0%) |
| 5 to 9 Year Old | 18 (78.3%) | 5 (21.7%) |
| 10 to 14 Year Olds | 92 (78.0%) | 26 (22.0%) |
| 15 to 17 Year Olds | 41 (69.5%) | 18 (30.5%) |
| 18 to 19 Year Olds | 61 (70.9%) | 25 (29.1%) |
| 20 to 24 Year Olds | 15 (25.4%) | 44 (74.6%) |
| 25 to 34 Year Olds | 0 (0.0%) | 25 (100.0%) |
| 35 Years and over | 0 (0.0%) | 0 (0.0%) |
| Total | 227 (61.4%) | 143 (38.6%) |
Educational Attainment by Field of Study in Lake Sherwood
Business (166 | 17.2%), education (132 | 13.7%), psychology (119 | 12.3%), social sciences (115 | 11.9%), and bio, nature & agricultural (81 | 8.4%) are the most common fields of study among 964 individuals in Lake Sherwood who have obtained a bachelor's degree or higher.
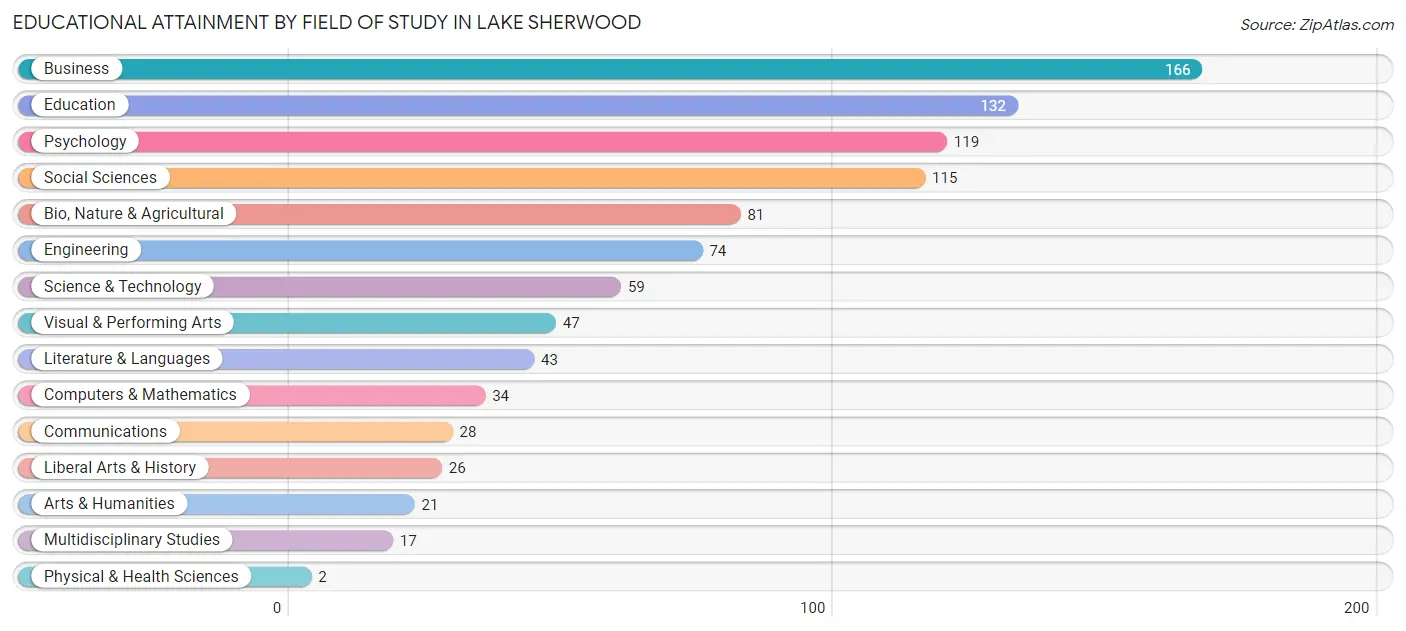
| Field of Study | # Graduates | % Graduates |
| Computers & Mathematics | 34 | 3.5% |
| Bio, Nature & Agricultural | 81 | 8.4% |
| Physical & Health Sciences | 2 | 0.2% |
| Psychology | 119 | 12.3% |
| Social Sciences | 115 | 11.9% |
| Engineering | 74 | 7.7% |
| Multidisciplinary Studies | 17 | 1.8% |
| Science & Technology | 59 | 6.1% |
| Business | 166 | 17.2% |
| Education | 132 | 13.7% |
| Literature & Languages | 43 | 4.5% |
| Liberal Arts & History | 26 | 2.7% |
| Visual & Performing Arts | 47 | 4.9% |
| Communications | 28 | 2.9% |
| Arts & Humanities | 21 | 2.2% |
| Total | 964 | 100.0% |
Transportation & Commute in Lake Sherwood
Vehicle Availability by Sex in Lake Sherwood
The most prevalent vehicle ownership categories in Lake Sherwood are males with 3 vehicles (194, accounting for 40.4%) and females with 3 vehicles (47, making up 97.0%).
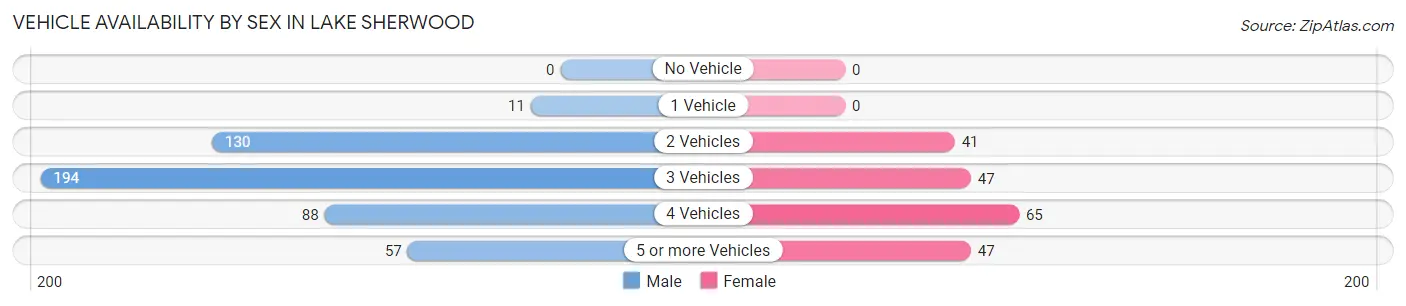
| Vehicles Available | Male | Female |
| No Vehicle | 0 (0.0%) | 0 (0.0%) |
| 1 Vehicle | 11 (2.3%) | 0 (0.0%) |
| 2 Vehicles | 130 (27.1%) | 41 (20.5%) |
| 3 Vehicles | 194 (40.4%) | 47 (23.5%) |
| 4 Vehicles | 88 (18.3%) | 65 (32.5%) |
| 5 or more Vehicles | 57 (11.9%) | 47 (23.5%) |
| Total | 480 (100.0%) | 200 (100.0%) |
Commute Time in Lake Sherwood
The most frequently occuring commute durations in Lake Sherwood are 15 to 19 minutes (109 commuters, 21.0%), 10 to 14 minutes (103 commuters, 19.9%), and 20 to 24 minutes (80 commuters, 15.4%).
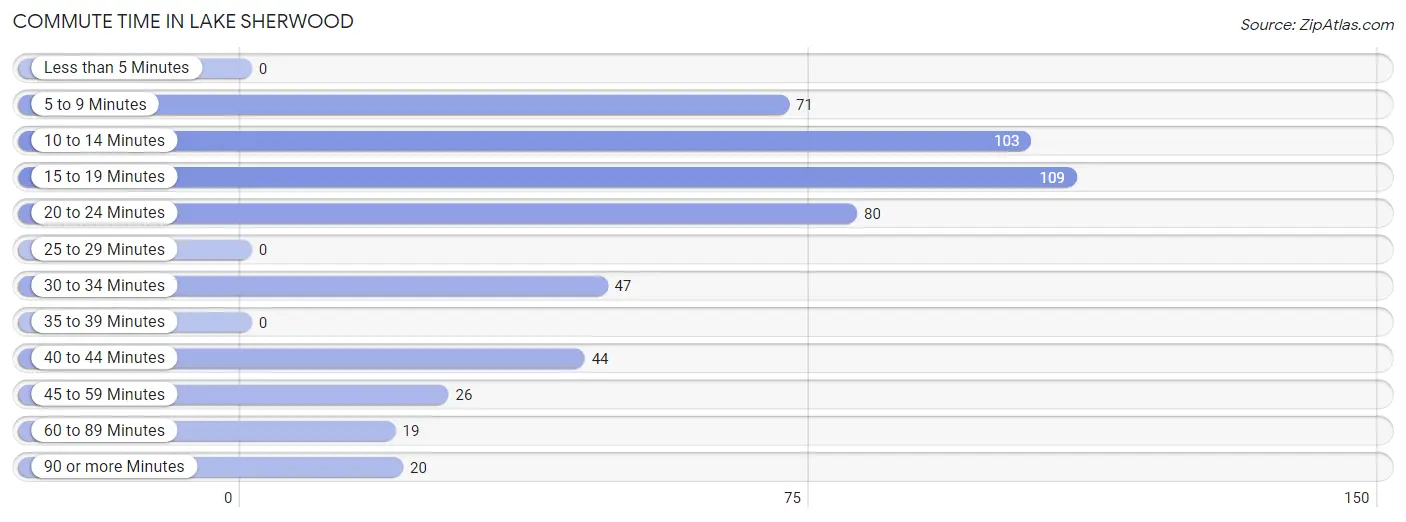
| Commute Time | # Commuters | % Commuters |
| Less than 5 Minutes | 0 | 0.0% |
| 5 to 9 Minutes | 71 | 13.7% |
| 10 to 14 Minutes | 103 | 19.9% |
| 15 to 19 Minutes | 109 | 21.0% |
| 20 to 24 Minutes | 80 | 15.4% |
| 25 to 29 Minutes | 0 | 0.0% |
| 30 to 34 Minutes | 47 | 9.1% |
| 35 to 39 Minutes | 0 | 0.0% |
| 40 to 44 Minutes | 44 | 8.5% |
| 45 to 59 Minutes | 26 | 5.0% |
| 60 to 89 Minutes | 19 | 3.7% |
| 90 or more Minutes | 20 | 3.8% |
Commute Time by Sex in Lake Sherwood
The most common commute times in Lake Sherwood are 10 to 14 minutes (91 commuters, 25.3%) for males and 15 to 19 minutes (52 commuters, 32.7%) for females.
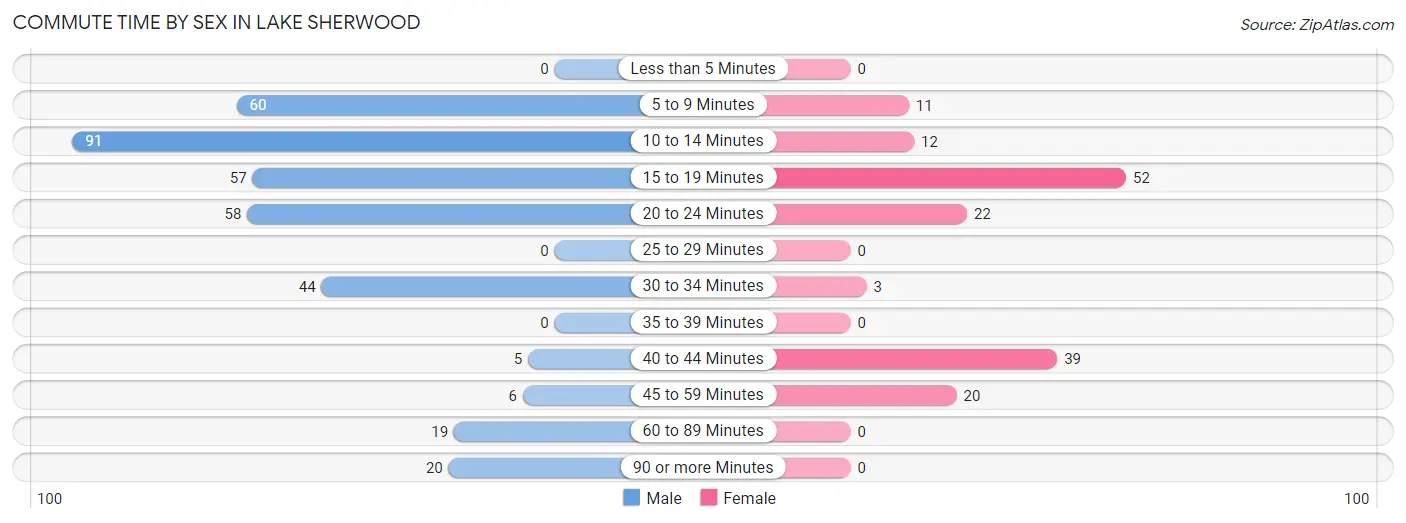
| Commute Time | Male | Female |
| Less than 5 Minutes | 0 (0.0%) | 0 (0.0%) |
| 5 to 9 Minutes | 60 (16.7%) | 11 (6.9%) |
| 10 to 14 Minutes | 91 (25.3%) | 12 (7.5%) |
| 15 to 19 Minutes | 57 (15.8%) | 52 (32.7%) |
| 20 to 24 Minutes | 58 (16.1%) | 22 (13.8%) |
| 25 to 29 Minutes | 0 (0.0%) | 0 (0.0%) |
| 30 to 34 Minutes | 44 (12.2%) | 3 (1.9%) |
| 35 to 39 Minutes | 0 (0.0%) | 0 (0.0%) |
| 40 to 44 Minutes | 5 (1.4%) | 39 (24.5%) |
| 45 to 59 Minutes | 6 (1.7%) | 20 (12.6%) |
| 60 to 89 Minutes | 19 (5.3%) | 0 (0.0%) |
| 90 or more Minutes | 20 (5.6%) | 0 (0.0%) |
Time of Departure to Work by Sex in Lake Sherwood
The most frequent times of departure to work in Lake Sherwood are 8:00 AM to 8:29 AM (124, 34.4%) for males and 6:00 AM to 6:29 AM (54, 34.0%) for females.
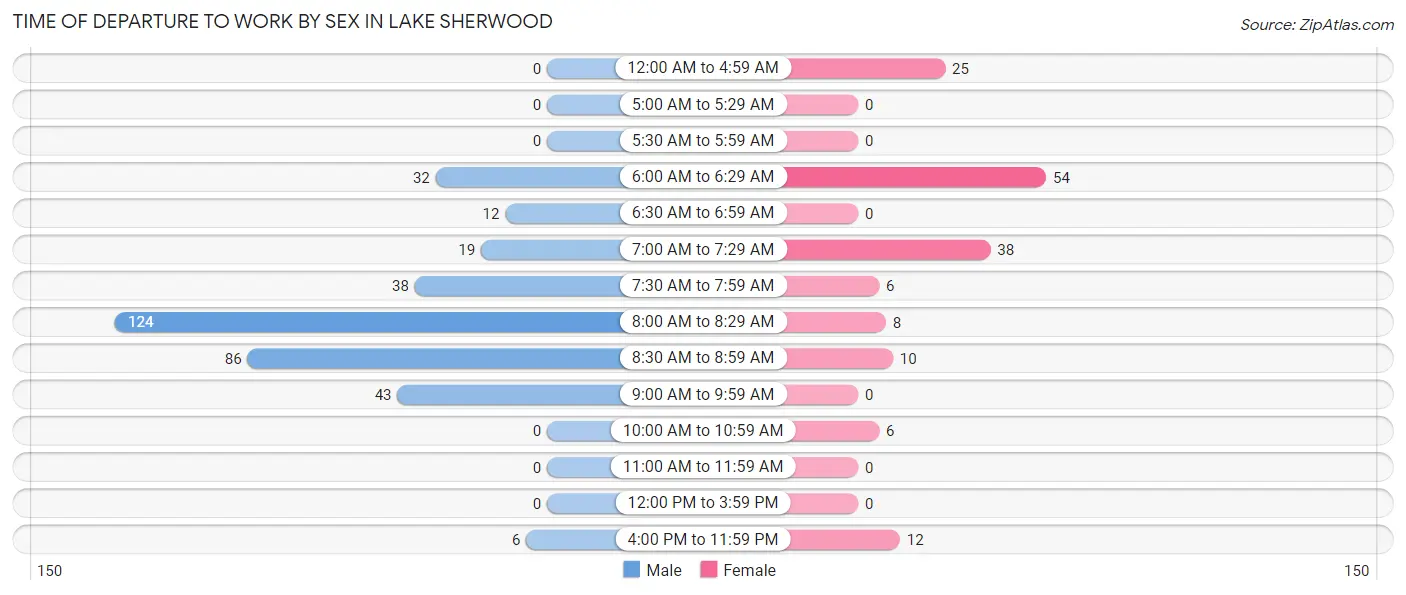
| Time of Departure | Male | Female |
| 12:00 AM to 4:59 AM | 0 (0.0%) | 25 (15.7%) |
| 5:00 AM to 5:29 AM | 0 (0.0%) | 0 (0.0%) |
| 5:30 AM to 5:59 AM | 0 (0.0%) | 0 (0.0%) |
| 6:00 AM to 6:29 AM | 32 (8.9%) | 54 (34.0%) |
| 6:30 AM to 6:59 AM | 12 (3.3%) | 0 (0.0%) |
| 7:00 AM to 7:29 AM | 19 (5.3%) | 38 (23.9%) |
| 7:30 AM to 7:59 AM | 38 (10.6%) | 6 (3.8%) |
| 8:00 AM to 8:29 AM | 124 (34.4%) | 8 (5.0%) |
| 8:30 AM to 8:59 AM | 86 (23.9%) | 10 (6.3%) |
| 9:00 AM to 9:59 AM | 43 (11.9%) | 0 (0.0%) |
| 10:00 AM to 10:59 AM | 0 (0.0%) | 6 (3.8%) |
| 11:00 AM to 11:59 AM | 0 (0.0%) | 0 (0.0%) |
| 12:00 PM to 3:59 PM | 0 (0.0%) | 0 (0.0%) |
| 4:00 PM to 11:59 PM | 6 (1.7%) | 12 (7.5%) |
| Total | 360 (100.0%) | 159 (100.0%) |
Housing Occupancy in Lake Sherwood
Occupancy by Ownership in Lake Sherwood
Of the total 616 dwellings in Lake Sherwood, owner-occupied units account for 568 (92.2%), while renter-occupied units make up 48 (7.8%).
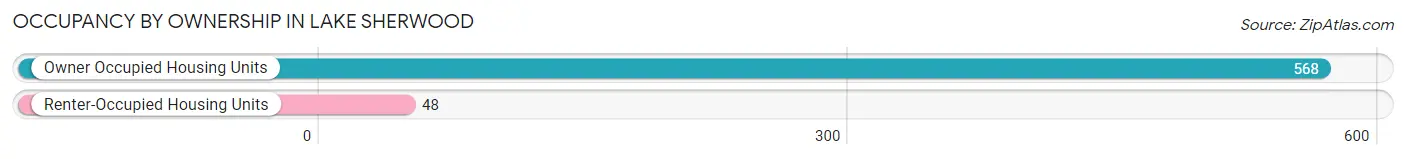
| Occupancy | # Housing Units | % Housing Units |
| Owner Occupied Housing Units | 568 | 92.2% |
| Renter-Occupied Housing Units | 48 | 7.8% |
| Total Occupied Housing Units | 616 | 100.0% |
Occupancy by Household Size in Lake Sherwood
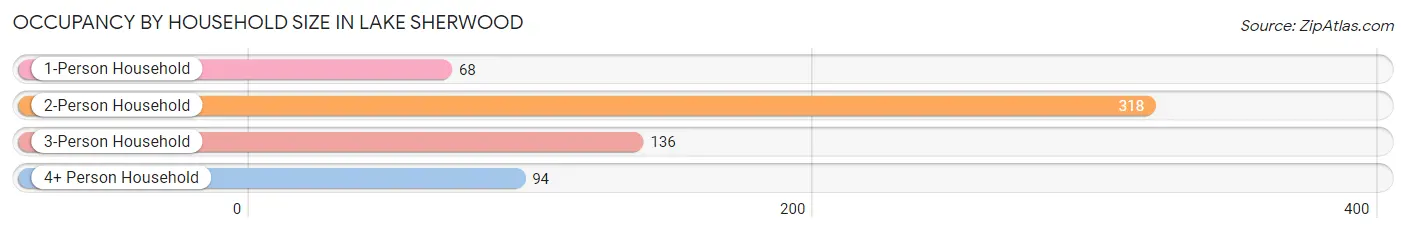
| Household Size | # Housing Units | % Housing Units |
| 1-Person Household | 68 | 11.0% |
| 2-Person Household | 318 | 51.6% |
| 3-Person Household | 136 | 22.1% |
| 4+ Person Household | 94 | 15.3% |
| Total Housing Units | 616 | 100.0% |
Occupancy by Ownership by Household Size in Lake Sherwood
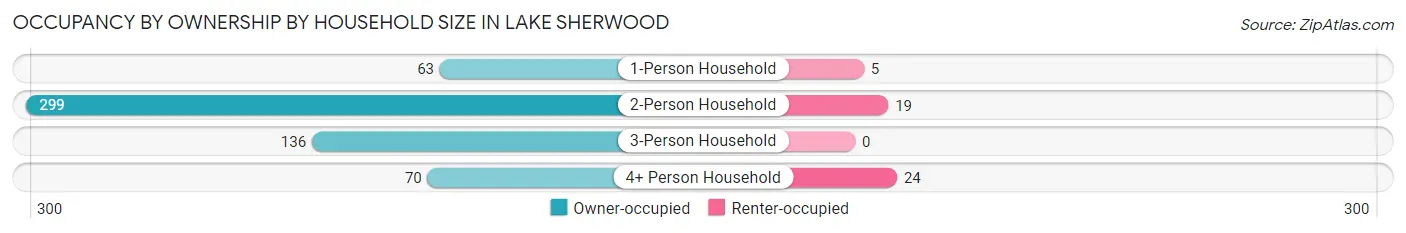
| Household Size | Owner-occupied | Renter-occupied |
| 1-Person Household | 63 (92.6%) | 5 (7.3%) |
| 2-Person Household | 299 (94.0%) | 19 (6.0%) |
| 3-Person Household | 136 (100.0%) | 0 (0.0%) |
| 4+ Person Household | 70 (74.5%) | 24 (25.5%) |
| Total Housing Units | 568 (92.2%) | 48 (7.8%) |
Occupancy by Educational Attainment in Lake Sherwood
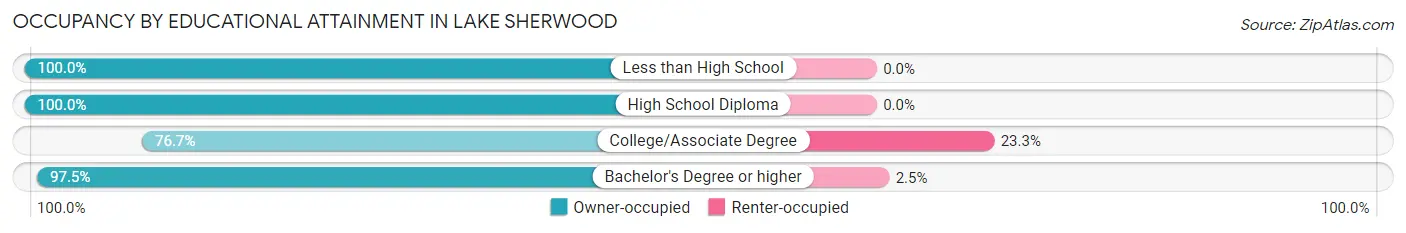
| Household Size | Owner-occupied | Renter-occupied |
| Less than High School | 7 (100.0%) | 0 (0.0%) |
| High School Diploma | 44 (100.0%) | 0 (0.0%) |
| College/Associate Degree | 125 (76.7%) | 38 (23.3%) |
| Bachelor's Degree or higher | 392 (97.5%) | 10 (2.5%) |
Occupancy by Age of Householder in Lake Sherwood
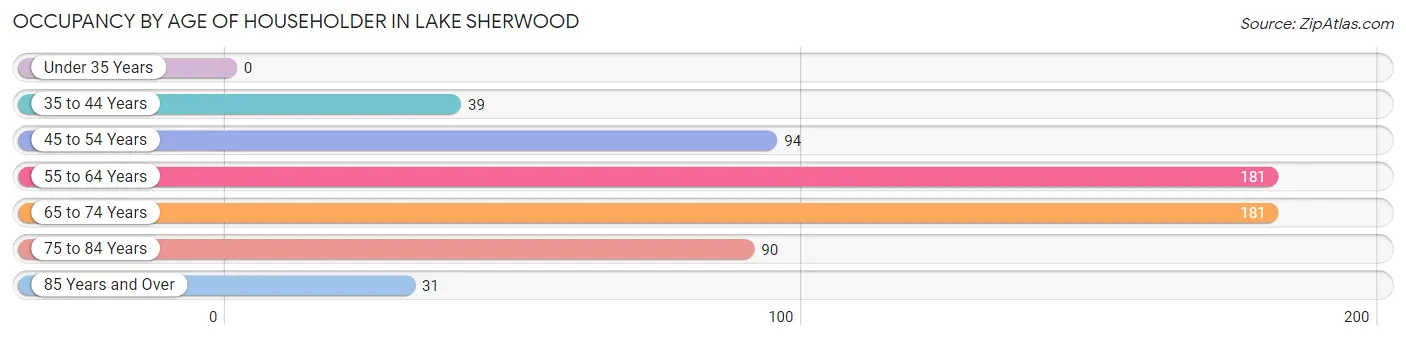
| Age Bracket | # Households | % Households |
| Under 35 Years | 0 | 0.0% |
| 35 to 44 Years | 39 | 6.3% |
| 45 to 54 Years | 94 | 15.3% |
| 55 to 64 Years | 181 | 29.4% |
| 65 to 74 Years | 181 | 29.4% |
| 75 to 84 Years | 90 | 14.6% |
| 85 Years and Over | 31 | 5.0% |
| Total | 616 | 100.0% |
Housing Finances in Lake Sherwood
Median Income by Occupancy in Lake Sherwood
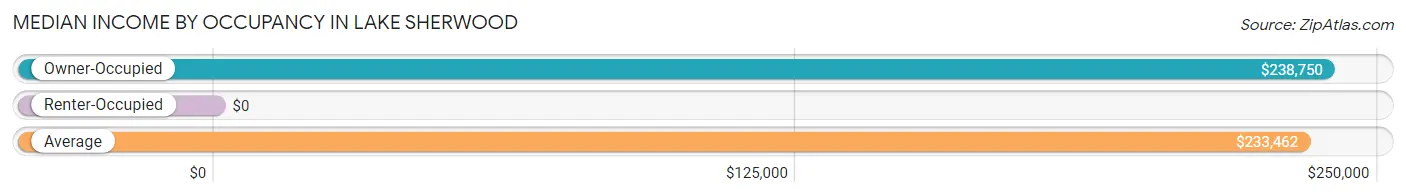
| Occupancy Type | # Households | Median Income |
| Owner-Occupied | 568 (92.2%) | $238,750 |
| Renter-Occupied | 48 (7.8%) | $0 |
| Average | 616 (100.0%) | $233,462 |
Occupancy by Householder Income Bracket in Lake Sherwood
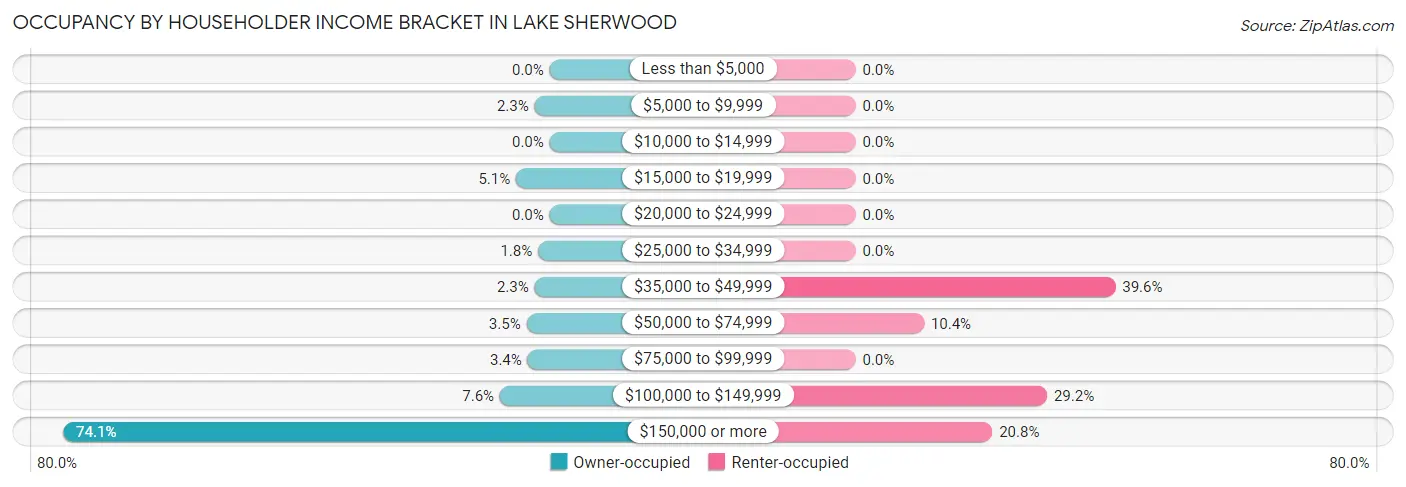
| Income Bracket | Owner-occupied | Renter-occupied |
| Less than $5,000 | 0 (0.0%) | 0 (0.0%) |
| $5,000 to $9,999 | 13 (2.3%) | 0 (0.0%) |
| $10,000 to $14,999 | 0 (0.0%) | 0 (0.0%) |
| $15,000 to $19,999 | 29 (5.1%) | 0 (0.0%) |
| $20,000 to $24,999 | 0 (0.0%) | 0 (0.0%) |
| $25,000 to $34,999 | 10 (1.8%) | 0 (0.0%) |
| $35,000 to $49,999 | 13 (2.3%) | 19 (39.6%) |
| $50,000 to $74,999 | 20 (3.5%) | 5 (10.4%) |
| $75,000 to $99,999 | 19 (3.4%) | 0 (0.0%) |
| $100,000 to $149,999 | 43 (7.6%) | 14 (29.2%) |
| $150,000 or more | 421 (74.1%) | 10 (20.8%) |
| Total | 568 (100.0%) | 48 (100.0%) |
Monthly Housing Cost Tiers in Lake Sherwood
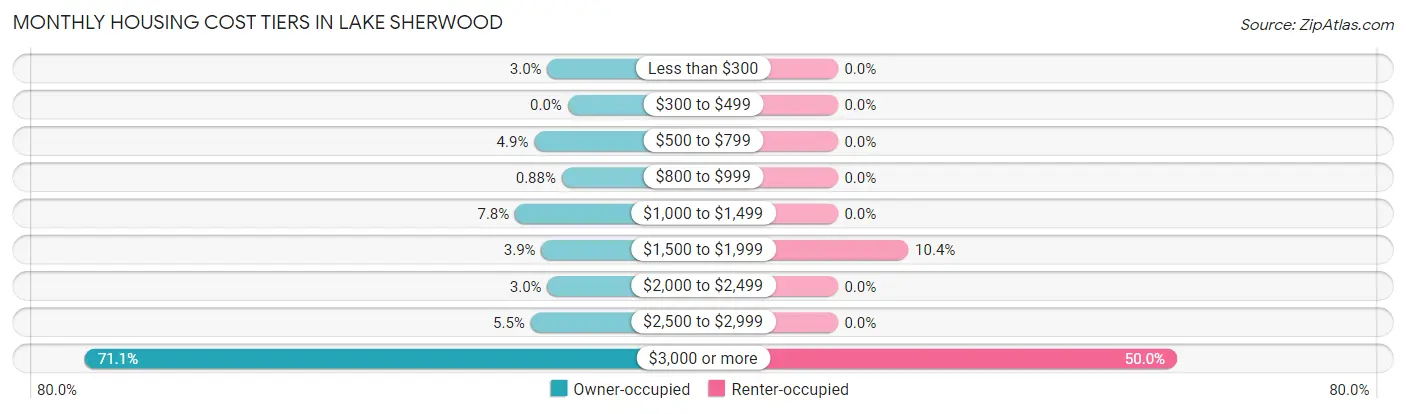
| Monthly Cost | Owner-occupied | Renter-occupied |
| Less than $300 | 17 (3.0%) | 0 (0.0%) |
| $300 to $499 | 0 (0.0%) | 0 (0.0%) |
| $500 to $799 | 28 (4.9%) | 0 (0.0%) |
| $800 to $999 | 5 (0.9%) | 0 (0.0%) |
| $1,000 to $1,499 | 44 (7.7%) | 0 (0.0%) |
| $1,500 to $1,999 | 22 (3.9%) | 5 (10.4%) |
| $2,000 to $2,499 | 17 (3.0%) | 0 (0.0%) |
| $2,500 to $2,999 | 31 (5.5%) | 0 (0.0%) |
| $3,000 or more | 404 (71.1%) | 24 (50.0%) |
| Total | 568 (100.0%) | 48 (100.0%) |
Physical Housing Characteristics in Lake Sherwood
Housing Structures in Lake Sherwood
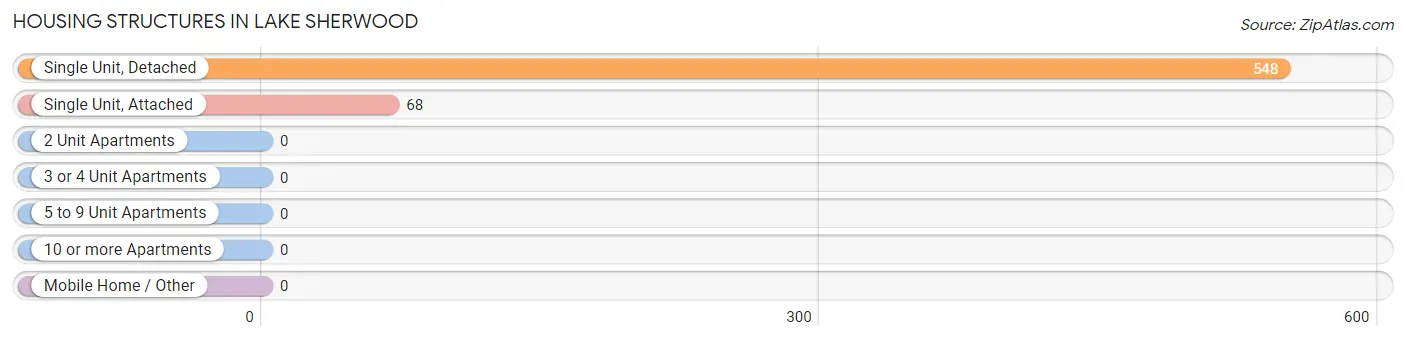
| Structure Type | # Housing Units | % Housing Units |
| Single Unit, Detached | 548 | 89.0% |
| Single Unit, Attached | 68 | 11.0% |
| 2 Unit Apartments | 0 | 0.0% |
| 3 or 4 Unit Apartments | 0 | 0.0% |
| 5 to 9 Unit Apartments | 0 | 0.0% |
| 10 or more Apartments | 0 | 0.0% |
| Mobile Home / Other | 0 | 0.0% |
| Total | 616 | 100.0% |
Housing Structures by Occupancy in Lake Sherwood
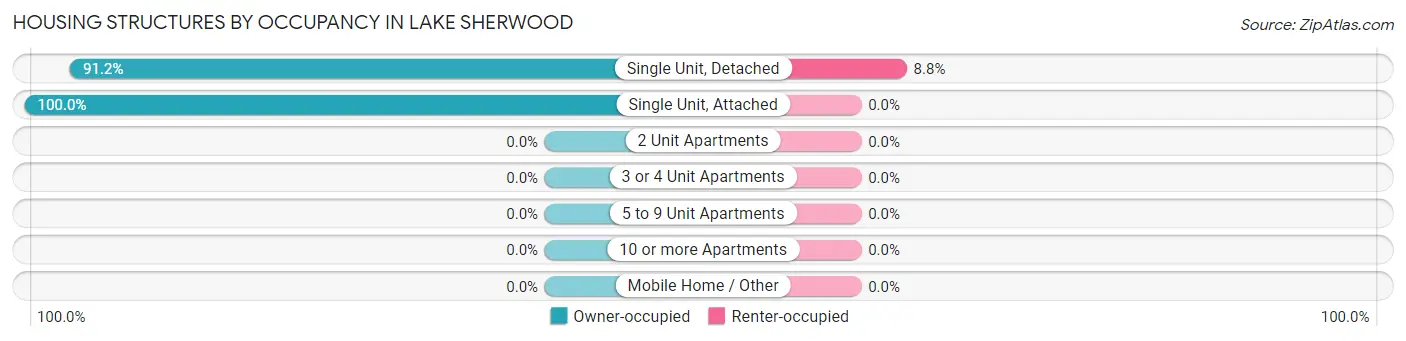
| Structure Type | Owner-occupied | Renter-occupied |
| Single Unit, Detached | 500 (91.2%) | 48 (8.8%) |
| Single Unit, Attached | 68 (100.0%) | 0 (0.0%) |
| 2 Unit Apartments | 0 (0.0%) | 0 (0.0%) |
| 3 or 4 Unit Apartments | 0 (0.0%) | 0 (0.0%) |
| 5 to 9 Unit Apartments | 0 (0.0%) | 0 (0.0%) |
| 10 or more Apartments | 0 (0.0%) | 0 (0.0%) |
| Mobile Home / Other | 0 (0.0%) | 0 (0.0%) |
| Total | 568 (92.2%) | 48 (7.8%) |
Housing Structures by Number of Rooms in Lake Sherwood
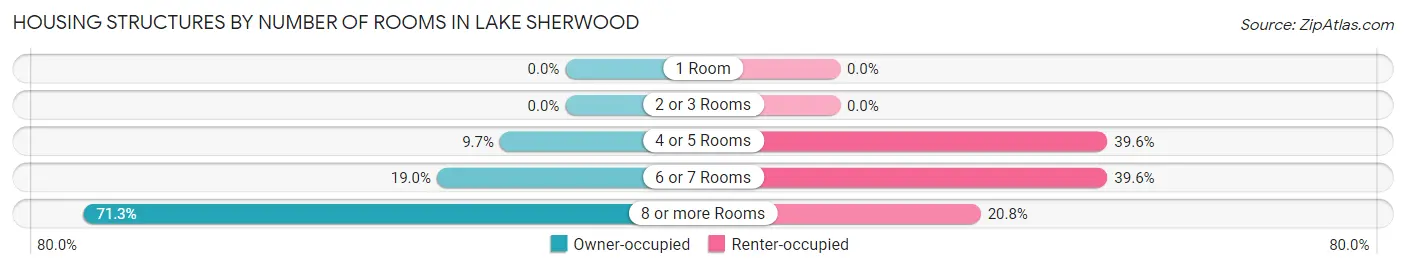
| Number of Rooms | Owner-occupied | Renter-occupied |
| 1 Room | 0 (0.0%) | 0 (0.0%) |
| 2 or 3 Rooms | 0 (0.0%) | 0 (0.0%) |
| 4 or 5 Rooms | 55 (9.7%) | 19 (39.6%) |
| 6 or 7 Rooms | 108 (19.0%) | 19 (39.6%) |
| 8 or more Rooms | 405 (71.3%) | 10 (20.8%) |
| Total | 568 (100.0%) | 48 (100.0%) |
Housing Structure by Heating Type in Lake Sherwood
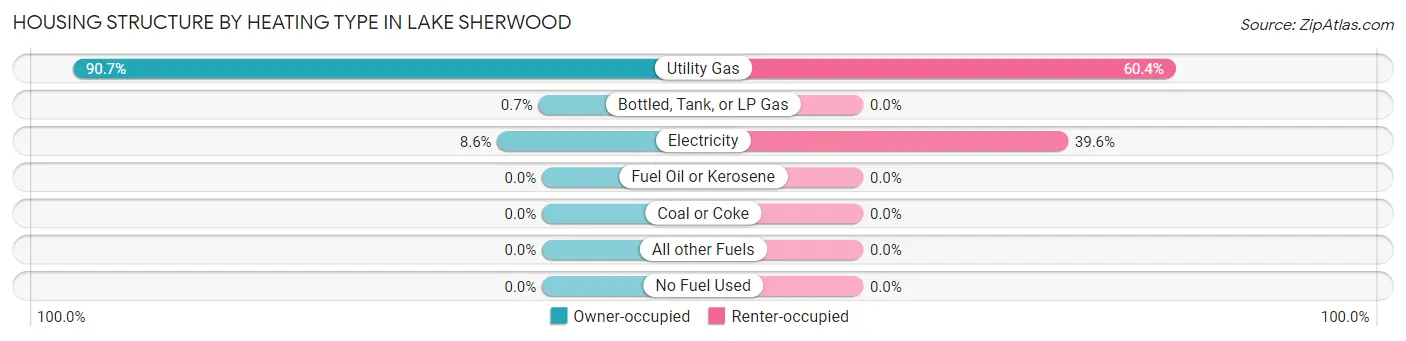
| Heating Type | Owner-occupied | Renter-occupied |
| Utility Gas | 515 (90.7%) | 29 (60.4%) |
| Bottled, Tank, or LP Gas | 4 (0.7%) | 0 (0.0%) |
| Electricity | 49 (8.6%) | 19 (39.6%) |
| Fuel Oil or Kerosene | 0 (0.0%) | 0 (0.0%) |
| Coal or Coke | 0 (0.0%) | 0 (0.0%) |
| All other Fuels | 0 (0.0%) | 0 (0.0%) |
| No Fuel Used | 0 (0.0%) | 0 (0.0%) |
| Total | 568 (100.0%) | 48 (100.0%) |
Household Vehicle Usage in Lake Sherwood
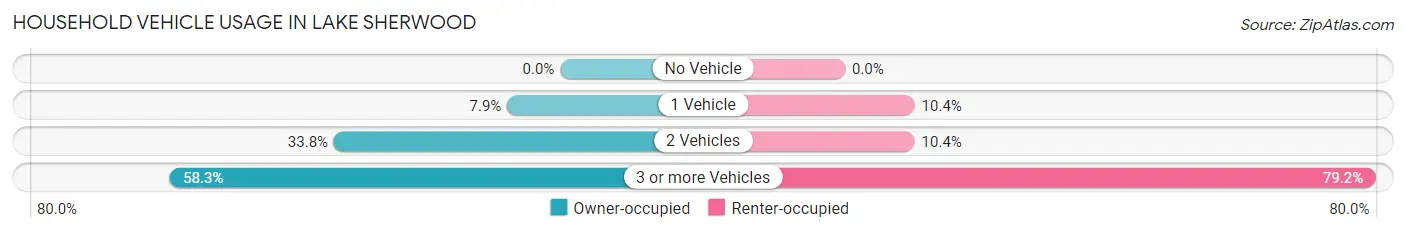
| Vehicles per Household | Owner-occupied | Renter-occupied |
| No Vehicle | 0 (0.0%) | 0 (0.0%) |
| 1 Vehicle | 45 (7.9%) | 5 (10.4%) |
| 2 Vehicles | 192 (33.8%) | 5 (10.4%) |
| 3 or more Vehicles | 331 (58.3%) | 38 (79.2%) |
| Total | 568 (100.0%) | 48 (100.0%) |
Real Estate & Mortgages in Lake Sherwood
Real Estate and Mortgage Overview in Lake Sherwood
| Characteristic | Without Mortgage | With Mortgage |
| Housing Units | 95 | 473 |
| Median Property Value | $2,000,001 | $1,973,800 |
| Median Household Income | $171,094 | $370 |
| Monthly Housing Costs | $1,501 | $377 |
| Real Estate Taxes | $10,001 | $0 |
Property Value by Mortgage Status in Lake Sherwood
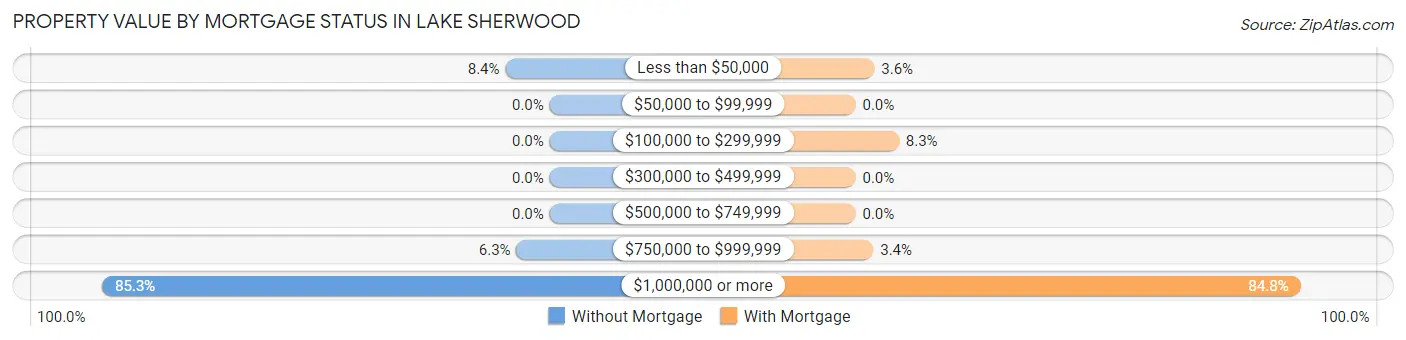
| Property Value | Without Mortgage | With Mortgage |
| Less than $50,000 | 8 (8.4%) | 17 (3.6%) |
| $50,000 to $99,999 | 0 (0.0%) | 0 (0.0%) |
| $100,000 to $299,999 | 0 (0.0%) | 39 (8.3%) |
| $300,000 to $499,999 | 0 (0.0%) | 0 (0.0%) |
| $500,000 to $749,999 | 0 (0.0%) | 0 (0.0%) |
| $750,000 to $999,999 | 6 (6.3%) | 16 (3.4%) |
| $1,000,000 or more | 81 (85.3%) | 401 (84.8%) |
| Total | 95 (100.0%) | 473 (100.0%) |
Household Income by Mortgage Status in Lake Sherwood
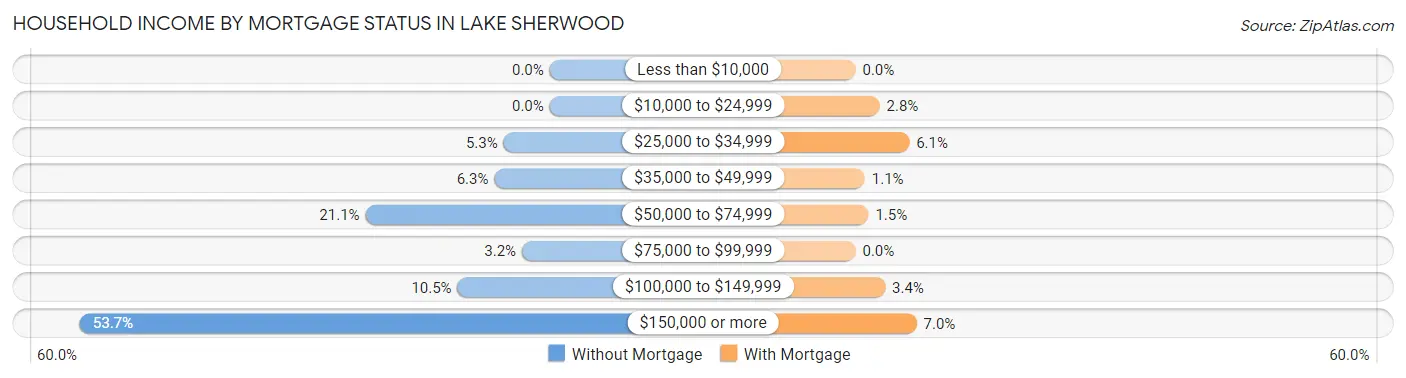
| Household Income | Without Mortgage | With Mortgage |
| Less than $10,000 | 0 (0.0%) | 0 (0.0%) |
| $10,000 to $24,999 | 0 (0.0%) | 13 (2.8%) |
| $25,000 to $34,999 | 5 (5.3%) | 29 (6.1%) |
| $35,000 to $49,999 | 6 (6.3%) | 5 (1.1%) |
| $50,000 to $74,999 | 20 (21.0%) | 7 (1.5%) |
| $75,000 to $99,999 | 3 (3.2%) | 0 (0.0%) |
| $100,000 to $149,999 | 10 (10.5%) | 16 (3.4%) |
| $150,000 or more | 51 (53.7%) | 33 (7.0%) |
| Total | 95 (100.0%) | 473 (100.0%) |
Property Value to Household Income Ratio in Lake Sherwood
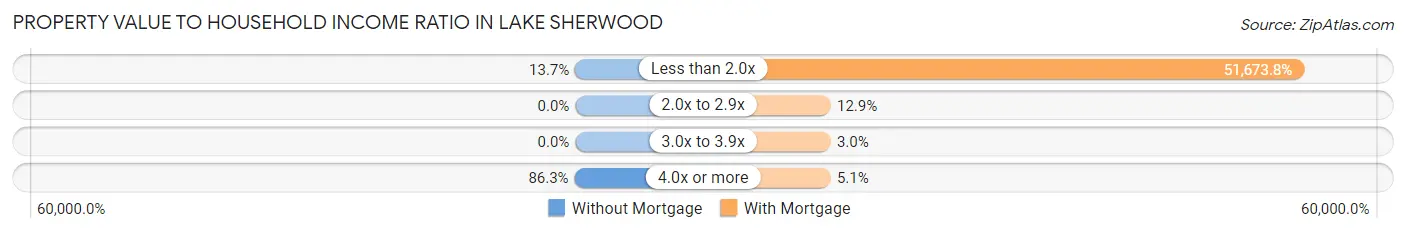
| Value-to-Income Ratio | Without Mortgage | With Mortgage |
| Less than 2.0x | 13 (13.7%) | 244,417 (51,673.8%) |
| 2.0x to 2.9x | 0 (0.0%) | 61 (12.9%) |
| 3.0x to 3.9x | 0 (0.0%) | 14 (3.0%) |
| 4.0x or more | 82 (86.3%) | 24 (5.1%) |
| Total | 95 (100.0%) | 473 (100.0%) |
Real Estate Taxes by Mortgage Status in Lake Sherwood
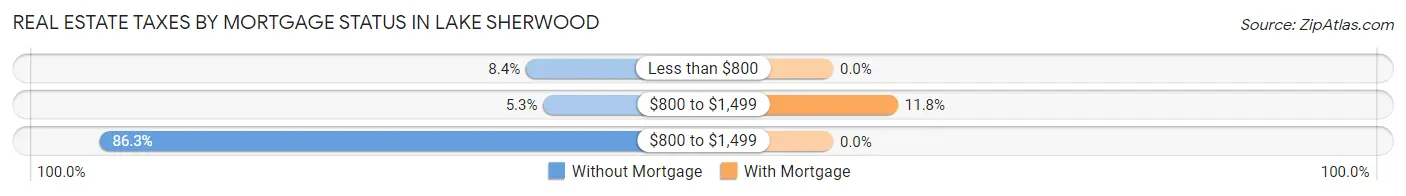
| Property Taxes | Without Mortgage | With Mortgage |
| Less than $800 | 8 (8.4%) | 0 (0.0%) |
| $800 to $1,499 | 5 (5.3%) | 56 (11.8%) |
| $800 to $1,499 | 82 (86.3%) | 0 (0.0%) |
| Total | 95 (100.0%) | 473 (100.0%) |
Health & Disability in Lake Sherwood
Health Insurance Coverage by Age in Lake Sherwood
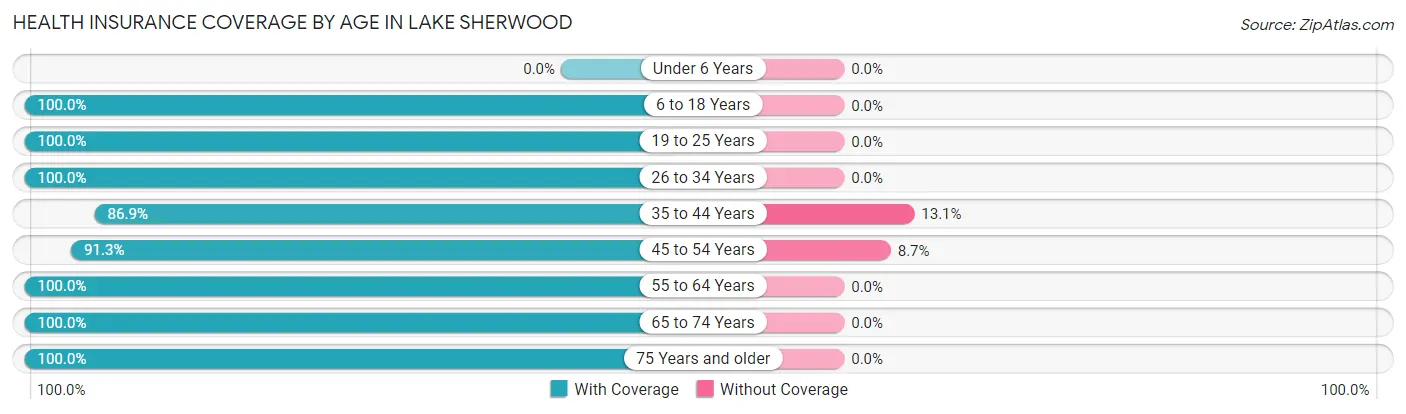
| Age Bracket | With Coverage | Without Coverage |
| Under 6 Years | 0 (0.0%) | 0 (0.0%) |
| 6 to 18 Years | 246 (100.0%) | 0 (0.0%) |
| 19 to 25 Years | 124 (100.0%) | 0 (0.0%) |
| 26 to 34 Years | 55 (100.0%) | 0 (0.0%) |
| 35 to 44 Years | 133 (86.9%) | 20 (13.1%) |
| 45 to 54 Years | 179 (91.3%) | 17 (8.7%) |
| 55 to 64 Years | 360 (100.0%) | 0 (0.0%) |
| 65 to 74 Years | 284 (100.0%) | 0 (0.0%) |
| 75 Years and older | 199 (100.0%) | 0 (0.0%) |
| Total | 1,580 (97.7%) | 37 (2.3%) |
Health Insurance Coverage by Citizenship Status in Lake Sherwood
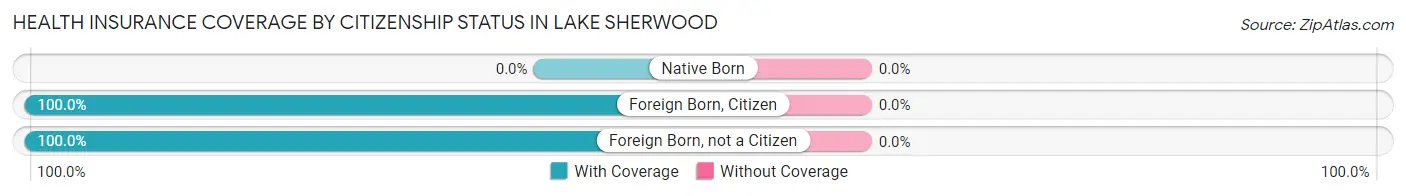
| Citizenship Status | With Coverage | Without Coverage |
| Native Born | 0 (0.0%) | 0 (0.0%) |
| Foreign Born, Citizen | 246 (100.0%) | 0 (0.0%) |
| Foreign Born, not a Citizen | 124 (100.0%) | 0 (0.0%) |
Health Insurance Coverage by Household Income in Lake Sherwood
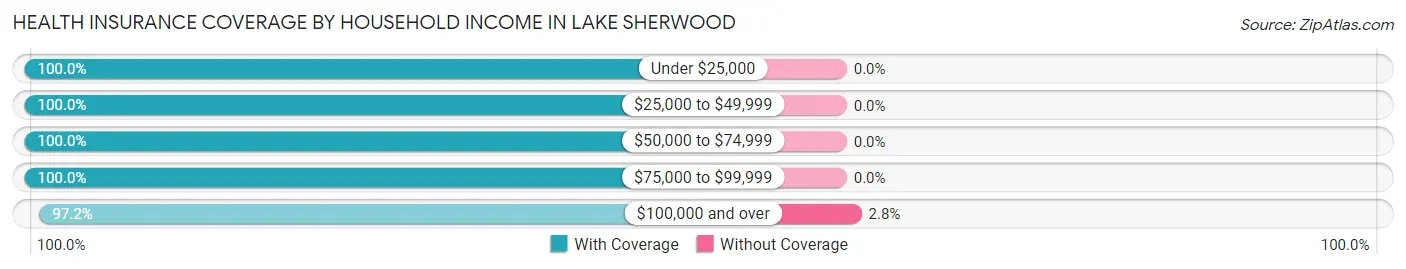
| Household Income | With Coverage | Without Coverage |
| Under $25,000 | 58 (100.0%) | 0 (0.0%) |
| $25,000 to $49,999 | 140 (100.0%) | 0 (0.0%) |
| $50,000 to $74,999 | 66 (100.0%) | 0 (0.0%) |
| $75,000 to $99,999 | 22 (100.0%) | 0 (0.0%) |
| $100,000 and over | 1,294 (97.2%) | 37 (2.8%) |
Public vs Private Health Insurance Coverage by Age in Lake Sherwood
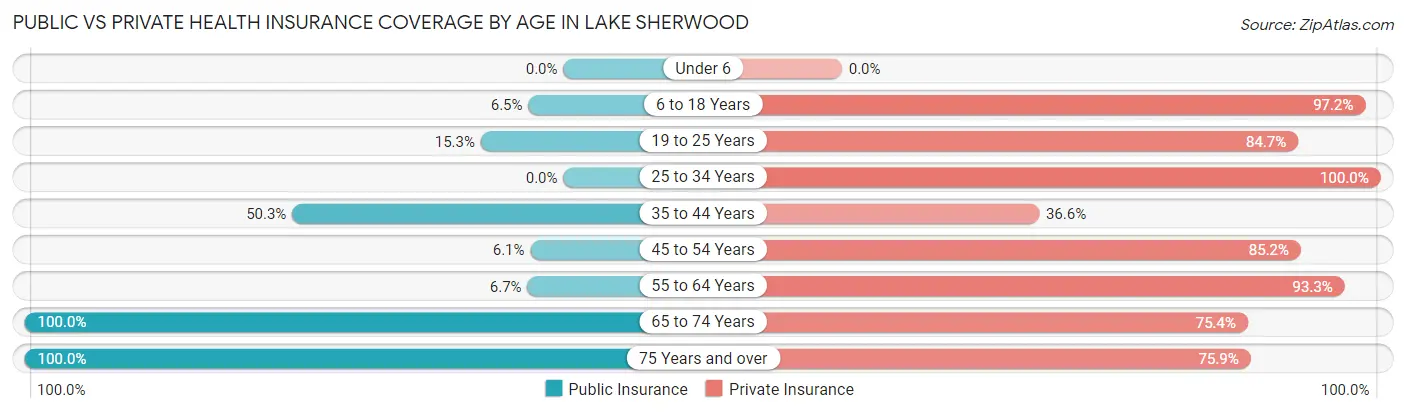
| Age Bracket | Public Insurance | Private Insurance |
| Under 6 | 0 (0.0%) | 0 (0.0%) |
| 6 to 18 Years | 16 (6.5%) | 239 (97.2%) |
| 19 to 25 Years | 19 (15.3%) | 105 (84.7%) |
| 25 to 34 Years | 0 (0.0%) | 55 (100.0%) |
| 35 to 44 Years | 77 (50.3%) | 56 (36.6%) |
| 45 to 54 Years | 12 (6.1%) | 167 (85.2%) |
| 55 to 64 Years | 24 (6.7%) | 336 (93.3%) |
| 65 to 74 Years | 284 (100.0%) | 214 (75.3%) |
| 75 Years and over | 199 (100.0%) | 151 (75.9%) |
| Total | 631 (39.0%) | 1,323 (81.8%) |
Disability Status by Sex by Age in Lake Sherwood
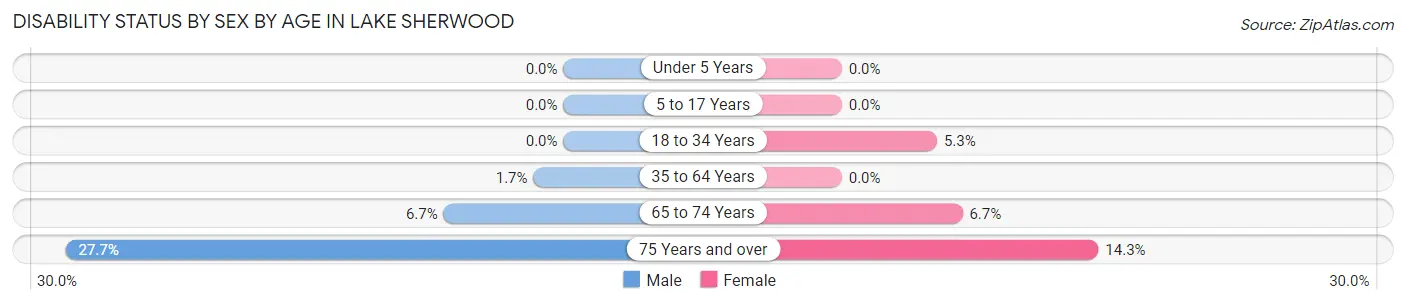
| Age Bracket | Male | Female |
| Under 5 Years | 0 (0.0%) | 0 (0.0%) |
| 5 to 17 Years | 0 (0.0%) | 0 (0.0%) |
| 18 to 34 Years | 0 (0.0%) | 7 (5.3%) |
| 35 to 64 Years | 5 (1.7%) | 0 (0.0%) |
| 65 to 74 Years | 11 (6.7%) | 8 (6.7%) |
| 75 Years and over | 28 (27.7%) | 14 (14.3%) |
Disability Class by Sex by Age in Lake Sherwood
Disability Class: Hearing Difficulty
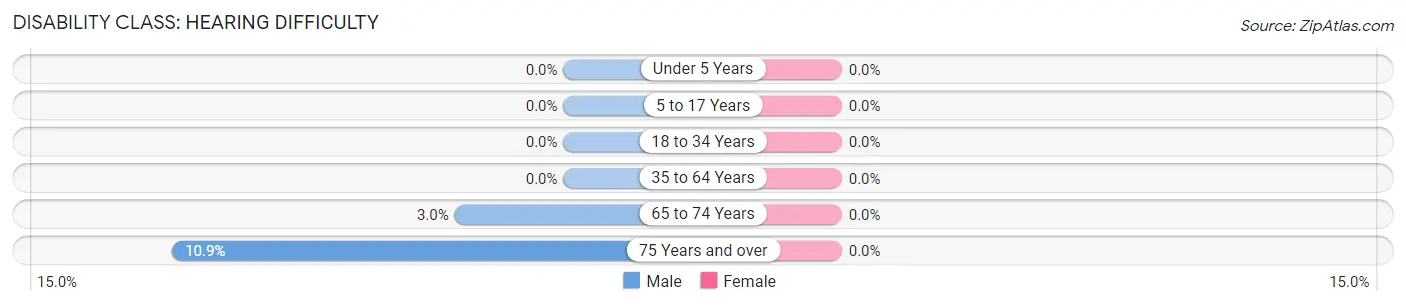
| Age Bracket | Male | Female |
| Under 5 Years | 0 (0.0%) | 0 (0.0%) |
| 5 to 17 Years | 0 (0.0%) | 0 (0.0%) |
| 18 to 34 Years | 0 (0.0%) | 0 (0.0%) |
| 35 to 64 Years | 0 (0.0%) | 0 (0.0%) |
| 65 to 74 Years | 5 (3.0%) | 0 (0.0%) |
| 75 Years and over | 11 (10.9%) | 0 (0.0%) |
Disability Class: Vision Difficulty
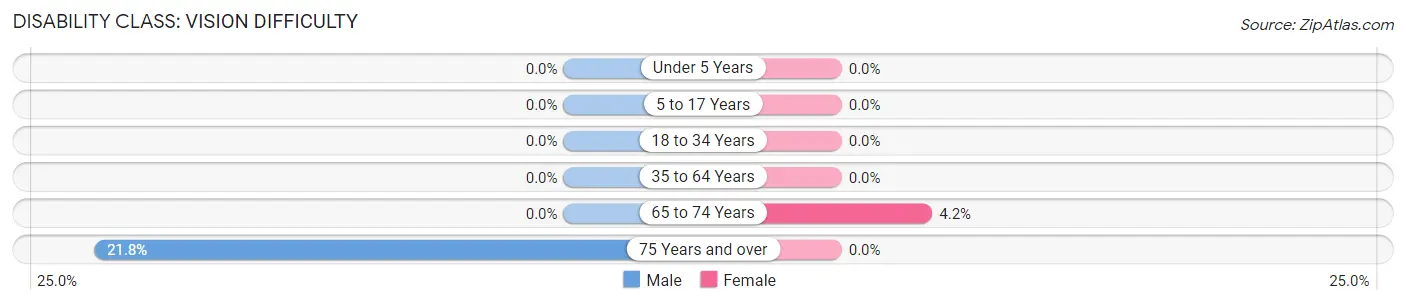
| Age Bracket | Male | Female |
| Under 5 Years | 0 (0.0%) | 0 (0.0%) |
| 5 to 17 Years | 0 (0.0%) | 0 (0.0%) |
| 18 to 34 Years | 0 (0.0%) | 0 (0.0%) |
| 35 to 64 Years | 0 (0.0%) | 0 (0.0%) |
| 65 to 74 Years | 0 (0.0%) | 5 (4.2%) |
| 75 Years and over | 22 (21.8%) | 0 (0.0%) |
Disability Class: Cognitive Difficulty
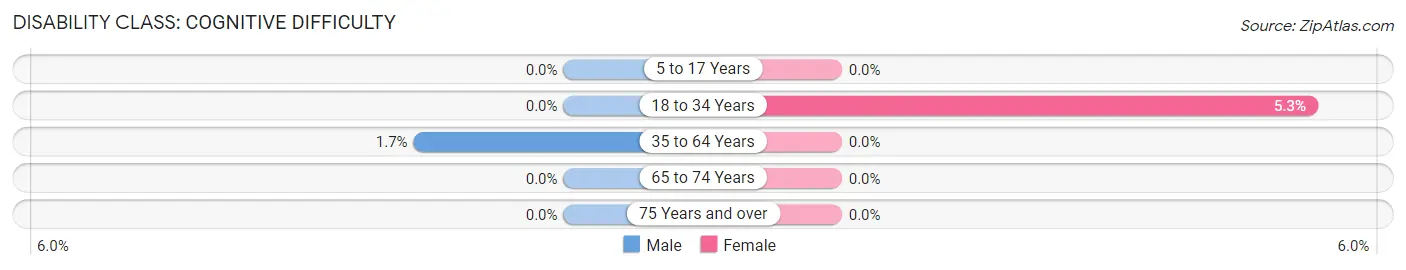
| Age Bracket | Male | Female |
| 5 to 17 Years | 0 (0.0%) | 0 (0.0%) |
| 18 to 34 Years | 0 (0.0%) | 7 (5.3%) |
| 35 to 64 Years | 5 (1.7%) | 0 (0.0%) |
| 65 to 74 Years | 0 (0.0%) | 0 (0.0%) |
| 75 Years and over | 0 (0.0%) | 0 (0.0%) |
Disability Class: Ambulatory Difficulty
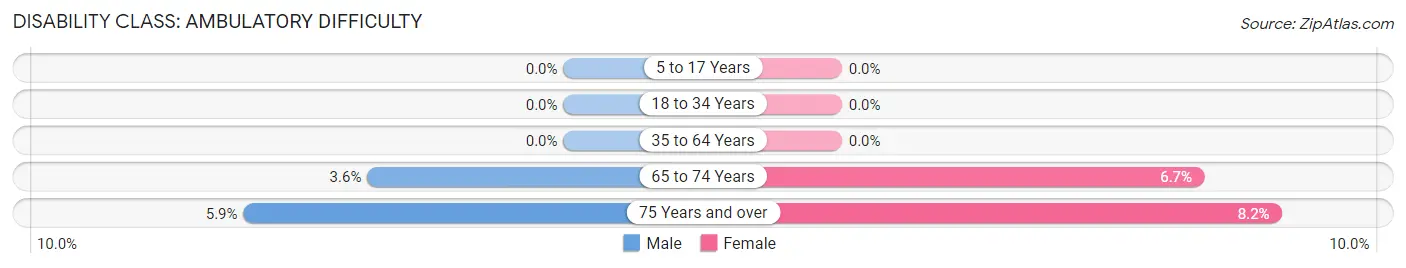
| Age Bracket | Male | Female |
| 5 to 17 Years | 0 (0.0%) | 0 (0.0%) |
| 18 to 34 Years | 0 (0.0%) | 0 (0.0%) |
| 35 to 64 Years | 0 (0.0%) | 0 (0.0%) |
| 65 to 74 Years | 6 (3.6%) | 8 (6.7%) |
| 75 Years and over | 6 (5.9%) | 8 (8.2%) |
Disability Class: Self-Care Difficulty
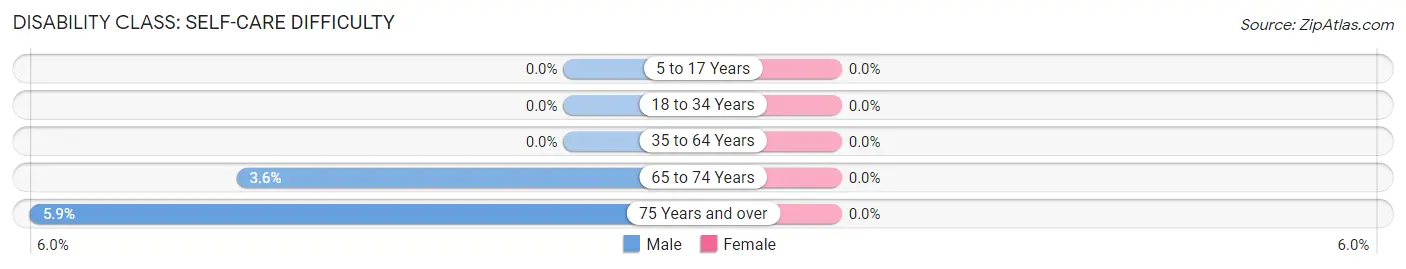
| Age Bracket | Male | Female |
| 5 to 17 Years | 0 (0.0%) | 0 (0.0%) |
| 18 to 34 Years | 0 (0.0%) | 0 (0.0%) |
| 35 to 64 Years | 0 (0.0%) | 0 (0.0%) |
| 65 to 74 Years | 6 (3.6%) | 0 (0.0%) |
| 75 Years and over | 6 (5.9%) | 0 (0.0%) |
Technology Access in Lake Sherwood
Computing Device Access in Lake Sherwood
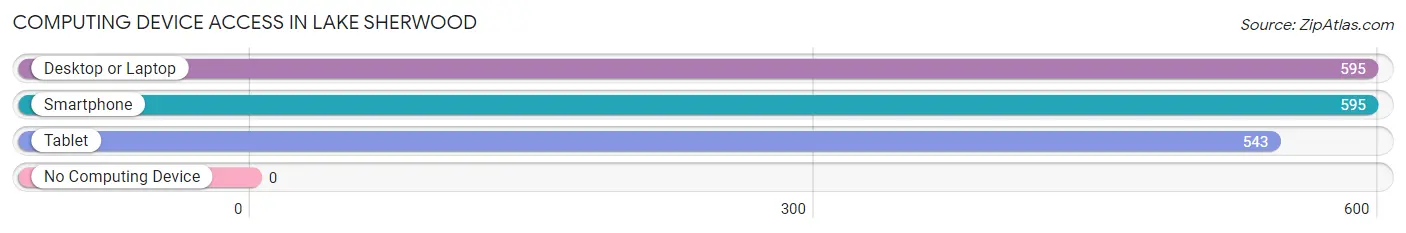
| Device Type | # Households | % Households |
| Desktop or Laptop | 595 | 96.6% |
| Smartphone | 595 | 96.6% |
| Tablet | 543 | 88.1% |
| No Computing Device | 0 | 0.0% |
| Total | 616 | 100.0% |
Internet Access in Lake Sherwood
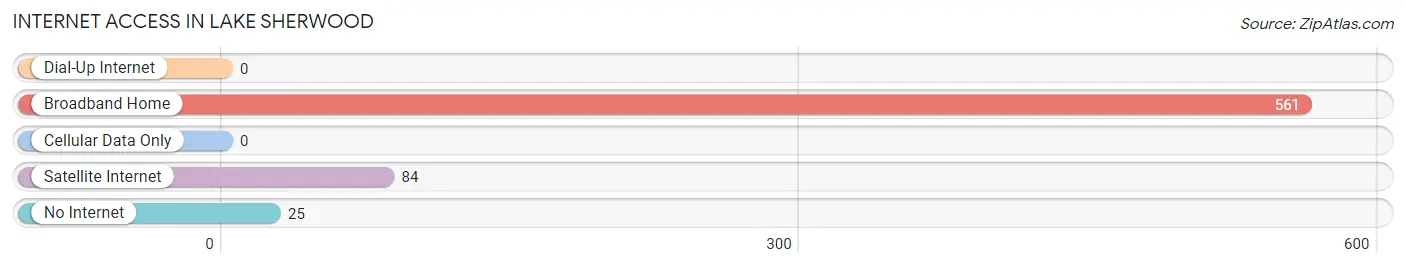
| Internet Type | # Households | % Households |
| Dial-Up Internet | 0 | 0.0% |
| Broadband Home | 561 | 91.1% |
| Cellular Data Only | 0 | 0.0% |
| Satellite Internet | 84 | 13.6% |
| No Internet | 25 | 4.1% |
| Total | 616 | 100.0% |
Lake Sherwood Summary
History
Lake Sherwood is a small, unincorporated community located in the Santa Monica Mountains of Ventura County, California. It is situated in the Conejo Valley, approximately 25 miles northwest of Los Angeles. The area was originally inhabited by the Chumash people, who lived in the area for thousands of years before the arrival of Europeans.
The first Europeans to settle in the area were Spanish missionaries, who established the Mission San Buenaventura in 1782. The mission was the ninth of the 21 missions established by the Spanish in California. The mission was named after Saint Bonaventure, a 13th-century Italian Franciscan friar.
In 1845, the Mexican government granted the land that is now Lake Sherwood to Don Jose de la Guerra y Noriega, a prominent Mexican military officer and politician. The land was used for cattle ranching and farming.
In the late 19th century, the area was developed as a resort community. The Lake Sherwood Hotel was built in 1887 and was a popular destination for wealthy Angelenos. The hotel was destroyed by fire in 1895.
In the early 20th century, the area was developed as a residential community. The Lake Sherwood Country Club was established in 1922 and is still in operation today.
Geography
Lake Sherwood is located in the Santa Monica Mountains of Ventura County, California. It is situated in the Conejo Valley, approximately 25 miles northwest of Los Angeles. The area is characterized by rolling hills and valleys, with elevations ranging from 500 to 1,500 feet.
The area is home to several lakes, including Lake Sherwood, which is the largest. The lake is fed by several creeks and is a popular destination for fishing, boating, and swimming.
The climate in Lake Sherwood is Mediterranean, with hot, dry summers and mild, wet winters. The average annual temperature is 68°F, with an average high of 85°F in the summer and an average low of 50°F in the winter.
Economy
The economy of Lake Sherwood is largely based on tourism and recreation. The area is home to several resorts, golf courses, and other recreational facilities. The Lake Sherwood Country Club is a popular destination for golfers, and the area is also home to several hiking trails and parks.
The area is also home to several wineries and vineyards, which produce a variety of wines. The area is also home to several restaurants, cafes, and other businesses.
Demographics
As of the 2010 census, the population of Lake Sherwood was 2,845. The population is predominantly white (90.2%), with a small Hispanic population (4.2%). The median household income is $125,000, and the median home value is $1,000,000.
The area is home to several affluent neighborhoods, including the exclusive Lake Sherwood Estates. The area is also home to several celebrities, including actor Tom Cruise and singer Justin Timberlake.
Common Questions
What is Per Capita Income in Lake Sherwood?
Per Capita income in Lake Sherwood is $143,678.
What is the Median Family Income in Lake Sherwood?
Median Family Income in Lake Sherwood is $234,263.
What is the Median Household income in Lake Sherwood?
Median Household Income in Lake Sherwood is $233,462.
What is Inequality or Gini Index in Lake Sherwood?
Inequality or Gini Index in Lake Sherwood is 0.52.
What is the Total Population of Lake Sherwood?
Total Population of Lake Sherwood is 1,617.
What is the Total Male Population of Lake Sherwood?
Total Male Population of Lake Sherwood is 787.
What is the Total Female Population of Lake Sherwood?
Total Female Population of Lake Sherwood is 830.
What is the Ratio of Males per 100 Females in Lake Sherwood?
There are 94.82 Males per 100 Females in Lake Sherwood.
What is the Ratio of Females per 100 Males in Lake Sherwood?
There are 105.46 Females per 100 Males in Lake Sherwood.
What is the Median Population Age in Lake Sherwood?
Median Population Age in Lake Sherwood is 55.9 Years.
What is the Average Family Size in Lake Sherwood
Average Family Size in Lake Sherwood is 2.8 People.
What is the Average Household Size in Lake Sherwood
Average Household Size in Lake Sherwood is 2.6 People.
How Large is the Labor Force in Lake Sherwood?
There are 733 People in the Labor Forcein in Lake Sherwood.
What is the Percentage of People in the Labor Force in Lake Sherwood?
49.9% of People are in the Labor Force in Lake Sherwood.
What is the Unemployment Rate in Lake Sherwood?
Unemployment Rate in Lake Sherwood is 7.1%.