Cities with the Lowest Poverty Level Among Seniors Over the Age of 75 in Pennsylvania
RELATED REPORTS & OPTIONS
Lowest Poverty | Seniors 75+
Pennsylvania
Compare Cities
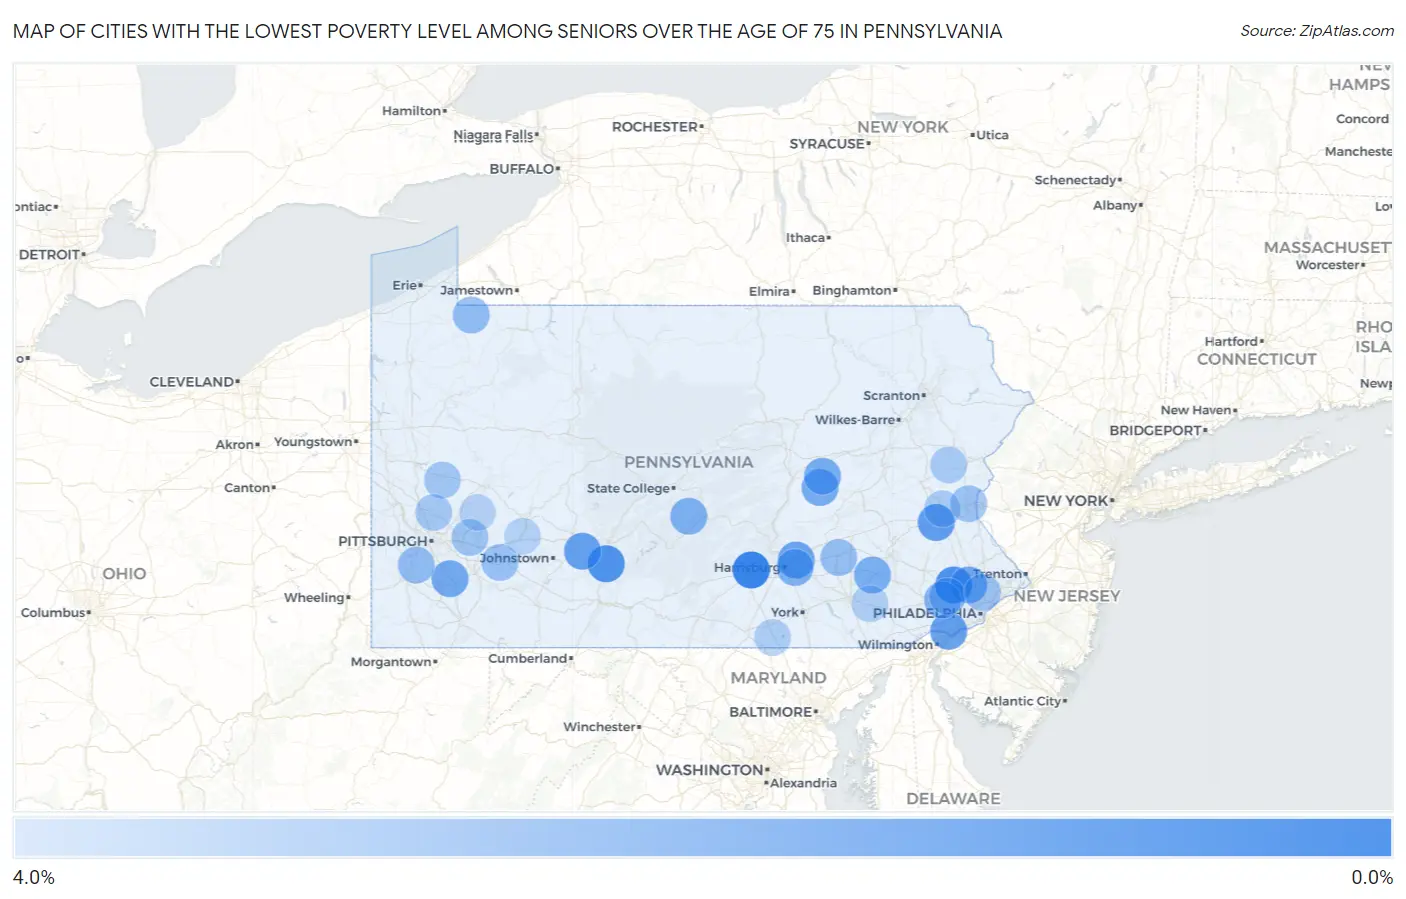
Map of Cities with the Lowest Poverty Level Among Seniors Over the Age of 75 in Pennsylvania
4.0%
0.0%
Cities with the Lowest Poverty Level Among Seniors Over the Age of 75 in Pennsylvania
| City | Senior Poverty | vs State | vs National | |
| 1. | Schlusser | 0.19% | 10.1%(-9.92)#1 | 11.1%(-10.9)#11 |
| 2. | Glenolden Borough | 0.20% | 10.1%(-9.91)#2 | 11.1%(-10.9)#13 |
| 3. | Bridgeport Borough | 0.66% | 10.1%(-9.45)#3 | 11.1%(-10.4)#79 |
| 4. | Trooper | 0.72% | 10.1%(-9.39)#4 | 11.1%(-10.4)#88 |
| 5. | Villanova | 0.72% | 10.1%(-9.39)#5 | 11.1%(-10.3)#89 |
| 6. | Sugarcreek Borough | 0.76% | 10.1%(-9.35)#6 | 11.1%(-10.3)#95 |
| 7. | Claysburg | 0.79% | 10.1%(-9.32)#7 | 11.1%(-10.3)#102 |
| 8. | Centerville Borough Washington County | 0.79% | 10.1%(-9.32)#8 | 11.1%(-10.3)#103 |
| 9. | Frazer | 0.92% | 10.1%(-9.19)#9 | 11.1%(-10.1)#127 |
| 10. | Cornwall Borough | 1.0% | 10.1%(-9.08)#10 | 11.1%(-10.0)#145 |
| 11. | Wescosville | 1.2% | 10.1%(-8.90)#11 | 11.1%(-9.86)#186 |
| 12. | Burgettstown Borough | 1.3% | 10.1%(-8.86)#12 | 11.1%(-9.82)#200 |
| 13. | Boothwyn | 1.3% | 10.1%(-8.82)#13 | 11.1%(-9.78)#216 |
| 14. | Spring Hill | 1.3% | 10.1%(-8.77)#14 | 11.1%(-9.72)#234 |
| 15. | Union City Borough | 1.4% | 10.1%(-8.72)#15 | 11.1%(-9.68)#251 |
| 16. | Paxtonia | 1.5% | 10.1%(-8.65)#16 | 11.1%(-9.61)#277 |
| 17. | Southwest Greensburg Borough | 1.6% | 10.1%(-8.56)#17 | 11.1%(-9.52)#317 |
| 18. | Cochranton Borough | 1.6% | 10.1%(-8.52)#18 | 11.1%(-9.48)#334 |
| 19. | Fellsburg | 1.7% | 10.1%(-8.44)#19 | 11.1%(-9.40)#368 |
| 20. | Camp Hill Borough | 1.7% | 10.1%(-8.39)#20 | 11.1%(-9.35)#389 |
| 21. | Blue Bell | 1.8% | 10.1%(-8.36)#21 | 11.1%(-9.32)#403 |
| 22. | Tharptown Uniontown | 1.8% | 10.1%(-8.32)#22 | 11.1%(-9.28)#420 |
| 23. | Paint Borough | 1.8% | 10.1%(-8.28)#23 | 11.1%(-9.24)#435 |
| 24. | Elysburg | 1.9% | 10.1%(-8.26)#24 | 11.1%(-9.22)#447 |
| 25. | Reamstown | 1.9% | 10.1%(-8.22)#25 | 11.1%(-9.17)#471 |
| 26. | Laureldale Borough | 1.9% | 10.1%(-8.20)#26 | 11.1%(-9.16)#473 |
| 27. | Jennerstown Borough | 1.9% | 10.1%(-8.17)#27 | 11.1%(-9.13)#485 |
| 28. | Monaca Borough | 2.0% | 10.1%(-8.15)#28 | 11.1%(-9.10)#503 |
| 29. | Lawnton | 2.0% | 10.1%(-8.14)#29 | 11.1%(-9.10)#504 |
| 30. | Belleville | 2.0% | 10.1%(-8.09)#30 | 11.1%(-9.05)#535 |
| 31. | Petersburg Borough | 2.0% | 10.1%(-8.07)#31 | 11.1%(-9.03)#552 |
| 32. | Rockledge Borough | 2.1% | 10.1%(-8.05)#32 | 11.1%(-9.01)#562 |
| 33. | Lilly Borough | 2.1% | 10.1%(-8.00)#33 | 11.1%(-8.96)#597 |
| 34. | Platea Borough | 2.1% | 10.1%(-7.98)#34 | 11.1%(-8.94)#605 |
| 35. | Paoli | 2.1% | 10.1%(-7.98)#35 | 11.1%(-8.93)#608 |
| 36. | New Hope Borough | 2.2% | 10.1%(-7.96)#36 | 11.1%(-8.91)#619 |
| 37. | Throop Borough | 2.2% | 10.1%(-7.89)#37 | 11.1%(-8.85)#665 |
| 38. | New Philadelphia Borough | 2.3% | 10.1%(-7.81)#38 | 11.1%(-8.77)#722 |
| 39. | New Cumberland Borough | 2.3% | 10.1%(-7.79)#39 | 11.1%(-8.75)#731 |
| 40. | Thornburg Borough | 2.3% | 10.1%(-7.78)#40 | 11.1%(-8.74)#739 |
| 41. | Berlin Borough | 2.3% | 10.1%(-7.78)#41 | 11.1%(-8.74)#742 |
| 42. | Rural Valley Borough | 2.4% | 10.1%(-7.73)#42 | 11.1%(-8.69)#763 |
| 43. | South Renovo Borough | 2.4% | 10.1%(-7.67)#43 | 11.1%(-8.63)#810 |
| 44. | Corry | 2.5% | 10.1%(-7.65)#44 | 11.1%(-8.60)#828 |
| 45. | Honesdale Borough | 2.5% | 10.1%(-7.62)#45 | 11.1%(-8.58)#850 |
| 46. | Thompsonville | 2.5% | 10.1%(-7.62)#46 | 11.1%(-8.57)#852 |
| 47. | Chesterbrook | 2.5% | 10.1%(-7.61)#47 | 11.1%(-8.57)#857 |
| 48. | East Mckeesport Borough | 2.6% | 10.1%(-7.56)#48 | 11.1%(-8.52)#891 |
| 49. | Lebanon South | 2.6% | 10.1%(-7.53)#49 | 11.1%(-8.49)#912 |
| 50. | Hughestown Borough | 2.6% | 10.1%(-7.50)#50 | 11.1%(-8.46)#935 |
| 51. | Tremont Borough | 2.6% | 10.1%(-7.48)#51 | 11.1%(-8.44)#953 |
| 52. | Exeter Borough | 2.7% | 10.1%(-7.44)#52 | 11.1%(-8.40)#973 |
| 53. | Lawson Heights | 2.7% | 10.1%(-7.43)#53 | 11.1%(-8.39)#980 |
| 54. | Mount Holly Springs Borough | 2.7% | 10.1%(-7.41)#54 | 11.1%(-8.36)#993 |
| 55. | Mount Joy Borough | 2.7% | 10.1%(-7.40)#55 | 11.1%(-8.36)#1,012 |
| 56. | Palmer Heights | 2.8% | 10.1%(-7.36)#56 | 11.1%(-8.31)#1,047 |
| 57. | Leechburg Borough | 2.8% | 10.1%(-7.36)#57 | 11.1%(-8.31)#1,050 |
| 58. | Wyncote | 2.8% | 10.1%(-7.35)#58 | 11.1%(-8.30)#1,055 |
| 59. | Murrysville | 2.8% | 10.1%(-7.34)#59 | 11.1%(-8.29)#1,058 |
| 60. | Austin Borough | 2.8% | 10.1%(-7.33)#60 | 11.1%(-8.29)#1,064 |
| 61. | Wrightsville Borough | 2.8% | 10.1%(-7.28)#61 | 11.1%(-8.24)#1,110 |
| 62. | West Newton Borough | 2.8% | 10.1%(-7.26)#62 | 11.1%(-8.22)#1,117 |
| 63. | Mckean Borough | 2.9% | 10.1%(-7.25)#63 | 11.1%(-8.21)#1,137 |
| 64. | New Wilmington Borough | 2.9% | 10.1%(-7.23)#64 | 11.1%(-8.18)#1,149 |
| 65. | Freeburg Borough | 2.9% | 10.1%(-7.23)#65 | 11.1%(-8.18)#1,151 |
| 66. | South Williamsport Borough | 2.9% | 10.1%(-7.22)#66 | 11.1%(-8.18)#1,156 |
| 67. | Meadowood | 2.9% | 10.1%(-7.19)#67 | 11.1%(-8.14)#1,177 |
| 68. | South New Castle Borough | 2.9% | 10.1%(-7.17)#68 | 11.1%(-8.13)#1,191 |
| 69. | Trafford Borough | 3.0% | 10.1%(-7.16)#69 | 11.1%(-8.12)#1,205 |
| 70. | Gibsonia | 3.0% | 10.1%(-7.14)#70 | 11.1%(-8.10)#1,215 |
| 71. | Mifflintown Borough | 3.0% | 10.1%(-7.12)#71 | 11.1%(-8.08)#1,225 |
| 72. | North Belle Vernon Borough | 3.0% | 10.1%(-7.12)#72 | 11.1%(-8.07)#1,239 |
| 73. | West Middlesex Borough | 3.0% | 10.1%(-7.11)#73 | 11.1%(-8.07)#1,242 |
| 74. | North Wales Borough | 3.0% | 10.1%(-7.08)#74 | 11.1%(-8.04)#1,258 |
| 75. | Stockertown Borough | 3.0% | 10.1%(-7.08)#75 | 11.1%(-8.04)#1,266 |
| 76. | Avonmore Borough | 3.1% | 10.1%(-7.06)#76 | 11.1%(-8.01)#1,289 |
| 77. | Rose Valley Borough | 3.1% | 10.1%(-7.05)#77 | 11.1%(-8.01)#1,293 |
| 78. | St. Davids | 3.1% | 10.1%(-7.03)#78 | 11.1%(-7.98)#1,309 |
| 79. | Tyrone Borough | 3.1% | 10.1%(-7.01)#79 | 11.1%(-7.96)#1,322 |
| 80. | Palmyra Borough | 3.1% | 10.1%(-7.00)#80 | 11.1%(-7.96)#1,327 |
| 81. | Hokendauqua | 3.1% | 10.1%(-6.99)#81 | 11.1%(-7.95)#1,334 |
| 82. | Effort | 3.1% | 10.1%(-6.97)#82 | 11.1%(-7.93)#1,359 |
| 83. | Northern Cambria Borough | 3.2% | 10.1%(-6.95)#83 | 11.1%(-7.91)#1,371 |
| 84. | Pennville | 3.2% | 10.1%(-6.94)#84 | 11.1%(-7.90)#1,379 |
| 85. | Hydetown Borough | 3.2% | 10.1%(-6.94)#85 | 11.1%(-7.89)#1,388 |
| 86. | California Borough | 3.2% | 10.1%(-6.91)#86 | 11.1%(-7.86)#1,406 |
| 87. | Shrewsbury Borough | 3.2% | 10.1%(-6.91)#87 | 11.1%(-7.86)#1,408 |
| 88. | Cheswick Borough | 3.2% | 10.1%(-6.88)#88 | 11.1%(-7.84)#1,425 |
| 89. | Gordonville | 3.2% | 10.1%(-6.88)#89 | 11.1%(-7.84)#1,431 |
| 90. | Marklesburg Borough | 3.2% | 10.1%(-6.88)#90 | 11.1%(-7.84)#1,442 |
| 91. | Churchill Borough | 3.2% | 10.1%(-6.88)#91 | 11.1%(-7.83)#1,447 |
| 92. | Ligonier Borough | 3.2% | 10.1%(-6.87)#92 | 11.1%(-7.82)#1,455 |
| 93. | Brookhaven Borough | 3.3% | 10.1%(-6.86)#93 | 11.1%(-7.81)#1,466 |
| 94. | Collegeville Borough | 3.3% | 10.1%(-6.84)#94 | 11.1%(-7.80)#1,474 |
| 95. | Bernville Borough | 3.3% | 10.1%(-6.83)#95 | 11.1%(-7.79)#1,485 |
| 96. | Black Lick | 3.3% | 10.1%(-6.81)#96 | 11.1%(-7.77)#1,496 |
| 97. | Brockway Borough | 3.3% | 10.1%(-6.80)#97 | 11.1%(-7.75)#1,509 |
| 98. | Waynesburg Borough | 3.3% | 10.1%(-6.76)#98 | 11.1%(-7.72)#1,546 |
| 99. | New Alexandria Borough | 3.4% | 10.1%(-6.74)#99 | 11.1%(-7.70)#1,567 |
| 100. | Hyde Park | 3.4% | 10.1%(-6.73)#100 | 11.1%(-7.69)#1,572 |
Common Questions
What are the Top 10 Cities with the Lowest Poverty Level Among Seniors Over the Age of 75 in Pennsylvania?
Top 10 Cities with the Lowest Poverty Level Among Seniors Over the Age of 75 in Pennsylvania are:
#1
0.19%
#2
0.72%
#3
0.79%
#4
1.2%
#5
1.3%
#6
1.3%
#7
1.5%
#8
1.7%
#9
1.8%
#10
1.8%
What city has the Lowest Poverty Level Among Seniors Over the Age of 75 in Pennsylvania?
Schlusser has the Lowest Poverty Level Among Seniors Over the Age of 75 in Pennsylvania with 0.19%.
What is the Poverty Level Among Seniors Over the Age of 75 in the State of Pennsylvania?
Poverty Level Among Seniors Over the Age of 75 in Pennsylvania is 10.1%.
What is the Poverty Level Among Seniors Over the Age of 75 in the United States?
Poverty Level Among Seniors Over the Age of 75 in the United States is 11.1%.