Monterey, CA Map & Demographics
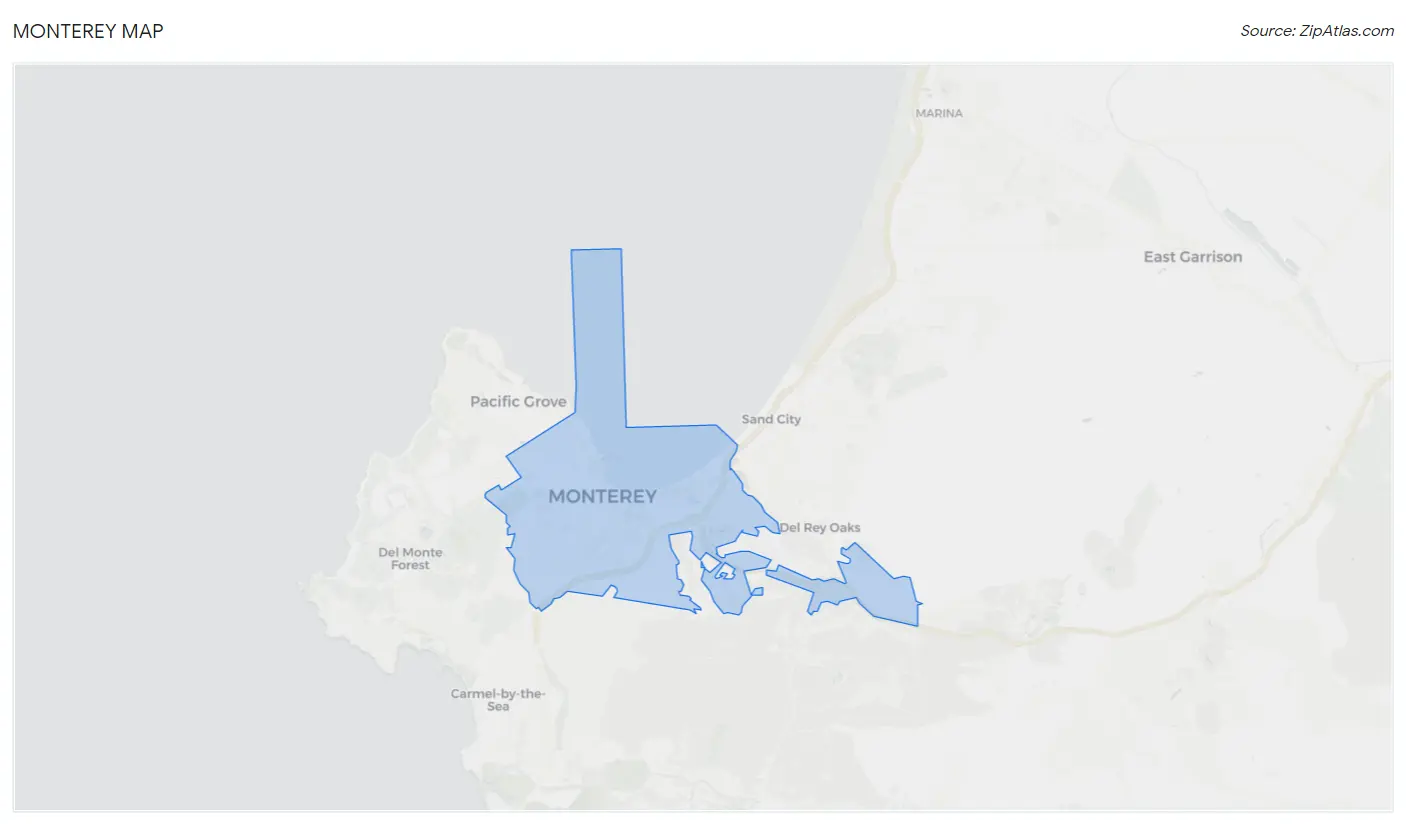
Monterey Map
Monterey Overview
$57,335
PER CAPITA INCOME
$133,333
AVG FAMILY INCOME
$98,003
AVG HOUSEHOLD INCOME
11.2%
WAGE / INCOME GAP [ % ]
88.8¢/ $1
WAGE / INCOME GAP [ $ ]
0.44
INEQUALITY / GINI INDEX
30,007
TOTAL POPULATION
15,164
MALE POPULATION
14,843
FEMALE POPULATION
102.16
MALES / 100 FEMALES
97.88
FEMALES / 100 MALES
36.8
MEDIAN AGE
2.9
AVG FAMILY SIZE
2.1
AVG HOUSEHOLD SIZE
18,630
LABOR FORCE [ PEOPLE ]
70.7%
PERCENT IN LABOR FORCE
4.9%
UNEMPLOYMENT RATE
Monterey Area Codes
Income in Monterey
Income Overview in Monterey
Per Capita Income in Monterey is $57,335, while median incomes of families and households are $133,333 and $98,003 respectively.
| Characteristic | Number | Measure |
| Per Capita Income | 30,007 | $57,335 |
| Median Family Income | 6,164 | $133,333 |
| Mean Family Income | 6,164 | $159,328 |
| Median Household Income | 12,586 | $98,003 |
| Mean Household Income | 12,586 | $128,549 |
| Income Deficit | 6,164 | $0 |
| Wage / Income Gap (%) | 30,007 | 11.25% |
| Wage / Income Gap ($) | 30,007 | 88.75¢ per $1 |
| Gini / Inequality Index | 30,007 | 0.44 |
Earnings by Sex in Monterey
Average Earnings in Monterey are $47,231, $52,145 for men and $46,281 for women, a difference of 11.3%.
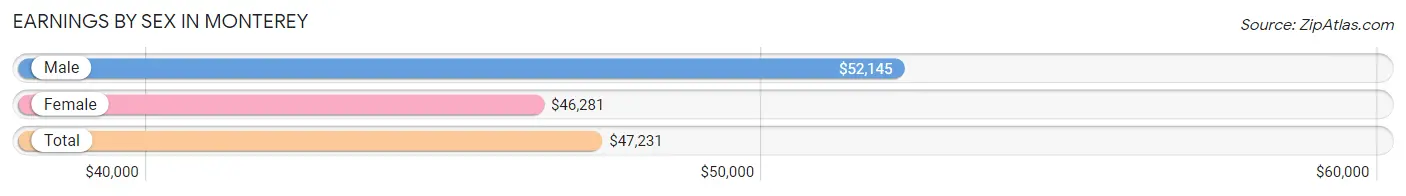
| Sex | Number | Average Earnings |
| Male | 10,881 (56.3%) | $52,145 |
| Female | 8,455 (43.7%) | $46,281 |
| Total | 19,336 (100.0%) | $47,231 |
Earnings by Sex by Income Bracket in Monterey
The most common earnings brackets in Monterey are $100,000+ for men (2,822 | 25.9%) and $100,000+ for women (1,332 | 15.8%).
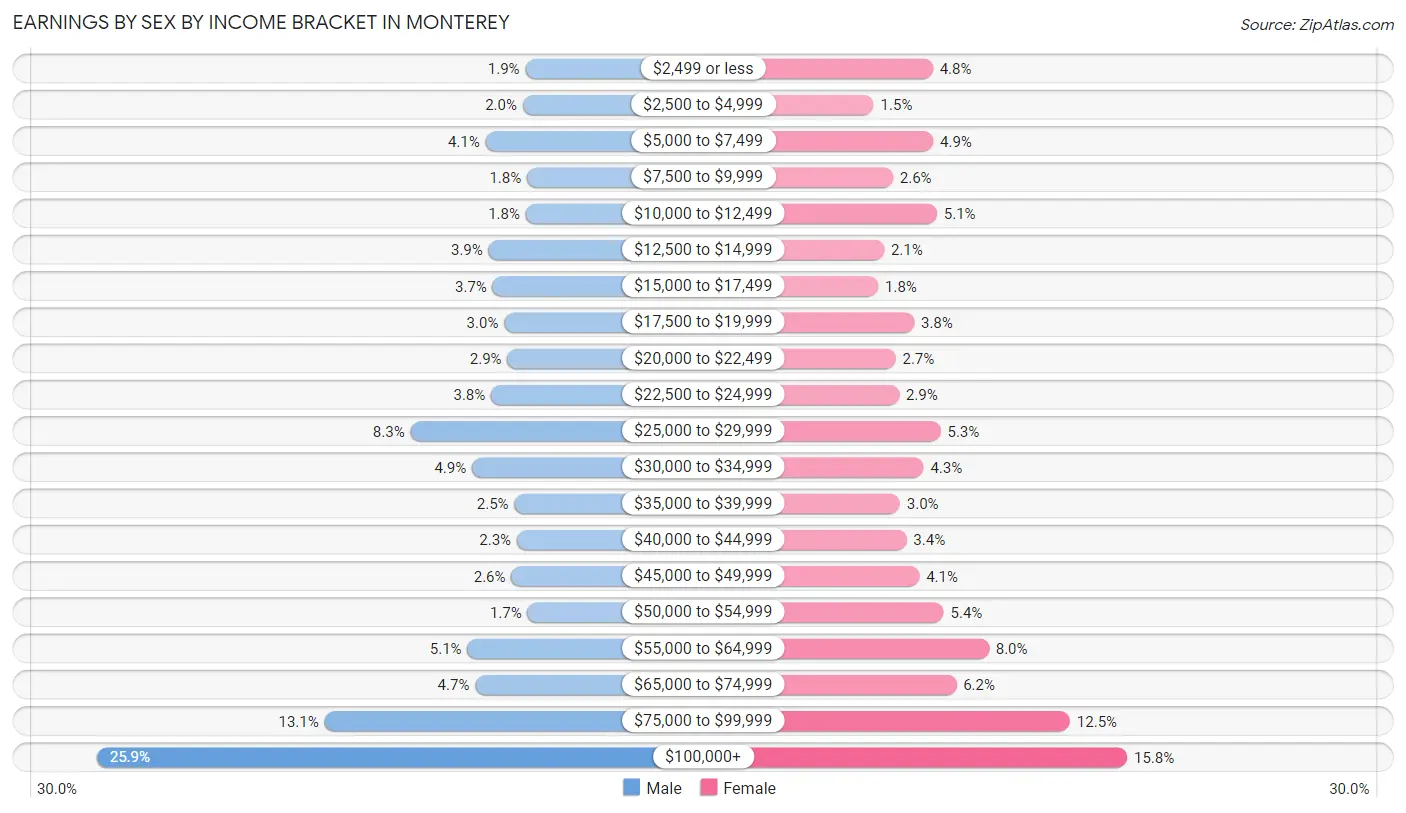
| Income | Male | Female |
| $2,499 or less | 201 (1.8%) | 408 (4.8%) |
| $2,500 to $4,999 | 218 (2.0%) | 128 (1.5%) |
| $5,000 to $7,499 | 445 (4.1%) | 410 (4.9%) |
| $7,500 to $9,999 | 192 (1.8%) | 219 (2.6%) |
| $10,000 to $12,499 | 199 (1.8%) | 428 (5.1%) |
| $12,500 to $14,999 | 426 (3.9%) | 177 (2.1%) |
| $15,000 to $17,499 | 402 (3.7%) | 149 (1.8%) |
| $17,500 to $19,999 | 331 (3.0%) | 320 (3.8%) |
| $20,000 to $22,499 | 311 (2.9%) | 232 (2.7%) |
| $22,500 to $24,999 | 411 (3.8%) | 248 (2.9%) |
| $25,000 to $29,999 | 904 (8.3%) | 446 (5.3%) |
| $30,000 to $34,999 | 528 (4.9%) | 364 (4.3%) |
| $35,000 to $39,999 | 269 (2.5%) | 252 (3.0%) |
| $40,000 to $44,999 | 253 (2.3%) | 283 (3.4%) |
| $45,000 to $49,999 | 287 (2.6%) | 344 (4.1%) |
| $50,000 to $54,999 | 188 (1.7%) | 460 (5.4%) |
| $55,000 to $64,999 | 556 (5.1%) | 675 (8.0%) |
| $65,000 to $74,999 | 508 (4.7%) | 520 (6.1%) |
| $75,000 to $99,999 | 1,430 (13.1%) | 1,060 (12.5%) |
| $100,000+ | 2,822 (25.9%) | 1,332 (15.8%) |
| Total | 10,881 (100.0%) | 8,455 (100.0%) |
Earnings by Sex by Educational Attainment in Monterey
Average earnings in Monterey are $72,455 for men and $55,008 for women, a difference of 24.1%. Men with an educational attainment of graduate degree enjoy the highest average annual earnings of $113,906, while those with high school diploma education earn the least with $33,531. Women with an educational attainment of graduate degree earn the most with the average annual earnings of $75,365, while those with less than high school education have the smallest earnings of $32,775.
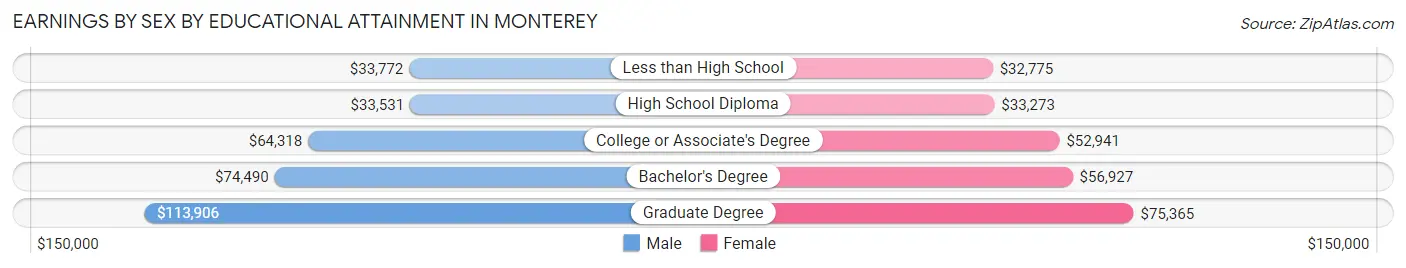
| Educational Attainment | Male Income | Female Income |
| Less than High School | $33,772 | $32,775 |
| High School Diploma | $33,531 | $33,273 |
| College or Associate's Degree | $64,318 | $52,941 |
| Bachelor's Degree | $74,490 | $56,927 |
| Graduate Degree | $113,906 | $75,365 |
| Total | $72,455 | $55,008 |
Family Income in Monterey
Family Income Brackets in Monterey
According to the Monterey family income data, there are 1,541 families falling into the $200,000+ income range, which is the most common income bracket and makes up 25.0% of all families. Conversely, the less than $10,000 income bracket is the least frequent group with only 74 families (1.2%) belonging to this category.
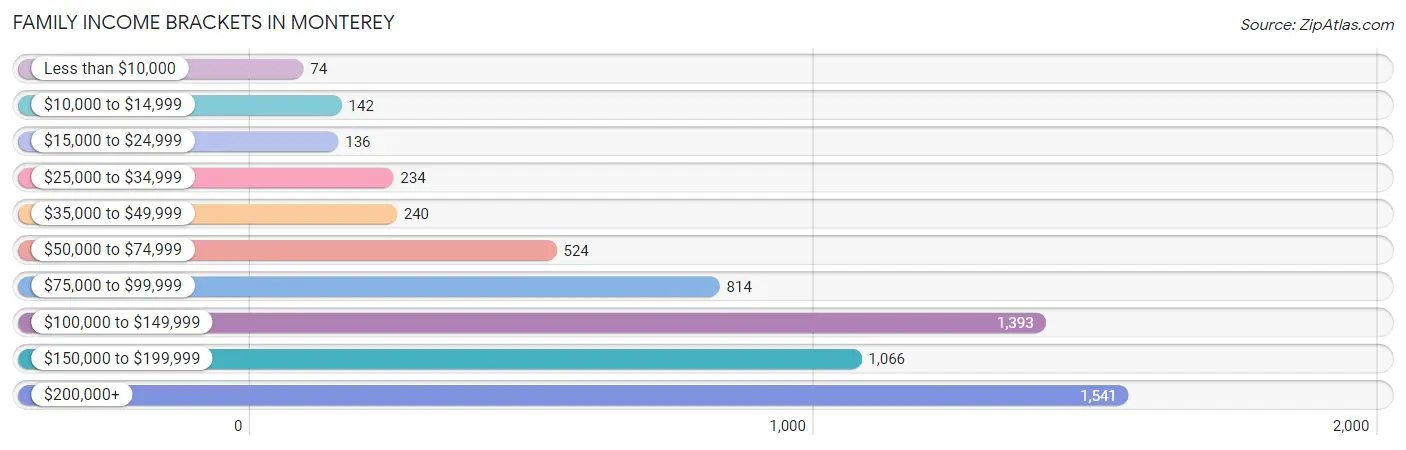
| Income Bracket | # Families | % Families |
| Less than $10,000 | 74 | 1.2% |
| $10,000 to $14,999 | 142 | 2.3% |
| $15,000 to $24,999 | 136 | 2.2% |
| $25,000 to $34,999 | 234 | 3.8% |
| $35,000 to $49,999 | 240 | 3.9% |
| $50,000 to $74,999 | 524 | 8.5% |
| $75,000 to $99,999 | 814 | 13.2% |
| $100,000 to $149,999 | 1,393 | 22.6% |
| $150,000 to $199,999 | 1,066 | 17.3% |
| $200,000+ | 1,541 | 25.0% |
Family Income by Famaliy Size in Monterey
6-person families (151 | 2.5%) account for the highest median family income in Monterey with $158,393 per family, while 2-person families (3,620 | 58.7%) have the highest median income of $63,750 per family member.
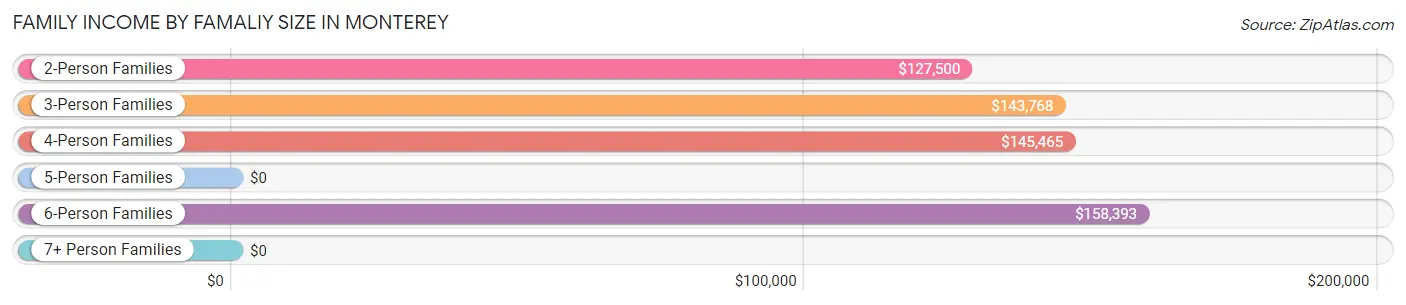
| Income Bracket | # Families | Median Income |
| 2-Person Families | 3,620 (58.7%) | $127,500 |
| 3-Person Families | 1,049 (17.0%) | $143,768 |
| 4-Person Families | 1,003 (16.3%) | $145,465 |
| 5-Person Families | 286 (4.6%) | $0 |
| 6-Person Families | 151 (2.5%) | $158,393 |
| 7+ Person Families | 55 (0.9%) | $0 |
| Total | 6,164 (100.0%) | $133,333 |
Family Income by Number of Earners in Monterey
The median family income in Monterey is $133,333, with families comprising 2 earners (2,970) having the highest median family income of $158,824, while families with no earners (716) have the lowest median family income of $85,682, accounting for 48.2% and 11.6% of families, respectively.
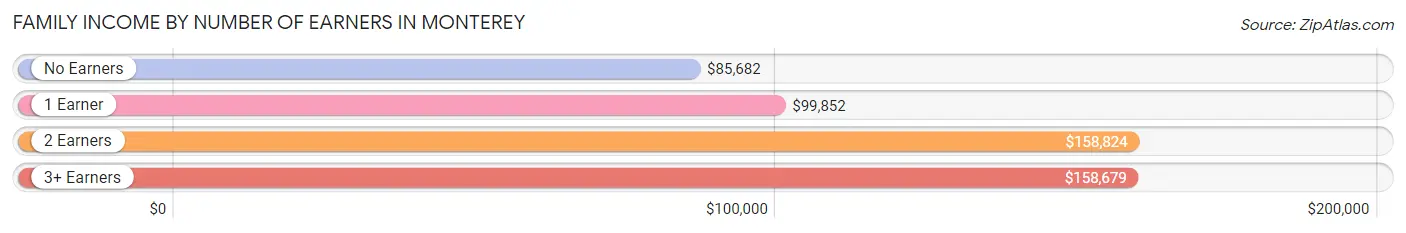
| Number of Earners | # Families | Median Income |
| No Earners | 716 (11.6%) | $85,682 |
| 1 Earner | 2,027 (32.9%) | $99,852 |
| 2 Earners | 2,970 (48.2%) | $158,824 |
| 3+ Earners | 451 (7.3%) | $158,679 |
| Total | 6,164 (100.0%) | $133,333 |
Household Income in Monterey
Household Income Brackets in Monterey
With 2,479 households falling in the category, the $100,000 to $149,999 income range is the most frequent in Monterey, accounting for 19.7% of all households. In contrast, only 201 households (1.6%) fall into the $10,000 to $14,999 income bracket, making it the least populous group.
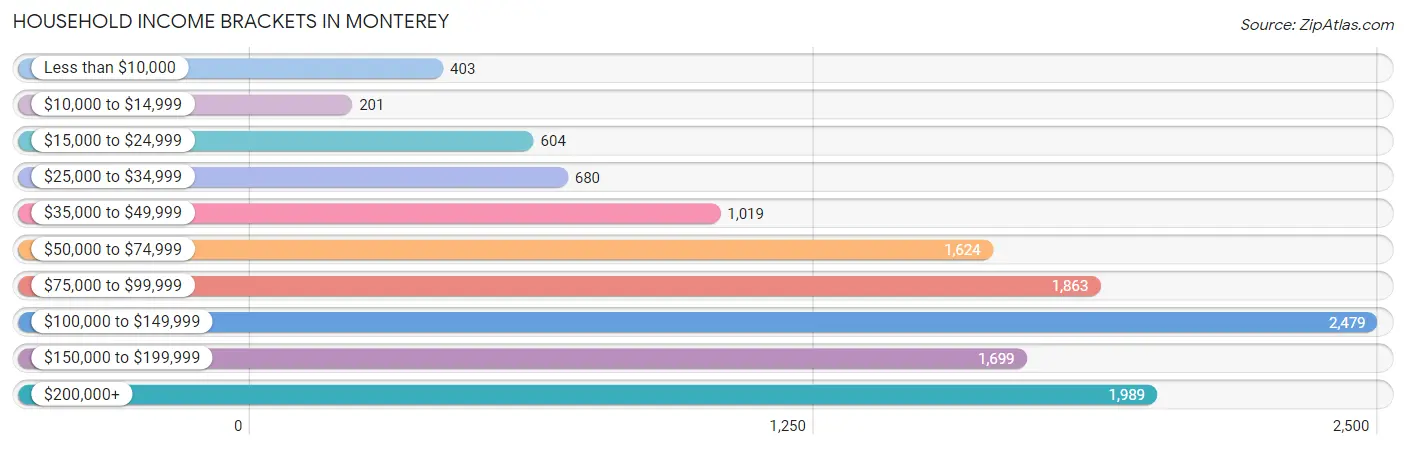
| Income Bracket | # Households | % Households |
| Less than $10,000 | 403 | 3.2% |
| $10,000 to $14,999 | 201 | 1.6% |
| $15,000 to $24,999 | 604 | 4.8% |
| $25,000 to $34,999 | 680 | 5.4% |
| $35,000 to $49,999 | 1,019 | 8.1% |
| $50,000 to $74,999 | 1,624 | 12.9% |
| $75,000 to $99,999 | 1,863 | 14.8% |
| $100,000 to $149,999 | 2,479 | 19.7% |
| $150,000 to $199,999 | 1,699 | 13.5% |
| $200,000+ | 1,989 | 15.8% |
Household Income by Householder Age in Monterey
The median household income in Monterey is $98,003, with the highest median household income of $123,194 found in the 45 to 64 years age bracket for the primary householder. A total of 3,724 households (29.6%) fall into this category. Meanwhile, the 15 to 24 years age bracket for the primary householder has the lowest median household income of $49,375, with 491 households (3.9%) in this group.
| Income Bracket | # Households | Median Income |
| 15 to 24 Years | 491 (3.9%) | $49,375 |
| 25 to 44 Years | 4,797 (38.1%) | $106,915 |
| 45 to 64 Years | 3,724 (29.6%) | $123,194 |
| 65+ Years | 3,574 (28.4%) | $79,461 |
| Total | 12,586 (100.0%) | $98,003 |
Poverty in Monterey
Income Below Poverty by Sex and Age in Monterey
With 9.9% poverty level for males and 11.4% for females among the residents of Monterey, 15 year old males and 18 to 24 year old females are the most vulnerable to poverty, with 21 males (75.0%) and 419 females (35.5%) in their respective age groups living below the poverty level.
| Age Bracket | Male | Female |
| Under 5 Years | 38 (4.5%) | 120 (15.2%) |
| 5 Years | 0 (0.0%) | 0 (0.0%) |
| 6 to 11 Years | 125 (22.5%) | 40 (6.7%) |
| 12 to 14 Years | 73 (34.6%) | 58 (18.0%) |
| 15 Years | 21 (75.0%) | 0 (0.0%) |
| 16 and 17 Years | 14 (8.0%) | 0 (0.0%) |
| 18 to 24 Years | 123 (15.1%) | 419 (35.5%) |
| 25 to 34 Years | 195 (7.1%) | 275 (10.2%) |
| 35 to 44 Years | 211 (9.5%) | 126 (7.8%) |
| 45 to 54 Years | 125 (8.5%) | 50 (3.7%) |
| 55 to 64 Years | 236 (15.0%) | 205 (10.2%) |
| 65 to 74 Years | 81 (6.8%) | 256 (17.3%) |
| 75 Years and over | 29 (3.2%) | 62 (3.6%) |
| Total | 1,271 (9.9%) | 1,611 (11.4%) |
Income Above Poverty by Sex and Age in Monterey
According to the poverty statistics in Monterey, males aged 5 years and females aged 5 years are the age groups that are most secure financially, with 100.0% of males and 100.0% of females in these age groups living above the poverty line.
| Age Bracket | Male | Female |
| Under 5 Years | 813 (95.5%) | 667 (84.8%) |
| 5 Years | 91 (100.0%) | 125 (100.0%) |
| 6 to 11 Years | 431 (77.5%) | 559 (93.3%) |
| 12 to 14 Years | 138 (65.4%) | 264 (82.0%) |
| 15 Years | 7 (25.0%) | 64 (100.0%) |
| 16 and 17 Years | 161 (92.0%) | 241 (100.0%) |
| 18 to 24 Years | 691 (84.9%) | 762 (64.5%) |
| 25 to 34 Years | 2,560 (92.9%) | 2,412 (89.8%) |
| 35 to 44 Years | 2,017 (90.5%) | 1,492 (92.2%) |
| 45 to 54 Years | 1,352 (91.5%) | 1,292 (96.3%) |
| 55 to 64 Years | 1,341 (85.0%) | 1,814 (89.8%) |
| 65 to 74 Years | 1,103 (93.2%) | 1,222 (82.7%) |
| 75 Years and over | 876 (96.8%) | 1,647 (96.4%) |
| Total | 11,581 (90.1%) | 12,561 (88.6%) |
Income Below Poverty Among Married-Couple Families in Monterey
The poverty statistics for married-couple families in Monterey show that 5.4% or 271 of the total 5,014 families live below the poverty line. Families with 5 or more children have the highest poverty rate of 73.9%, comprising of 17 families. On the other hand, families with 1 or 2 children have the lowest poverty rate of 0.7%, which includes 11 families.
| Children | Above Poverty | Below Poverty |
| No Children | 3,058 (96.6%) | 107 (3.4%) |
| 1 or 2 Children | 1,541 (99.3%) | 11 (0.7%) |
| 3 or 4 Children | 138 (50.4%) | 136 (49.6%) |
| 5 or more Children | 6 (26.1%) | 17 (73.9%) |
| Total | 4,743 (94.6%) | 271 (5.4%) |
Income Below Poverty Among Single-Parent Households in Monterey
According to the poverty data in Monterey, 19.7% or 71 single-father households and 15.2% or 120 single-mother households are living below the poverty line. Among single-father households, those with no children have the highest poverty rate, with 57 households (35.0%) experiencing poverty. Likewise, among single-mother households, those with 1 or 2 children have the highest poverty rate, with 40 households (19.6%) falling below the poverty line.
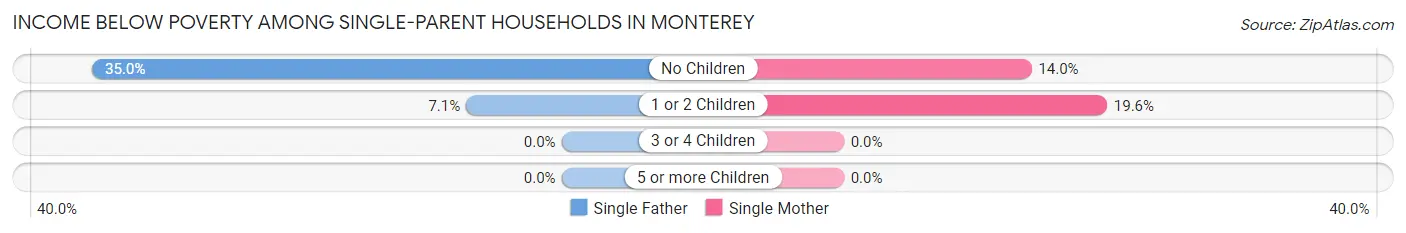
| Children | Single Father | Single Mother |
| No Children | 57 (35.0%) | 80 (14.0%) |
| 1 or 2 Children | 14 (7.1%) | 40 (19.6%) |
| 3 or 4 Children | 0 (0.0%) | 0 (0.0%) |
| 5 or more Children | 0 (0.0%) | 0 (0.0%) |
| Total | 71 (19.7%) | 120 (15.2%) |
Income Below Poverty Among Married-Couple vs Single-Parent Households in Monterey
The poverty data for Monterey shows that 271 of the married-couple family households (5.4%) and 191 of the single-parent households (16.6%) are living below the poverty level. Within the married-couple family households, those with 5 or more children have the highest poverty rate, with 17 households (73.9%) falling below the poverty line. Among the single-parent households, those with no children have the highest poverty rate, with 137 household (18.6%) living below poverty.
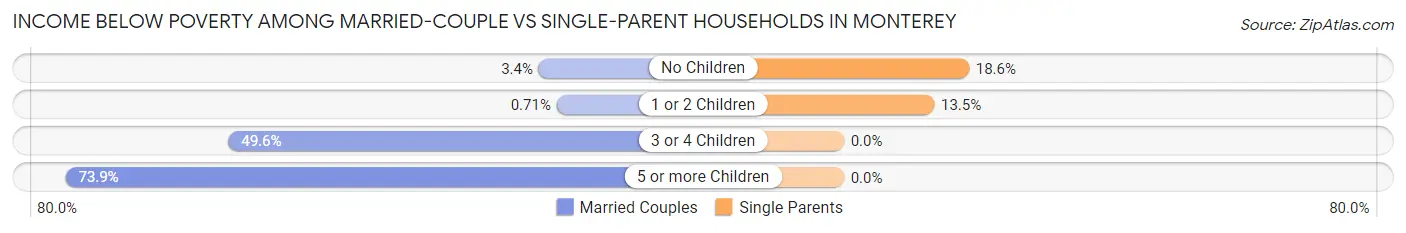
| Children | Married-Couple Families | Single-Parent Households |
| No Children | 107 (3.4%) | 137 (18.6%) |
| 1 or 2 Children | 11 (0.7%) | 54 (13.5%) |
| 3 or 4 Children | 136 (49.6%) | 0 (0.0%) |
| 5 or more Children | 17 (73.9%) | 0 (0.0%) |
| Total | 271 (5.4%) | 191 (16.6%) |
Race in Monterey
The most populous races in Monterey are White / Caucasian (20,770 | 69.2%), Hispanic or Latino (5,785 | 19.3%), and Some other Race (2,882 | 9.6%).
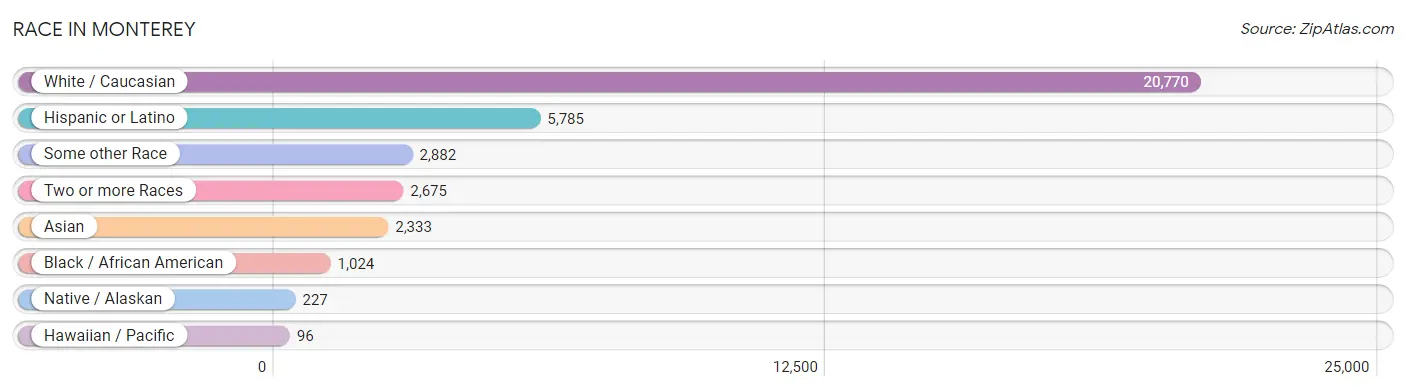
| Race | # Population | % Population |
| Asian | 2,333 | 7.8% |
| Black / African American | 1,024 | 3.4% |
| Hawaiian / Pacific | 96 | 0.3% |
| Hispanic or Latino | 5,785 | 19.3% |
| Native / Alaskan | 227 | 0.8% |
| White / Caucasian | 20,770 | 69.2% |
| Two or more Races | 2,675 | 8.9% |
| Some other Race | 2,882 | 9.6% |
| Total | 30,007 | 100.0% |
Ancestry in Monterey
The most populous ancestries reported in Monterey are German (4,598 | 15.3%), Mexican (4,231 | 14.1%), Irish (3,770 | 12.6%), English (3,659 | 12.2%), and Italian (3,535 | 11.8%), together accounting for 65.9% of all Monterey residents.
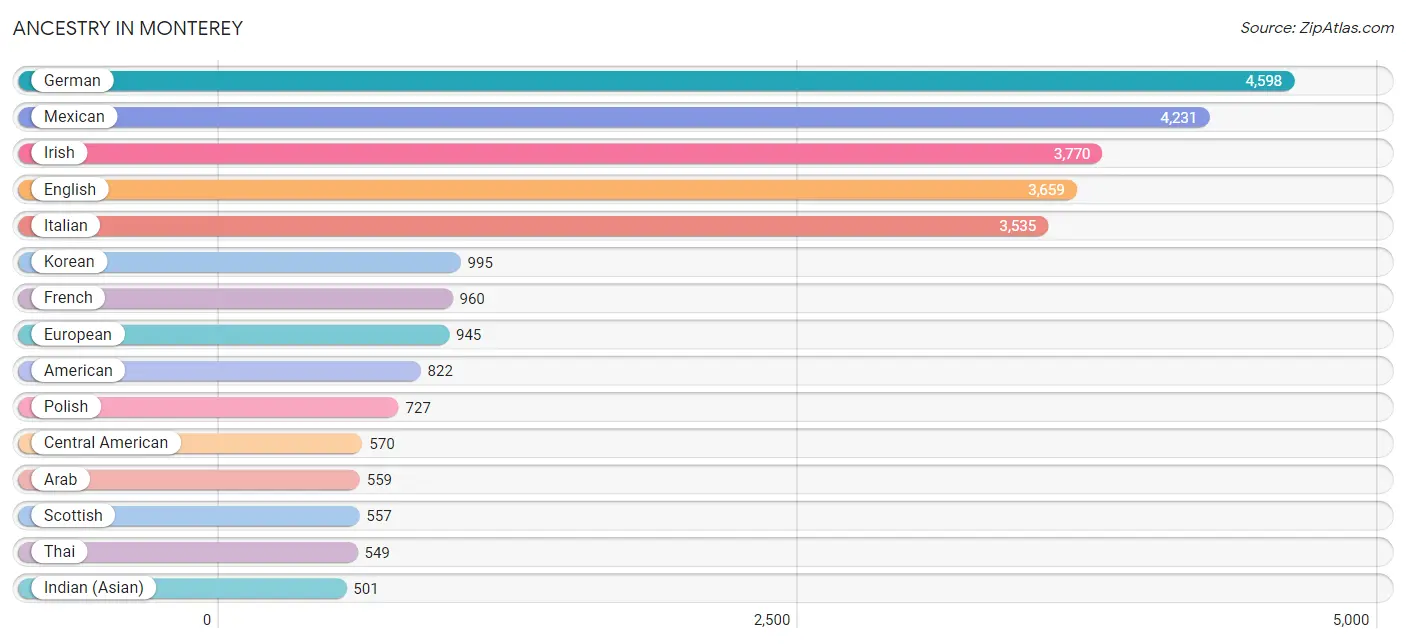
| Ancestry | # Population | % Population |
| Afghan | 108 | 0.4% |
| African | 38 | 0.1% |
| Alsatian | 12 | 0.0% |
| American | 822 | 2.7% |
| Apache | 85 | 0.3% |
| Arab | 559 | 1.9% |
| Argentinean | 38 | 0.1% |
| Armenian | 165 | 0.5% |
| Australian | 17 | 0.1% |
| Austrian | 96 | 0.3% |
| Bahamian | 2 | 0.0% |
| Basque | 14 | 0.1% |
| Belgian | 42 | 0.1% |
| Bhutanese | 414 | 1.4% |
| Blackfeet | 14 | 0.1% |
| Bolivian | 7 | 0.0% |
| Brazilian | 20 | 0.1% |
| British | 174 | 0.6% |
| Bulgarian | 39 | 0.1% |
| Burmese | 459 | 1.5% |
| Canadian | 34 | 0.1% |
| Cape Verdean | 20 | 0.1% |
| Central American | 570 | 1.9% |
| Central American Indian | 18 | 0.1% |
| Cherokee | 166 | 0.5% |
| Chickasaw | 1 | 0.0% |
| Chilean | 43 | 0.1% |
| Colombian | 56 | 0.2% |
| Creek | 8 | 0.0% |
| Croatian | 13 | 0.0% |
| Cuban | 74 | 0.3% |
| Czech | 86 | 0.3% |
| Czechoslovakian | 20 | 0.1% |
| Danish | 207 | 0.7% |
| Dominican | 25 | 0.1% |
| Dutch | 169 | 0.6% |
| Eastern European | 115 | 0.4% |
| Ecuadorian | 6 | 0.0% |
| Egyptian | 68 | 0.2% |
| English | 3,659 | 12.2% |
| European | 945 | 3.2% |
| Filipino | 14 | 0.1% |
| Finnish | 45 | 0.2% |
| French | 960 | 3.2% |
| French Canadian | 60 | 0.2% |
| German | 4,598 | 15.3% |
| Greek | 145 | 0.5% |
| Guamanian / Chamorro | 25 | 0.1% |
| Guatemalan | 94 | 0.3% |
| Haitian | 25 | 0.1% |
| Honduran | 8 | 0.0% |
| Hungarian | 192 | 0.6% |
| Icelander | 10 | 0.0% |
| Indian (Asian) | 501 | 1.7% |
| Indonesian | 10 | 0.0% |
| Iranian | 90 | 0.3% |
| Iraqi | 26 | 0.1% |
| Irish | 3,770 | 12.6% |
| Italian | 3,535 | 11.8% |
| Korean | 995 | 3.3% |
| Laotian | 54 | 0.2% |
| Latvian | 11 | 0.0% |
| Lebanese | 217 | 0.7% |
| Lithuanian | 29 | 0.1% |
| Malaysian | 4 | 0.0% |
| Mexican | 4,231 | 14.1% |
| Mexican American Indian | 135 | 0.4% |
| Native Hawaiian | 233 | 0.8% |
| Nicaraguan | 50 | 0.2% |
| Nigerian | 10 | 0.0% |
| Northern European | 107 | 0.4% |
| Norwegian | 382 | 1.3% |
| Osage | 12 | 0.0% |
| Pakistani | 24 | 0.1% |
| Palestinian | 21 | 0.1% |
| Panamanian | 28 | 0.1% |
| Peruvian | 7 | 0.0% |
| Polish | 727 | 2.4% |
| Portuguese | 268 | 0.9% |
| Potawatomi | 10 | 0.0% |
| Pueblo | 10 | 0.0% |
| Puerto Rican | 100 | 0.3% |
| Romanian | 163 | 0.5% |
| Russian | 355 | 1.2% |
| Salvadoran | 390 | 1.3% |
| Samoan | 11 | 0.0% |
| Scandinavian | 71 | 0.2% |
| Scotch-Irish | 380 | 1.3% |
| Scottish | 557 | 1.9% |
| Serbian | 34 | 0.1% |
| Slovak | 69 | 0.2% |
| Slovene | 32 | 0.1% |
| South African | 43 | 0.1% |
| South American | 170 | 0.6% |
| Spaniard | 152 | 0.5% |
| Spanish | 371 | 1.2% |
| Spanish American Indian | 23 | 0.1% |
| Sri Lankan | 175 | 0.6% |
| Subsaharan African | 127 | 0.4% |
| Swedish | 457 | 1.5% |
| Swiss | 98 | 0.3% |
| Syrian | 108 | 0.4% |
| Thai | 549 | 1.8% |
| Trinidadian and Tobagonian | 13 | 0.0% |
| Ukrainian | 123 | 0.4% |
| Uruguayan | 13 | 0.0% |
| Welsh | 226 | 0.7% |
| Yaqui | 46 | 0.2% |
| Yugoslavian | 33 | 0.1% | View All 109 Rows |
Immigrants in Monterey
The most numerous immigrant groups reported in Monterey came from Asia (1,948 | 6.5%), Latin America (1,533 | 5.1%), Central America (1,309 | 4.4%), Europe (1,127 | 3.8%), and Mexico (1,086 | 3.6%), together accounting for 23.3% of all Monterey residents.
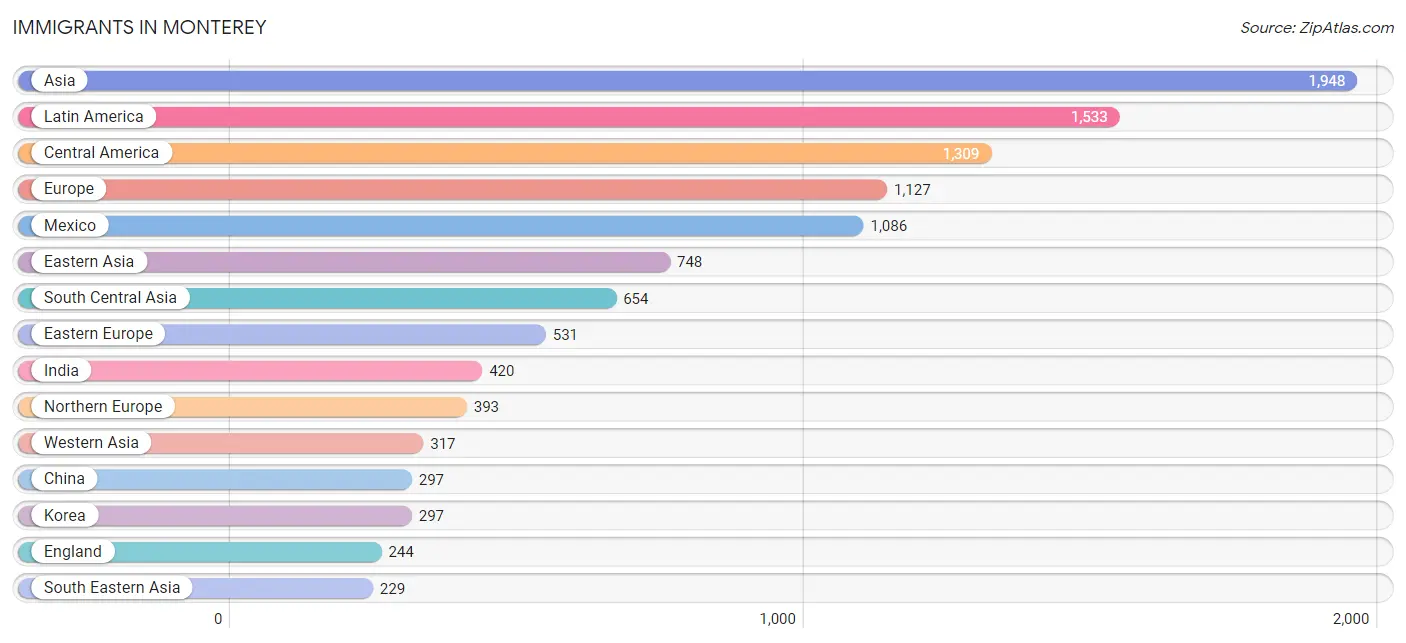
| Immigration Origin | # Population | % Population |
| Afghanistan | 108 | 0.4% |
| Africa | 134 | 0.4% |
| Argentina | 38 | 0.1% |
| Asia | 1,948 | 6.5% |
| Barbados | 2 | 0.0% |
| Belarus | 39 | 0.1% |
| Bosnia and Herzegovina | 19 | 0.1% |
| Brazil | 33 | 0.1% |
| Bulgaria | 8 | 0.0% |
| Cambodia | 9 | 0.0% |
| Canada | 66 | 0.2% |
| Caribbean | 48 | 0.2% |
| Central America | 1,309 | 4.4% |
| Chile | 43 | 0.1% |
| China | 297 | 1.0% |
| Colombia | 31 | 0.1% |
| Czechoslovakia | 39 | 0.1% |
| Eastern Asia | 748 | 2.5% |
| Eastern Europe | 531 | 1.8% |
| Ecuador | 6 | 0.0% |
| Egypt | 40 | 0.1% |
| El Salvador | 189 | 0.6% |
| England | 244 | 0.8% |
| Europe | 1,127 | 3.8% |
| Fiji | 63 | 0.2% |
| Germany | 103 | 0.3% |
| Ghana | 11 | 0.0% |
| Greece | 21 | 0.1% |
| Guatemala | 26 | 0.1% |
| Haiti | 11 | 0.0% |
| Honduras | 8 | 0.0% |
| Hong Kong | 22 | 0.1% |
| Hungary | 21 | 0.1% |
| India | 420 | 1.4% |
| Indonesia | 21 | 0.1% |
| Iran | 41 | 0.1% |
| Iraq | 22 | 0.1% |
| Israel | 27 | 0.1% |
| Italy | 56 | 0.2% |
| Japan | 154 | 0.5% |
| Korea | 297 | 1.0% |
| Kuwait | 23 | 0.1% |
| Latin America | 1,533 | 5.1% |
| Latvia | 11 | 0.0% |
| Lebanon | 45 | 0.2% |
| Mexico | 1,086 | 3.6% |
| Moldova | 13 | 0.0% |
| Northern Africa | 64 | 0.2% |
| Northern Europe | 393 | 1.3% |
| Norway | 11 | 0.0% |
| Oceania | 63 | 0.2% |
| Pakistan | 65 | 0.2% |
| Philippines | 133 | 0.4% |
| Poland | 22 | 0.1% |
| Portugal | 10 | 0.0% |
| Romania | 145 | 0.5% |
| Russia | 101 | 0.3% |
| Scotland | 28 | 0.1% |
| Serbia | 23 | 0.1% |
| Singapore | 22 | 0.1% |
| South Africa | 43 | 0.1% |
| South America | 176 | 0.6% |
| South Central Asia | 654 | 2.2% |
| South Eastern Asia | 229 | 0.8% |
| Southern Europe | 100 | 0.3% |
| Spain | 13 | 0.0% |
| Sri Lanka | 20 | 0.1% |
| Sweden | 50 | 0.2% |
| Syria | 145 | 0.5% |
| Taiwan | 13 | 0.0% |
| Thailand | 12 | 0.0% |
| Trinidad and Tobago | 35 | 0.1% |
| Ukraine | 77 | 0.3% |
| Uruguay | 13 | 0.0% |
| Venezuela | 12 | 0.0% |
| Vietnam | 28 | 0.1% |
| Western Africa | 27 | 0.1% |
| Western Asia | 317 | 1.1% |
| Western Europe | 103 | 0.3% | View All 79 Rows |
Sex and Age in Monterey
Sex and Age in Monterey
The most populous age groups in Monterey are 25 to 29 Years (1,710 | 11.3%) for men and 25 to 29 Years (1,475 | 9.9%) for women.
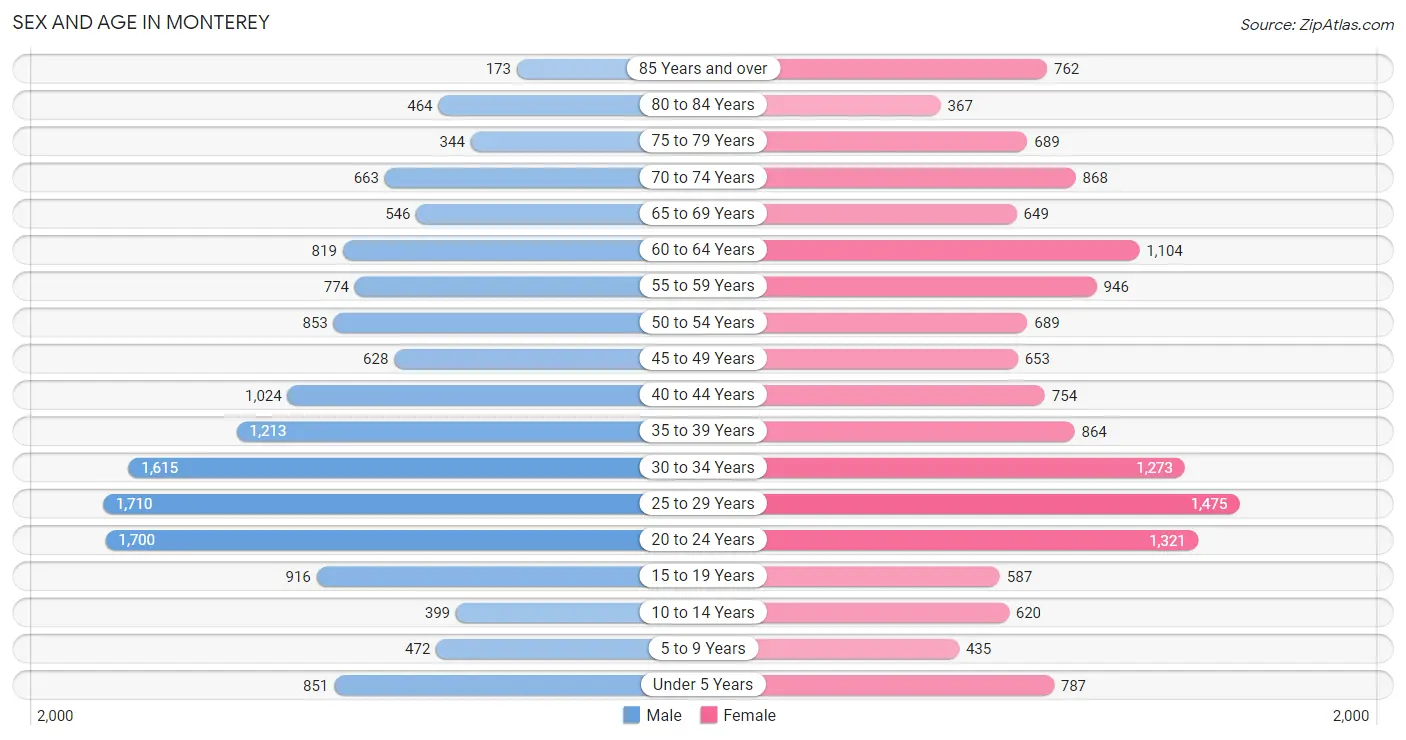
| Age Bracket | Male | Female |
| Under 5 Years | 851 (5.6%) | 787 (5.3%) |
| 5 to 9 Years | 472 (3.1%) | 435 (2.9%) |
| 10 to 14 Years | 399 (2.6%) | 620 (4.2%) |
| 15 to 19 Years | 916 (6.0%) | 587 (4.0%) |
| 20 to 24 Years | 1,700 (11.2%) | 1,321 (8.9%) |
| 25 to 29 Years | 1,710 (11.3%) | 1,475 (9.9%) |
| 30 to 34 Years | 1,615 (10.6%) | 1,273 (8.6%) |
| 35 to 39 Years | 1,213 (8.0%) | 864 (5.8%) |
| 40 to 44 Years | 1,024 (6.8%) | 754 (5.1%) |
| 45 to 49 Years | 628 (4.1%) | 653 (4.4%) |
| 50 to 54 Years | 853 (5.6%) | 689 (4.6%) |
| 55 to 59 Years | 774 (5.1%) | 946 (6.4%) |
| 60 to 64 Years | 819 (5.4%) | 1,104 (7.4%) |
| 65 to 69 Years | 546 (3.6%) | 649 (4.4%) |
| 70 to 74 Years | 663 (4.4%) | 868 (5.9%) |
| 75 to 79 Years | 344 (2.3%) | 689 (4.6%) |
| 80 to 84 Years | 464 (3.1%) | 367 (2.5%) |
| 85 Years and over | 173 (1.1%) | 762 (5.1%) |
| Total | 15,164 (100.0%) | 14,843 (100.0%) |
Families and Households in Monterey
Median Family Size in Monterey
The median family size in Monterey is 2.86 persons per family, with married-couple families (5,014 | 81.3%) accounting for the largest median family size of 2.95 persons per family. On the other hand, single female/mother families (790 | 12.8%) represent the smallest median family size with 2.39 persons per family.
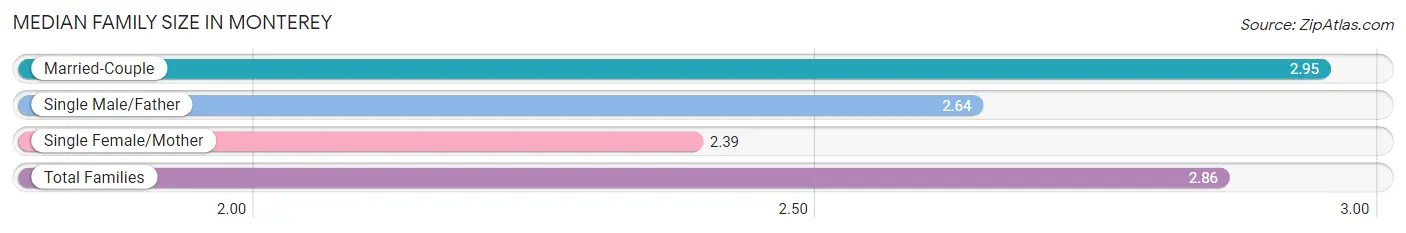
| Family Type | # Families | Family Size |
| Married-Couple | 5,014 (81.3%) | 2.95 |
| Single Male/Father | 360 (5.8%) | 2.64 |
| Single Female/Mother | 790 (12.8%) | 2.39 |
| Total Families | 6,164 (100.0%) | 2.86 |
Median Household Size in Monterey
The median household size in Monterey is 2.13 persons per household, with married-couple households (5,014 | 39.8%) accounting for the largest median household size of 3.03 persons per household. non-family households (6,422 | 51.0%) represent the smallest median household size with 1.34 persons per household.
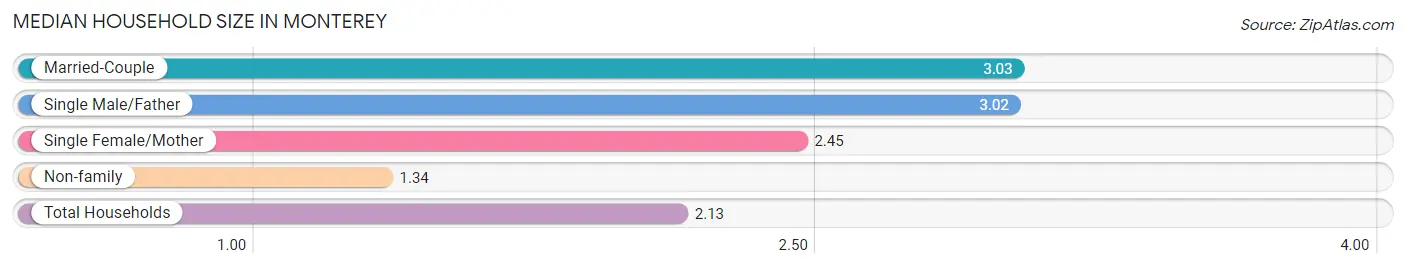
| Household Type | # Households | Household Size |
| Married-Couple | 5,014 (39.8%) | 3.03 |
| Single Male/Father | 360 (2.9%) | 3.02 |
| Single Female/Mother | 790 (6.3%) | 2.45 |
| Non-family | 6,422 (51.0%) | 1.34 |
| Total Households | 12,586 (100.0%) | 2.13 |
Household Size by Marriage Status in Monterey
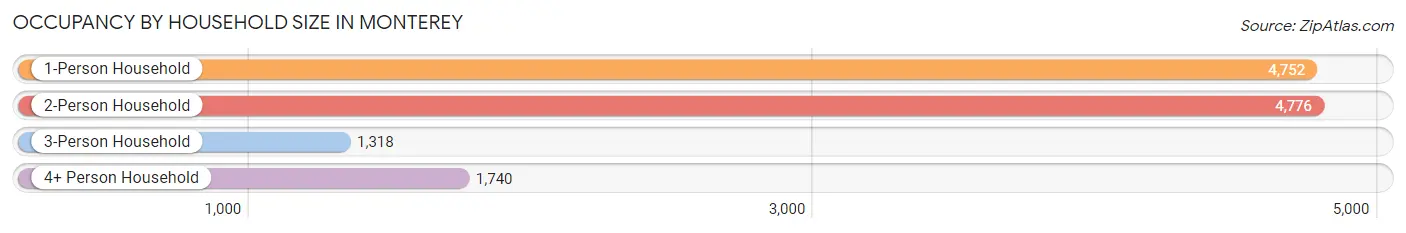
Out of a total of 12,586 households in Monterey, 6,164 (49.0%) are family households, while 6,422 (51.0%) are nonfamily households. The most numerous type of family households are 2-person households, comprising 3,428, and the most common type of nonfamily households are 1-person households, comprising 4,752.
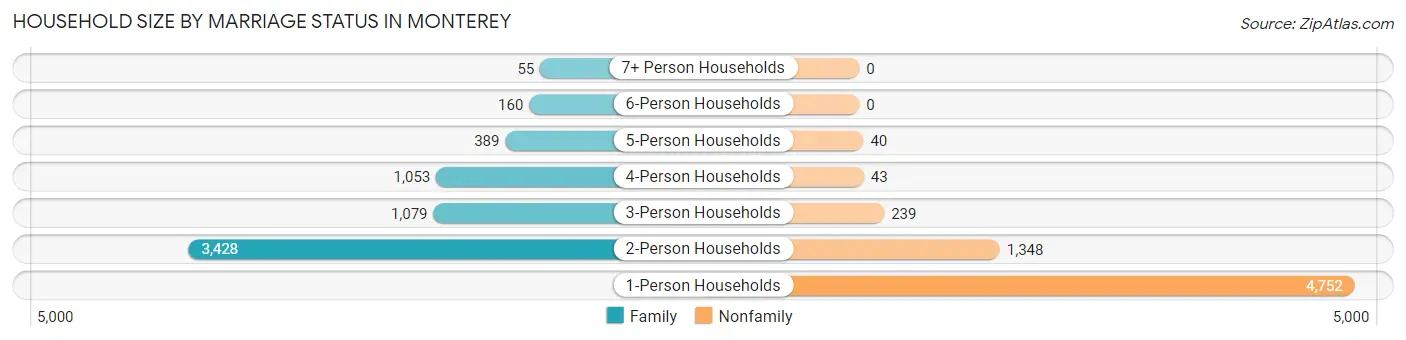
| Household Size | Family Households | Nonfamily Households |
| 1-Person Households | - | 4,752 (37.8%) |
| 2-Person Households | 3,428 (27.2%) | 1,348 (10.7%) |
| 3-Person Households | 1,079 (8.6%) | 239 (1.9%) |
| 4-Person Households | 1,053 (8.4%) | 43 (0.3%) |
| 5-Person Households | 389 (3.1%) | 40 (0.3%) |
| 6-Person Households | 160 (1.3%) | 0 (0.0%) |
| 7+ Person Households | 55 (0.4%) | 0 (0.0%) |
| Total | 6,164 (49.0%) | 6,422 (51.0%) |
Female Fertility in Monterey
Fertility by Age in Monterey
Average fertility rate in Monterey is 51.0 births per 1,000 women. Women in the age bracket of 20 to 34 years have the highest fertility rate with 59.0 births per 1,000 women. Women in the age bracket of 20 to 34 years acount for 66.9% of all women with births.
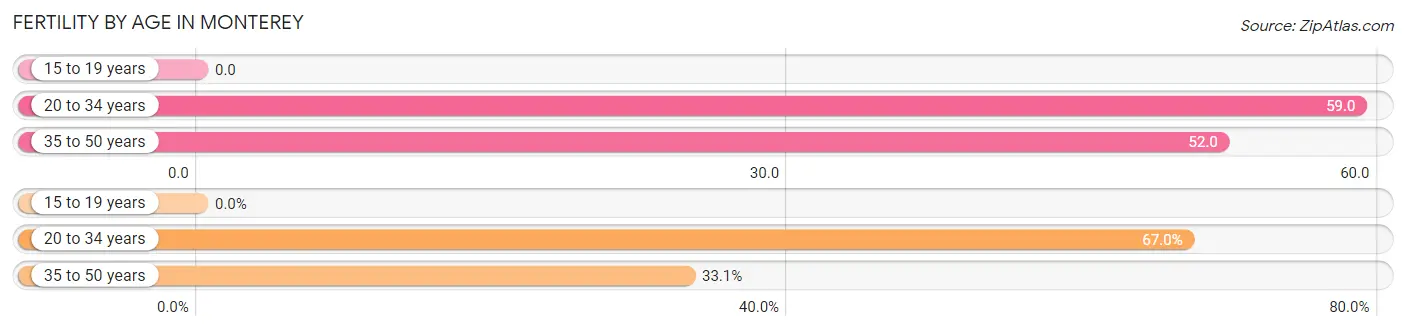
| Age Bracket | Women with Births | Births / 1,000 Women |
| 15 to 19 years | 0 (0.0%) | 0.0 |
| 20 to 34 years | 239 (66.9%) | 59.0 |
| 35 to 50 years | 118 (33.1%) | 52.0 |
| Total | 357 (100.0%) | 51.0 |
Fertility by Age by Marriage Status in Monterey
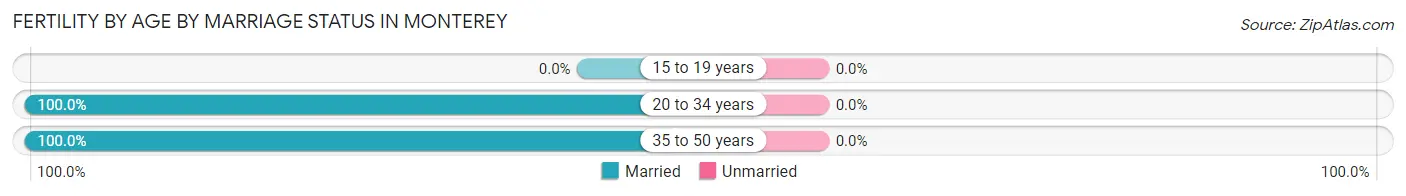
| Age Bracket | Married | Unmarried |
| 15 to 19 years | 0 (0.0%) | 0 (0.0%) |
| 20 to 34 years | 239 (100.0%) | 0 (0.0%) |
| 35 to 50 years | 118 (100.0%) | 0 (0.0%) |
| Total | 357 (100.0%) | 0 (0.0%) |
Fertility by Education in Monterey
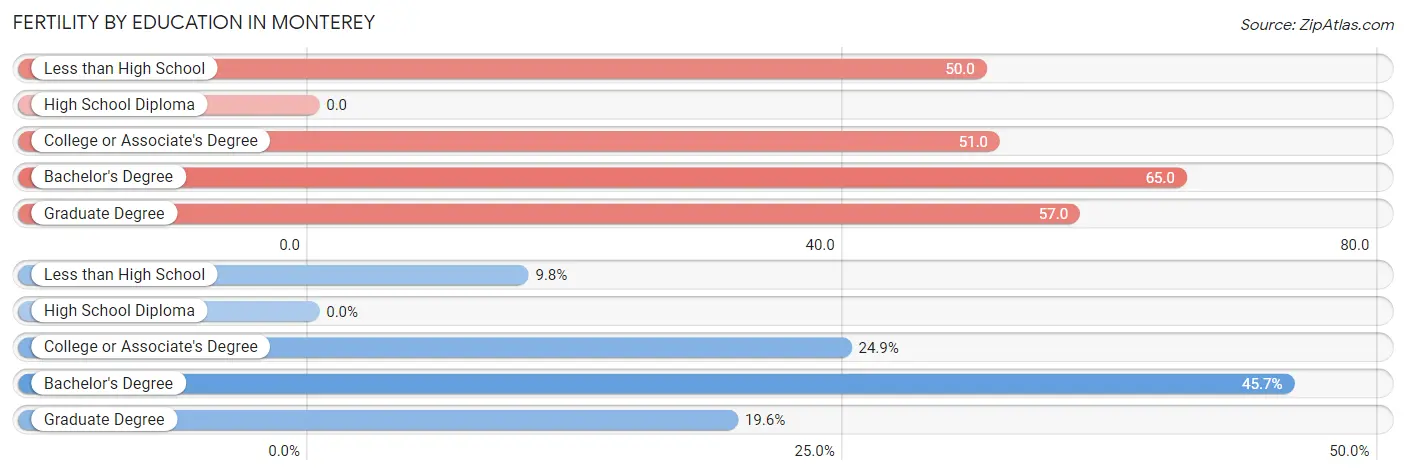
| Educational Attainment | Women with Births | Births / 1,000 Women |
| Less than High School | 35 (9.8%) | 50.0 |
| High School Diploma | 0 (0.0%) | 0.0 |
| College or Associate's Degree | 89 (24.9%) | 51.0 |
| Bachelor's Degree | 163 (45.7%) | 65.0 |
| Graduate Degree | 70 (19.6%) | 57.0 |
| Total | 357 (100.0%) | 51.0 |
Fertility by Education by Marriage Status in Monterey
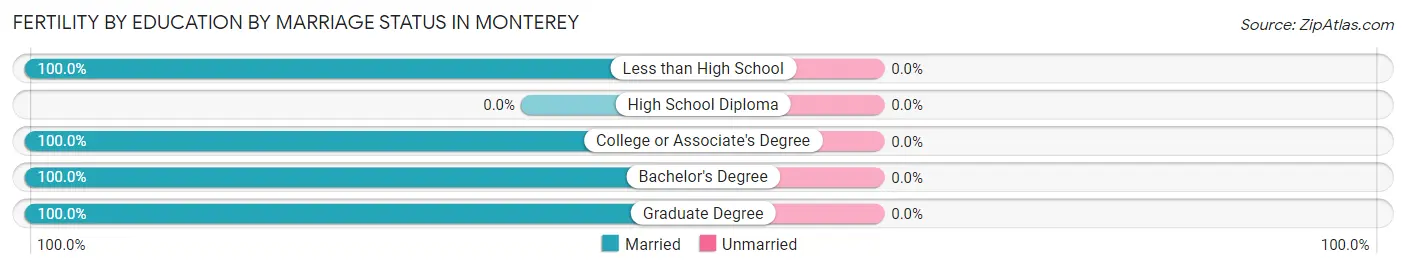
| Educational Attainment | Married | Unmarried |
| Less than High School | 35 (100.0%) | 0 (0.0%) |
| High School Diploma | 0 (0.0%) | 0 (0.0%) |
| College or Associate's Degree | 89 (100.0%) | 0 (0.0%) |
| Bachelor's Degree | 163 (100.0%) | 0 (0.0%) |
| Graduate Degree | 70 (100.0%) | 0 (0.0%) |
| Total | 357 (100.0%) | 0 (0.0%) |
Employment Characteristics in Monterey
Employment by Class of Employer in Monterey
Among the 17,524 employed individuals in Monterey, private company employees (7,613 | 43.4%), federal government employees (4,847 | 27.7%), and self-employed (not incorporated) (1,536 | 8.8%) make up the most common classes of employment.
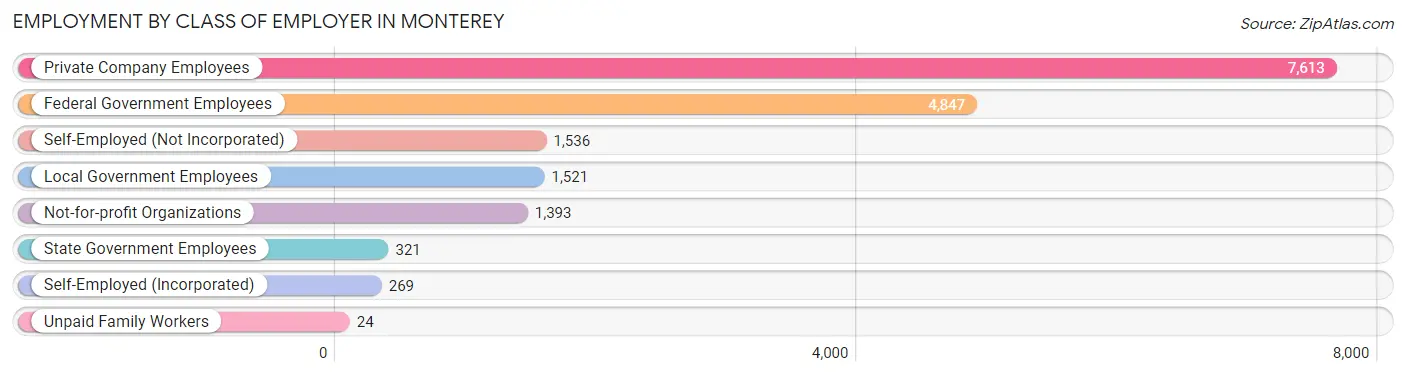
| Employer Class | # Employees | % Employees |
| Private Company Employees | 7,613 | 43.4% |
| Self-Employed (Incorporated) | 269 | 1.5% |
| Self-Employed (Not Incorporated) | 1,536 | 8.8% |
| Not-for-profit Organizations | 1,393 | 8.0% |
| Local Government Employees | 1,521 | 8.7% |
| State Government Employees | 321 | 1.8% |
| Federal Government Employees | 4,847 | 27.7% |
| Unpaid Family Workers | 24 | 0.1% |
| Total | 17,524 | 100.0% |
Employment Status by Age in Monterey
According to the labor force statistics for Monterey, out of the total population over 16 years of age (26,351), 70.7% or 18,630 individuals are in the labor force, with 4.9% or 913 of them unemployed. The age group with the highest labor force participation rate is 20 to 24 years, with 93.0% or 2,810 individuals in the labor force. Within the labor force, the 16 to 19 years age range has the highest percentage of unemployed individuals, with 19.7% or 197 of them being unemployed.
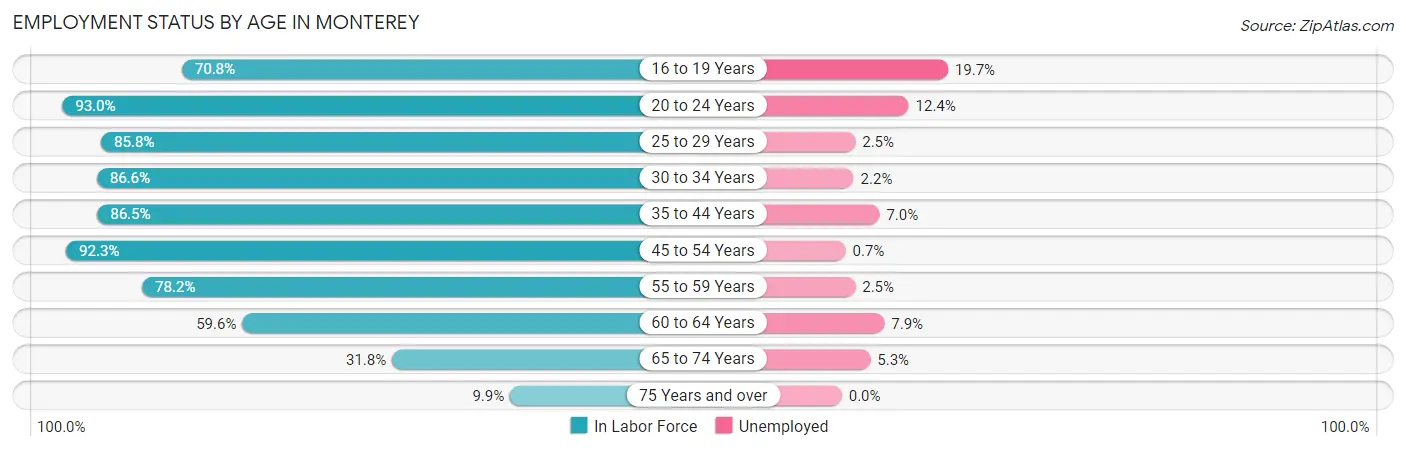
| Age Bracket | In Labor Force | Unemployed |
| 16 to 19 Years | 999 (70.8%) | 197 (19.7%) |
| 20 to 24 Years | 2,810 (93.0%) | 348 (12.4%) |
| 25 to 29 Years | 2,733 (85.8%) | 68 (2.5%) |
| 30 to 34 Years | 2,501 (86.6%) | 55 (2.2%) |
| 35 to 44 Years | 3,335 (86.5%) | 233 (7.0%) |
| 45 to 54 Years | 2,606 (92.3%) | 18 (0.7%) |
| 55 to 59 Years | 1,345 (78.2%) | 34 (2.5%) |
| 60 to 64 Years | 1,146 (59.6%) | 91 (7.9%) |
| 65 to 74 Years | 867 (31.8%) | 46 (5.3%) |
| 75 Years and over | 277 (9.9%) | 0 (0.0%) |
| Total | 18,630 (70.7%) | 913 (4.9%) |
Employment Status by Educational Attainment in Monterey
According to labor force statistics for Monterey, 83.4% of individuals (13,673) out of the total population between 25 and 64 years of age (16,394) are in the labor force, with 3.7% or 506 of them being unemployed. The group with the highest labor force participation rate are those with the educational attainment of bachelor's degree or higher, with 88.7% or 8,256 individuals in the labor force. Within the labor force, individuals with less than high school education have the highest percentage of unemployment, with 6.0% or 37 of them being unemployed.
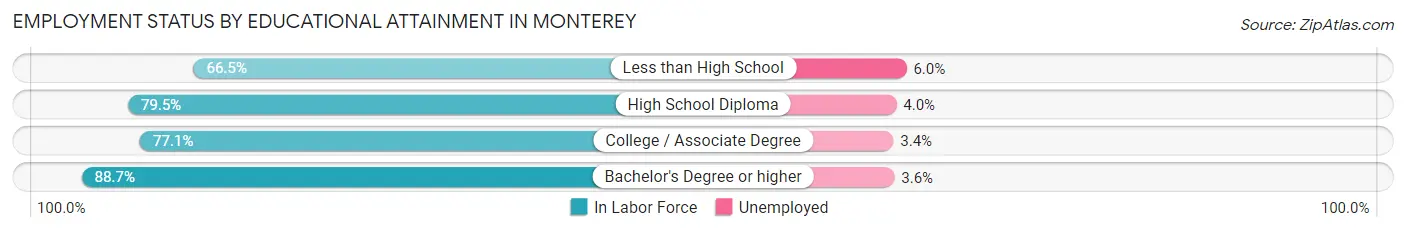
| Educational Attainment | In Labor Force | Unemployed |
| Less than High School | 619 (66.5%) | 56 (6.0%) |
| High School Diploma | 1,503 (79.5%) | 76 (4.0%) |
| College / Associate Degree | 3,288 (77.1%) | 145 (3.4%) |
| Bachelor's Degree or higher | 8,256 (88.7%) | 335 (3.6%) |
| Total | 13,673 (83.4%) | 607 (3.7%) |
Employment Occupations by Sex in Monterey
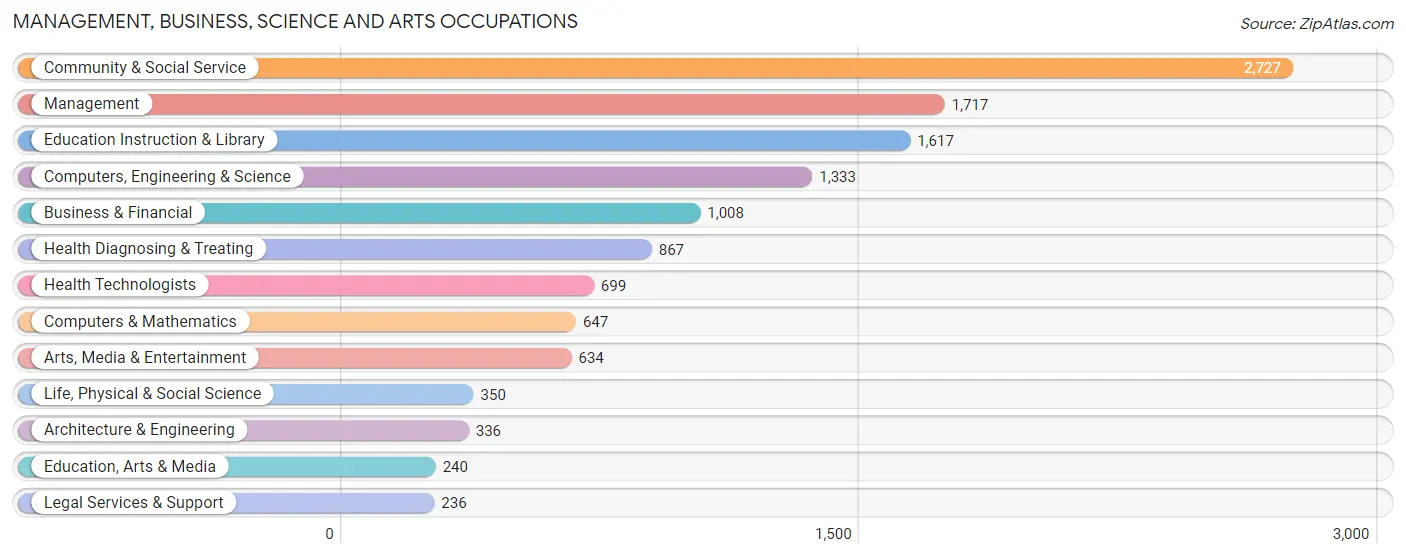
Management, Business, Science and Arts Occupations
The most common Management, Business, Science and Arts occupations in Monterey are Community & Social Service (2,727 | 19.1%), Management (1,717 | 12.0%), Education Instruction & Library (1,617 | 11.3%), Computers, Engineering & Science (1,333 | 9.3%), and Business & Financial (1,008 | 7.1%).
Management, Business, Science and Arts Occupations by Sex
Within the Management, Business, Science and Arts occupations in Monterey, the most male-oriented occupations are Architecture & Engineering (85.1%), Computers & Mathematics (72.2%), and Computers, Engineering & Science (65.2%), while the most female-oriented occupations are Education, Arts & Media (92.9%), Health Technologists (71.7%), and Arts, Media & Entertainment (69.6%).
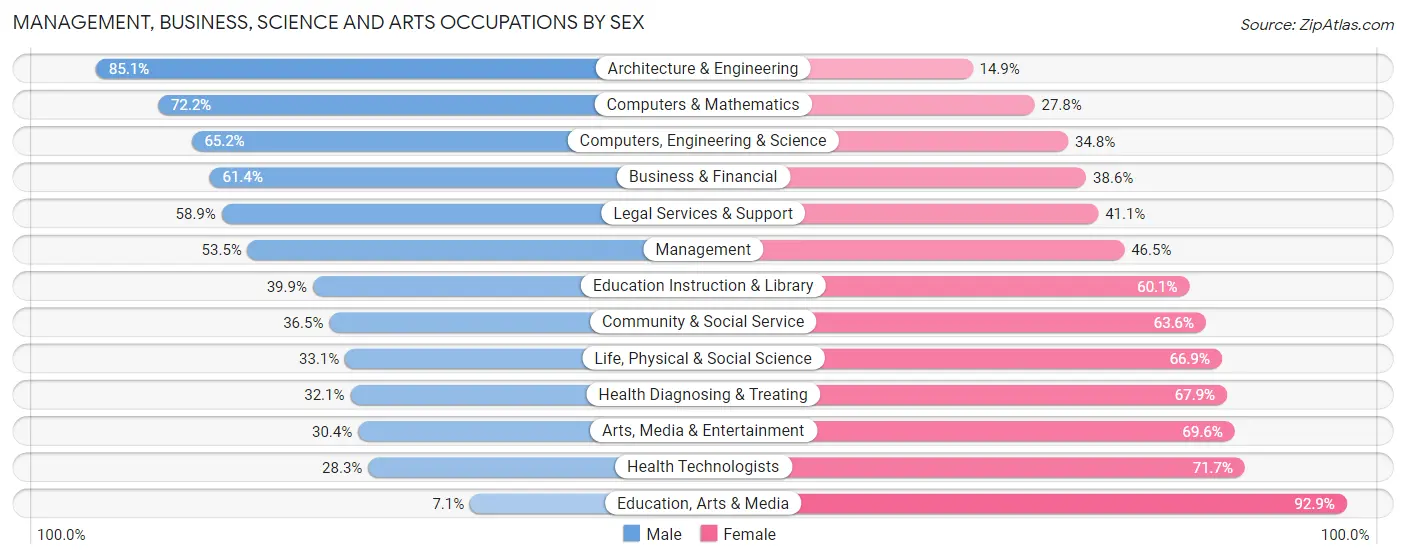
| Occupation | Male | Female |
| Management | 918 (53.5%) | 799 (46.5%) |
| Business & Financial | 619 (61.4%) | 389 (38.6%) |
| Computers, Engineering & Science | 869 (65.2%) | 464 (34.8%) |
| Computers & Mathematics | 467 (72.2%) | 180 (27.8%) |
| Architecture & Engineering | 286 (85.1%) | 50 (14.9%) |
| Life, Physical & Social Science | 116 (33.1%) | 234 (66.9%) |
| Community & Social Service | 994 (36.4%) | 1,733 (63.5%) |
| Education, Arts & Media | 17 (7.1%) | 223 (92.9%) |
| Legal Services & Support | 139 (58.9%) | 97 (41.1%) |
| Education Instruction & Library | 645 (39.9%) | 972 (60.1%) |
| Arts, Media & Entertainment | 193 (30.4%) | 441 (69.6%) |
| Health Diagnosing & Treating | 278 (32.1%) | 589 (67.9%) |
| Health Technologists | 198 (28.3%) | 501 (71.7%) |
| Total (Category) | 3,678 (48.1%) | 3,974 (51.9%) |
| Total (Overall) | 7,355 (51.6%) | 6,907 (48.4%) |
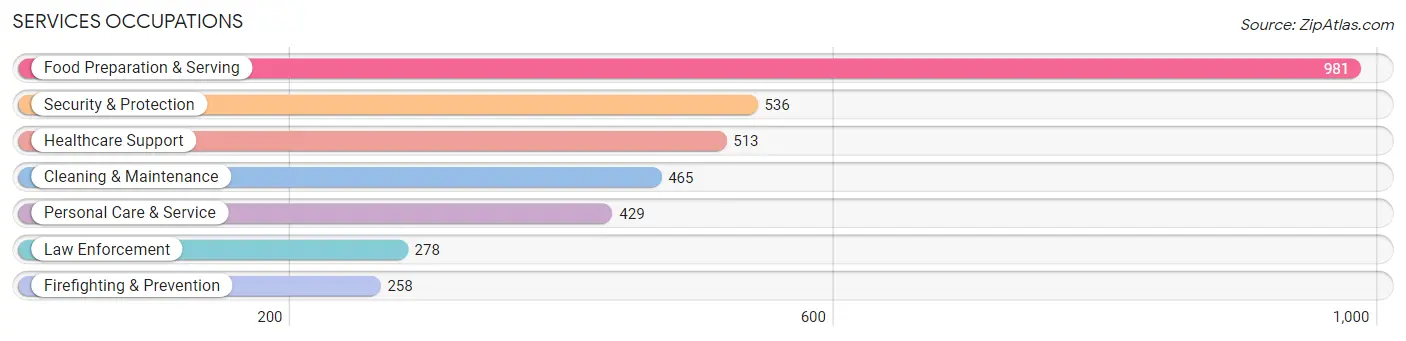
Services Occupations
The most common Services occupations in Monterey are Food Preparation & Serving (981 | 6.9%), Security & Protection (536 | 3.8%), Healthcare Support (513 | 3.6%), Cleaning & Maintenance (465 | 3.3%), and Personal Care & Service (429 | 3.0%).
Services Occupations by Sex
Within the Services occupations in Monterey, the most male-oriented occupations are Firefighting & Prevention (81.4%), Cleaning & Maintenance (77.6%), and Security & Protection (67.9%), while the most female-oriented occupations are Healthcare Support (71.2%), Personal Care & Service (67.4%), and Food Preparation & Serving (49.8%).
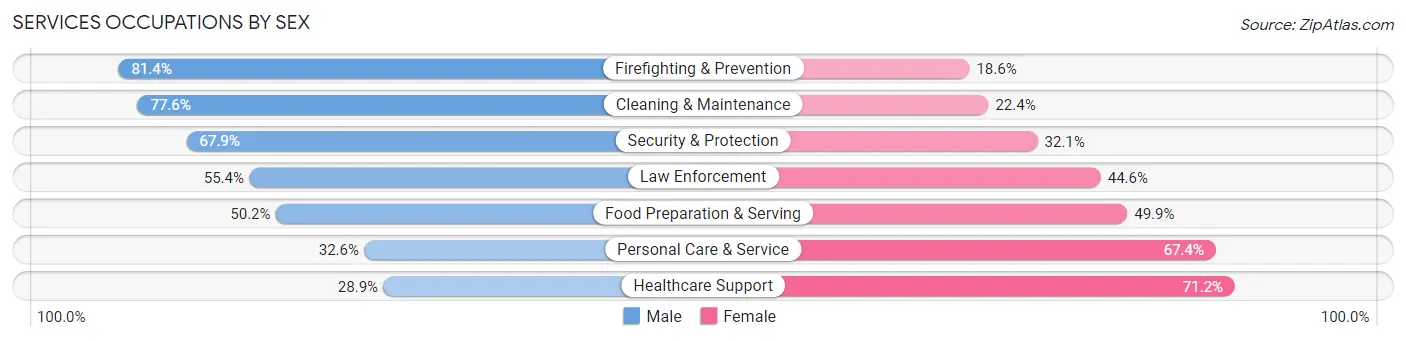
| Occupation | Male | Female |
| Healthcare Support | 148 (28.8%) | 365 (71.2%) |
| Security & Protection | 364 (67.9%) | 172 (32.1%) |
| Firefighting & Prevention | 210 (81.4%) | 48 (18.6%) |
| Law Enforcement | 154 (55.4%) | 124 (44.6%) |
| Food Preparation & Serving | 492 (50.1%) | 489 (49.8%) |
| Cleaning & Maintenance | 361 (77.6%) | 104 (22.4%) |
| Personal Care & Service | 140 (32.6%) | 289 (67.4%) |
| Total (Category) | 1,505 (51.5%) | 1,419 (48.5%) |
| Total (Overall) | 7,355 (51.6%) | 6,907 (48.4%) |
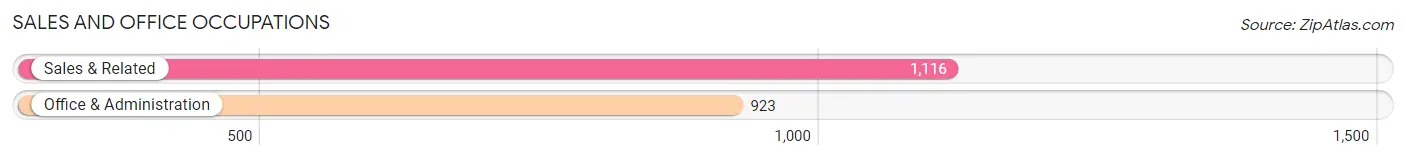
Sales and Office Occupations
The most common Sales and Office occupations in Monterey are Sales & Related (1,116 | 7.8%), and Office & Administration (923 | 6.5%).
Sales and Office Occupations by Sex
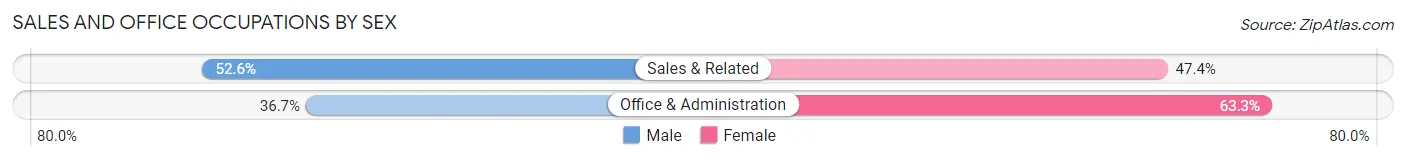
| Occupation | Male | Female |
| Sales & Related | 587 (52.6%) | 529 (47.4%) |
| Office & Administration | 339 (36.7%) | 584 (63.3%) |
| Total (Category) | 926 (45.4%) | 1,113 (54.6%) |
| Total (Overall) | 7,355 (51.6%) | 6,907 (48.4%) |
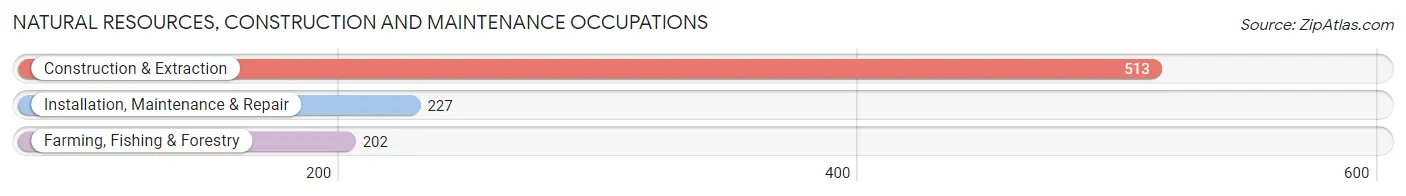
Natural Resources, Construction and Maintenance Occupations
The most common Natural Resources, Construction and Maintenance occupations in Monterey are Construction & Extraction (513 | 3.6%), Installation, Maintenance & Repair (227 | 1.6%), and Farming, Fishing & Forestry (202 | 1.4%).
Natural Resources, Construction and Maintenance Occupations by Sex
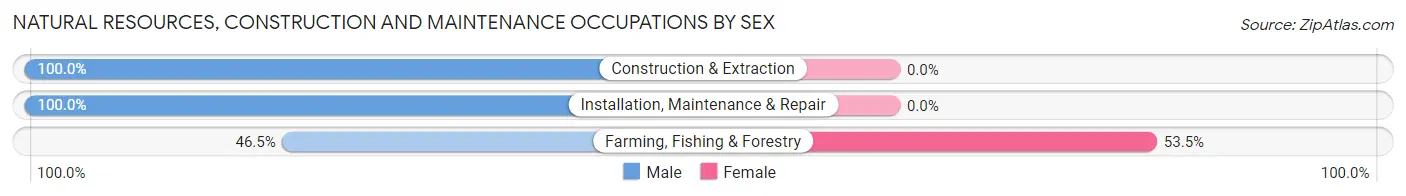
| Occupation | Male | Female |
| Farming, Fishing & Forestry | 94 (46.5%) | 108 (53.5%) |
| Construction & Extraction | 513 (100.0%) | 0 (0.0%) |
| Installation, Maintenance & Repair | 227 (100.0%) | 0 (0.0%) |
| Total (Category) | 834 (88.5%) | 108 (11.5%) |
| Total (Overall) | 7,355 (51.6%) | 6,907 (48.4%) |
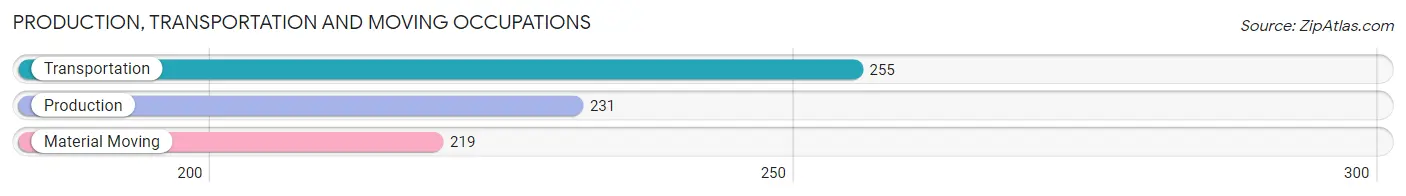
Production, Transportation and Moving Occupations
The most common Production, Transportation and Moving occupations in Monterey are Transportation (255 | 1.8%), Production (231 | 1.6%), and Material Moving (219 | 1.5%).
Production, Transportation and Moving Occupations by Sex
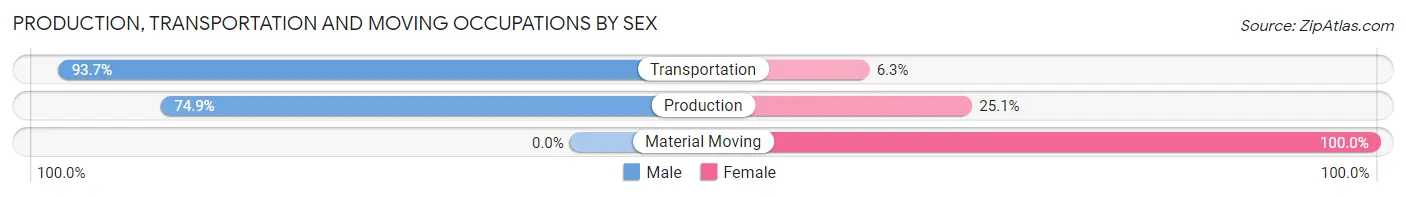
| Occupation | Male | Female |
| Production | 173 (74.9%) | 58 (25.1%) |
| Transportation | 239 (93.7%) | 16 (6.3%) |
| Material Moving | 0 (0.0%) | 219 (100.0%) |
| Total (Category) | 412 (58.4%) | 293 (41.6%) |
| Total (Overall) | 7,355 (51.6%) | 6,907 (48.4%) |
Employment Industries by Sex in Monterey
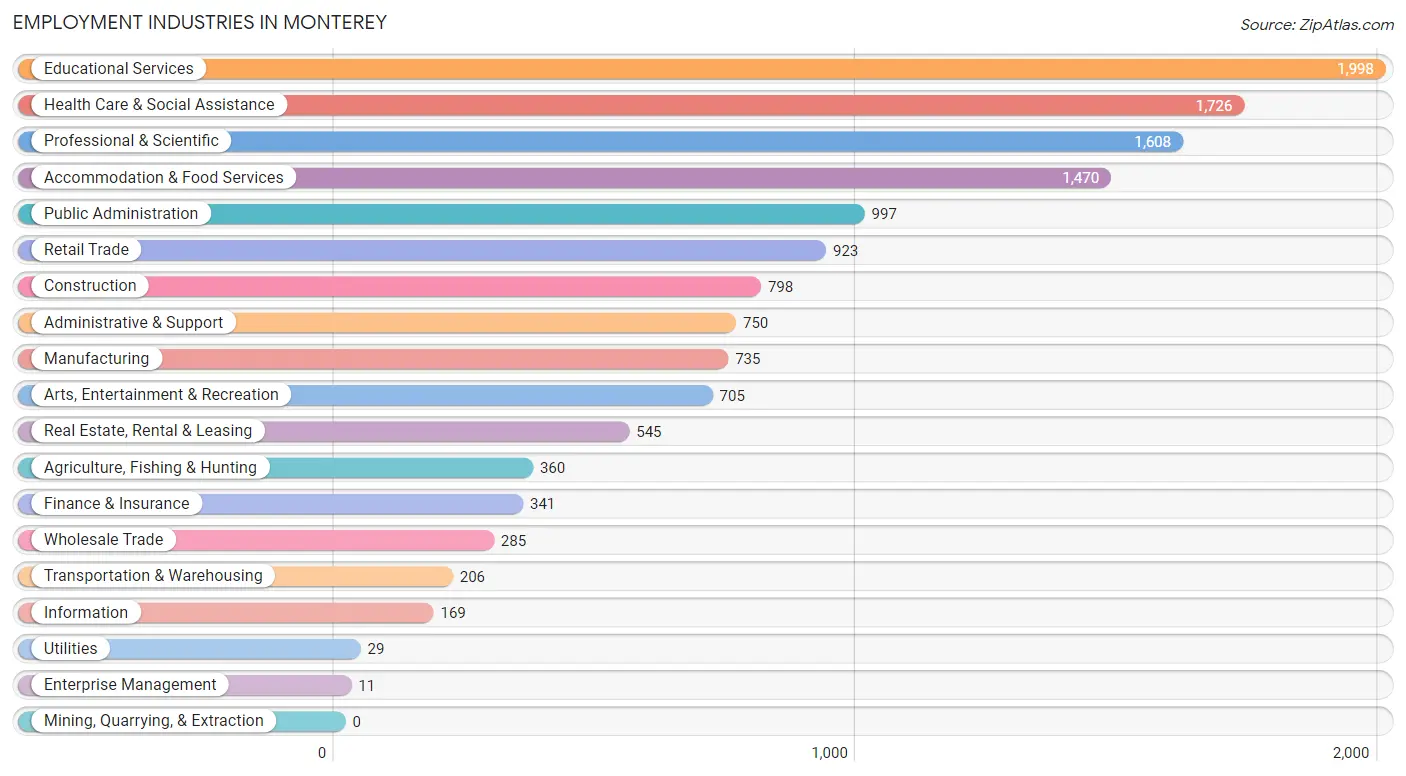
Employment Industries in Monterey
The major employment industries in Monterey include Educational Services (1,998 | 14.0%), Health Care & Social Assistance (1,726 | 12.1%), Professional & Scientific (1,608 | 11.3%), Accommodation & Food Services (1,470 | 10.3%), and Public Administration (997 | 7.0%).
Employment Industries by Sex in Monterey
The Monterey industries that see more men than women are Enterprise Management (100.0%), Construction (92.2%), and Manufacturing (79.5%), whereas the industries that tend to have a higher number of women are Health Care & Social Assistance (74.2%), Real Estate, Rental & Leasing (68.8%), and Retail Trade (63.3%).
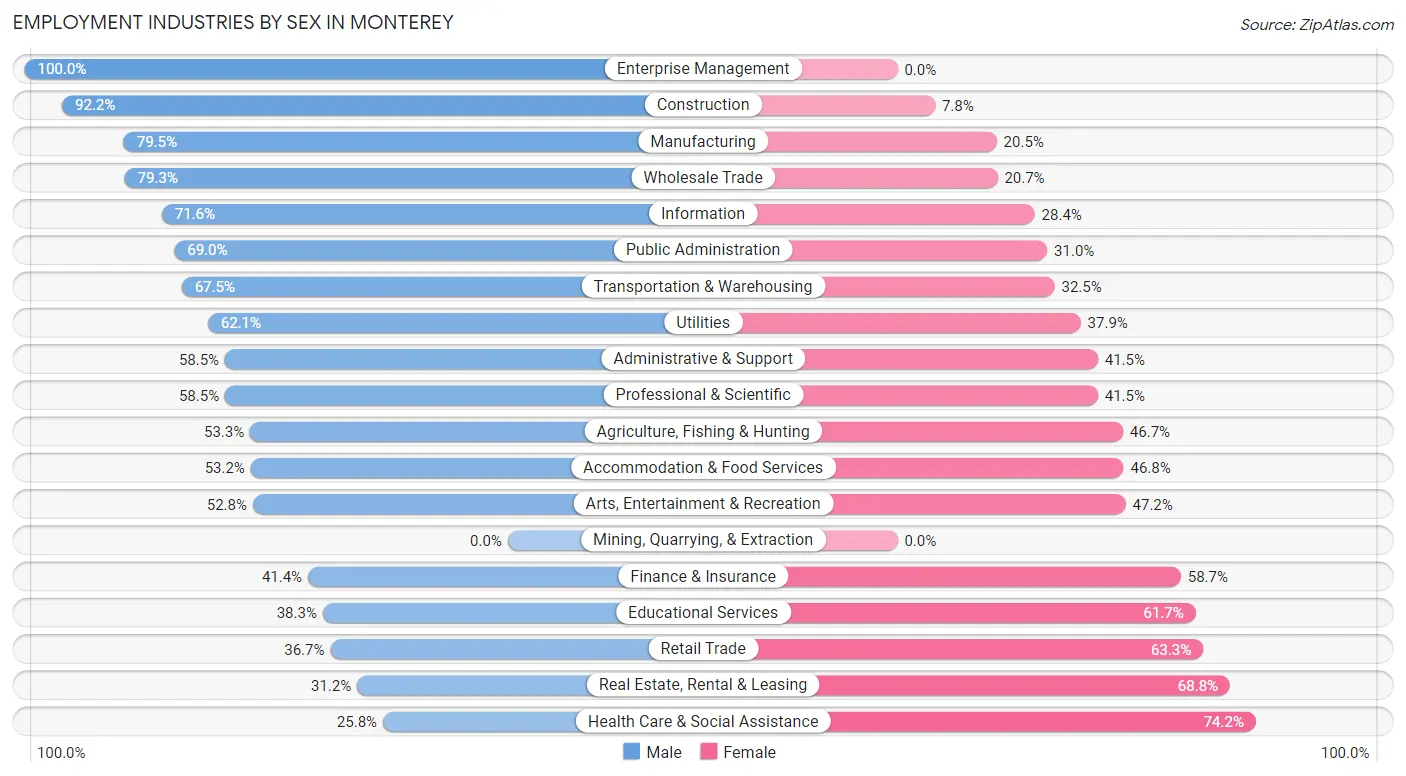
| Industry | Male | Female |
| Agriculture, Fishing & Hunting | 192 (53.3%) | 168 (46.7%) |
| Mining, Quarrying, & Extraction | 0 (0.0%) | 0 (0.0%) |
| Construction | 736 (92.2%) | 62 (7.8%) |
| Manufacturing | 584 (79.5%) | 151 (20.5%) |
| Wholesale Trade | 226 (79.3%) | 59 (20.7%) |
| Retail Trade | 339 (36.7%) | 584 (63.3%) |
| Transportation & Warehousing | 139 (67.5%) | 67 (32.5%) |
| Utilities | 18 (62.1%) | 11 (37.9%) |
| Information | 121 (71.6%) | 48 (28.4%) |
| Finance & Insurance | 141 (41.3%) | 200 (58.7%) |
| Real Estate, Rental & Leasing | 170 (31.2%) | 375 (68.8%) |
| Professional & Scientific | 941 (58.5%) | 667 (41.5%) |
| Enterprise Management | 11 (100.0%) | 0 (0.0%) |
| Administrative & Support | 439 (58.5%) | 311 (41.5%) |
| Educational Services | 765 (38.3%) | 1,233 (61.7%) |
| Health Care & Social Assistance | 446 (25.8%) | 1,280 (74.2%) |
| Arts, Entertainment & Recreation | 372 (52.8%) | 333 (47.2%) |
| Accommodation & Food Services | 782 (53.2%) | 688 (46.8%) |
| Public Administration | 688 (69.0%) | 309 (31.0%) |
| Total | 7,355 (51.6%) | 6,907 (48.4%) |
Education in Monterey
School Enrollment in Monterey
The most common levels of schooling among the 6,204 students in Monterey are college / undergraduate (1,786 | 28.8%), graduate / professional (1,542 | 24.8%), and middle school (753 | 12.1%).
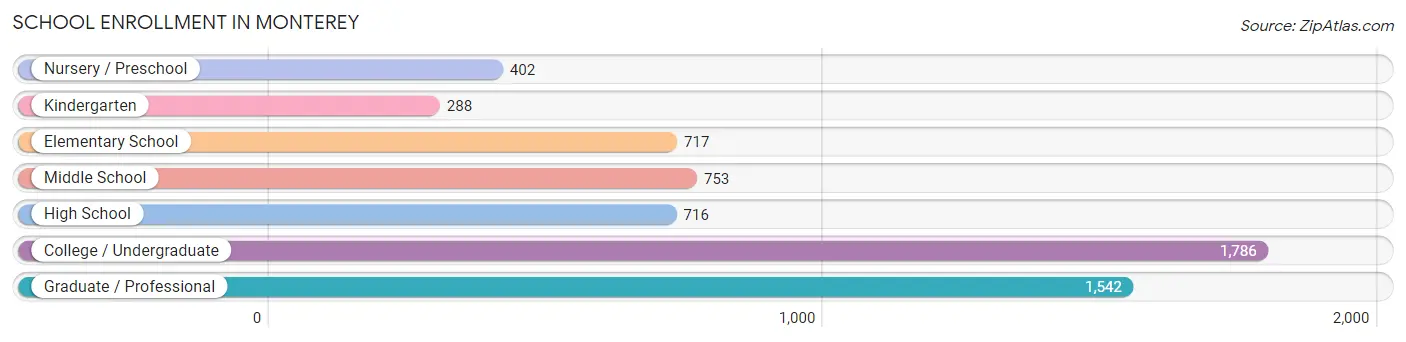
| School Level | # Students | % Students |
| Nursery / Preschool | 402 | 6.5% |
| Kindergarten | 288 | 4.6% |
| Elementary School | 717 | 11.6% |
| Middle School | 753 | 12.1% |
| High School | 716 | 11.5% |
| College / Undergraduate | 1,786 | 28.8% |
| Graduate / Professional | 1,542 | 24.8% |
| Total | 6,204 | 100.0% |
School Enrollment by Age by Funding Source in Monterey
Out of a total of 6,204 students who are enrolled in schools in Monterey, 1,843 (29.7%) attend a private institution, while the remaining 4,361 (70.3%) are enrolled in public schools. The age group of 25 to 34 year olds has the highest likelihood of being enrolled in private schools, with 601 (43.2% in the age bracket) enrolled. Conversely, the age group of 18 to 19 year olds has the lowest likelihood of being enrolled in a private school, with 273 (88.1% in the age bracket) attending a public institution.
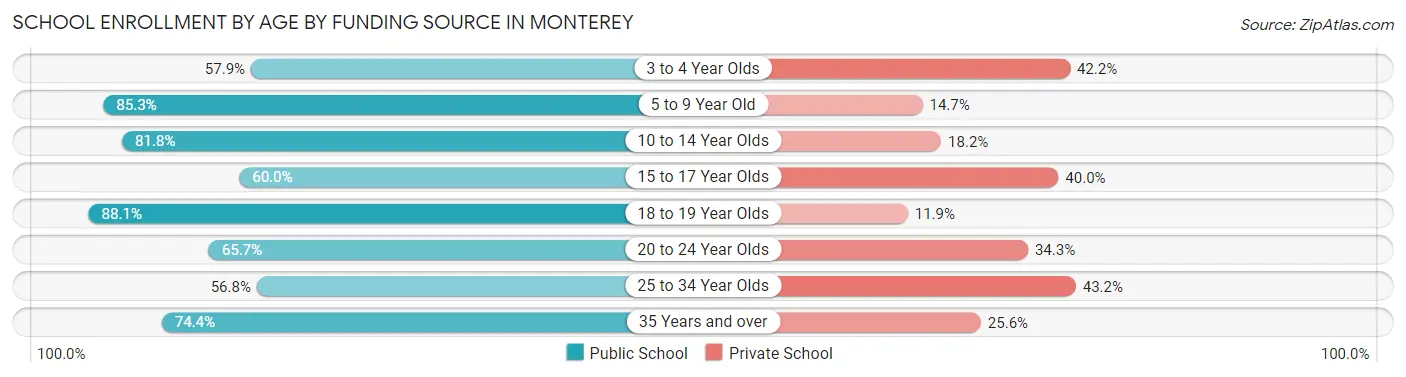
| Age Bracket | Public School | Private School |
| 3 to 4 Year Olds | 210 (57.9%) | 153 (42.1%) |
| 5 to 9 Year Old | 732 (85.3%) | 126 (14.7%) |
| 10 to 14 Year Olds | 834 (81.8%) | 185 (18.2%) |
| 15 to 17 Year Olds | 369 (60.0%) | 246 (40.0%) |
| 18 to 19 Year Olds | 273 (88.1%) | 37 (11.9%) |
| 20 to 24 Year Olds | 528 (65.7%) | 276 (34.3%) |
| 25 to 34 Year Olds | 789 (56.8%) | 601 (43.2%) |
| 35 Years and over | 629 (74.4%) | 216 (25.6%) |
| Total | 4,361 (70.3%) | 1,843 (29.7%) |
Educational Attainment by Field of Study in Monterey
Business (1,823 | 14.4%), social sciences (1,262 | 10.0%), education (1,183 | 9.3%), literature & languages (1,101 | 8.7%), and bio, nature & agricultural (1,052 | 8.3%) are the most common fields of study among 12,652 individuals in Monterey who have obtained a bachelor's degree or higher.
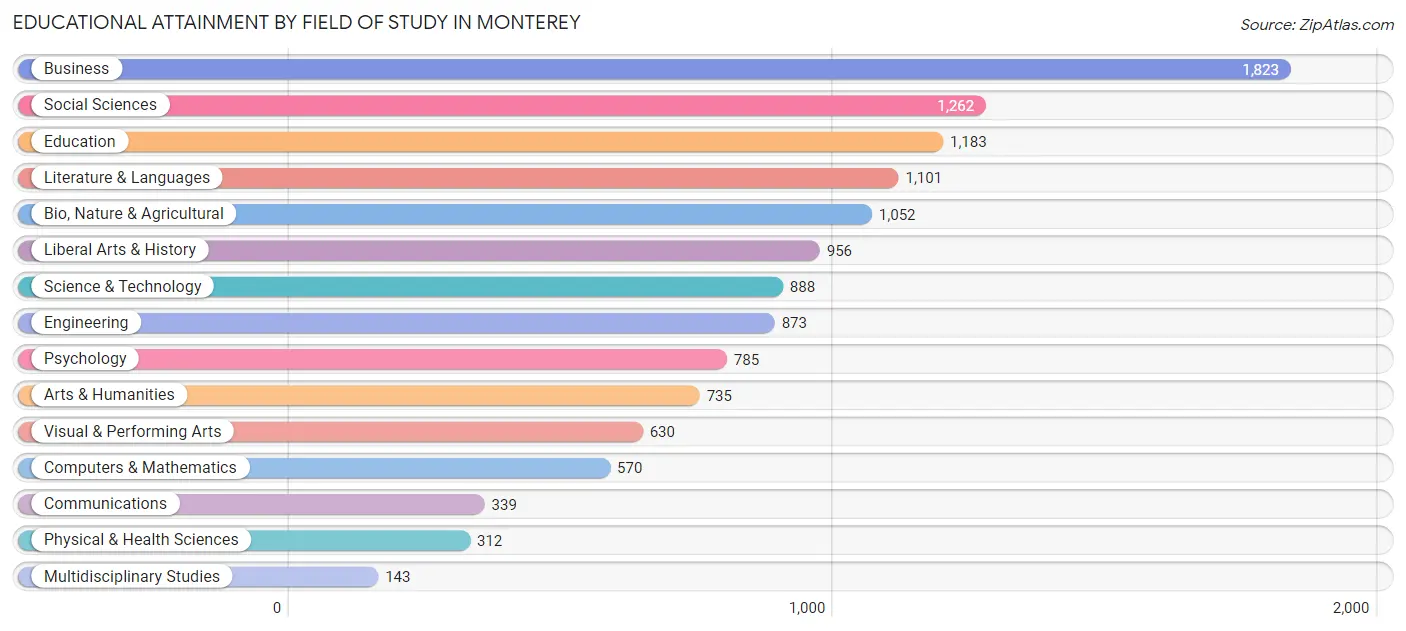
| Field of Study | # Graduates | % Graduates |
| Computers & Mathematics | 570 | 4.5% |
| Bio, Nature & Agricultural | 1,052 | 8.3% |
| Physical & Health Sciences | 312 | 2.5% |
| Psychology | 785 | 6.2% |
| Social Sciences | 1,262 | 10.0% |
| Engineering | 873 | 6.9% |
| Multidisciplinary Studies | 143 | 1.1% |
| Science & Technology | 888 | 7.0% |
| Business | 1,823 | 14.4% |
| Education | 1,183 | 9.3% |
| Literature & Languages | 1,101 | 8.7% |
| Liberal Arts & History | 956 | 7.6% |
| Visual & Performing Arts | 630 | 5.0% |
| Communications | 339 | 2.7% |
| Arts & Humanities | 735 | 5.8% |
| Total | 12,652 | 100.0% |
Transportation & Commute in Monterey
Vehicle Availability by Sex in Monterey
The most prevalent vehicle ownership categories in Monterey are males with 2 vehicles (3,679, accounting for 46.1%) and females with 2 vehicles (2,878, making up 53.7%).
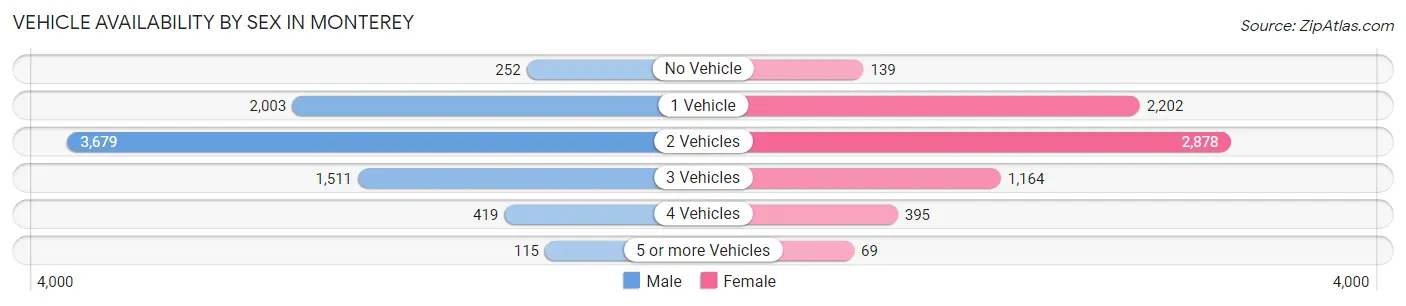
| Vehicles Available | Male | Female |
| No Vehicle | 252 (3.2%) | 139 (2.0%) |
| 1 Vehicle | 2,003 (25.1%) | 2,202 (32.2%) |
| 2 Vehicles | 3,679 (46.1%) | 2,878 (42.0%) |
| 3 Vehicles | 1,511 (18.9%) | 1,164 (17.0%) |
| 4 Vehicles | 419 (5.2%) | 395 (5.8%) |
| 5 or more Vehicles | 115 (1.4%) | 69 (1.0%) |
| Total | 7,979 (100.0%) | 6,847 (100.0%) |
Commute Time in Monterey
The most frequently occuring commute durations in Monterey are 10 to 14 minutes (3,716 commuters, 26.9%), 15 to 19 minutes (2,778 commuters, 20.1%), and 5 to 9 minutes (2,510 commuters, 18.2%).
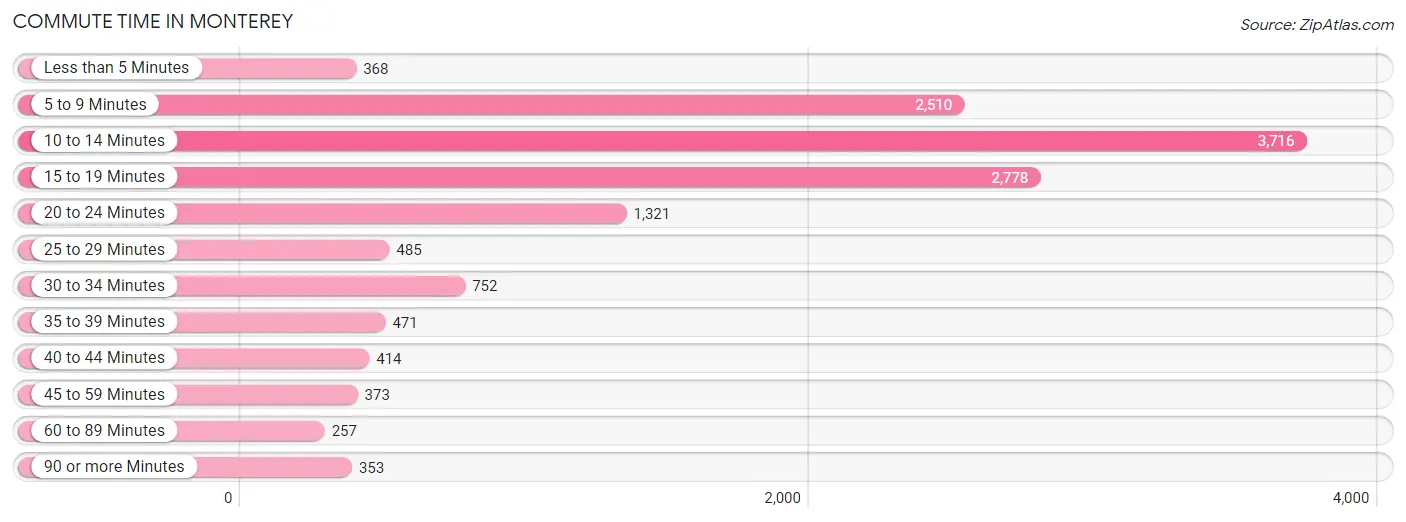
| Commute Time | # Commuters | % Commuters |
| Less than 5 Minutes | 368 | 2.7% |
| 5 to 9 Minutes | 2,510 | 18.2% |
| 10 to 14 Minutes | 3,716 | 26.9% |
| 15 to 19 Minutes | 2,778 | 20.1% |
| 20 to 24 Minutes | 1,321 | 9.6% |
| 25 to 29 Minutes | 485 | 3.5% |
| 30 to 34 Minutes | 752 | 5.4% |
| 35 to 39 Minutes | 471 | 3.4% |
| 40 to 44 Minutes | 414 | 3.0% |
| 45 to 59 Minutes | 373 | 2.7% |
| 60 to 89 Minutes | 257 | 1.9% |
| 90 or more Minutes | 353 | 2.6% |
Commute Time by Sex in Monterey
The most common commute times in Monterey are 10 to 14 minutes (2,083 commuters, 26.6%) for males and 10 to 14 minutes (1,633 commuters, 27.4%) for females.
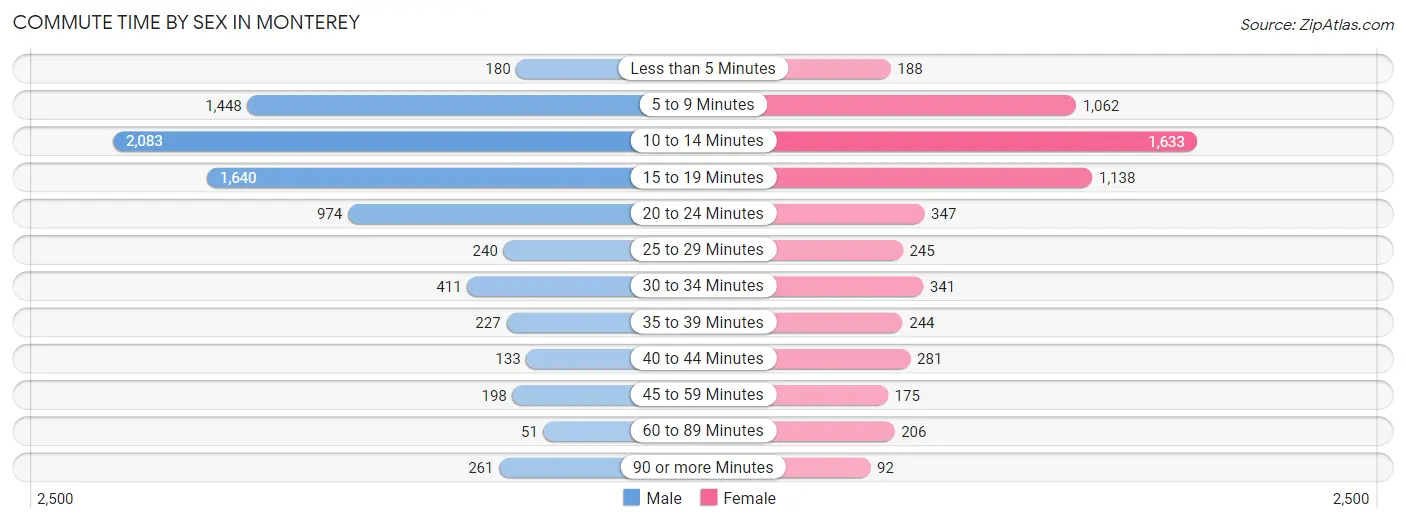
| Commute Time | Male | Female |
| Less than 5 Minutes | 180 (2.3%) | 188 (3.2%) |
| 5 to 9 Minutes | 1,448 (18.5%) | 1,062 (17.8%) |
| 10 to 14 Minutes | 2,083 (26.6%) | 1,633 (27.4%) |
| 15 to 19 Minutes | 1,640 (20.9%) | 1,138 (19.1%) |
| 20 to 24 Minutes | 974 (12.4%) | 347 (5.8%) |
| 25 to 29 Minutes | 240 (3.1%) | 245 (4.1%) |
| 30 to 34 Minutes | 411 (5.2%) | 341 (5.7%) |
| 35 to 39 Minutes | 227 (2.9%) | 244 (4.1%) |
| 40 to 44 Minutes | 133 (1.7%) | 281 (4.7%) |
| 45 to 59 Minutes | 198 (2.5%) | 175 (2.9%) |
| 60 to 89 Minutes | 51 (0.6%) | 206 (3.5%) |
| 90 or more Minutes | 261 (3.3%) | 92 (1.5%) |
Time of Departure to Work by Sex in Monterey
The most frequent times of departure to work in Monterey are 7:00 AM to 7:29 AM (1,904, 24.3%) for males and 7:30 AM to 7:59 AM (965, 16.2%) for females.
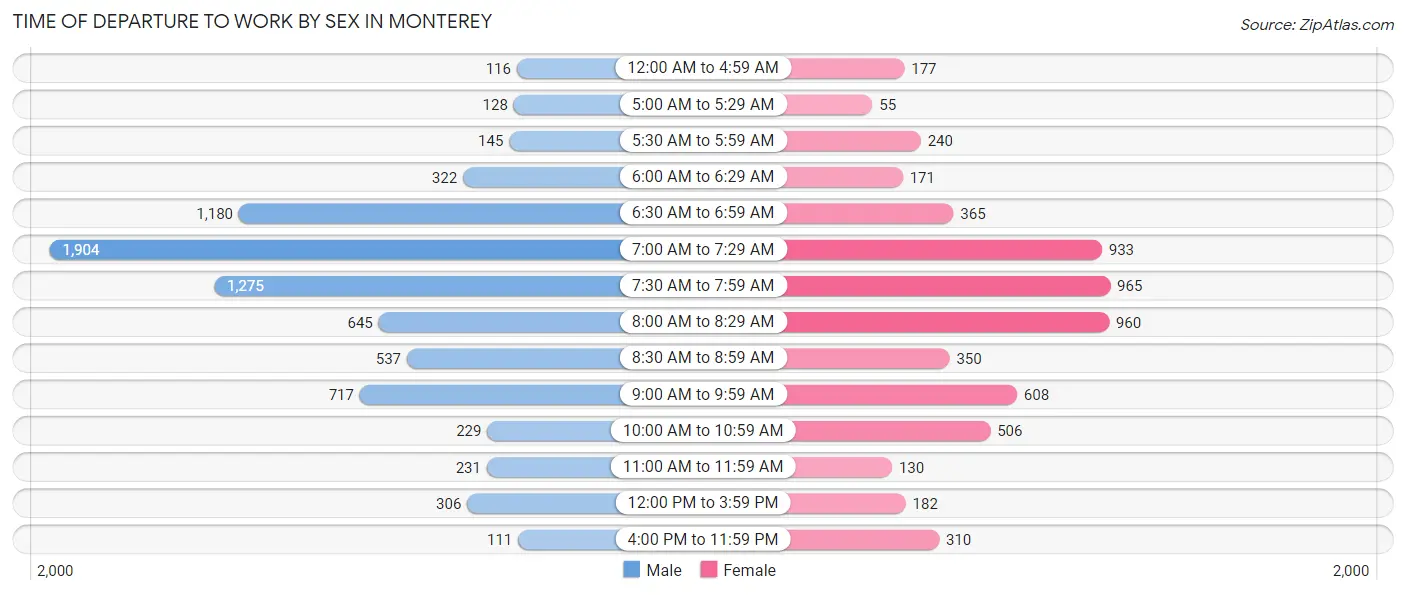
| Time of Departure | Male | Female |
| 12:00 AM to 4:59 AM | 116 (1.5%) | 177 (3.0%) |
| 5:00 AM to 5:29 AM | 128 (1.6%) | 55 (0.9%) |
| 5:30 AM to 5:59 AM | 145 (1.8%) | 240 (4.0%) |
| 6:00 AM to 6:29 AM | 322 (4.1%) | 171 (2.9%) |
| 6:30 AM to 6:59 AM | 1,180 (15.0%) | 365 (6.1%) |
| 7:00 AM to 7:29 AM | 1,904 (24.3%) | 933 (15.7%) |
| 7:30 AM to 7:59 AM | 1,275 (16.3%) | 965 (16.2%) |
| 8:00 AM to 8:29 AM | 645 (8.2%) | 960 (16.1%) |
| 8:30 AM to 8:59 AM | 537 (6.8%) | 350 (5.9%) |
| 9:00 AM to 9:59 AM | 717 (9.1%) | 608 (10.2%) |
| 10:00 AM to 10:59 AM | 229 (2.9%) | 506 (8.5%) |
| 11:00 AM to 11:59 AM | 231 (2.9%) | 130 (2.2%) |
| 12:00 PM to 3:59 PM | 306 (3.9%) | 182 (3.1%) |
| 4:00 PM to 11:59 PM | 111 (1.4%) | 310 (5.2%) |
| Total | 7,846 (100.0%) | 5,952 (100.0%) |
Housing Occupancy in Monterey
Occupancy by Ownership in Monterey
Of the total 12,586 dwellings in Monterey, owner-occupied units account for 4,481 (35.6%), while renter-occupied units make up 8,105 (64.4%).
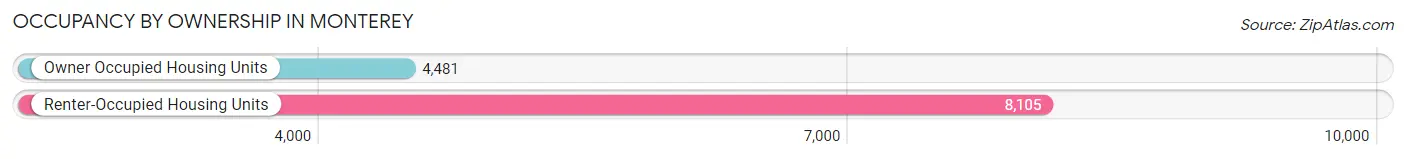
| Occupancy | # Housing Units | % Housing Units |
| Owner Occupied Housing Units | 4,481 | 35.6% |
| Renter-Occupied Housing Units | 8,105 | 64.4% |
| Total Occupied Housing Units | 12,586 | 100.0% |
Occupancy by Household Size in Monterey
| Household Size | # Housing Units | % Housing Units |
| 1-Person Household | 4,752 | 37.8% |
| 2-Person Household | 4,776 | 38.0% |
| 3-Person Household | 1,318 | 10.5% |
| 4+ Person Household | 1,740 | 13.8% |
| Total Housing Units | 12,586 | 100.0% |
Occupancy by Ownership by Household Size in Monterey
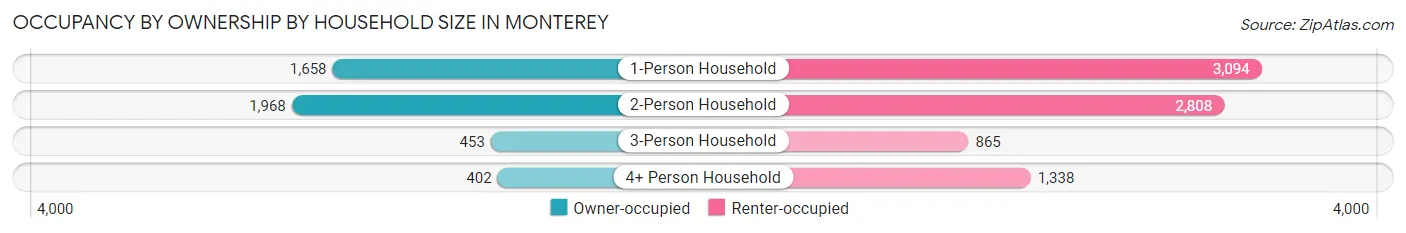
| Household Size | Owner-occupied | Renter-occupied |
| 1-Person Household | 1,658 (34.9%) | 3,094 (65.1%) |
| 2-Person Household | 1,968 (41.2%) | 2,808 (58.8%) |
| 3-Person Household | 453 (34.4%) | 865 (65.6%) |
| 4+ Person Household | 402 (23.1%) | 1,338 (76.9%) |
| Total Housing Units | 4,481 (35.6%) | 8,105 (64.4%) |
Occupancy by Educational Attainment in Monterey
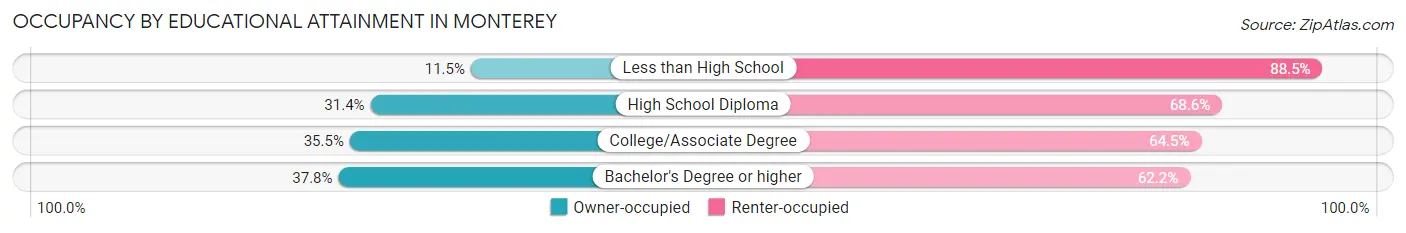
| Household Size | Owner-occupied | Renter-occupied |
| Less than High School | 55 (11.5%) | 422 (88.5%) |
| High School Diploma | 321 (31.4%) | 700 (68.6%) |
| College/Associate Degree | 1,344 (35.5%) | 2,438 (64.5%) |
| Bachelor's Degree or higher | 2,761 (37.8%) | 4,545 (62.2%) |
Occupancy by Age of Householder in Monterey
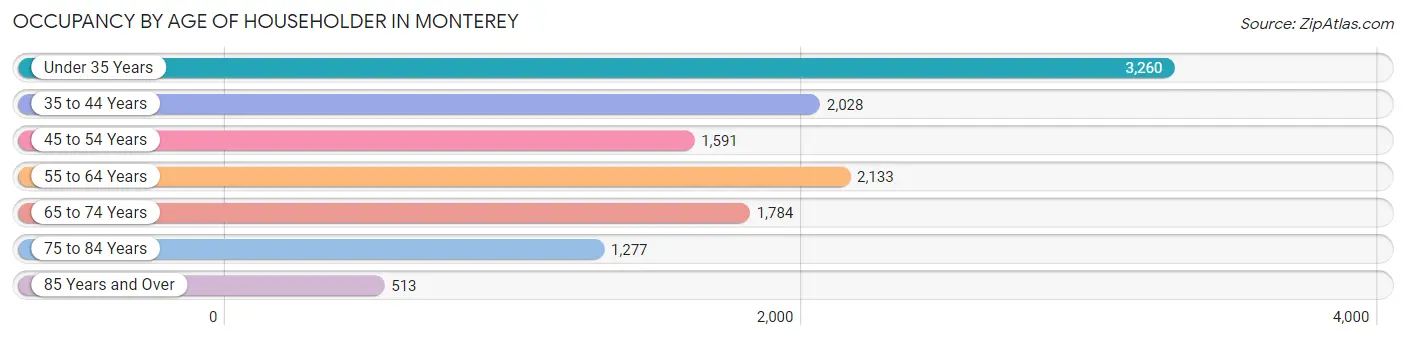
| Age Bracket | # Households | % Households |
| Under 35 Years | 3,260 | 25.9% |
| 35 to 44 Years | 2,028 | 16.1% |
| 45 to 54 Years | 1,591 | 12.6% |
| 55 to 64 Years | 2,133 | 17.0% |
| 65 to 74 Years | 1,784 | 14.2% |
| 75 to 84 Years | 1,277 | 10.2% |
| 85 Years and Over | 513 | 4.1% |
| Total | 12,586 | 100.0% |
Housing Finances in Monterey
Median Income by Occupancy in Monterey
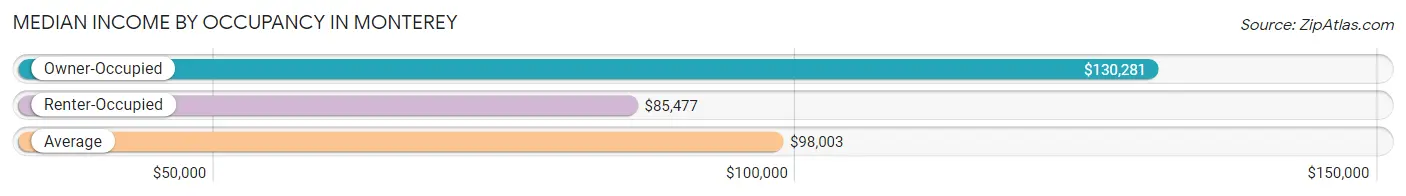
| Occupancy Type | # Households | Median Income |
| Owner-Occupied | 4,481 (35.6%) | $130,281 |
| Renter-Occupied | 8,105 (64.4%) | $85,477 |
| Average | 12,586 (100.0%) | $98,003 |
Occupancy by Householder Income Bracket in Monterey
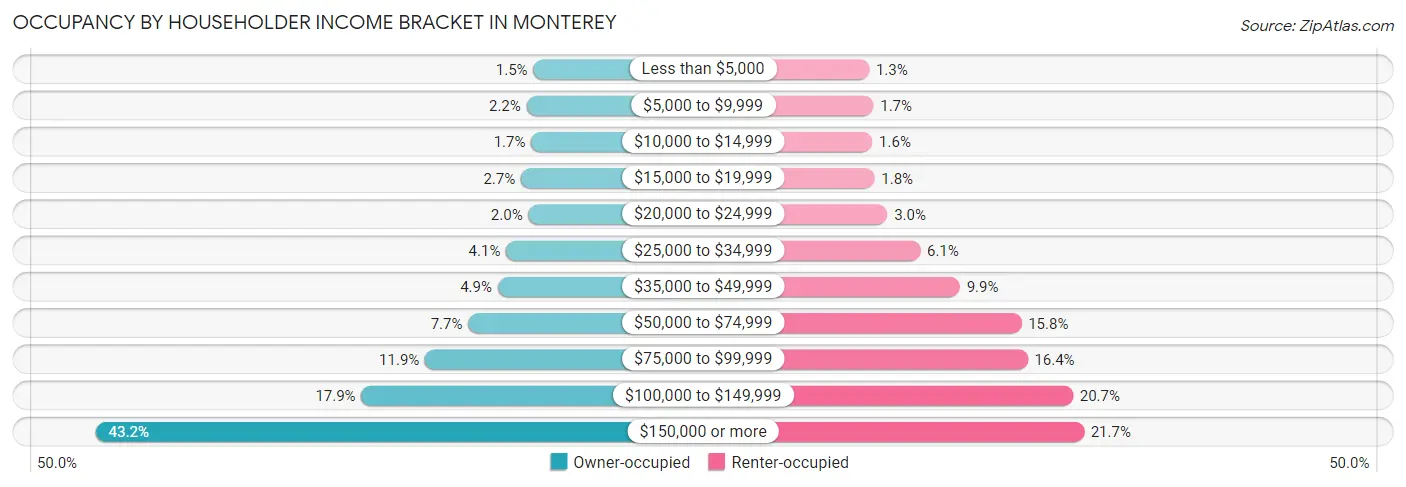
| Income Bracket | Owner-occupied | Renter-occupied |
| Less than $5,000 | 69 (1.5%) | 104 (1.3%) |
| $5,000 to $9,999 | 98 (2.2%) | 137 (1.7%) |
| $10,000 to $14,999 | 78 (1.7%) | 128 (1.6%) |
| $15,000 to $19,999 | 122 (2.7%) | 145 (1.8%) |
| $20,000 to $24,999 | 90 (2.0%) | 245 (3.0%) |
| $25,000 to $34,999 | 185 (4.1%) | 498 (6.1%) |
| $35,000 to $49,999 | 221 (4.9%) | 804 (9.9%) |
| $50,000 to $74,999 | 347 (7.7%) | 1,279 (15.8%) |
| $75,000 to $99,999 | 531 (11.8%) | 1,327 (16.4%) |
| $100,000 to $149,999 | 803 (17.9%) | 1,677 (20.7%) |
| $150,000 or more | 1,937 (43.2%) | 1,761 (21.7%) |
| Total | 4,481 (100.0%) | 8,105 (100.0%) |
Monthly Housing Cost Tiers in Monterey
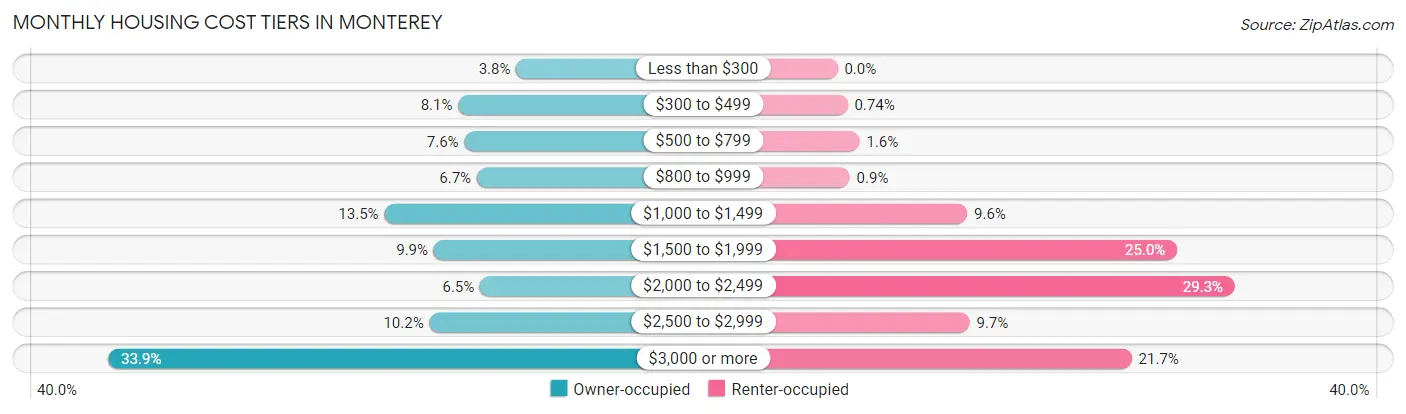
| Monthly Cost | Owner-occupied | Renter-occupied |
| Less than $300 | 170 (3.8%) | 0 (0.0%) |
| $300 to $499 | 361 (8.1%) | 60 (0.7%) |
| $500 to $799 | 341 (7.6%) | 132 (1.6%) |
| $800 to $999 | 300 (6.7%) | 73 (0.9%) |
| $1,000 to $1,499 | 605 (13.5%) | 774 (9.6%) |
| $1,500 to $1,999 | 442 (9.9%) | 2,028 (25.0%) |
| $2,000 to $2,499 | 289 (6.5%) | 2,372 (29.3%) |
| $2,500 to $2,999 | 456 (10.2%) | 789 (9.7%) |
| $3,000 or more | 1,517 (33.9%) | 1,756 (21.7%) |
| Total | 4,481 (100.0%) | 8,105 (100.0%) |
Physical Housing Characteristics in Monterey
Housing Structures in Monterey
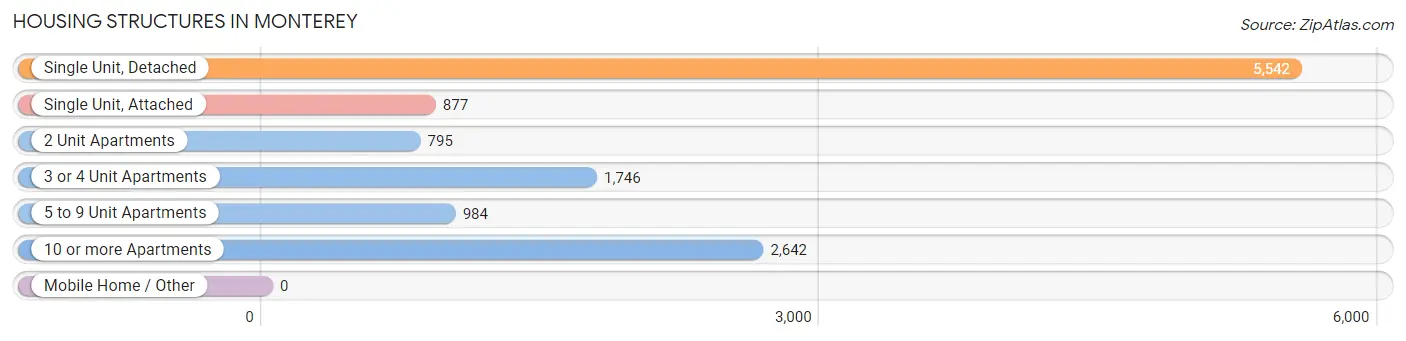
| Structure Type | # Housing Units | % Housing Units |
| Single Unit, Detached | 5,542 | 44.0% |
| Single Unit, Attached | 877 | 7.0% |
| 2 Unit Apartments | 795 | 6.3% |
| 3 or 4 Unit Apartments | 1,746 | 13.9% |
| 5 to 9 Unit Apartments | 984 | 7.8% |
| 10 or more Apartments | 2,642 | 21.0% |
| Mobile Home / Other | 0 | 0.0% |
| Total | 12,586 | 100.0% |
Housing Structures by Occupancy in Monterey
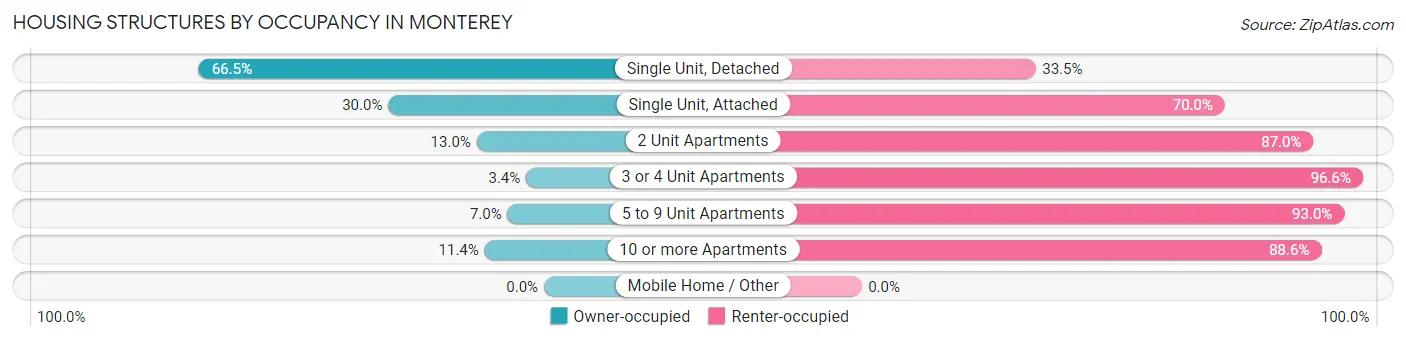
| Structure Type | Owner-occupied | Renter-occupied |
| Single Unit, Detached | 3,684 (66.5%) | 1,858 (33.5%) |
| Single Unit, Attached | 263 (30.0%) | 614 (70.0%) |
| 2 Unit Apartments | 103 (13.0%) | 692 (87.0%) |
| 3 or 4 Unit Apartments | 60 (3.4%) | 1,686 (96.6%) |
| 5 to 9 Unit Apartments | 69 (7.0%) | 915 (93.0%) |
| 10 or more Apartments | 302 (11.4%) | 2,340 (88.6%) |
| Mobile Home / Other | 0 (0.0%) | 0 (0.0%) |
| Total | 4,481 (35.6%) | 8,105 (64.4%) |
Housing Structures by Number of Rooms in Monterey
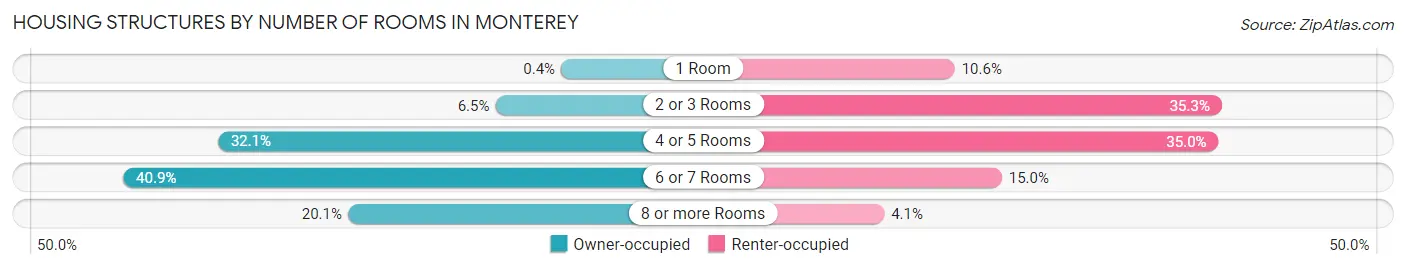
| Number of Rooms | Owner-occupied | Renter-occupied |
| 1 Room | 18 (0.4%) | 861 (10.6%) |
| 2 or 3 Rooms | 290 (6.5%) | 2,862 (35.3%) |
| 4 or 5 Rooms | 1,440 (32.1%) | 2,837 (35.0%) |
| 6 or 7 Rooms | 1,832 (40.9%) | 1,213 (15.0%) |
| 8 or more Rooms | 901 (20.1%) | 332 (4.1%) |
| Total | 4,481 (100.0%) | 8,105 (100.0%) |
Housing Structure by Heating Type in Monterey
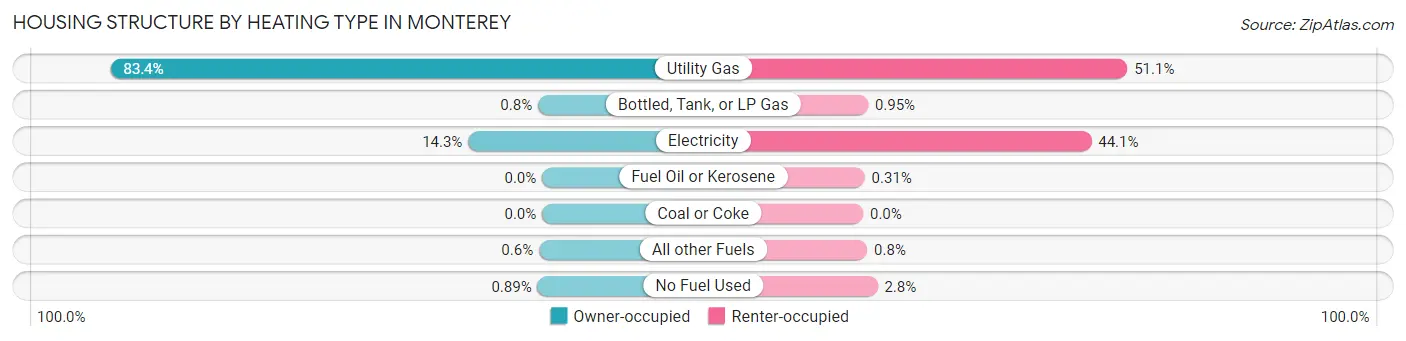
| Heating Type | Owner-occupied | Renter-occupied |
| Utility Gas | 3,738 (83.4%) | 4,138 (51.0%) |
| Bottled, Tank, or LP Gas | 36 (0.8%) | 77 (0.9%) |
| Electricity | 640 (14.3%) | 3,575 (44.1%) |
| Fuel Oil or Kerosene | 0 (0.0%) | 25 (0.3%) |
| Coal or Coke | 0 (0.0%) | 0 (0.0%) |
| All other Fuels | 27 (0.6%) | 65 (0.8%) |
| No Fuel Used | 40 (0.9%) | 225 (2.8%) |
| Total | 4,481 (100.0%) | 8,105 (100.0%) |
Household Vehicle Usage in Monterey
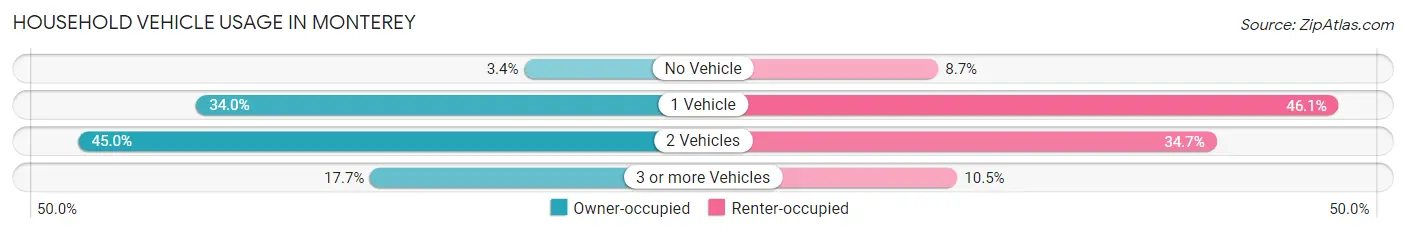
| Vehicles per Household | Owner-occupied | Renter-occupied |
| No Vehicle | 150 (3.4%) | 707 (8.7%) |
| 1 Vehicle | 1,522 (34.0%) | 3,735 (46.1%) |
| 2 Vehicles | 2,014 (45.0%) | 2,812 (34.7%) |
| 3 or more Vehicles | 795 (17.7%) | 851 (10.5%) |
| Total | 4,481 (100.0%) | 8,105 (100.0%) |
Real Estate & Mortgages in Monterey
Real Estate and Mortgage Overview in Monterey
| Characteristic | Without Mortgage | With Mortgage |
| Housing Units | 1,534 | 2,947 |
| Median Property Value | $902,000 | $942,300 |
| Median Household Income | $79,161 | $1,527 |
| Monthly Housing Costs | $763 | $1,517 |
| Real Estate Taxes | $3,309 | $53 |
Property Value by Mortgage Status in Monterey
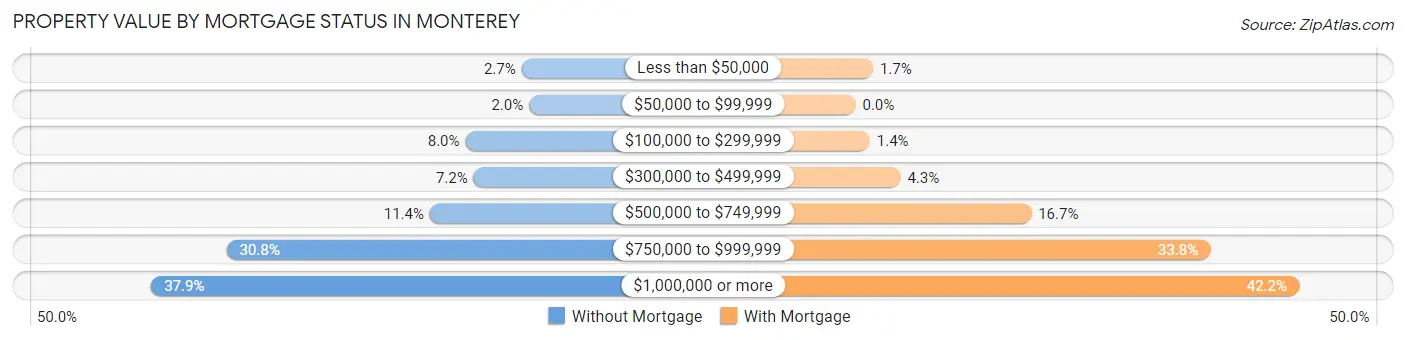
| Property Value | Without Mortgage | With Mortgage |
| Less than $50,000 | 41 (2.7%) | 49 (1.7%) |
| $50,000 to $99,999 | 30 (2.0%) | 0 (0.0%) |
| $100,000 to $299,999 | 123 (8.0%) | 40 (1.4%) |
| $300,000 to $499,999 | 111 (7.2%) | 126 (4.3%) |
| $500,000 to $749,999 | 175 (11.4%) | 493 (16.7%) |
| $750,000 to $999,999 | 472 (30.8%) | 995 (33.8%) |
| $1,000,000 or more | 582 (37.9%) | 1,244 (42.2%) |
| Total | 1,534 (100.0%) | 2,947 (100.0%) |
Household Income by Mortgage Status in Monterey
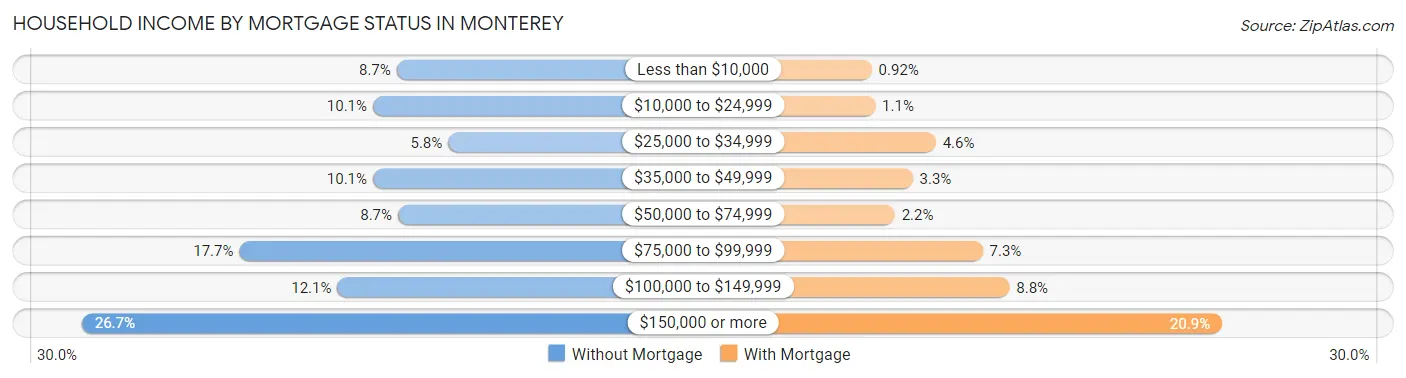
| Household Income | Without Mortgage | With Mortgage |
| Less than $10,000 | 134 (8.7%) | 27 (0.9%) |
| $10,000 to $24,999 | 155 (10.1%) | 33 (1.1%) |
| $25,000 to $34,999 | 89 (5.8%) | 135 (4.6%) |
| $35,000 to $49,999 | 155 (10.1%) | 96 (3.3%) |
| $50,000 to $74,999 | 133 (8.7%) | 66 (2.2%) |
| $75,000 to $99,999 | 272 (17.7%) | 214 (7.3%) |
| $100,000 to $149,999 | 186 (12.1%) | 259 (8.8%) |
| $150,000 or more | 410 (26.7%) | 617 (20.9%) |
| Total | 1,534 (100.0%) | 2,947 (100.0%) |
Property Value to Household Income Ratio in Monterey
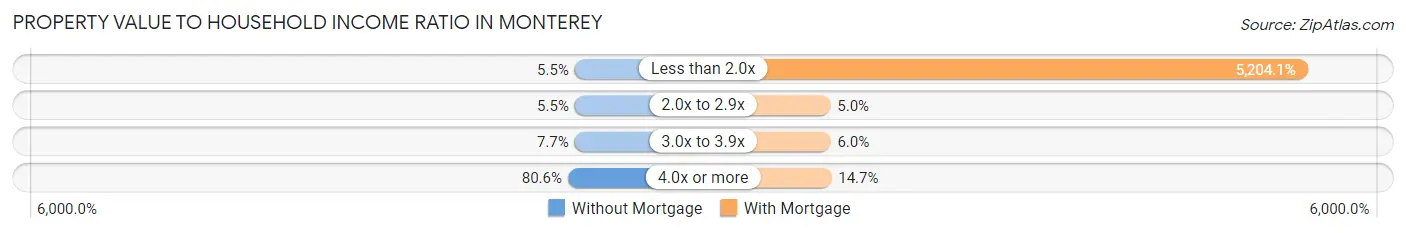
| Value-to-Income Ratio | Without Mortgage | With Mortgage |
| Less than 2.0x | 85 (5.5%) | 153,365 (5,204.1%) |
| 2.0x to 2.9x | 84 (5.5%) | 147 (5.0%) |
| 3.0x to 3.9x | 118 (7.7%) | 177 (6.0%) |
| 4.0x or more | 1,236 (80.6%) | 432 (14.7%) |
| Total | 1,534 (100.0%) | 2,947 (100.0%) |
Real Estate Taxes by Mortgage Status in Monterey
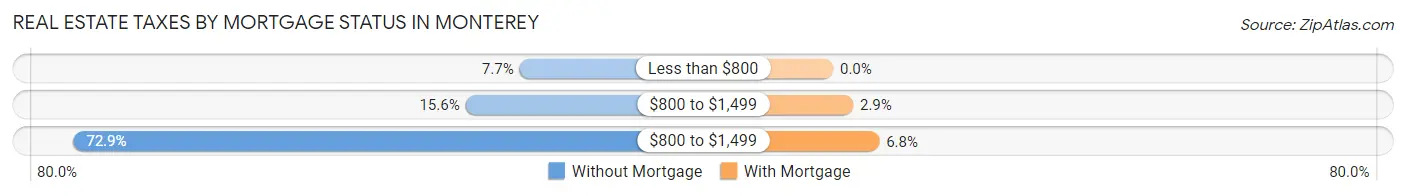
| Property Taxes | Without Mortgage | With Mortgage |
| Less than $800 | 118 (7.7%) | 0 (0.0%) |
| $800 to $1,499 | 239 (15.6%) | 86 (2.9%) |
| $800 to $1,499 | 1,118 (72.9%) | 199 (6.8%) |
| Total | 1,534 (100.0%) | 2,947 (100.0%) |
Health & Disability in Monterey
Health Insurance Coverage by Age in Monterey
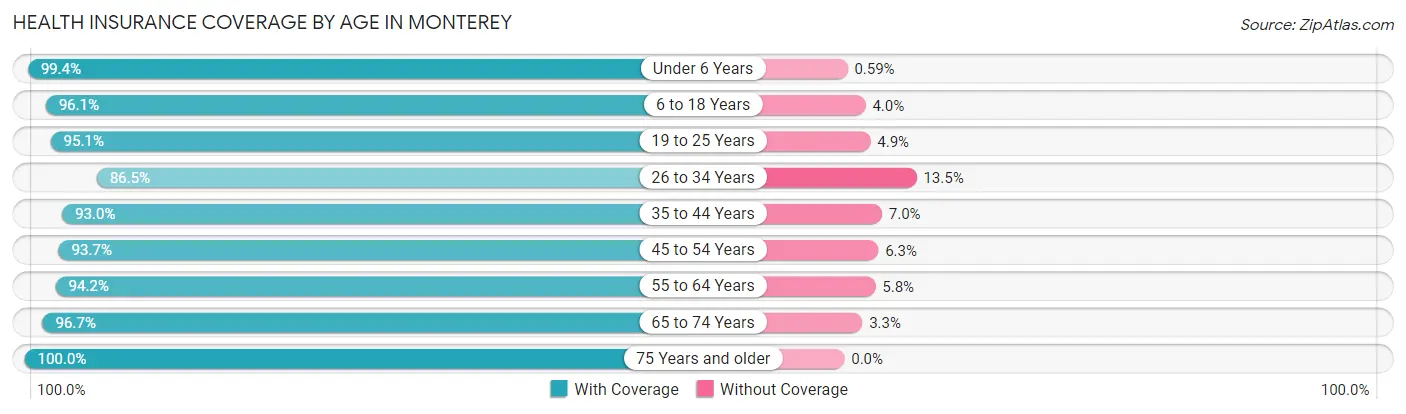
| Age Bracket | With Coverage | Without Coverage |
| Under 6 Years | 1,843 (99.4%) | 11 (0.6%) |
| 6 to 18 Years | 2,310 (96.1%) | 95 (4.0%) |
| 19 to 25 Years | 1,978 (95.1%) | 101 (4.9%) |
| 26 to 34 Years | 3,850 (86.5%) | 599 (13.5%) |
| 35 to 44 Years | 3,362 (93.0%) | 253 (7.0%) |
| 45 to 54 Years | 2,576 (93.7%) | 174 (6.3%) |
| 55 to 64 Years | 3,382 (94.2%) | 208 (5.8%) |
| 65 to 74 Years | 2,573 (96.7%) | 89 (3.3%) |
| 75 Years and older | 2,614 (100.0%) | 0 (0.0%) |
| Total | 24,488 (94.1%) | 1,530 (5.9%) |
Health Insurance Coverage by Citizenship Status in Monterey
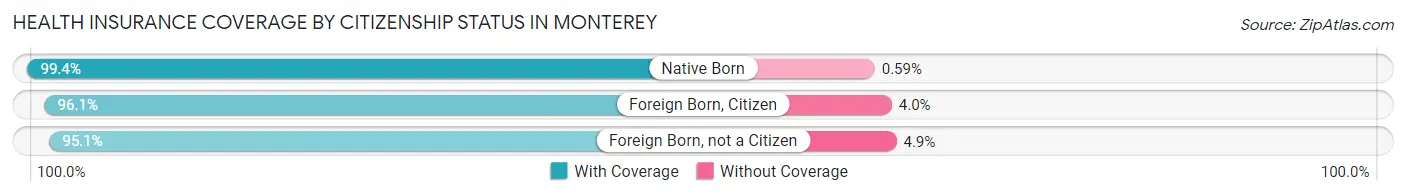
| Citizenship Status | With Coverage | Without Coverage |
| Native Born | 1,843 (99.4%) | 11 (0.6%) |
| Foreign Born, Citizen | 2,310 (96.1%) | 95 (4.0%) |
| Foreign Born, not a Citizen | 1,978 (95.1%) | 101 (4.9%) |
Health Insurance Coverage by Household Income in Monterey
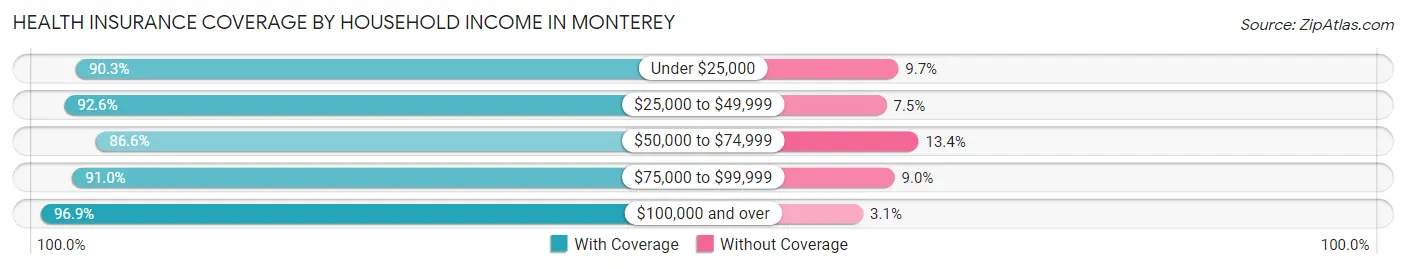
| Household Income | With Coverage | Without Coverage |
| Under $25,000 | 1,608 (90.3%) | 172 (9.7%) |
| $25,000 to $49,999 | 2,572 (92.5%) | 207 (7.4%) |
| $50,000 to $74,999 | 2,429 (86.6%) | 377 (13.4%) |
| $75,000 to $99,999 | 3,140 (91.0%) | 309 (9.0%) |
| $100,000 and over | 14,574 (96.9%) | 462 (3.1%) |
Public vs Private Health Insurance Coverage by Age in Monterey
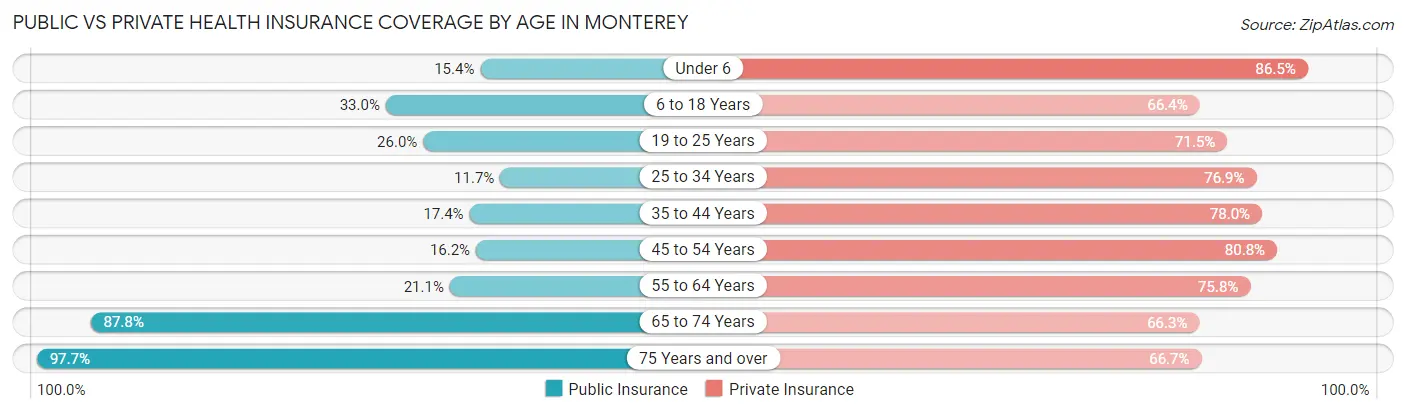
| Age Bracket | Public Insurance | Private Insurance |
| Under 6 | 286 (15.4%) | 1,603 (86.5%) |
| 6 to 18 Years | 793 (33.0%) | 1,597 (66.4%) |
| 19 to 25 Years | 541 (26.0%) | 1,487 (71.5%) |
| 25 to 34 Years | 522 (11.7%) | 3,423 (76.9%) |
| 35 to 44 Years | 630 (17.4%) | 2,819 (78.0%) |
| 45 to 54 Years | 446 (16.2%) | 2,221 (80.8%) |
| 55 to 64 Years | 757 (21.1%) | 2,721 (75.8%) |
| 65 to 74 Years | 2,336 (87.7%) | 1,766 (66.3%) |
| 75 Years and over | 2,555 (97.7%) | 1,744 (66.7%) |
| Total | 8,866 (34.1%) | 19,381 (74.5%) |
Disability Status by Sex by Age in Monterey
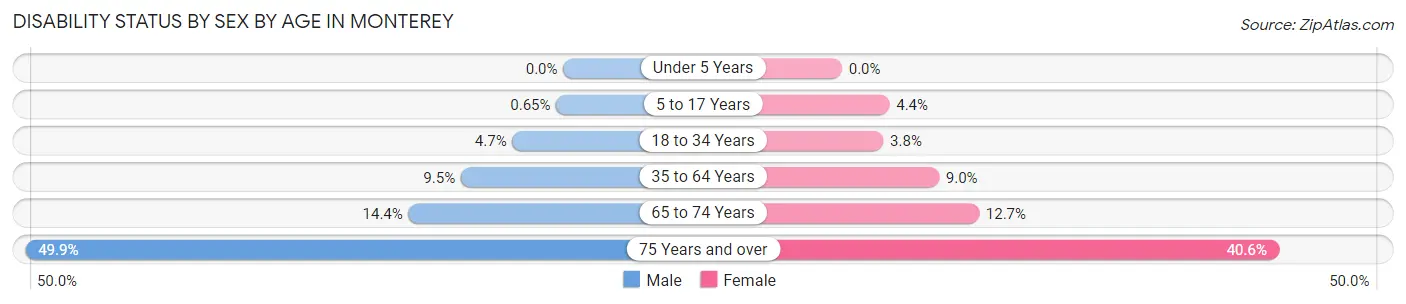
| Age Bracket | Male | Female |
| Under 5 Years | 0 (0.0%) | 0 (0.0%) |
| 5 to 17 Years | 7 (0.6%) | 60 (4.4%) |
| 18 to 34 Years | 140 (4.7%) | 144 (3.8%) |
| 35 to 64 Years | 478 (9.5%) | 444 (9.0%) |
| 65 to 74 Years | 170 (14.4%) | 188 (12.7%) |
| 75 Years and over | 452 (49.9%) | 693 (40.6%) |
Disability Class by Sex by Age in Monterey
Disability Class: Hearing Difficulty
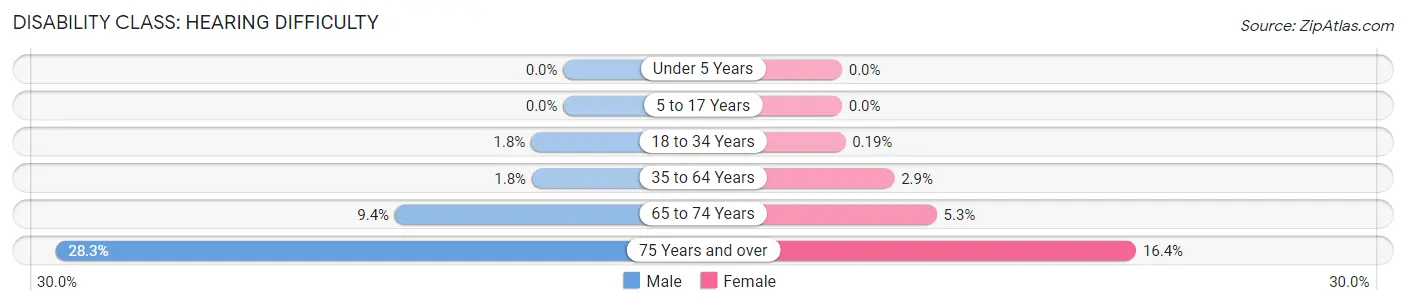
| Age Bracket | Male | Female |
| Under 5 Years | 0 (0.0%) | 0 (0.0%) |
| 5 to 17 Years | 0 (0.0%) | 0 (0.0%) |
| 18 to 34 Years | 53 (1.8%) | 7 (0.2%) |
| 35 to 64 Years | 88 (1.8%) | 144 (2.9%) |
| 65 to 74 Years | 111 (9.4%) | 78 (5.3%) |
| 75 Years and over | 256 (28.3%) | 280 (16.4%) |
Disability Class: Vision Difficulty
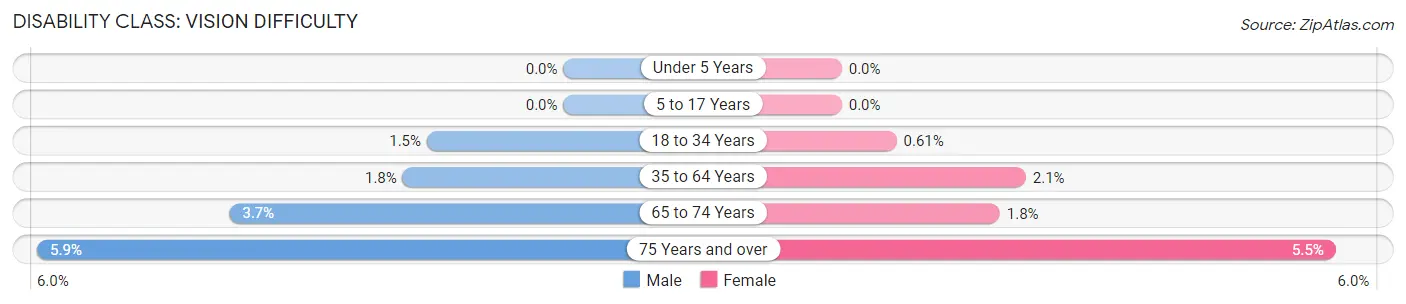
| Age Bracket | Male | Female |
| Under 5 Years | 0 (0.0%) | 0 (0.0%) |
| 5 to 17 Years | 0 (0.0%) | 0 (0.0%) |
| 18 to 34 Years | 45 (1.5%) | 23 (0.6%) |
| 35 to 64 Years | 90 (1.8%) | 101 (2.1%) |
| 65 to 74 Years | 44 (3.7%) | 26 (1.8%) |
| 75 Years and over | 53 (5.9%) | 94 (5.5%) |
Disability Class: Cognitive Difficulty
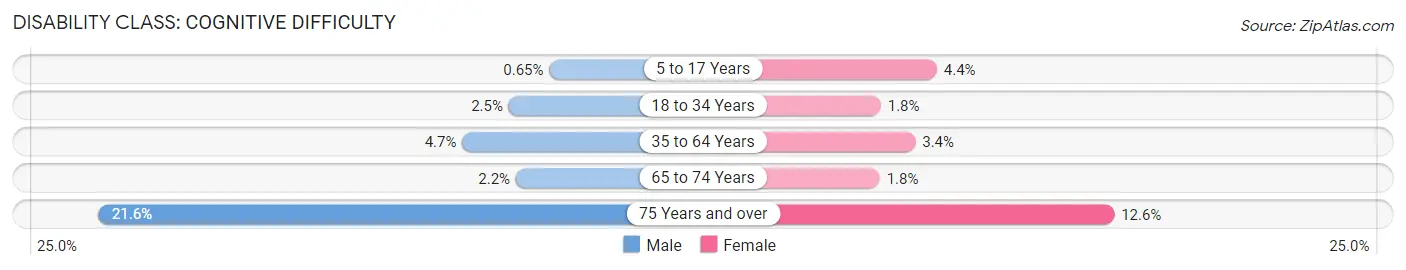
| Age Bracket | Male | Female |
| 5 to 17 Years | 7 (0.6%) | 60 (4.4%) |
| 18 to 34 Years | 75 (2.5%) | 68 (1.8%) |
| 35 to 64 Years | 236 (4.7%) | 168 (3.4%) |
| 65 to 74 Years | 26 (2.2%) | 26 (1.8%) |
| 75 Years and over | 195 (21.5%) | 216 (12.6%) |
Disability Class: Ambulatory Difficulty
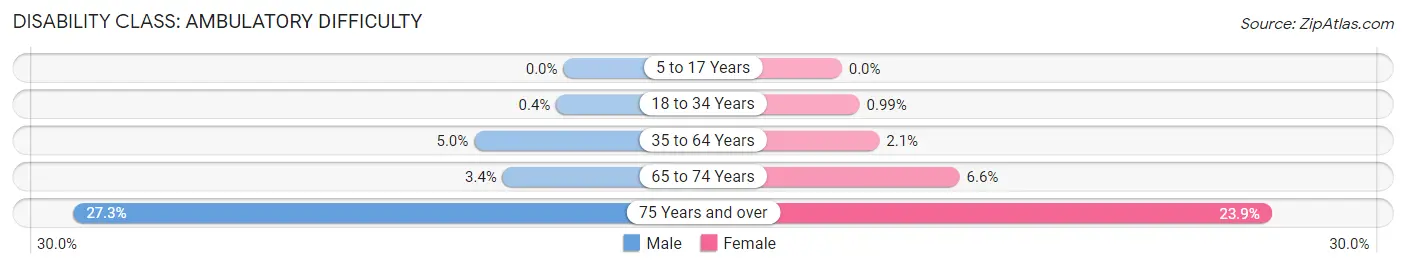
| Age Bracket | Male | Female |
| 5 to 17 Years | 0 (0.0%) | 0 (0.0%) |
| 18 to 34 Years | 12 (0.4%) | 37 (1.0%) |
| 35 to 64 Years | 250 (5.0%) | 103 (2.1%) |
| 65 to 74 Years | 40 (3.4%) | 97 (6.6%) |
| 75 Years and over | 247 (27.3%) | 409 (23.9%) |
Disability Class: Self-Care Difficulty
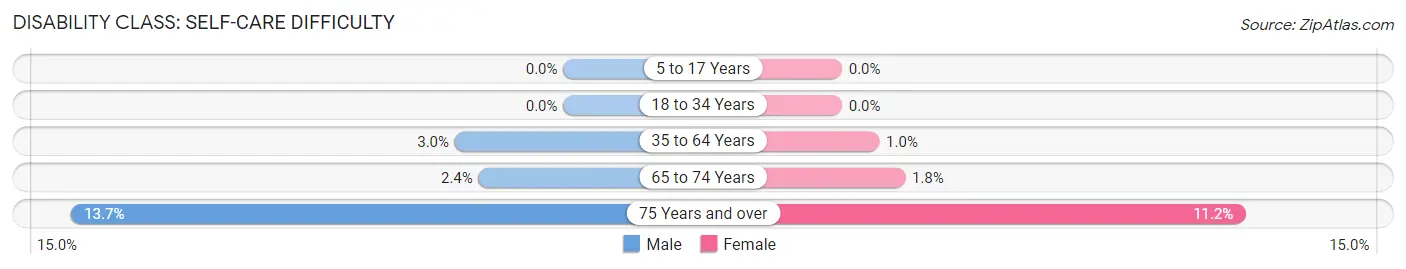
| Age Bracket | Male | Female |
| 5 to 17 Years | 0 (0.0%) | 0 (0.0%) |
| 18 to 34 Years | 0 (0.0%) | 0 (0.0%) |
| 35 to 64 Years | 152 (3.0%) | 51 (1.0%) |
| 65 to 74 Years | 28 (2.4%) | 26 (1.8%) |
| 75 Years and over | 124 (13.7%) | 192 (11.2%) |
Technology Access in Monterey
Computing Device Access in Monterey
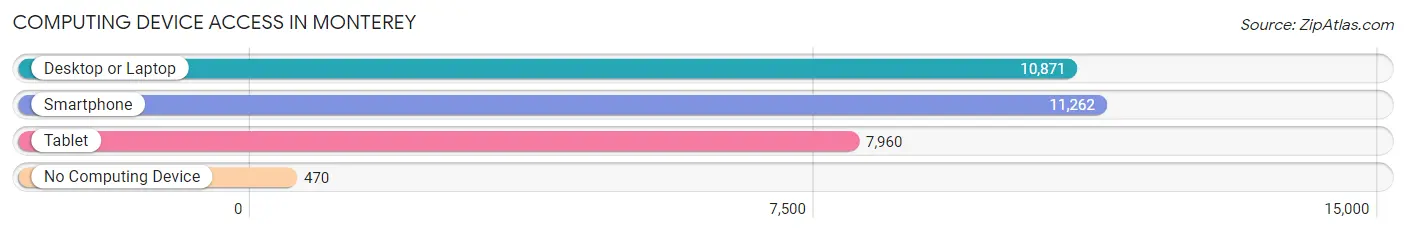
| Device Type | # Households | % Households |
| Desktop or Laptop | 10,871 | 86.4% |
| Smartphone | 11,262 | 89.5% |
| Tablet | 7,960 | 63.2% |
| No Computing Device | 470 | 3.7% |
| Total | 12,586 | 100.0% |
Internet Access in Monterey
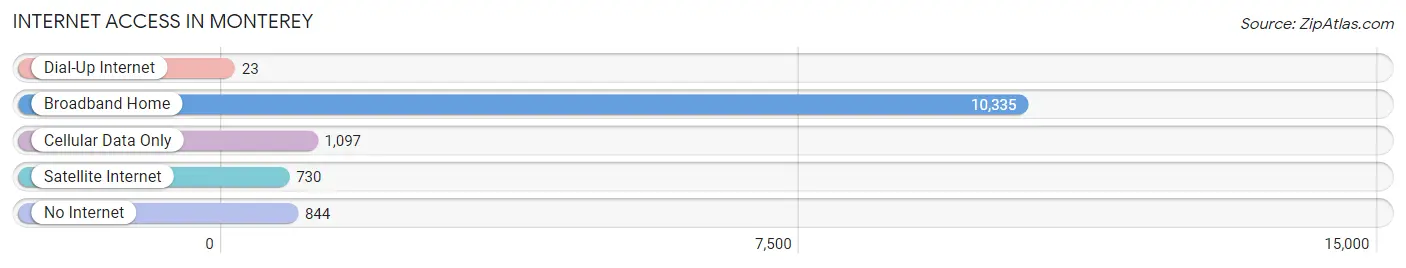
| Internet Type | # Households | % Households |
| Dial-Up Internet | 23 | 0.2% |
| Broadband Home | 10,335 | 82.1% |
| Cellular Data Only | 1,097 | 8.7% |
| Satellite Internet | 730 | 5.8% |
| No Internet | 844 | 6.7% |
| Total | 12,586 | 100.0% |
Monterey Summary
Monterey, California is a city located on the central coast of California, about 120 miles south of San Francisco. It is the county seat of Monterey County and is known for its stunning natural beauty, rich history, and vibrant culture.
History
The area that is now Monterey was first inhabited by the Rumsen Ohlone people, who lived in the area for thousands of years before the arrival of Europeans. The first Europeans to explore the area were Spanish explorers, who arrived in the late 1700s. The Spanish established a mission in Monterey in 1770, and the city was officially founded in 1776.
Monterey was the capital of Alta California, a province of Mexico, from 1822 to 1846. During this time, the city was a major port and trading center. After the Mexican-American War, Monterey became part of the United States and the capital of California.
In the late 1800s, Monterey became a popular tourist destination, and the city’s economy shifted to focus on tourism. The city was also home to a thriving fishing industry, which continues to this day.
Geography
Monterey is located on the central coast of California, about 120 miles south of San Francisco. The city is situated on a peninsula, surrounded by the Pacific Ocean to the west and Monterey Bay to the east.
The city has a mild, Mediterranean climate, with warm summers and mild winters. The average annual temperature is around 60 degrees Fahrenheit.
Economy
Monterey’s economy is largely based on tourism, with the city’s stunning natural beauty and rich history attracting visitors from around the world. The city is also home to a thriving fishing industry, with the Monterey Bay National Marine Sanctuary providing a rich source of seafood.
The city is also home to a number of technology companies, including the defense contractor Lockheed Martin. The city is also home to a number of educational institutions, including the Naval Postgraduate School and California State University, Monterey Bay.
Demographics
As of the 2010 census, the population of Monterey was 27,810. The city is predominantly white (71.2%), with significant Hispanic (19.2%) and Asian (5.2%) populations. The median household income is $60,845, and the median home value is $541,400.
Monterey is a diverse and vibrant city, with a rich history and stunning natural beauty. The city’s economy is largely based on tourism, with a thriving fishing industry and a number of technology companies providing additional economic opportunities. The city is home to a diverse population, with a median household income of $60,845 and a median home value of $541,400.
Common Questions
What is Per Capita Income in Monterey?
Per Capita income in Monterey is $57,335.
What is the Median Family Income in Monterey?
Median Family Income in Monterey is $133,333.
What is the Median Household income in Monterey?
Median Household Income in Monterey is $98,003.
What is Income or Wage Gap in Monterey?
Income or Wage Gap in Monterey is 11.2%.
Women in Monterey earn 88.8 cents for every dollar earned by a man.
What is Inequality or Gini Index in Monterey?
Inequality or Gini Index in Monterey is 0.44.
What is the Total Population of Monterey?
Total Population of Monterey is 30,007.
What is the Total Male Population of Monterey?
Total Male Population of Monterey is 15,164.
What is the Total Female Population of Monterey?
Total Female Population of Monterey is 14,843.
What is the Ratio of Males per 100 Females in Monterey?
There are 102.16 Males per 100 Females in Monterey.
What is the Ratio of Females per 100 Males in Monterey?
There are 97.88 Females per 100 Males in Monterey.
What is the Median Population Age in Monterey?
Median Population Age in Monterey is 36.8 Years.
What is the Average Family Size in Monterey
Average Family Size in Monterey is 2.9 People.
What is the Average Household Size in Monterey
Average Household Size in Monterey is 2.1 People.
How Large is the Labor Force in Monterey?
There are 18,630 People in the Labor Forcein in Monterey.
What is the Percentage of People in the Labor Force in Monterey?
70.7% of People are in the Labor Force in Monterey.
What is the Unemployment Rate in Monterey?
Unemployment Rate in Monterey is 4.9%.