Clayton, CA Map & Demographics
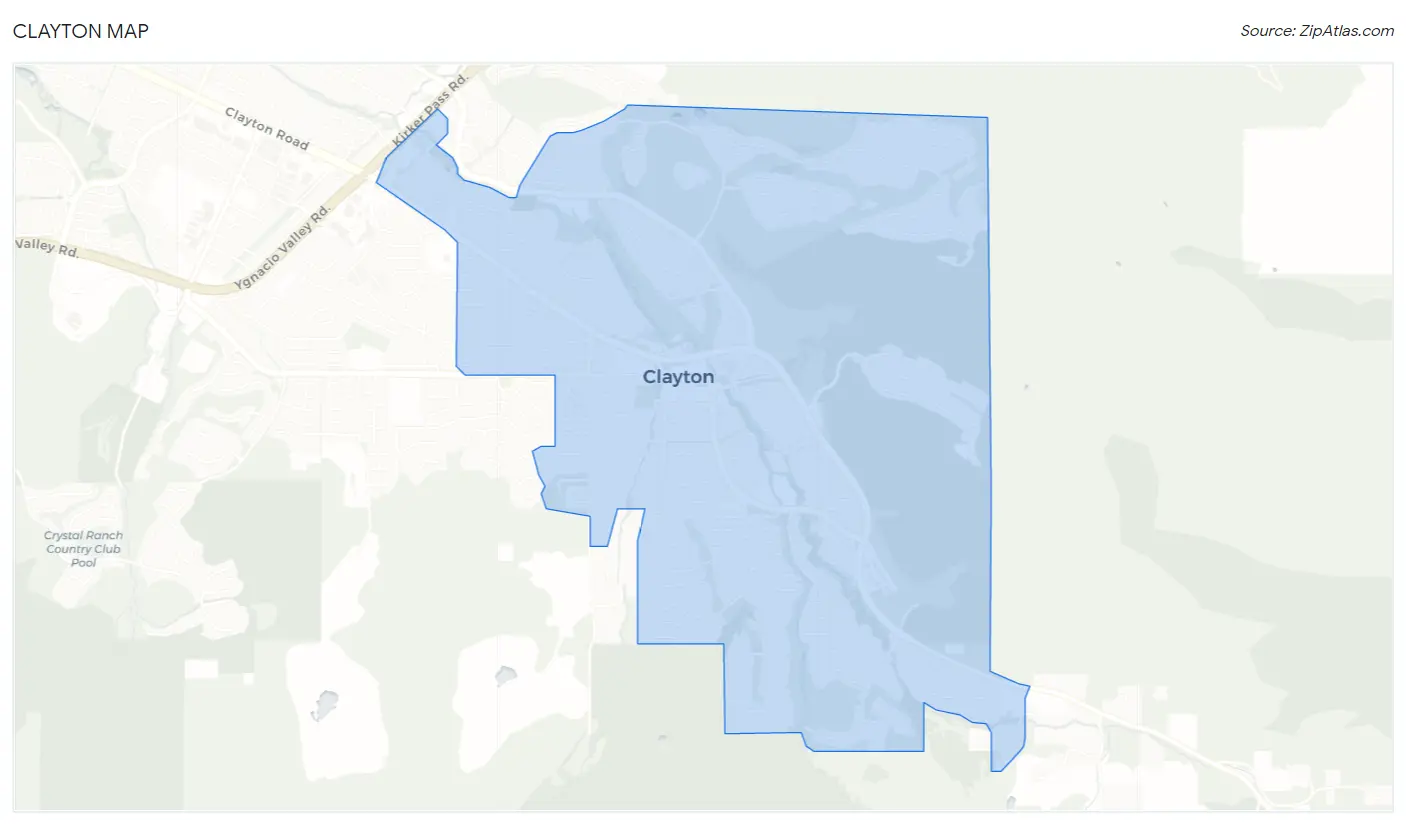
Clayton Map
Clayton Overview
$75,862
PER CAPITA INCOME
$184,693
AVG FAMILY INCOME
$164,899
AVG HOUSEHOLD INCOME
50.7%
WAGE / INCOME GAP [ % ]
49.3¢/ $1
WAGE / INCOME GAP [ $ ]
0.43
INEQUALITY / GINI INDEX
11,070
TOTAL POPULATION
5,465
MALE POPULATION
5,605
FEMALE POPULATION
97.50
MALES / 100 FEMALES
102.56
FEMALES / 100 MALES
44.4
MEDIAN AGE
3.2
AVG FAMILY SIZE
2.8
AVG HOUSEHOLD SIZE
5,418
LABOR FORCE [ PEOPLE ]
62.2%
PERCENT IN LABOR FORCE
5.4%
UNEMPLOYMENT RATE
Clayton Zip Codes
Clayton Area Codes
Income in Clayton
Income Overview in Clayton
Per Capita Income in Clayton is $75,862, while median incomes of families and households are $184,693 and $164,899 respectively.
| Characteristic | Number | Measure |
| Per Capita Income | 11,070 | $75,862 |
| Median Family Income | 3,157 | $184,693 |
| Mean Family Income | 3,157 | $232,673 |
| Median Household Income | 3,993 | $164,899 |
| Mean Household Income | 3,993 | $209,964 |
| Income Deficit | 3,157 | $0 |
| Wage / Income Gap (%) | 11,070 | 50.67% |
| Wage / Income Gap ($) | 11,070 | 49.33¢ per $1 |
| Gini / Inequality Index | 11,070 | 0.43 |
Earnings by Sex in Clayton
Average Earnings in Clayton are $81,888, $109,231 for men and $53,882 for women, a difference of 50.7%.
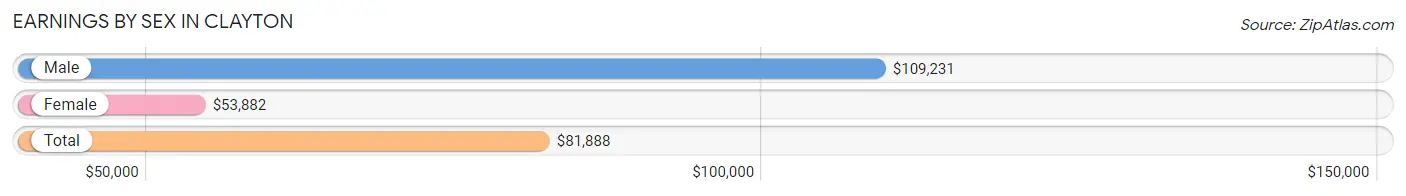
| Sex | Number | Average Earnings |
| Male | 3,136 (55.1%) | $109,231 |
| Female | 2,559 (44.9%) | $53,882 |
| Total | 5,695 (100.0%) | $81,888 |
Earnings by Sex by Income Bracket in Clayton
The most common earnings brackets in Clayton are $100,000+ for men (1,640 | 52.3%) and $100,000+ for women (757 | 29.6%).
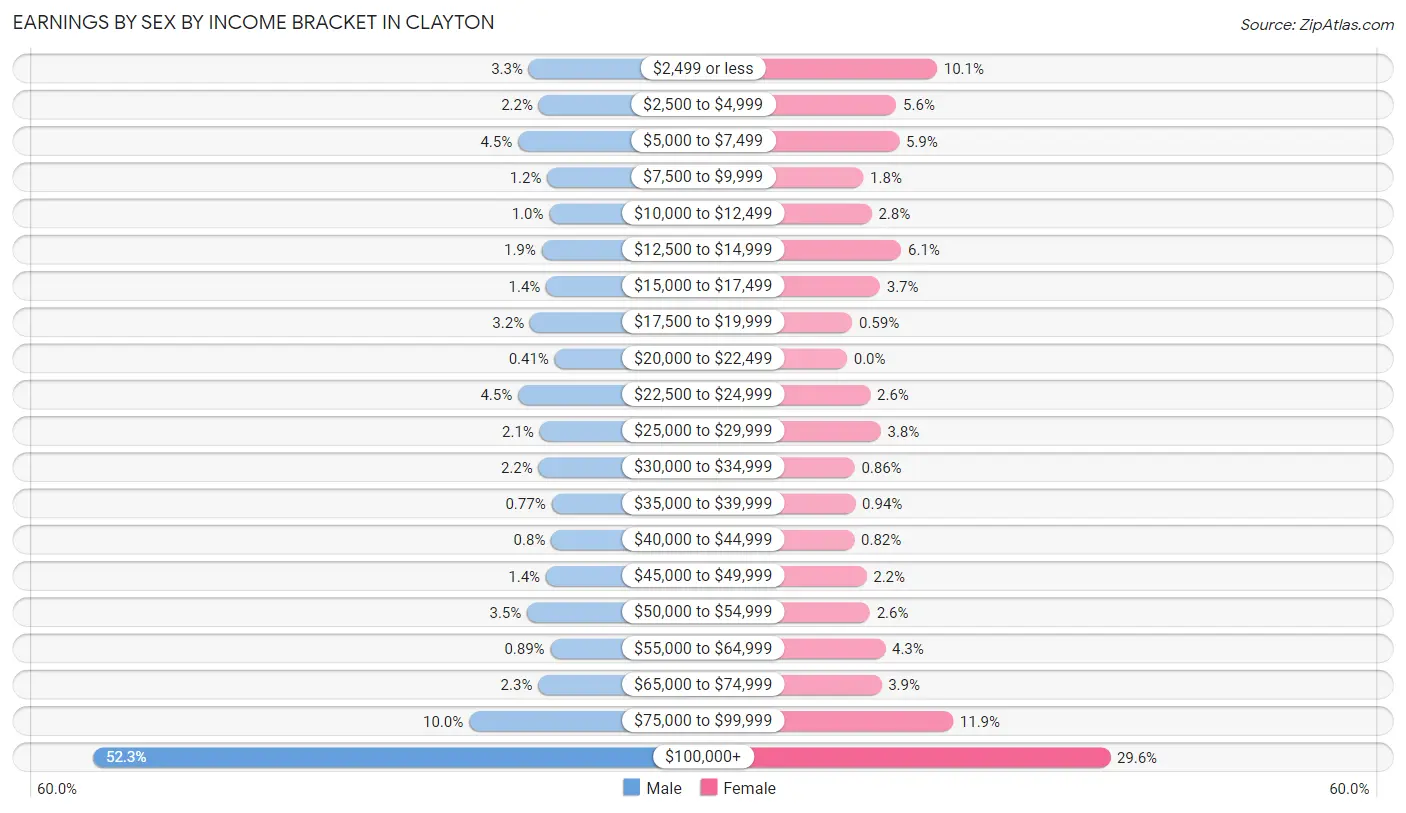
| Income | Male | Female |
| $2,499 or less | 104 (3.3%) | 259 (10.1%) |
| $2,500 to $4,999 | 69 (2.2%) | 142 (5.6%) |
| $5,000 to $7,499 | 142 (4.5%) | 150 (5.9%) |
| $7,500 to $9,999 | 39 (1.2%) | 47 (1.8%) |
| $10,000 to $12,499 | 32 (1.0%) | 71 (2.8%) |
| $12,500 to $14,999 | 59 (1.9%) | 156 (6.1%) |
| $15,000 to $17,499 | 43 (1.4%) | 95 (3.7%) |
| $17,500 to $19,999 | 100 (3.2%) | 15 (0.6%) |
| $20,000 to $22,499 | 13 (0.4%) | 0 (0.0%) |
| $22,500 to $24,999 | 142 (4.5%) | 67 (2.6%) |
| $25,000 to $29,999 | 66 (2.1%) | 97 (3.8%) |
| $30,000 to $34,999 | 70 (2.2%) | 22 (0.9%) |
| $35,000 to $39,999 | 24 (0.8%) | 24 (0.9%) |
| $40,000 to $44,999 | 25 (0.8%) | 21 (0.8%) |
| $45,000 to $49,999 | 44 (1.4%) | 56 (2.2%) |
| $50,000 to $54,999 | 110 (3.5%) | 66 (2.6%) |
| $55,000 to $64,999 | 28 (0.9%) | 110 (4.3%) |
| $65,000 to $74,999 | 71 (2.3%) | 99 (3.9%) |
| $75,000 to $99,999 | 315 (10.0%) | 305 (11.9%) |
| $100,000+ | 1,640 (52.3%) | 757 (29.6%) |
| Total | 3,136 (100.0%) | 2,559 (100.0%) |
Earnings by Sex by Educational Attainment in Clayton
Average earnings in Clayton are $135,168 for men and $73,929 for women, a difference of 45.3%. Men with an educational attainment of graduate degree enjoy the highest average annual earnings of $212,292, while those with high school diploma education earn the least with $88,021. Women with an educational attainment of graduate degree earn the most with the average annual earnings of $95,179, while those with college or associate's degree education have the smallest earnings of $34,554.
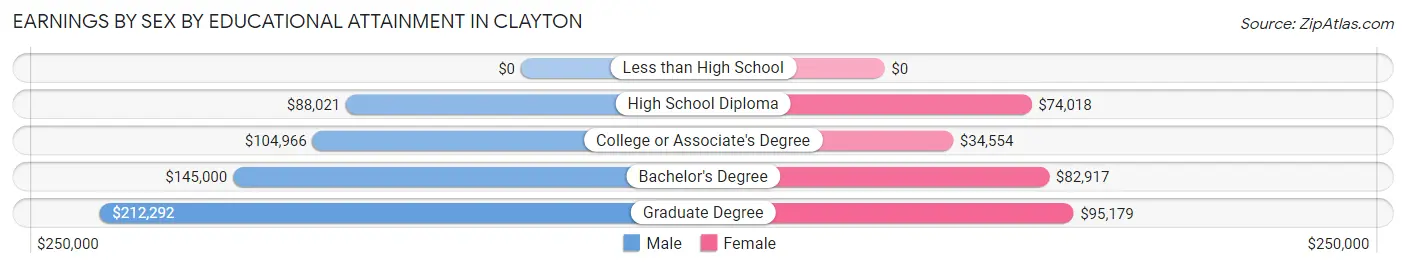
| Educational Attainment | Male Income | Female Income |
| Less than High School | - | - |
| High School Diploma | $88,021 | $74,018 |
| College or Associate's Degree | $104,966 | $34,554 |
| Bachelor's Degree | $145,000 | $82,917 |
| Graduate Degree | $212,292 | $95,179 |
| Total | $135,168 | $73,929 |
Family Income in Clayton
Family Income Brackets in Clayton
According to the Clayton family income data, there are 1,386 families falling into the $200,000+ income range, which is the most common income bracket and makes up 43.9% of all families. Conversely, the $10,000 to $14,999 income bracket is the least frequent group with only 6 families (0.2%) belonging to this category.
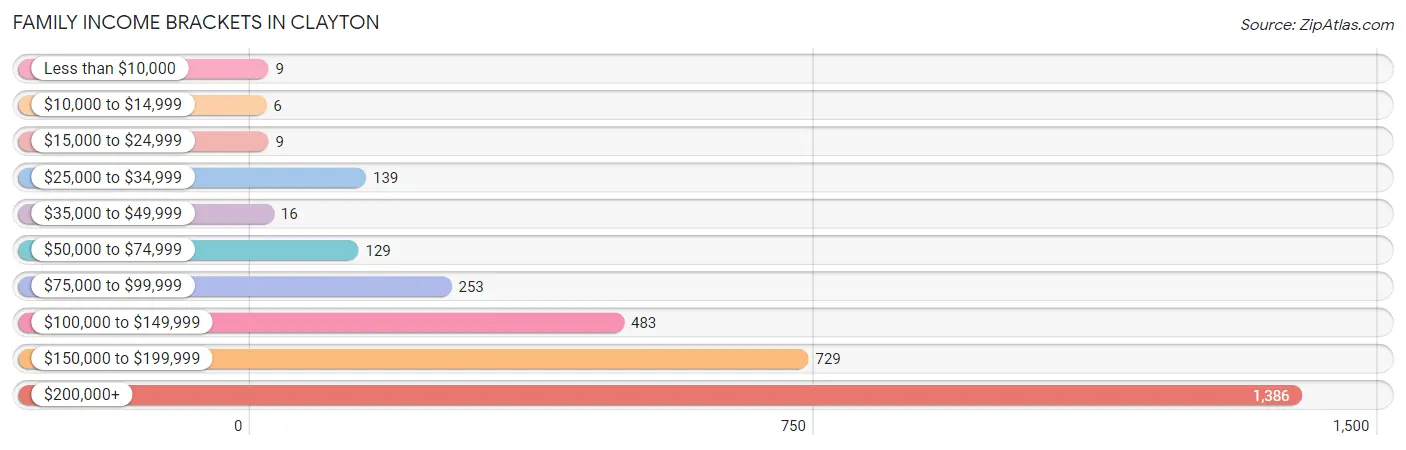
| Income Bracket | # Families | % Families |
| Less than $10,000 | 9 | 0.3% |
| $10,000 to $14,999 | 6 | 0.2% |
| $15,000 to $24,999 | 9 | 0.3% |
| $25,000 to $34,999 | 139 | 4.4% |
| $35,000 to $49,999 | 16 | 0.5% |
| $50,000 to $74,999 | 129 | 4.1% |
| $75,000 to $99,999 | 253 | 8.0% |
| $100,000 to $149,999 | 483 | 15.3% |
| $150,000 to $199,999 | 729 | 23.1% |
| $200,000+ | 1,386 | 43.9% |
Family Income by Famaliy Size in Clayton
5-person families (249 | 7.9%) account for the highest median family income in Clayton with $250,001 per family, while 2-person families (1,260 | 39.9%) have the highest median income of $75,446 per family member.
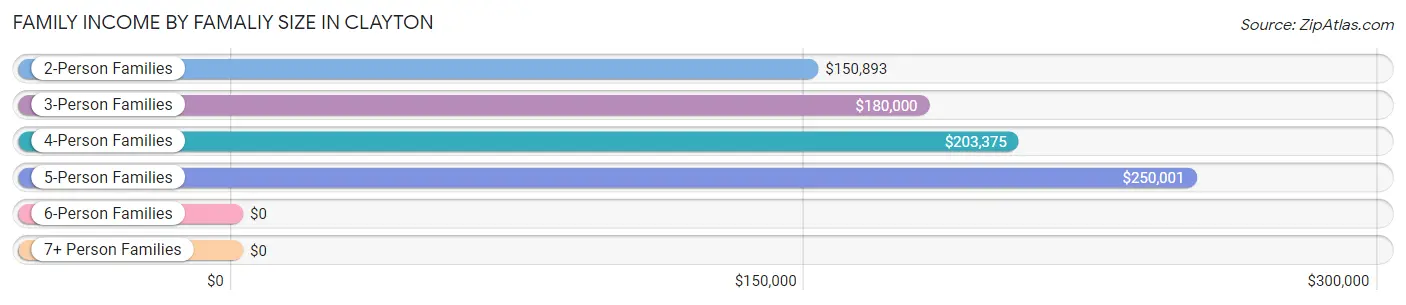
| Income Bracket | # Families | Median Income |
| 2-Person Families | 1,260 (39.9%) | $150,893 |
| 3-Person Families | 760 (24.1%) | $180,000 |
| 4-Person Families | 769 (24.4%) | $203,375 |
| 5-Person Families | 249 (7.9%) | $250,001 |
| 6-Person Families | 80 (2.5%) | $0 |
| 7+ Person Families | 39 (1.2%) | $0 |
| Total | 3,157 (100.0%) | $184,693 |
Family Income by Number of Earners in Clayton
The median family income in Clayton is $184,693, with families comprising 3+ earners (525) having the highest median family income of $250,001, while families with no earners (466) have the lowest median family income of $103,696, accounting for 16.6% and 14.8% of families, respectively.
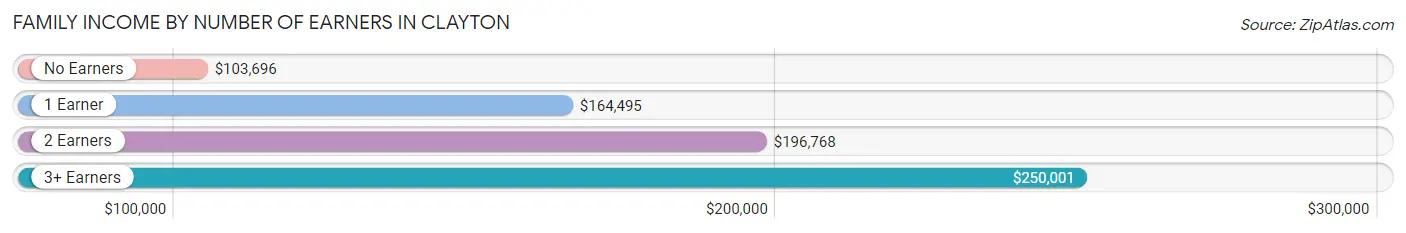
| Number of Earners | # Families | Median Income |
| No Earners | 466 (14.8%) | $103,696 |
| 1 Earner | 956 (30.3%) | $164,495 |
| 2 Earners | 1,210 (38.3%) | $196,768 |
| 3+ Earners | 525 (16.6%) | $250,001 |
| Total | 3,157 (100.0%) | $184,693 |
Household Income in Clayton
Household Income Brackets in Clayton
With 1,453 households falling in the category, the $200,000+ income range is the most frequent in Clayton, accounting for 36.4% of all households. In contrast, only 20 households (0.5%) fall into the $10,000 to $14,999 income bracket, making it the least populous group.
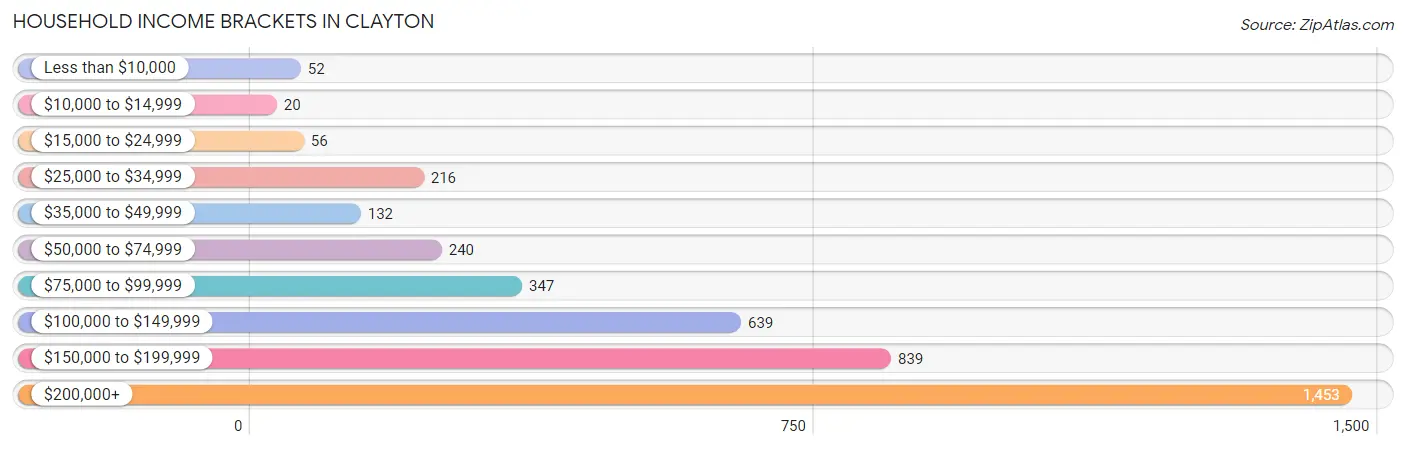
| Income Bracket | # Households | % Households |
| Less than $10,000 | 52 | 1.3% |
| $10,000 to $14,999 | 20 | 0.5% |
| $15,000 to $24,999 | 56 | 1.4% |
| $25,000 to $34,999 | 216 | 5.4% |
| $35,000 to $49,999 | 132 | 3.3% |
| $50,000 to $74,999 | 240 | 6.0% |
| $75,000 to $99,999 | 347 | 8.7% |
| $100,000 to $149,999 | 639 | 16.0% |
| $150,000 to $199,999 | 839 | 21.0% |
| $200,000+ | 1,453 | 36.4% |
Household Income by Householder Age in Clayton
The median household income in Clayton is $164,899, with the highest median household income of $221,667 found in the 25 to 44 years age bracket for the primary householder. A total of 788 households (19.7%) fall into this category.
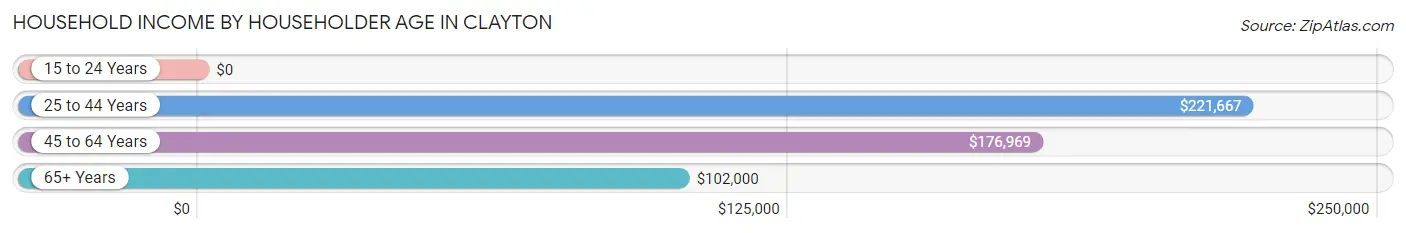
| Income Bracket | # Households | Median Income |
| 15 to 24 Years | 0 (0.0%) | $0 |
| 25 to 44 Years | 788 (19.7%) | $221,667 |
| 45 to 64 Years | 2,003 (50.2%) | $176,969 |
| 65+ Years | 1,202 (30.1%) | $102,000 |
| Total | 3,993 (100.0%) | $164,899 |
Poverty in Clayton
Income Below Poverty by Sex and Age in Clayton
With 0.9% poverty level for males and 2.5% for females among the residents of Clayton, 65 to 74 year old males and 65 to 74 year old females are the most vulnerable to poverty, with 25 males (5.7%) and 34 females (5.5%) in their respective age groups living below the poverty level.
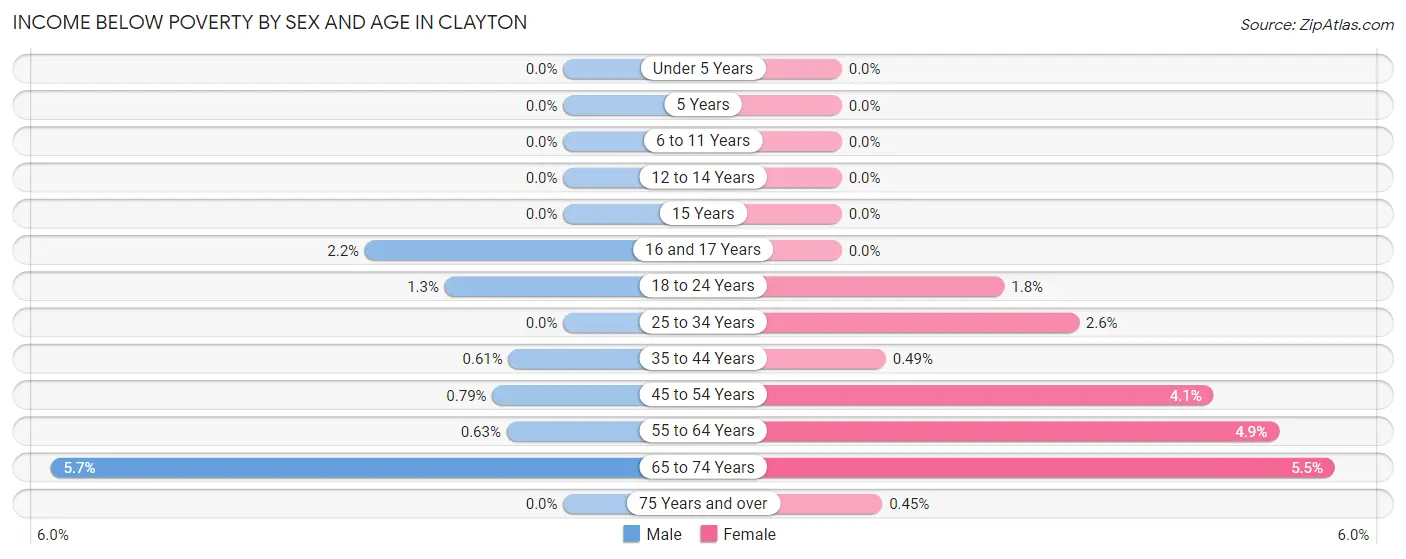
| Age Bracket | Male | Female |
| Under 5 Years | 0 (0.0%) | 0 (0.0%) |
| 5 Years | 0 (0.0%) | 0 (0.0%) |
| 6 to 11 Years | 0 (0.0%) | 0 (0.0%) |
| 12 to 14 Years | 0 (0.0%) | 0 (0.0%) |
| 15 Years | 0 (0.0%) | 0 (0.0%) |
| 16 and 17 Years | 3 (2.2%) | 0 (0.0%) |
| 18 to 24 Years | 6 (1.3%) | 11 (1.8%) |
| 25 to 34 Years | 0 (0.0%) | 8 (2.6%) |
| 35 to 44 Years | 4 (0.6%) | 3 (0.5%) |
| 45 to 54 Years | 6 (0.8%) | 33 (4.1%) |
| 55 to 64 Years | 6 (0.6%) | 50 (4.9%) |
| 65 to 74 Years | 25 (5.7%) | 34 (5.5%) |
| 75 Years and over | 0 (0.0%) | 2 (0.4%) |
| Total | 50 (0.9%) | 141 (2.5%) |
Income Above Poverty by Sex and Age in Clayton
According to the poverty statistics in Clayton, males aged under 5 years and females aged under 5 years are the age groups that are most secure financially, with 100.0% of males and 100.0% of females in these age groups living above the poverty line.
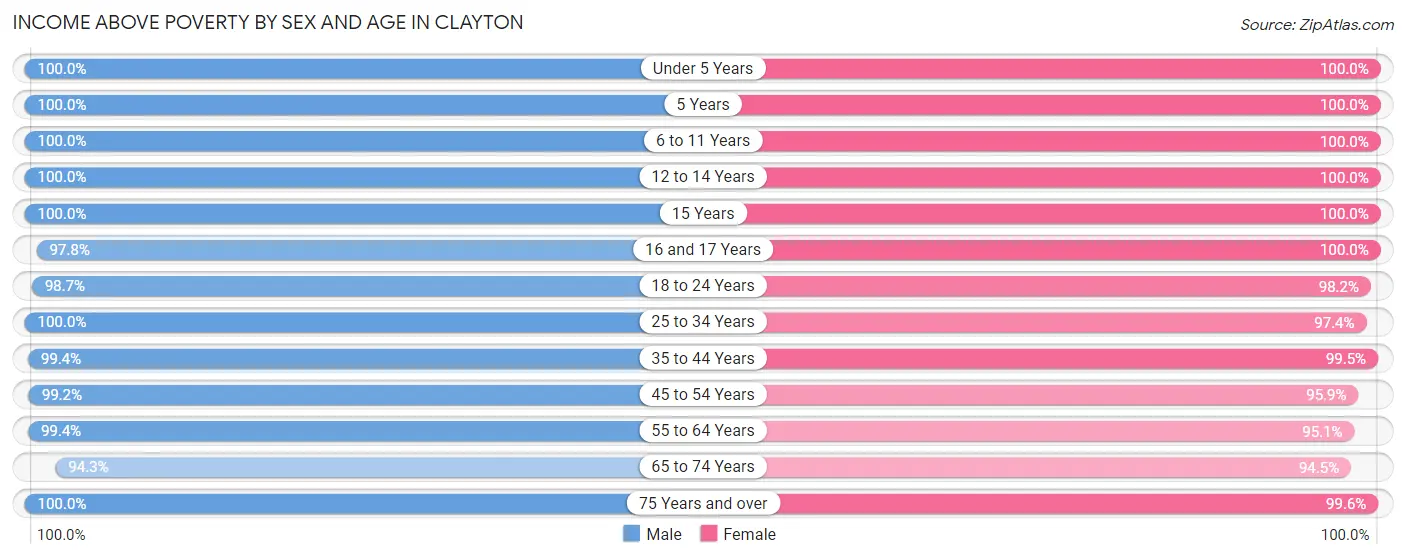
| Age Bracket | Male | Female |
| Under 5 Years | 197 (100.0%) | 173 (100.0%) |
| 5 Years | 85 (100.0%) | 64 (100.0%) |
| 6 to 11 Years | 431 (100.0%) | 337 (100.0%) |
| 12 to 14 Years | 349 (100.0%) | 257 (100.0%) |
| 15 Years | 154 (100.0%) | 260 (100.0%) |
| 16 and 17 Years | 133 (97.8%) | 106 (100.0%) |
| 18 to 24 Years | 450 (98.7%) | 597 (98.2%) |
| 25 to 34 Years | 441 (100.0%) | 295 (97.4%) |
| 35 to 44 Years | 649 (99.4%) | 607 (99.5%) |
| 45 to 54 Years | 750 (99.2%) | 765 (95.9%) |
| 55 to 64 Years | 949 (99.4%) | 977 (95.1%) |
| 65 to 74 Years | 413 (94.3%) | 585 (94.5%) |
| 75 Years and over | 362 (100.0%) | 441 (99.6%) |
| Total | 5,363 (99.1%) | 5,464 (97.5%) |
Income Below Poverty Among Married-Couple Families in Clayton
The poverty statistics for married-couple families in Clayton show that 0.8% or 21 of the total 2,576 families live below the poverty line. Families with no children have the highest poverty rate of 1.4%, comprising of 21 families. On the other hand, families with 1 or 2 children have the lowest poverty rate of 0.0%, which includes 0 families.
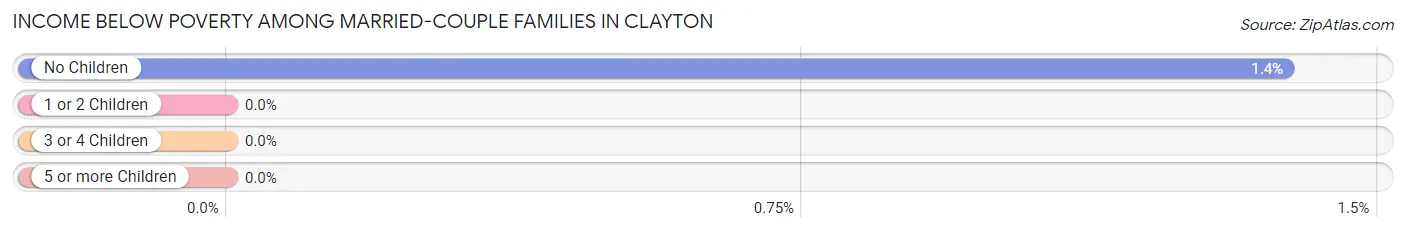
| Children | Above Poverty | Below Poverty |
| No Children | 1,497 (98.6%) | 21 (1.4%) |
| 1 or 2 Children | 800 (100.0%) | 0 (0.0%) |
| 3 or 4 Children | 258 (100.0%) | 0 (0.0%) |
| 5 or more Children | 0 (0.0%) | 0 (0.0%) |
| Total | 2,555 (99.2%) | 21 (0.8%) |
Income Below Poverty Among Single-Parent Households in Clayton
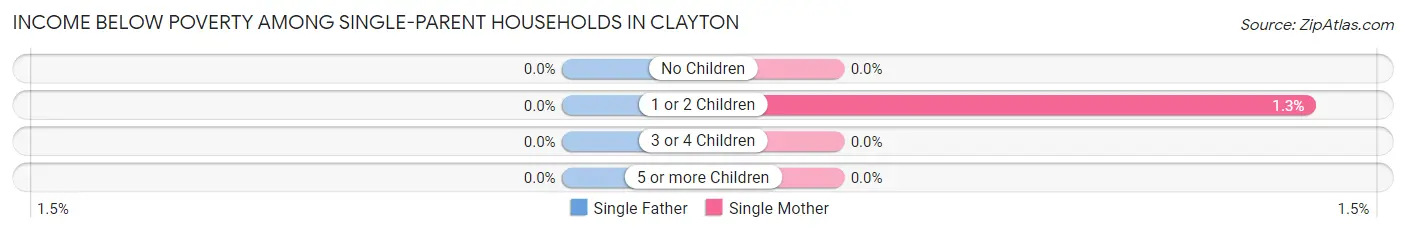
| Children | Single Father | Single Mother |
| No Children | 0 (0.0%) | 0 (0.0%) |
| 1 or 2 Children | 0 (0.0%) | 3 (1.3%) |
| 3 or 4 Children | 0 (0.0%) | 0 (0.0%) |
| 5 or more Children | 0 (0.0%) | 0 (0.0%) |
| Total | 0 (0.0%) | 3 (0.7%) |
Income Below Poverty Among Married-Couple vs Single-Parent Households in Clayton
The poverty data for Clayton shows that 21 of the married-couple family households (0.8%) and 3 of the single-parent households (0.5%) are living below the poverty level. Within the married-couple family households, those with no children have the highest poverty rate, with 21 households (1.4%) falling below the poverty line. Among the single-parent households, those with 1 or 2 children have the highest poverty rate, with 3 household (1.1%) living below poverty.
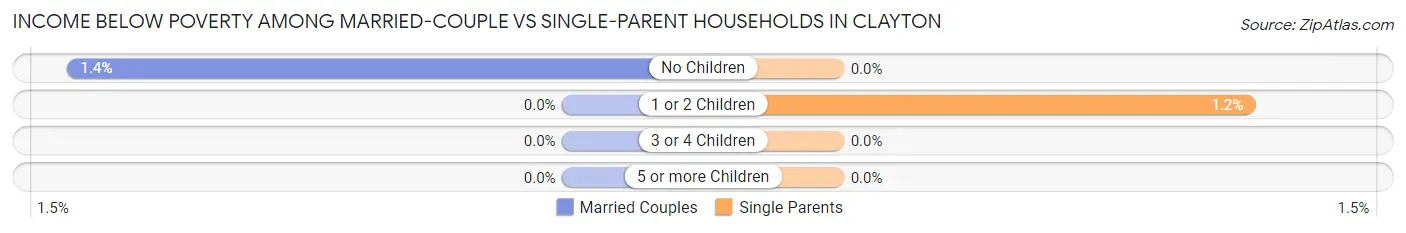
| Children | Married-Couple Families | Single-Parent Households |
| No Children | 21 (1.4%) | 0 (0.0%) |
| 1 or 2 Children | 0 (0.0%) | 3 (1.1%) |
| 3 or 4 Children | 0 (0.0%) | 0 (0.0%) |
| 5 or more Children | 0 (0.0%) | 0 (0.0%) |
| Total | 21 (0.8%) | 3 (0.5%) |
Race in Clayton
The most populous races in Clayton are White / Caucasian (8,049 | 72.7%), Asian (1,297 | 11.7%), and Two or more Races (1,278 | 11.5%).
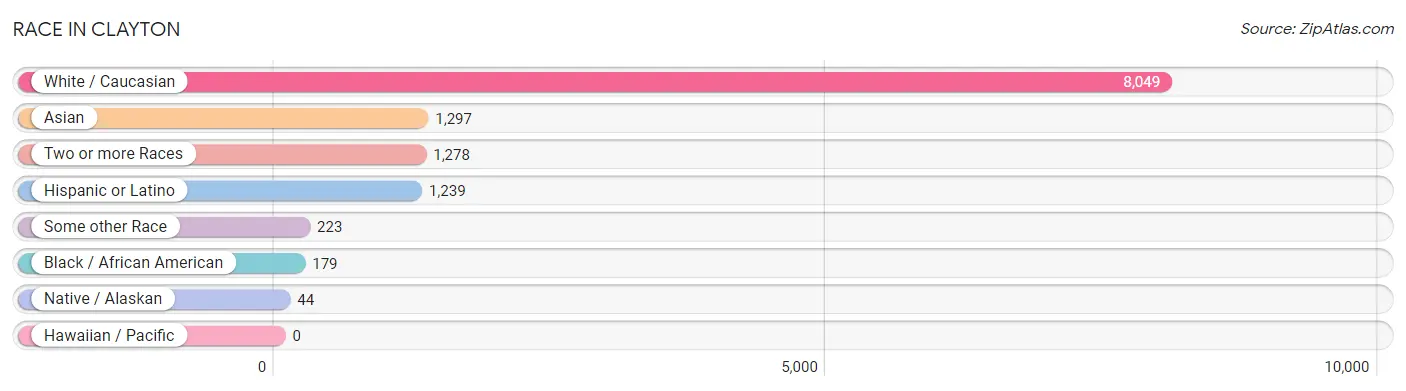
| Race | # Population | % Population |
| Asian | 1,297 | 11.7% |
| Black / African American | 179 | 1.6% |
| Hawaiian / Pacific | 0 | 0.0% |
| Hispanic or Latino | 1,239 | 11.2% |
| Native / Alaskan | 44 | 0.4% |
| White / Caucasian | 8,049 | 72.7% |
| Two or more Races | 1,278 | 11.5% |
| Some other Race | 223 | 2.0% |
| Total | 11,070 | 100.0% |
Ancestry in Clayton
The most populous ancestries reported in Clayton are English (2,088 | 18.9%), Irish (1,680 | 15.2%), German (1,505 | 13.6%), Korean (815 | 7.4%), and Italian (735 | 6.6%), together accounting for 61.6% of all Clayton residents.
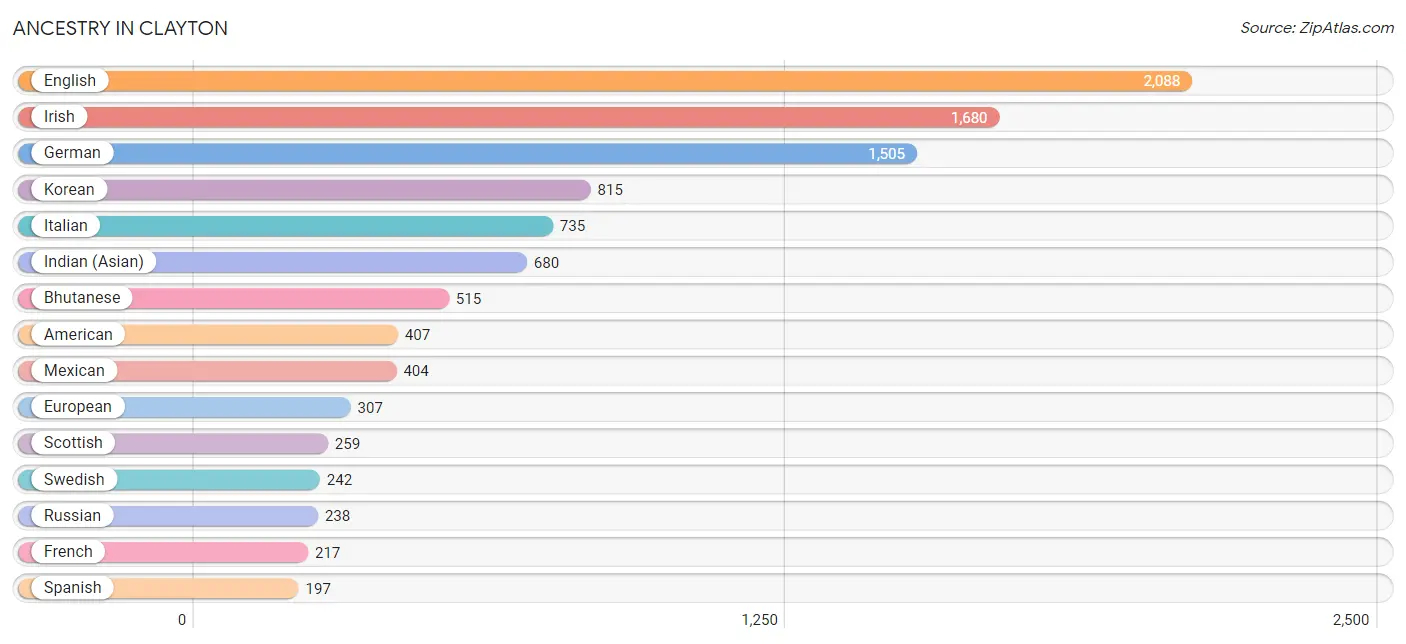
| Ancestry | # Population | % Population |
| Afghan | 29 | 0.3% |
| African | 2 | 0.0% |
| American | 407 | 3.7% |
| Apache | 47 | 0.4% |
| Arab | 31 | 0.3% |
| Argentinean | 8 | 0.1% |
| Armenian | 25 | 0.2% |
| Australian | 45 | 0.4% |
| Austrian | 106 | 1.0% |
| Basque | 33 | 0.3% |
| Bhutanese | 515 | 4.6% |
| Blackfeet | 7 | 0.1% |
| British | 147 | 1.3% |
| Burmese | 86 | 0.8% |
| Central American | 81 | 0.7% |
| Cherokee | 8 | 0.1% |
| Choctaw | 35 | 0.3% |
| Creek | 83 | 0.7% |
| Croatian | 9 | 0.1% |
| Czech | 10 | 0.1% |
| Danish | 72 | 0.6% |
| Dutch | 138 | 1.3% |
| Eastern European | 58 | 0.5% |
| Egyptian | 10 | 0.1% |
| English | 2,088 | 18.9% |
| European | 307 | 2.8% |
| Finnish | 24 | 0.2% |
| French | 217 | 2.0% |
| French Canadian | 79 | 0.7% |
| German | 1,505 | 13.6% |
| Greek | 22 | 0.2% |
| Hungarian | 128 | 1.2% |
| Icelander | 8 | 0.1% |
| Indian (Asian) | 680 | 6.1% |
| Indonesian | 33 | 0.3% |
| Iranian | 18 | 0.2% |
| Irish | 1,680 | 15.2% |
| Israeli | 23 | 0.2% |
| Italian | 735 | 6.6% |
| Jordanian | 7 | 0.1% |
| Korean | 815 | 7.4% |
| Latvian | 35 | 0.3% |
| Mexican | 404 | 3.6% |
| Native Hawaiian | 122 | 1.1% |
| Nicaraguan | 66 | 0.6% |
| Nigerian | 128 | 1.2% |
| Northern European | 146 | 1.3% |
| Norwegian | 94 | 0.9% |
| Okinawan | 44 | 0.4% |
| Peruvian | 56 | 0.5% |
| Polish | 167 | 1.5% |
| Portuguese | 120 | 1.1% |
| Puerto Rican | 170 | 1.5% |
| Romanian | 38 | 0.3% |
| Russian | 238 | 2.1% |
| Salvadoran | 15 | 0.1% |
| Scandinavian | 88 | 0.8% |
| Scotch-Irish | 107 | 1.0% |
| Scottish | 259 | 2.3% |
| Serbian | 7 | 0.1% |
| Slavic | 99 | 0.9% |
| Slovak | 14 | 0.1% |
| South American | 64 | 0.6% |
| Spaniard | 176 | 1.6% |
| Spanish | 197 | 1.8% |
| Subsaharan African | 130 | 1.2% |
| Swedish | 242 | 2.2% |
| Swiss | 70 | 0.6% |
| Thai | 181 | 1.6% |
| Turkish | 49 | 0.4% |
| Ukrainian | 115 | 1.0% |
| Welsh | 98 | 0.9% | View All 72 Rows |
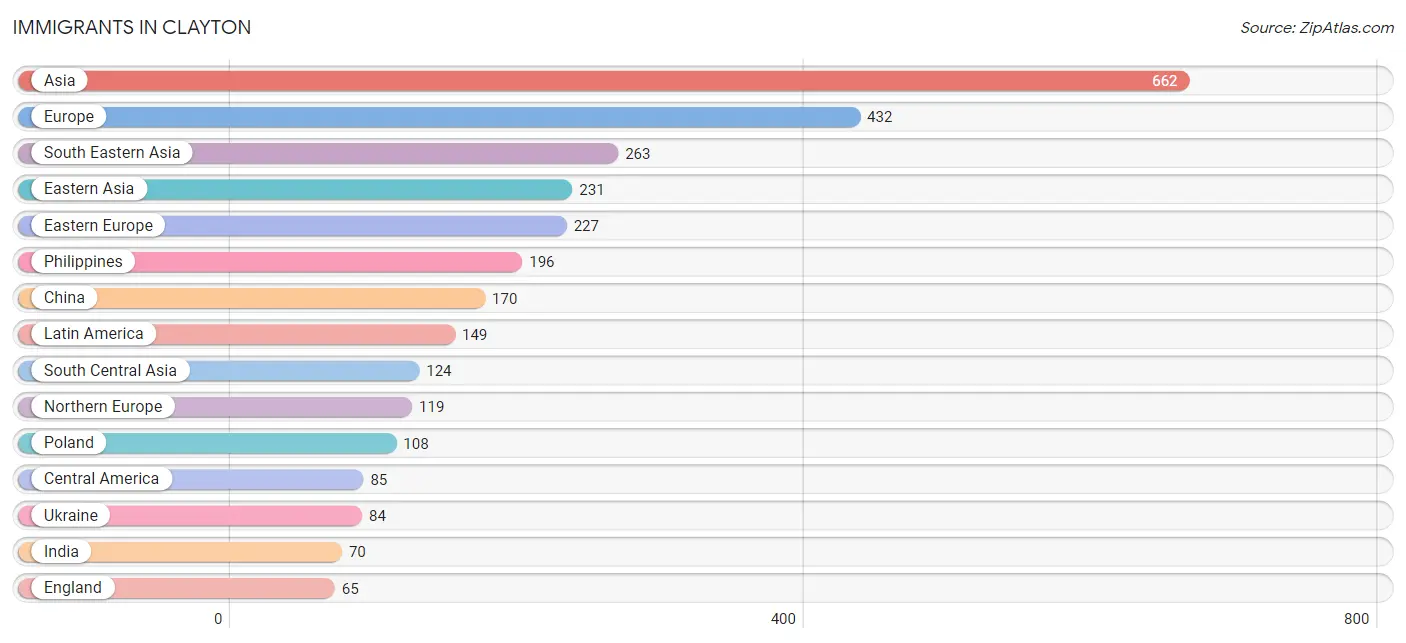
Immigrants in Clayton
The most numerous immigrant groups reported in Clayton came from Asia (662 | 6.0%), Europe (432 | 3.9%), South Eastern Asia (263 | 2.4%), Eastern Asia (231 | 2.1%), and Eastern Europe (227 | 2.1%), together accounting for 16.4% of all Clayton residents.
| Immigration Origin | # Population | % Population |
| Afghanistan | 18 | 0.2% |
| Africa | 56 | 0.5% |
| Argentina | 8 | 0.1% |
| Asia | 662 | 6.0% |
| Australia | 19 | 0.2% |
| Canada | 18 | 0.2% |
| Central America | 85 | 0.8% |
| China | 170 | 1.5% |
| Eastern Asia | 231 | 2.1% |
| Eastern Europe | 227 | 2.1% |
| Egypt | 10 | 0.1% |
| England | 65 | 0.6% |
| Europe | 432 | 3.9% |
| France | 16 | 0.1% |
| Germany | 10 | 0.1% |
| Hong Kong | 10 | 0.1% |
| India | 70 | 0.6% |
| Iran | 28 | 0.3% |
| Israel | 30 | 0.3% |
| Jordan | 7 | 0.1% |
| Korea | 61 | 0.5% |
| Latin America | 149 | 1.3% |
| Latvia | 35 | 0.3% |
| Mexico | 58 | 0.5% |
| Netherlands | 17 | 0.2% |
| Nicaragua | 27 | 0.2% |
| Nigeria | 46 | 0.4% |
| Northern Africa | 10 | 0.1% |
| Northern Europe | 119 | 1.1% |
| Oceania | 28 | 0.3% |
| Peru | 56 | 0.5% |
| Philippines | 196 | 1.8% |
| Poland | 108 | 1.0% |
| Portugal | 14 | 0.1% |
| Singapore | 34 | 0.3% |
| South America | 64 | 0.6% |
| South Central Asia | 124 | 1.1% |
| South Eastern Asia | 263 | 2.4% |
| Southern Europe | 41 | 0.4% |
| Spain | 27 | 0.2% |
| Switzerland | 2 | 0.0% |
| Taiwan | 4 | 0.0% |
| Turkey | 7 | 0.1% |
| Ukraine | 84 | 0.8% |
| Uzbekistan | 8 | 0.1% |
| Western Africa | 46 | 0.4% |
| Western Asia | 44 | 0.4% |
| Western Europe | 45 | 0.4% | View All 48 Rows |
Sex and Age in Clayton
Sex and Age in Clayton
The most populous age groups in Clayton are 60 to 64 Years (546 | 10.0%) for men and 15 to 19 Years (637 | 11.4%) for women.
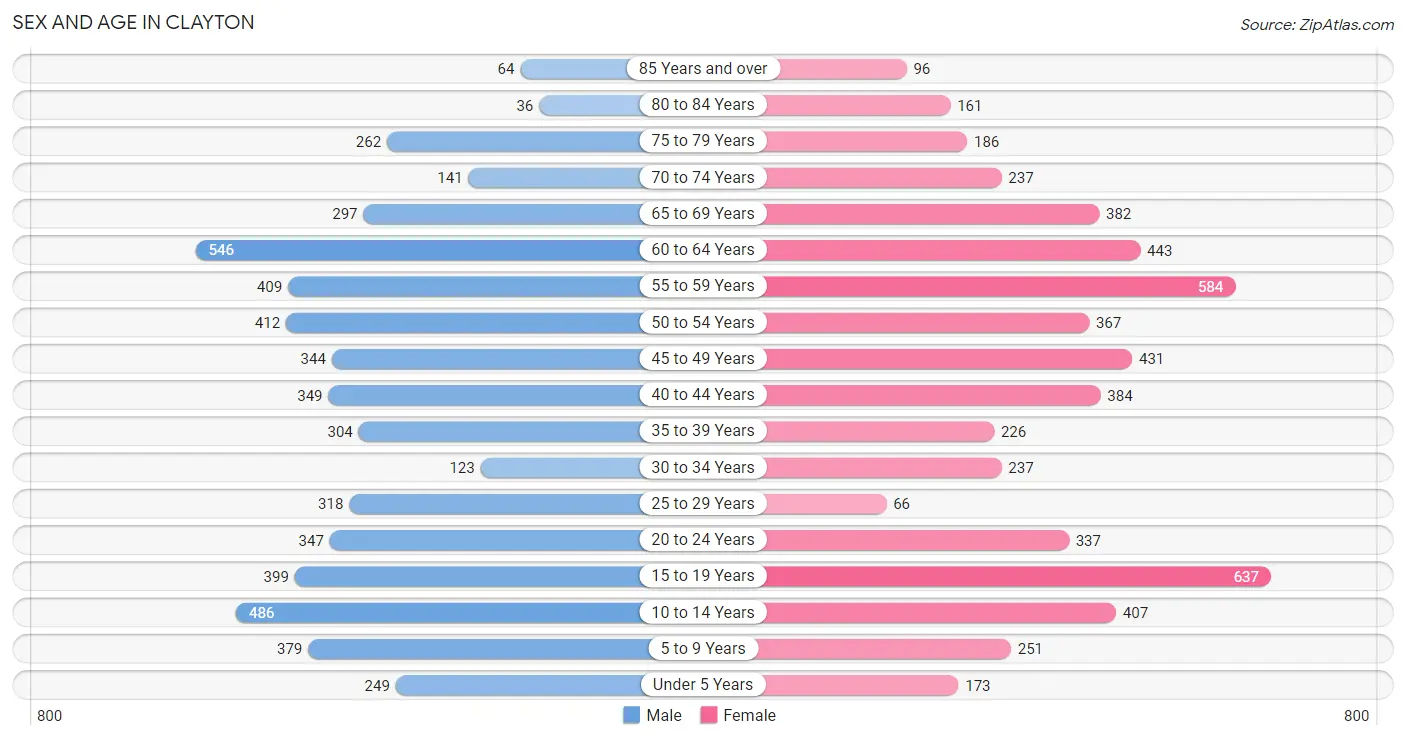
| Age Bracket | Male | Female |
| Under 5 Years | 249 (4.6%) | 173 (3.1%) |
| 5 to 9 Years | 379 (6.9%) | 251 (4.5%) |
| 10 to 14 Years | 486 (8.9%) | 407 (7.3%) |
| 15 to 19 Years | 399 (7.3%) | 637 (11.4%) |
| 20 to 24 Years | 347 (6.4%) | 337 (6.0%) |
| 25 to 29 Years | 318 (5.8%) | 66 (1.2%) |
| 30 to 34 Years | 123 (2.2%) | 237 (4.2%) |
| 35 to 39 Years | 304 (5.6%) | 226 (4.0%) |
| 40 to 44 Years | 349 (6.4%) | 384 (6.9%) |
| 45 to 49 Years | 344 (6.3%) | 431 (7.7%) |
| 50 to 54 Years | 412 (7.5%) | 367 (6.6%) |
| 55 to 59 Years | 409 (7.5%) | 584 (10.4%) |
| 60 to 64 Years | 546 (10.0%) | 443 (7.9%) |
| 65 to 69 Years | 297 (5.4%) | 382 (6.8%) |
| 70 to 74 Years | 141 (2.6%) | 237 (4.2%) |
| 75 to 79 Years | 262 (4.8%) | 186 (3.3%) |
| 80 to 84 Years | 36 (0.7%) | 161 (2.9%) |
| 85 Years and over | 64 (1.2%) | 96 (1.7%) |
| Total | 5,465 (100.0%) | 5,605 (100.0%) |
Families and Households in Clayton
Median Family Size in Clayton
The median family size in Clayton is 3.18 persons per family, with married-couple families (2,576 | 81.6%) accounting for the largest median family size of 3.25 persons per family. On the other hand, single female/mother families (429 | 13.6%) represent the smallest median family size with 2.83 persons per family.
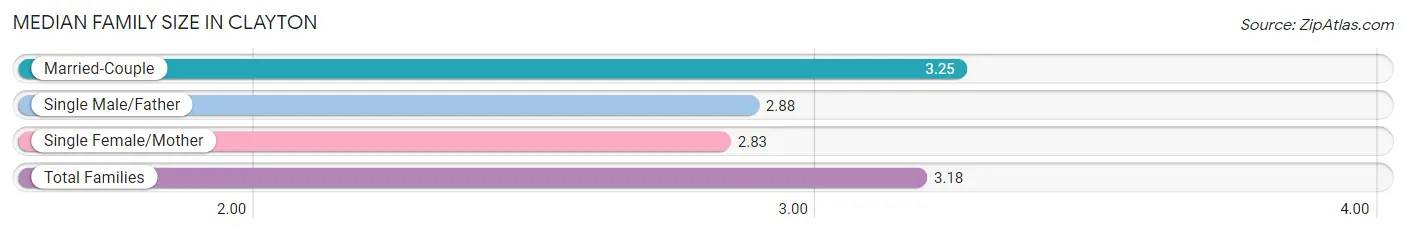
| Family Type | # Families | Family Size |
| Married-Couple | 2,576 (81.6%) | 3.25 |
| Single Male/Father | 152 (4.8%) | 2.88 |
| Single Female/Mother | 429 (13.6%) | 2.83 |
| Total Families | 3,157 (100.0%) | 3.18 |
Median Household Size in Clayton
The median household size in Clayton is 2.76 persons per household, with married-couple households (2,576 | 64.5%) accounting for the largest median household size of 3.28 persons per household. non-family households (836 | 20.9%) represent the smallest median household size with 1.08 persons per household.
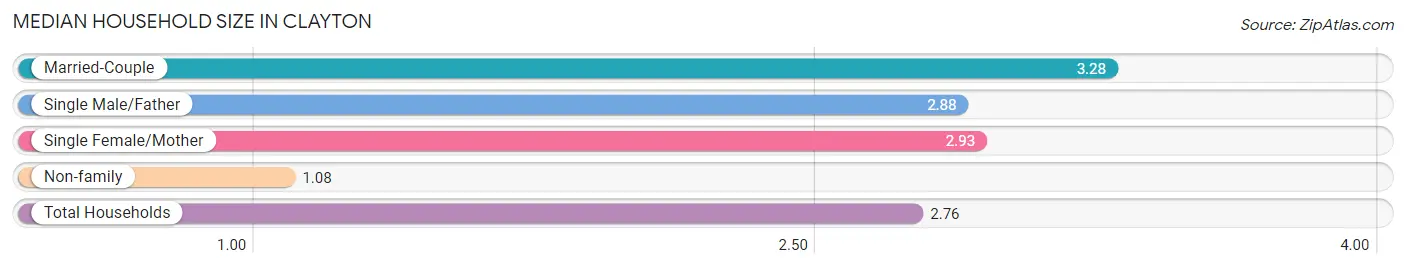
| Household Type | # Households | Household Size |
| Married-Couple | 2,576 (64.5%) | 3.28 |
| Single Male/Father | 152 (3.8%) | 2.88 |
| Single Female/Mother | 429 (10.7%) | 2.93 |
| Non-family | 836 (20.9%) | 1.08 |
| Total Households | 3,993 (100.0%) | 2.76 |
Household Size by Marriage Status in Clayton
Out of a total of 3,993 households in Clayton, 3,157 (79.1%) are family households, while 836 (20.9%) are nonfamily households. The most numerous type of family households are 2-person households, comprising 1,260, and the most common type of nonfamily households are 1-person households, comprising 771.
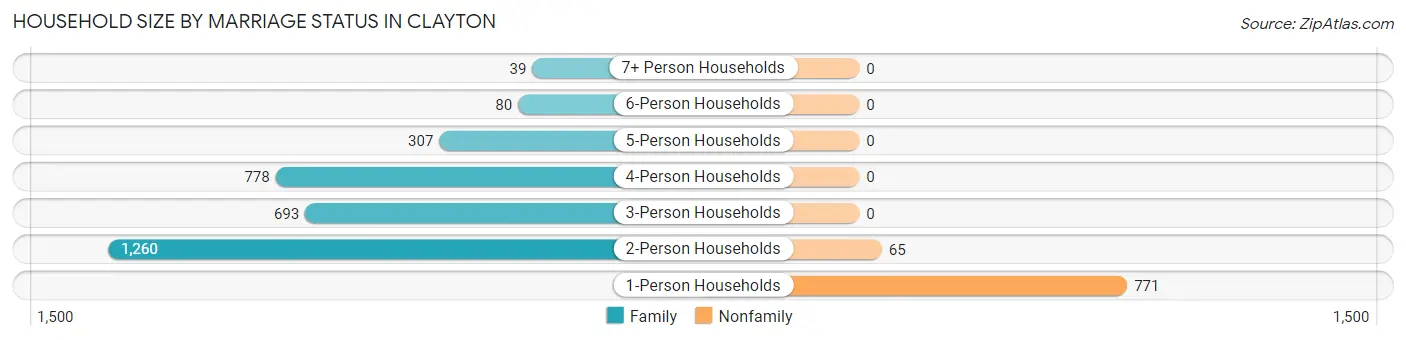
| Household Size | Family Households | Nonfamily Households |
| 1-Person Households | - | 771 (19.3%) |
| 2-Person Households | 1,260 (31.6%) | 65 (1.6%) |
| 3-Person Households | 693 (17.4%) | 0 (0.0%) |
| 4-Person Households | 778 (19.5%) | 0 (0.0%) |
| 5-Person Households | 307 (7.7%) | 0 (0.0%) |
| 6-Person Households | 80 (2.0%) | 0 (0.0%) |
| 7+ Person Households | 39 (1.0%) | 0 (0.0%) |
| Total | 3,157 (79.1%) | 836 (20.9%) |
Female Fertility in Clayton
Fertility by Age in Clayton
Average fertility rate in Clayton is 14.0 births per 1,000 women. Women in the age bracket of 20 to 34 years have the highest fertility rate with 38.0 births per 1,000 women. Women in the age bracket of 20 to 34 years acount for 68.6% of all women with births.
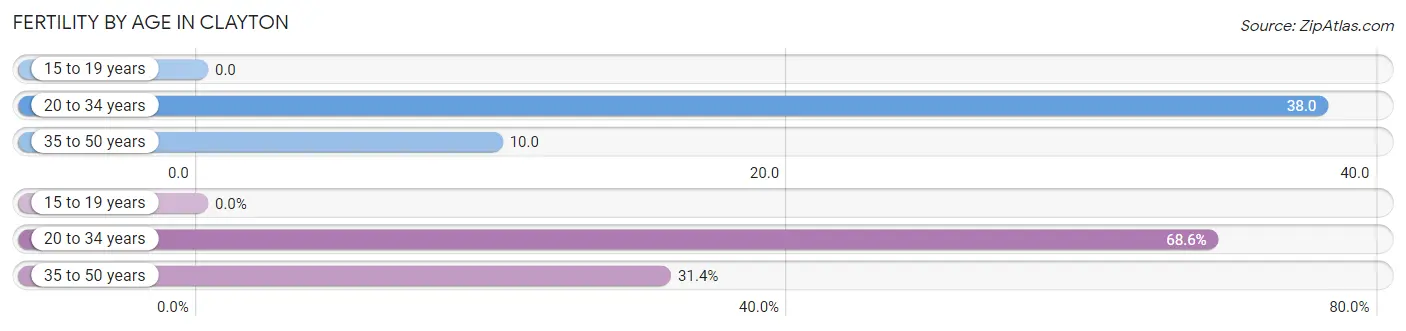
| Age Bracket | Women with Births | Births / 1,000 Women |
| 15 to 19 years | 0 (0.0%) | 0.0 |
| 20 to 34 years | 24 (68.6%) | 38.0 |
| 35 to 50 years | 11 (31.4%) | 10.0 |
| Total | 35 (100.0%) | 14.0 |
Fertility by Age by Marriage Status in Clayton
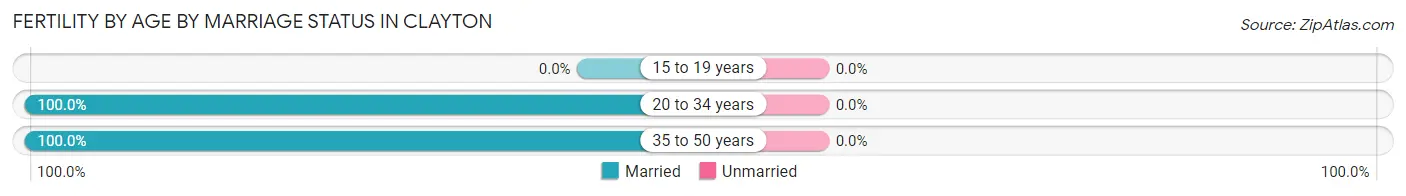
| Age Bracket | Married | Unmarried |
| 15 to 19 years | 0 (0.0%) | 0 (0.0%) |
| 20 to 34 years | 24 (100.0%) | 0 (0.0%) |
| 35 to 50 years | 11 (100.0%) | 0 (0.0%) |
| Total | 35 (100.0%) | 0 (0.0%) |
Fertility by Education in Clayton
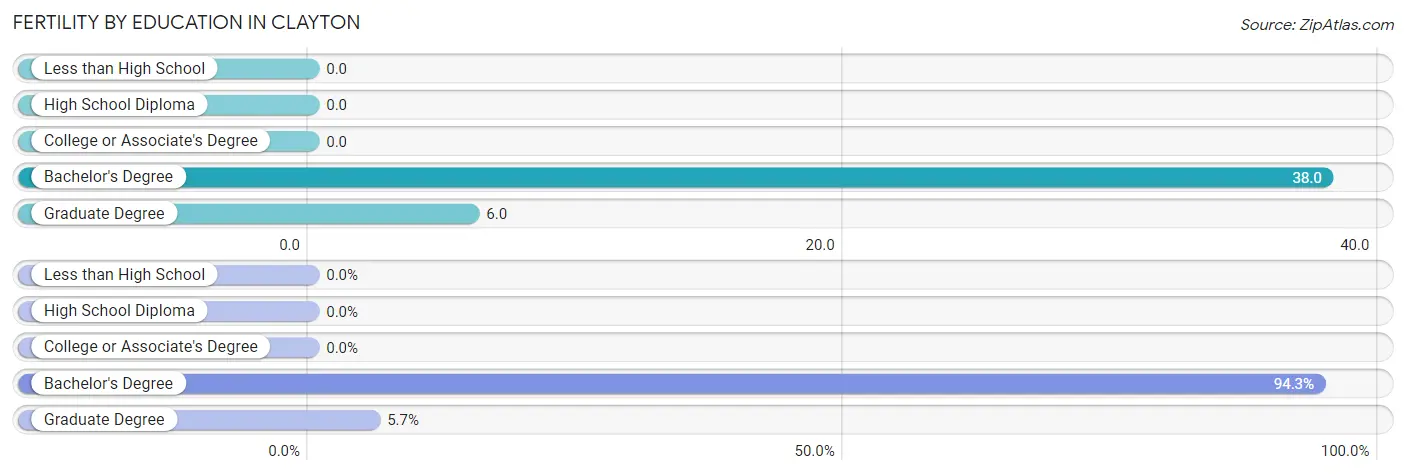
| Educational Attainment | Women with Births | Births / 1,000 Women |
| Less than High School | 0 (0.0%) | 0.0 |
| High School Diploma | 0 (0.0%) | 0.0 |
| College or Associate's Degree | 0 (0.0%) | 0.0 |
| Bachelor's Degree | 33 (94.3%) | 38.0 |
| Graduate Degree | 2 (5.7%) | 6.0 |
| Total | 35 (100.0%) | 14.0 |
Fertility by Education by Marriage Status in Clayton
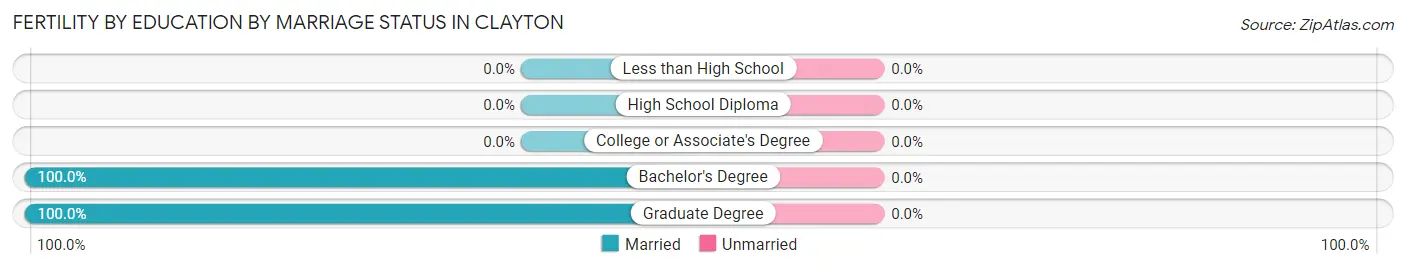
| Educational Attainment | Married | Unmarried |
| Less than High School | 0 (0.0%) | 0 (0.0%) |
| High School Diploma | 0 (0.0%) | 0 (0.0%) |
| College or Associate's Degree | 0 (0.0%) | 0 (0.0%) |
| Bachelor's Degree | 33 (100.0%) | 0 (0.0%) |
| Graduate Degree | 2 (100.0%) | 0 (0.0%) |
| Total | 35 (100.0%) | 0 (0.0%) |
Employment Characteristics in Clayton
Employment by Class of Employer in Clayton
Among the 4,833 employed individuals in Clayton, private company employees (2,820 | 58.4%), not-for-profit organizations (624 | 12.9%), and local government employees (449 | 9.3%) make up the most common classes of employment.
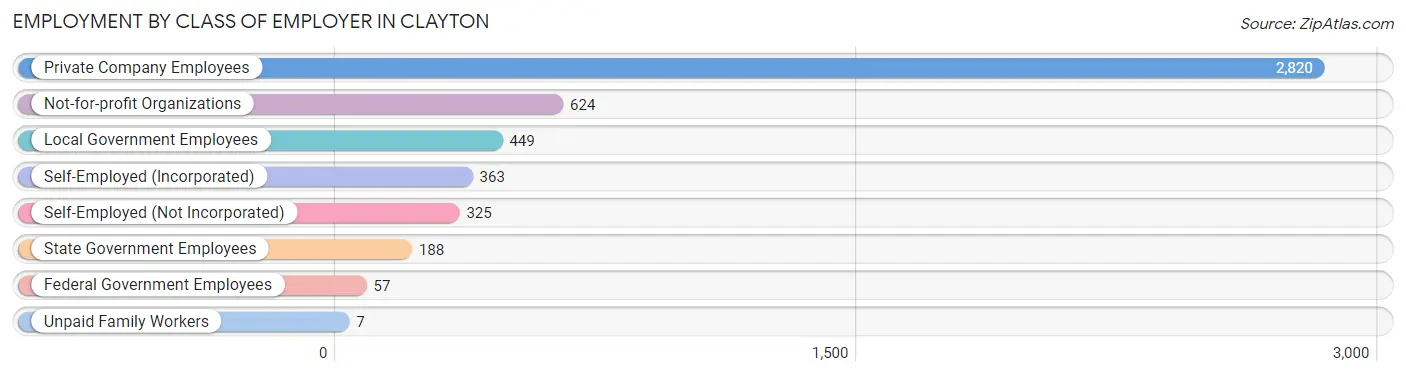
| Employer Class | # Employees | % Employees |
| Private Company Employees | 2,820 | 58.4% |
| Self-Employed (Incorporated) | 363 | 7.5% |
| Self-Employed (Not Incorporated) | 325 | 6.7% |
| Not-for-profit Organizations | 624 | 12.9% |
| Local Government Employees | 449 | 9.3% |
| State Government Employees | 188 | 3.9% |
| Federal Government Employees | 57 | 1.2% |
| Unpaid Family Workers | 7 | 0.1% |
| Total | 4,833 | 100.0% |
Employment Status by Age in Clayton
According to the labor force statistics for Clayton, out of the total population over 16 years of age (8,711), 62.2% or 5,418 individuals are in the labor force, with 5.4% or 293 of them unemployed. The age group with the highest labor force participation rate is 35 to 44 years, with 91.8% or 1,159 individuals in the labor force. Within the labor force, the 25 to 29 years age range has the highest percentage of unemployed individuals, with 29.7% or 87 of them being unemployed.
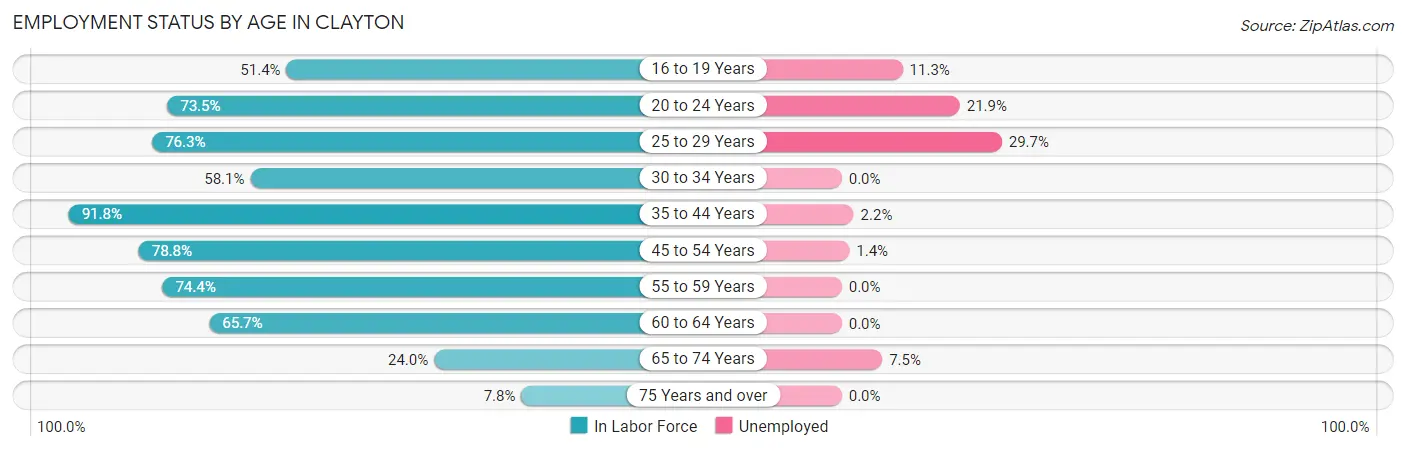
| Age Bracket | In Labor Force | Unemployed |
| 16 to 19 Years | 320 (51.4%) | 36 (11.3%) |
| 20 to 24 Years | 503 (73.5%) | 110 (21.9%) |
| 25 to 29 Years | 293 (76.3%) | 87 (29.7%) |
| 30 to 34 Years | 209 (58.1%) | 0 (0.0%) |
| 35 to 44 Years | 1,159 (91.8%) | 25 (2.2%) |
| 45 to 54 Years | 1,225 (78.8%) | 17 (1.4%) |
| 55 to 59 Years | 739 (74.4%) | 0 (0.0%) |
| 60 to 64 Years | 650 (65.7%) | 0 (0.0%) |
| 65 to 74 Years | 254 (24.0%) | 19 (7.5%) |
| 75 Years and over | 63 (7.8%) | 0 (0.0%) |
| Total | 5,418 (62.2%) | 293 (5.4%) |
Employment Status by Educational Attainment in Clayton
According to labor force statistics for Clayton, 77.1% of individuals (4,274) out of the total population between 25 and 64 years of age (5,543) are in the labor force, with 3.0% or 128 of them being unemployed. The group with the highest labor force participation rate are those with the educational attainment of bachelor's degree or higher, with 83.2% or 2,632 individuals in the labor force. Within the labor force, individuals with college / associate degree education have the highest percentage of unemployment, with 9.4% or 113 of them being unemployed.
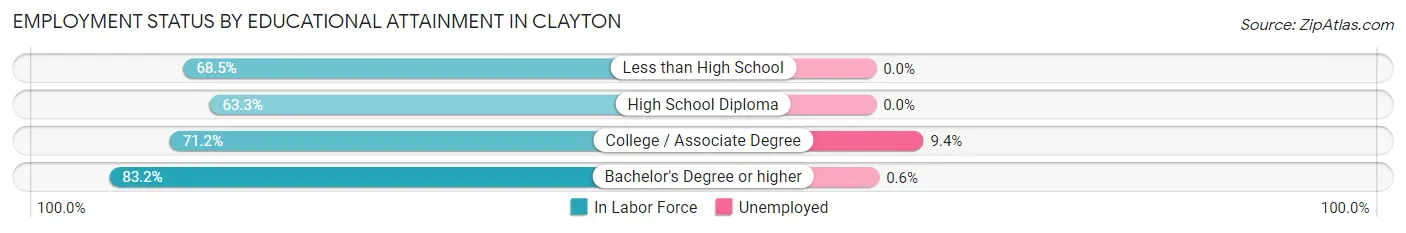
| Educational Attainment | In Labor Force | Unemployed |
| Less than High School | 37 (68.5%) | 0 (0.0%) |
| High School Diploma | 407 (63.3%) | 0 (0.0%) |
| College / Associate Degree | 1,198 (71.2%) | 158 (9.4%) |
| Bachelor's Degree or higher | 2,632 (83.2%) | 19 (0.6%) |
| Total | 4,274 (77.1%) | 166 (3.0%) |
Employment Occupations by Sex in Clayton
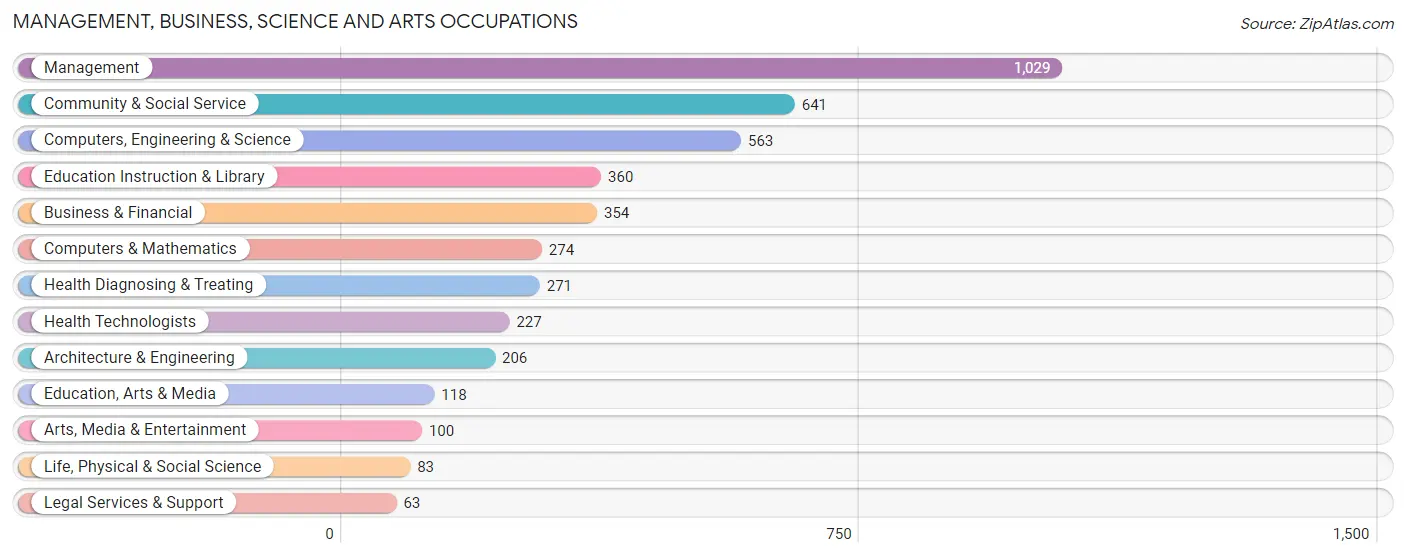
Management, Business, Science and Arts Occupations
The most common Management, Business, Science and Arts occupations in Clayton are Management (1,029 | 20.1%), Community & Social Service (641 | 12.5%), Computers, Engineering & Science (563 | 11.0%), Education Instruction & Library (360 | 7.0%), and Business & Financial (354 | 6.9%).
Management, Business, Science and Arts Occupations by Sex
Within the Management, Business, Science and Arts occupations in Clayton, the most male-oriented occupations are Architecture & Engineering (100.0%), Life, Physical & Social Science (100.0%), and Computers, Engineering & Science (90.6%), while the most female-oriented occupations are Health Technologists (93.8%), Education Instruction & Library (83.3%), and Health Diagnosing & Treating (78.6%).
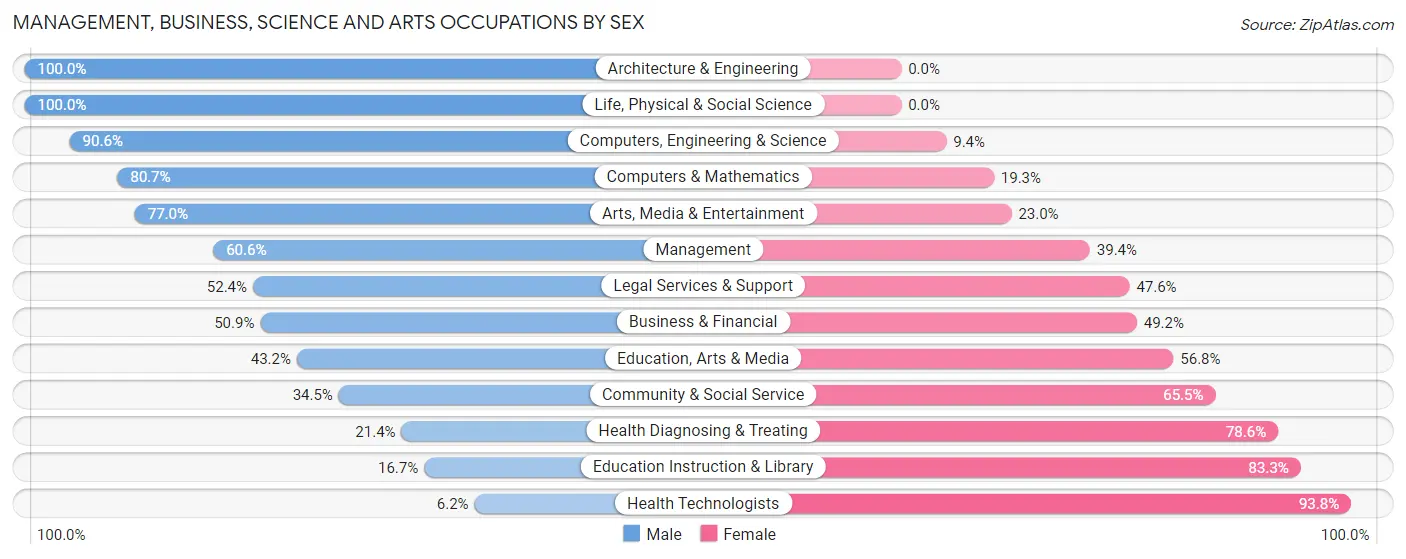
| Occupation | Male | Female |
| Management | 624 (60.6%) | 405 (39.4%) |
| Business & Financial | 180 (50.8%) | 174 (49.1%) |
| Computers, Engineering & Science | 510 (90.6%) | 53 (9.4%) |
| Computers & Mathematics | 221 (80.7%) | 53 (19.3%) |
| Architecture & Engineering | 206 (100.0%) | 0 (0.0%) |
| Life, Physical & Social Science | 83 (100.0%) | 0 (0.0%) |
| Community & Social Service | 221 (34.5%) | 420 (65.5%) |
| Education, Arts & Media | 51 (43.2%) | 67 (56.8%) |
| Legal Services & Support | 33 (52.4%) | 30 (47.6%) |
| Education Instruction & Library | 60 (16.7%) | 300 (83.3%) |
| Arts, Media & Entertainment | 77 (77.0%) | 23 (23.0%) |
| Health Diagnosing & Treating | 58 (21.4%) | 213 (78.6%) |
| Health Technologists | 14 (6.2%) | 213 (93.8%) |
| Total (Category) | 1,593 (55.7%) | 1,265 (44.3%) |
| Total (Overall) | 2,854 (55.7%) | 2,266 (44.3%) |
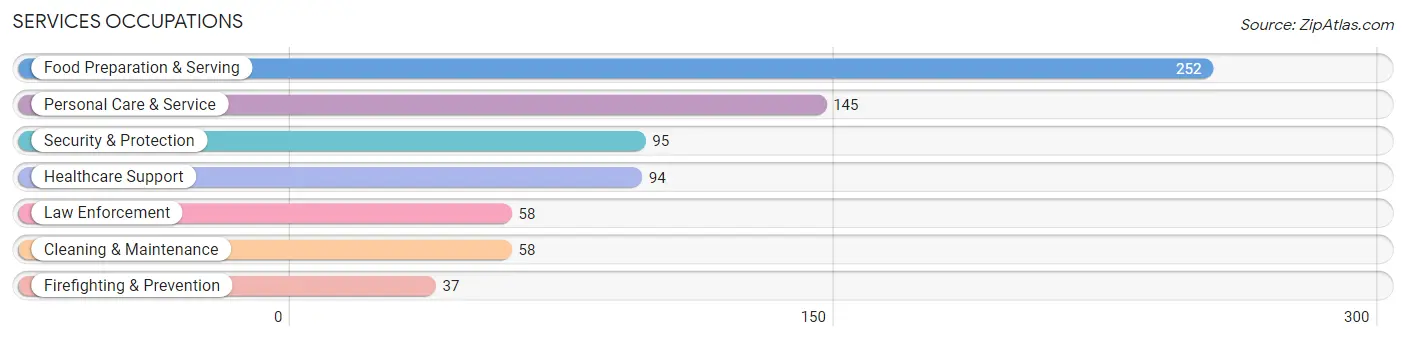
Services Occupations
The most common Services occupations in Clayton are Food Preparation & Serving (252 | 4.9%), Personal Care & Service (145 | 2.8%), Security & Protection (95 | 1.9%), Healthcare Support (94 | 1.8%), and Law Enforcement (58 | 1.1%).
Services Occupations by Sex
Within the Services occupations in Clayton, the most male-oriented occupations are Firefighting & Prevention (100.0%), Security & Protection (91.6%), and Law Enforcement (86.2%), while the most female-oriented occupations are Healthcare Support (74.5%), Personal Care & Service (71.0%), and Food Preparation & Serving (51.6%).
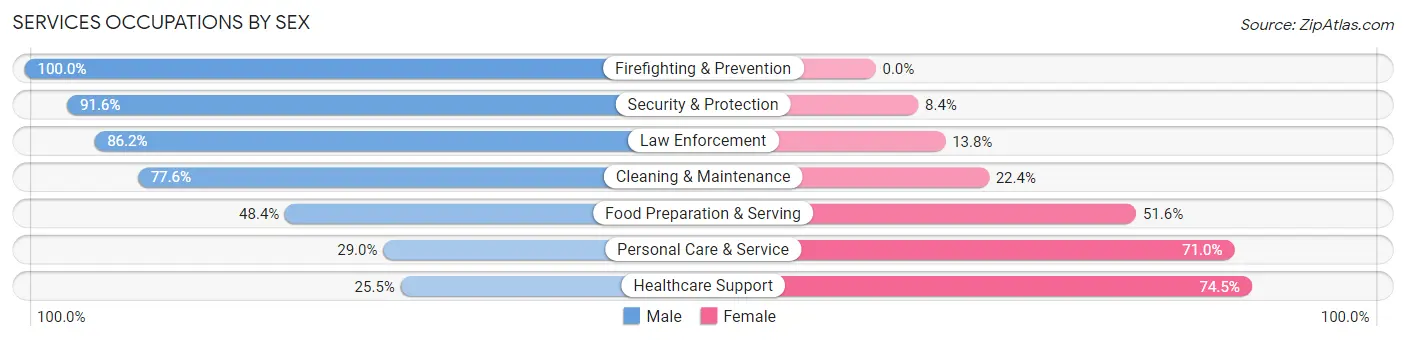
| Occupation | Male | Female |
| Healthcare Support | 24 (25.5%) | 70 (74.5%) |
| Security & Protection | 87 (91.6%) | 8 (8.4%) |
| Firefighting & Prevention | 37 (100.0%) | 0 (0.0%) |
| Law Enforcement | 50 (86.2%) | 8 (13.8%) |
| Food Preparation & Serving | 122 (48.4%) | 130 (51.6%) |
| Cleaning & Maintenance | 45 (77.6%) | 13 (22.4%) |
| Personal Care & Service | 42 (29.0%) | 103 (71.0%) |
| Total (Category) | 320 (49.7%) | 324 (50.3%) |
| Total (Overall) | 2,854 (55.7%) | 2,266 (44.3%) |
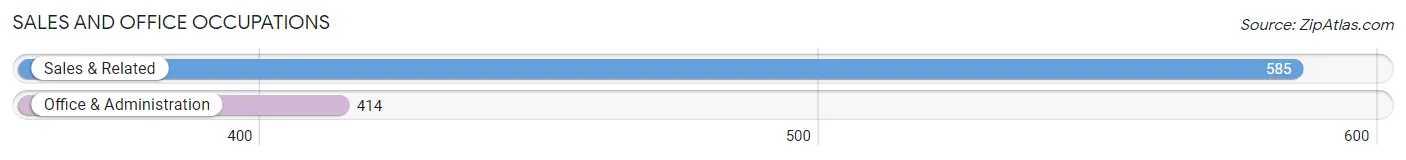
Sales and Office Occupations
The most common Sales and Office occupations in Clayton are Sales & Related (585 | 11.4%), and Office & Administration (414 | 8.1%).
Sales and Office Occupations by Sex
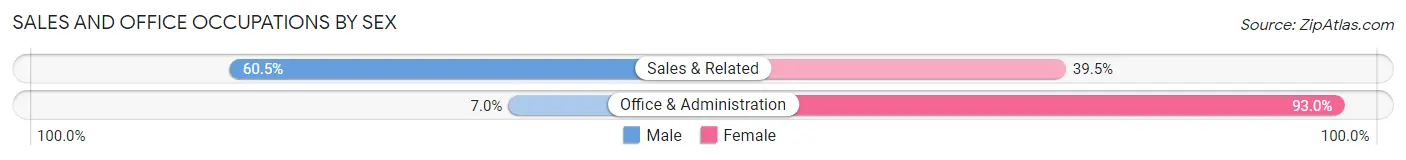
| Occupation | Male | Female |
| Sales & Related | 354 (60.5%) | 231 (39.5%) |
| Office & Administration | 29 (7.0%) | 385 (93.0%) |
| Total (Category) | 383 (38.3%) | 616 (61.7%) |
| Total (Overall) | 2,854 (55.7%) | 2,266 (44.3%) |
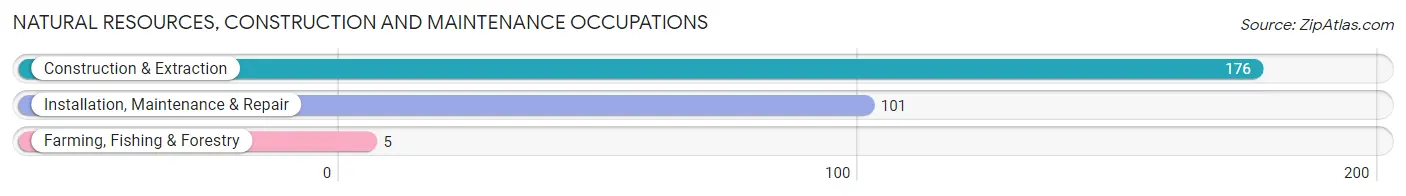
Natural Resources, Construction and Maintenance Occupations
The most common Natural Resources, Construction and Maintenance occupations in Clayton are Construction & Extraction (176 | 3.4%), Installation, Maintenance & Repair (101 | 2.0%), and Farming, Fishing & Forestry (5 | 0.1%).
Natural Resources, Construction and Maintenance Occupations by Sex
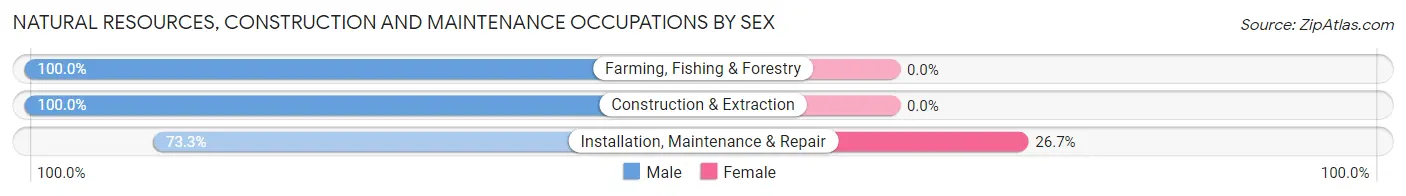
| Occupation | Male | Female |
| Farming, Fishing & Forestry | 5 (100.0%) | 0 (0.0%) |
| Construction & Extraction | 176 (100.0%) | 0 (0.0%) |
| Installation, Maintenance & Repair | 74 (73.3%) | 27 (26.7%) |
| Total (Category) | 255 (90.4%) | 27 (9.6%) |
| Total (Overall) | 2,854 (55.7%) | 2,266 (44.3%) |
Production, Transportation and Moving Occupations
The most common Production, Transportation and Moving occupations in Clayton are Production (200 | 3.9%), Material Moving (98 | 1.9%), and Transportation (39 | 0.8%).

Production, Transportation and Moving Occupations by Sex
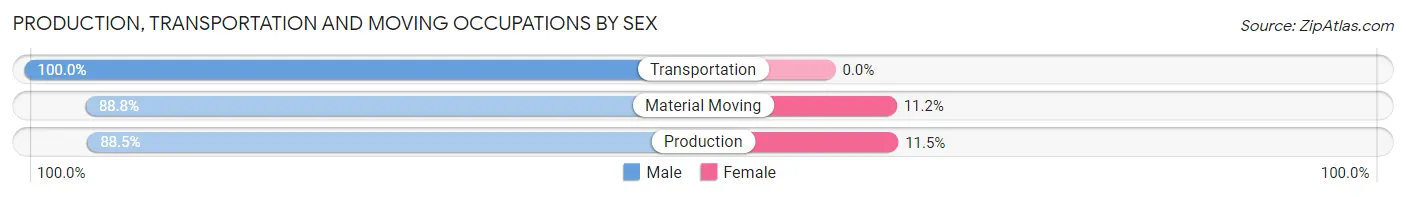
| Occupation | Male | Female |
| Production | 177 (88.5%) | 23 (11.5%) |
| Transportation | 39 (100.0%) | 0 (0.0%) |
| Material Moving | 87 (88.8%) | 11 (11.2%) |
| Total (Category) | 303 (89.9%) | 34 (10.1%) |
| Total (Overall) | 2,854 (55.7%) | 2,266 (44.3%) |
Employment Industries by Sex in Clayton
Employment Industries in Clayton
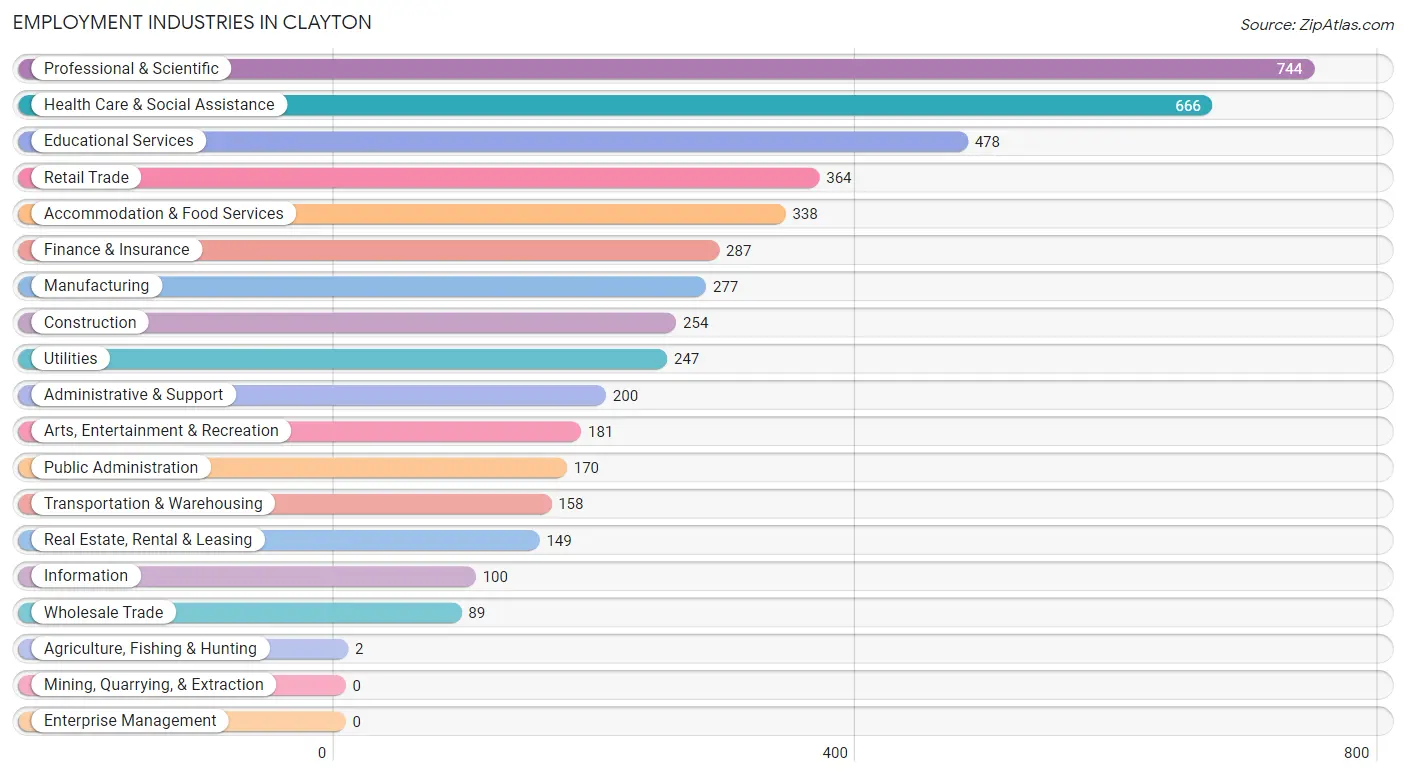
The major employment industries in Clayton include Professional & Scientific (744 | 14.5%), Health Care & Social Assistance (666 | 13.0%), Educational Services (478 | 9.3%), Retail Trade (364 | 7.1%), and Accommodation & Food Services (338 | 6.6%).
Employment Industries by Sex in Clayton
The Clayton industries that see more men than women are Agriculture, Fishing & Hunting (100.0%), Construction (94.1%), and Arts, Entertainment & Recreation (92.3%), whereas the industries that tend to have a higher number of women are Health Care & Social Assistance (80.8%), Educational Services (77.6%), and Real Estate, Rental & Leasing (57.1%).
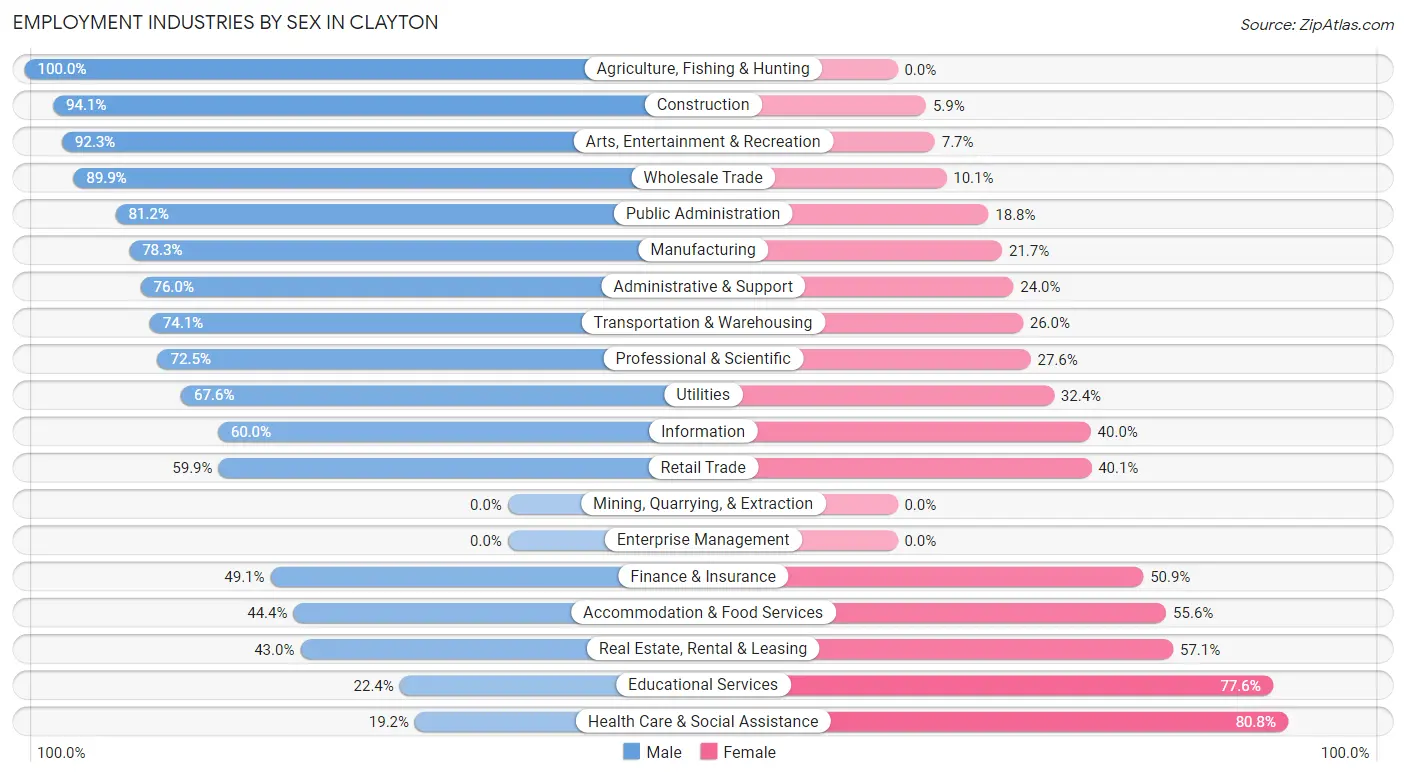
| Industry | Male | Female |
| Agriculture, Fishing & Hunting | 2 (100.0%) | 0 (0.0%) |
| Mining, Quarrying, & Extraction | 0 (0.0%) | 0 (0.0%) |
| Construction | 239 (94.1%) | 15 (5.9%) |
| Manufacturing | 217 (78.3%) | 60 (21.7%) |
| Wholesale Trade | 80 (89.9%) | 9 (10.1%) |
| Retail Trade | 218 (59.9%) | 146 (40.1%) |
| Transportation & Warehousing | 117 (74.1%) | 41 (26.0%) |
| Utilities | 167 (67.6%) | 80 (32.4%) |
| Information | 60 (60.0%) | 40 (40.0%) |
| Finance & Insurance | 141 (49.1%) | 146 (50.9%) |
| Real Estate, Rental & Leasing | 64 (42.9%) | 85 (57.1%) |
| Professional & Scientific | 539 (72.5%) | 205 (27.6%) |
| Enterprise Management | 0 (0.0%) | 0 (0.0%) |
| Administrative & Support | 152 (76.0%) | 48 (24.0%) |
| Educational Services | 107 (22.4%) | 371 (77.6%) |
| Health Care & Social Assistance | 128 (19.2%) | 538 (80.8%) |
| Arts, Entertainment & Recreation | 167 (92.3%) | 14 (7.7%) |
| Accommodation & Food Services | 150 (44.4%) | 188 (55.6%) |
| Public Administration | 138 (81.2%) | 32 (18.8%) |
| Total | 2,854 (55.7%) | 2,266 (44.3%) |
Education in Clayton
School Enrollment in Clayton
The most common levels of schooling among the 3,302 students in Clayton are high school (890 | 27.0%), college / undergraduate (840 | 25.4%), and middle school (596 | 18.0%).
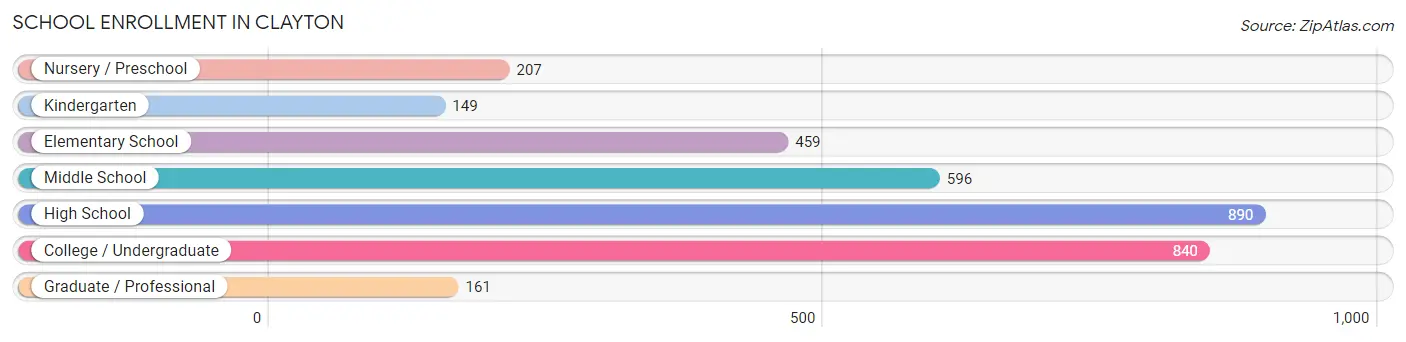
| School Level | # Students | % Students |
| Nursery / Preschool | 207 | 6.3% |
| Kindergarten | 149 | 4.5% |
| Elementary School | 459 | 13.9% |
| Middle School | 596 | 18.0% |
| High School | 890 | 27.0% |
| College / Undergraduate | 840 | 25.4% |
| Graduate / Professional | 161 | 4.9% |
| Total | 3,302 | 100.0% |
School Enrollment by Age by Funding Source in Clayton
Out of a total of 3,302 students who are enrolled in schools in Clayton, 363 (11.0%) attend a private institution, while the remaining 2,939 (89.0%) are enrolled in public schools. The age group of 3 to 4 year olds has the highest likelihood of being enrolled in private schools, with 92 (58.2% in the age bracket) enrolled. Conversely, the age group of 18 to 19 year olds has the lowest likelihood of being enrolled in a private school, with 318 (100.0% in the age bracket) attending a public institution.
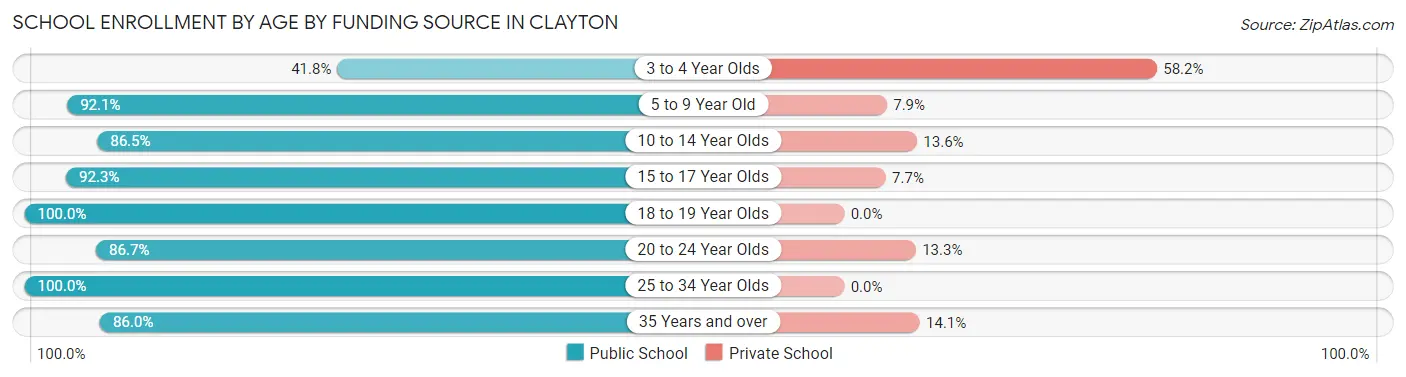
| Age Bracket | Public School | Private School |
| 3 to 4 Year Olds | 66 (41.8%) | 92 (58.2%) |
| 5 to 9 Year Old | 580 (92.1%) | 50 (7.9%) |
| 10 to 14 Year Olds | 689 (86.5%) | 108 (13.6%) |
| 15 to 17 Year Olds | 537 (92.3%) | 45 (7.7%) |
| 18 to 19 Year Olds | 318 (100.0%) | 0 (0.0%) |
| 20 to 24 Year Olds | 338 (86.7%) | 52 (13.3%) |
| 25 to 34 Year Olds | 306 (100.0%) | 0 (0.0%) |
| 35 Years and over | 104 (86.0%) | 17 (14.1%) |
| Total | 2,939 (89.0%) | 363 (11.0%) |
Educational Attainment by Field of Study in Clayton
Business (1,061 | 23.7%), engineering (434 | 9.7%), social sciences (387 | 8.7%), bio, nature & agricultural (373 | 8.3%), and science & technology (360 | 8.1%) are the most common fields of study among 4,471 individuals in Clayton who have obtained a bachelor's degree or higher.
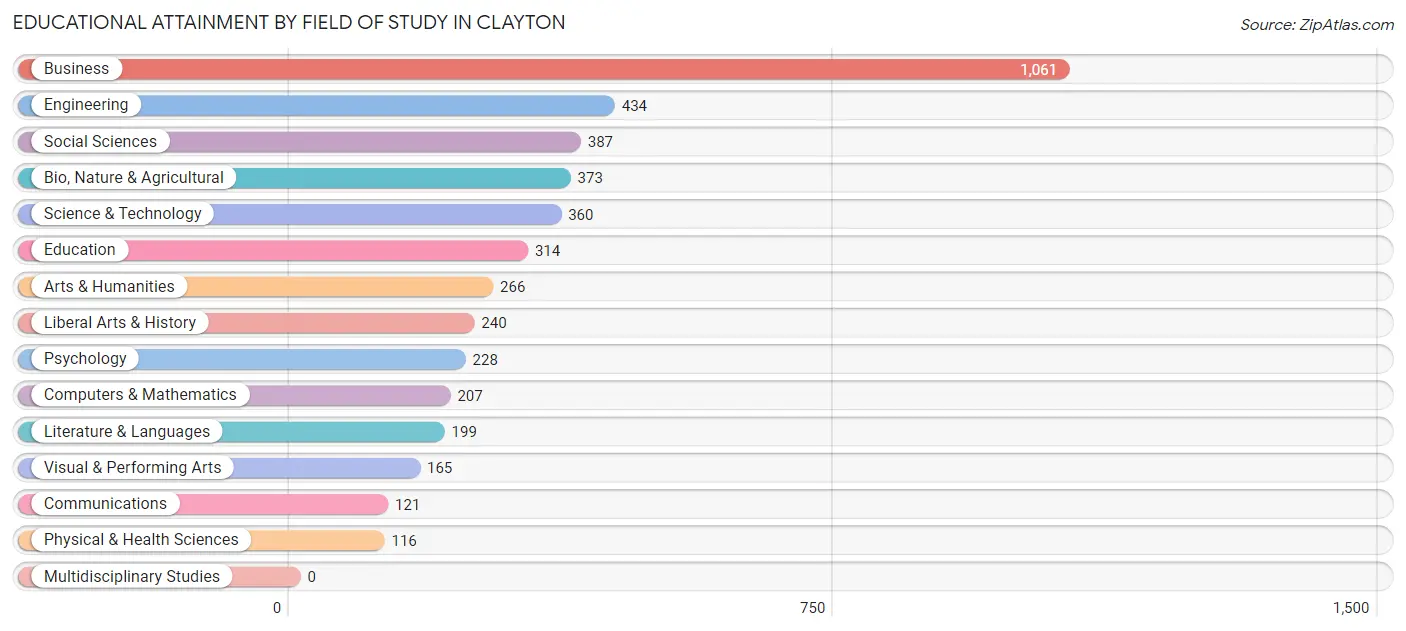
| Field of Study | # Graduates | % Graduates |
| Computers & Mathematics | 207 | 4.6% |
| Bio, Nature & Agricultural | 373 | 8.3% |
| Physical & Health Sciences | 116 | 2.6% |
| Psychology | 228 | 5.1% |
| Social Sciences | 387 | 8.7% |
| Engineering | 434 | 9.7% |
| Multidisciplinary Studies | 0 | 0.0% |
| Science & Technology | 360 | 8.1% |
| Business | 1,061 | 23.7% |
| Education | 314 | 7.0% |
| Literature & Languages | 199 | 4.4% |
| Liberal Arts & History | 240 | 5.4% |
| Visual & Performing Arts | 165 | 3.7% |
| Communications | 121 | 2.7% |
| Arts & Humanities | 266 | 5.9% |
| Total | 4,471 | 100.0% |
Transportation & Commute in Clayton
Vehicle Availability by Sex in Clayton
The most prevalent vehicle ownership categories in Clayton are males with 3 vehicles (994, accounting for 36.5%) and females with 3 vehicles (728, making up 47.3%).
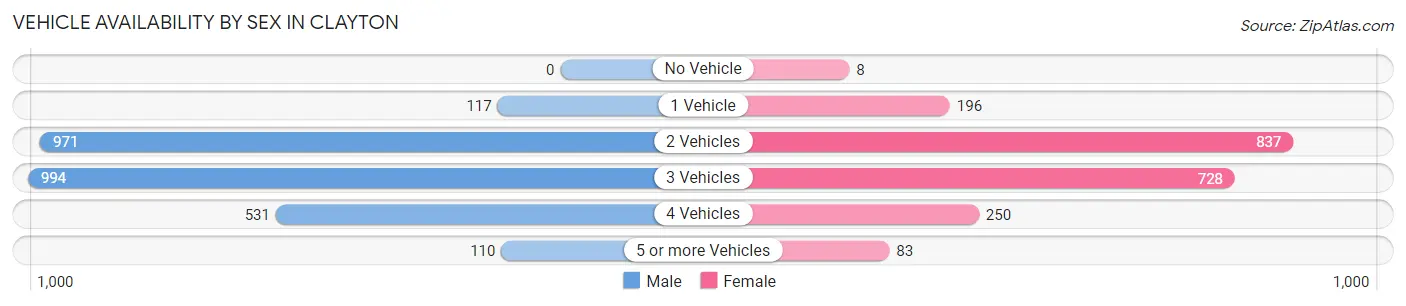
| Vehicles Available | Male | Female |
| No Vehicle | 0 (0.0%) | 8 (0.4%) |
| 1 Vehicle | 117 (4.3%) | 196 (9.3%) |
| 2 Vehicles | 971 (35.7%) | 837 (39.8%) |
| 3 Vehicles | 994 (36.5%) | 728 (34.6%) |
| 4 Vehicles | 531 (19.5%) | 250 (11.9%) |
| 5 or more Vehicles | 110 (4.0%) | 83 (4.0%) |
| Total | 2,723 (100.0%) | 2,102 (100.0%) |
Commute Time in Clayton
The most frequently occuring commute durations in Clayton are 45 to 59 minutes (701 commuters, 17.6%), 60 to 89 minutes (596 commuters, 15.0%), and 30 to 34 minutes (557 commuters, 14.0%).
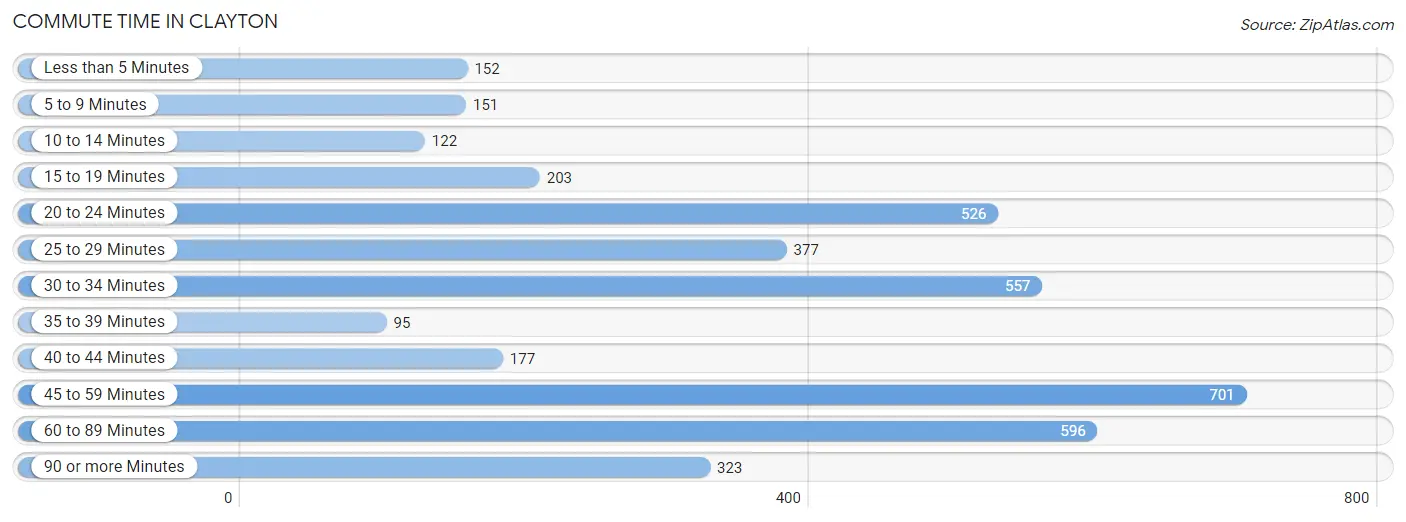
| Commute Time | # Commuters | % Commuters |
| Less than 5 Minutes | 152 | 3.8% |
| 5 to 9 Minutes | 151 | 3.8% |
| 10 to 14 Minutes | 122 | 3.1% |
| 15 to 19 Minutes | 203 | 5.1% |
| 20 to 24 Minutes | 526 | 13.2% |
| 25 to 29 Minutes | 377 | 9.5% |
| 30 to 34 Minutes | 557 | 14.0% |
| 35 to 39 Minutes | 95 | 2.4% |
| 40 to 44 Minutes | 177 | 4.4% |
| 45 to 59 Minutes | 701 | 17.6% |
| 60 to 89 Minutes | 596 | 15.0% |
| 90 or more Minutes | 323 | 8.1% |
Commute Time by Sex in Clayton
The most common commute times in Clayton are 45 to 59 minutes (571 commuters, 23.9%) for males and 30 to 34 minutes (315 commuters, 19.8%) for females.
| Commute Time | Male | Female |
| Less than 5 Minutes | 93 (3.9%) | 59 (3.7%) |
| 5 to 9 Minutes | 44 (1.8%) | 107 (6.7%) |
| 10 to 14 Minutes | 80 (3.4%) | 42 (2.6%) |
| 15 to 19 Minutes | 50 (2.1%) | 153 (9.6%) |
| 20 to 24 Minutes | 274 (11.5%) | 252 (15.8%) |
| 25 to 29 Minutes | 192 (8.0%) | 185 (11.6%) |
| 30 to 34 Minutes | 242 (10.1%) | 315 (19.8%) |
| 35 to 39 Minutes | 58 (2.4%) | 37 (2.3%) |
| 40 to 44 Minutes | 97 (4.1%) | 80 (5.0%) |
| 45 to 59 Minutes | 571 (23.9%) | 130 (8.2%) |
| 60 to 89 Minutes | 439 (18.4%) | 157 (9.9%) |
| 90 or more Minutes | 248 (10.4%) | 75 (4.7%) |
Time of Departure to Work by Sex in Clayton
The most frequent times of departure to work in Clayton are 7:00 AM to 7:29 AM (393, 16.5%) for males and 7:00 AM to 7:29 AM (304, 19.1%) for females.
| Time of Departure | Male | Female |
| 12:00 AM to 4:59 AM | 193 (8.1%) | 23 (1.4%) |
| 5:00 AM to 5:29 AM | 222 (9.3%) | 52 (3.3%) |
| 5:30 AM to 5:59 AM | 54 (2.3%) | 63 (4.0%) |
| 6:00 AM to 6:29 AM | 274 (11.5%) | 225 (14.1%) |
| 6:30 AM to 6:59 AM | 227 (9.5%) | 121 (7.6%) |
| 7:00 AM to 7:29 AM | 393 (16.5%) | 304 (19.1%) |
| 7:30 AM to 7:59 AM | 144 (6.0%) | 203 (12.8%) |
| 8:00 AM to 8:29 AM | 134 (5.6%) | 123 (7.7%) |
| 8:30 AM to 8:59 AM | 87 (3.6%) | 66 (4.2%) |
| 9:00 AM to 9:59 AM | 312 (13.1%) | 181 (11.4%) |
| 10:00 AM to 10:59 AM | 93 (3.9%) | 106 (6.7%) |
| 11:00 AM to 11:59 AM | 88 (3.7%) | 0 (0.0%) |
| 12:00 PM to 3:59 PM | 46 (1.9%) | 7 (0.4%) |
| 4:00 PM to 11:59 PM | 121 (5.1%) | 118 (7.4%) |
| Total | 2,388 (100.0%) | 1,592 (100.0%) |
Housing Occupancy in Clayton
Occupancy by Ownership in Clayton
Of the total 3,993 dwellings in Clayton, owner-occupied units account for 3,622 (90.7%), while renter-occupied units make up 371 (9.3%).
| Occupancy | # Housing Units | % Housing Units |
| Owner Occupied Housing Units | 3,622 | 90.7% |
| Renter-Occupied Housing Units | 371 | 9.3% |
| Total Occupied Housing Units | 3,993 | 100.0% |
Occupancy by Household Size in Clayton
| Household Size | # Housing Units | % Housing Units |
| 1-Person Household | 771 | 19.3% |
| 2-Person Household | 1,325 | 33.2% |
| 3-Person Household | 693 | 17.4% |
| 4+ Person Household | 1,204 | 30.1% |
| Total Housing Units | 3,993 | 100.0% |
Occupancy by Ownership by Household Size in Clayton
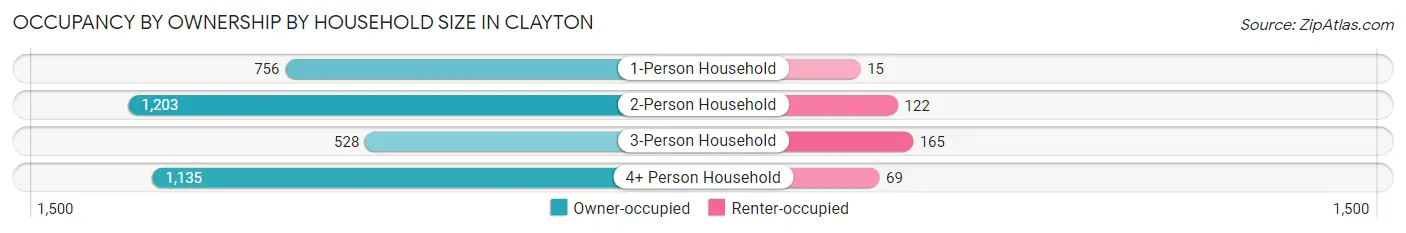
| Household Size | Owner-occupied | Renter-occupied |
| 1-Person Household | 756 (98.1%) | 15 (1.9%) |
| 2-Person Household | 1,203 (90.8%) | 122 (9.2%) |
| 3-Person Household | 528 (76.2%) | 165 (23.8%) |
| 4+ Person Household | 1,135 (94.3%) | 69 (5.7%) |
| Total Housing Units | 3,622 (90.7%) | 371 (9.3%) |
Occupancy by Educational Attainment in Clayton
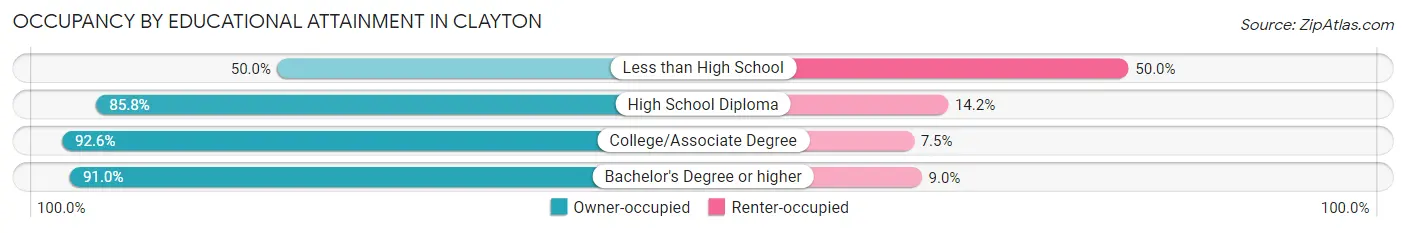
| Household Size | Owner-occupied | Renter-occupied |
| Less than High School | 12 (50.0%) | 12 (50.0%) |
| High School Diploma | 295 (85.8%) | 49 (14.2%) |
| College/Associate Degree | 982 (92.5%) | 79 (7.4%) |
| Bachelor's Degree or higher | 2,333 (91.0%) | 231 (9.0%) |
Occupancy by Age of Householder in Clayton
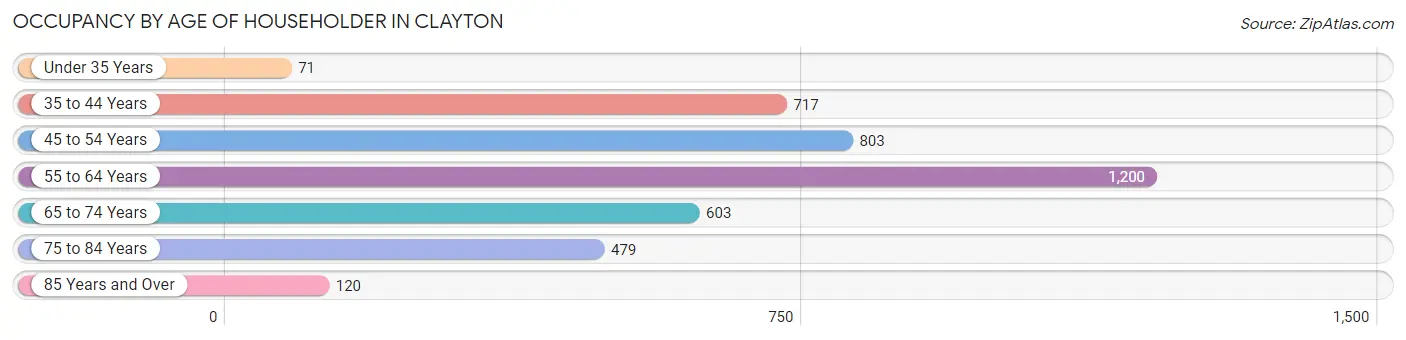
| Age Bracket | # Households | % Households |
| Under 35 Years | 71 | 1.8% |
| 35 to 44 Years | 717 | 18.0% |
| 45 to 54 Years | 803 | 20.1% |
| 55 to 64 Years | 1,200 | 30.0% |
| 65 to 74 Years | 603 | 15.1% |
| 75 to 84 Years | 479 | 12.0% |
| 85 Years and Over | 120 | 3.0% |
| Total | 3,993 | 100.0% |
Housing Finances in Clayton
Median Income by Occupancy in Clayton
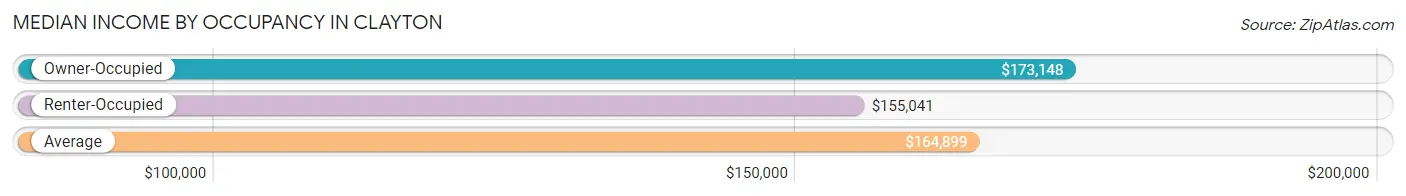
| Occupancy Type | # Households | Median Income |
| Owner-Occupied | 3,622 (90.7%) | $173,148 |
| Renter-Occupied | 371 (9.3%) | $155,041 |
| Average | 3,993 (100.0%) | $164,899 |
Occupancy by Householder Income Bracket in Clayton
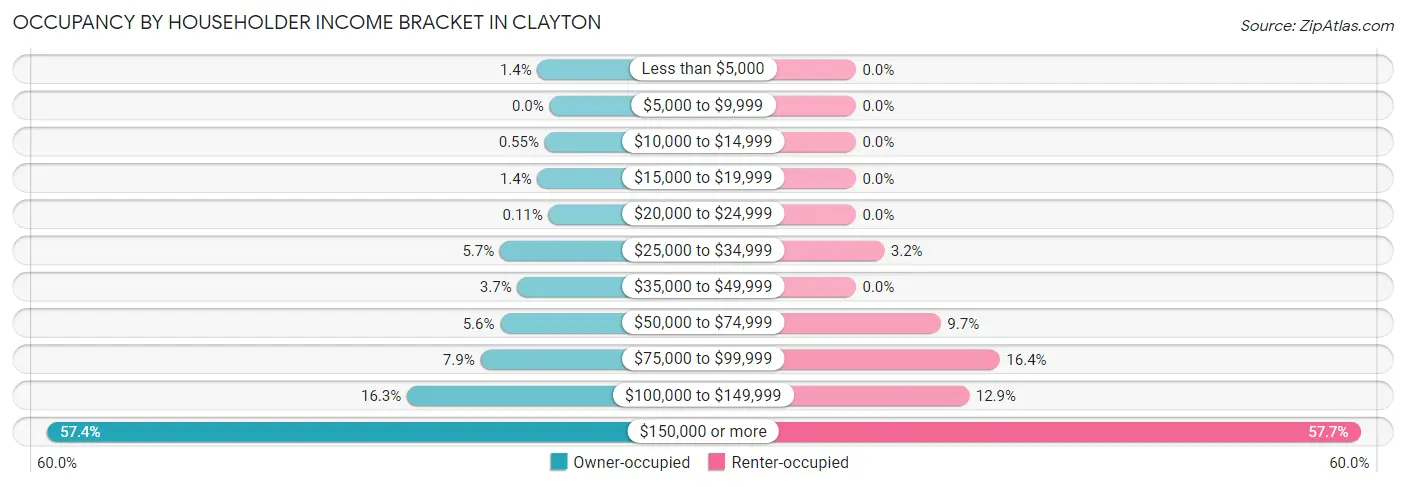
| Income Bracket | Owner-occupied | Renter-occupied |
| Less than $5,000 | 50 (1.4%) | 0 (0.0%) |
| $5,000 to $9,999 | 0 (0.0%) | 0 (0.0%) |
| $10,000 to $14,999 | 20 (0.5%) | 0 (0.0%) |
| $15,000 to $19,999 | 50 (1.4%) | 0 (0.0%) |
| $20,000 to $24,999 | 4 (0.1%) | 0 (0.0%) |
| $25,000 to $34,999 | 205 (5.7%) | 12 (3.2%) |
| $35,000 to $49,999 | 133 (3.7%) | 0 (0.0%) |
| $50,000 to $74,999 | 204 (5.6%) | 36 (9.7%) |
| $75,000 to $99,999 | 286 (7.9%) | 61 (16.4%) |
| $100,000 to $149,999 | 590 (16.3%) | 48 (12.9%) |
| $150,000 or more | 2,080 (57.4%) | 214 (57.7%) |
| Total | 3,622 (100.0%) | 371 (100.0%) |
Monthly Housing Cost Tiers in Clayton
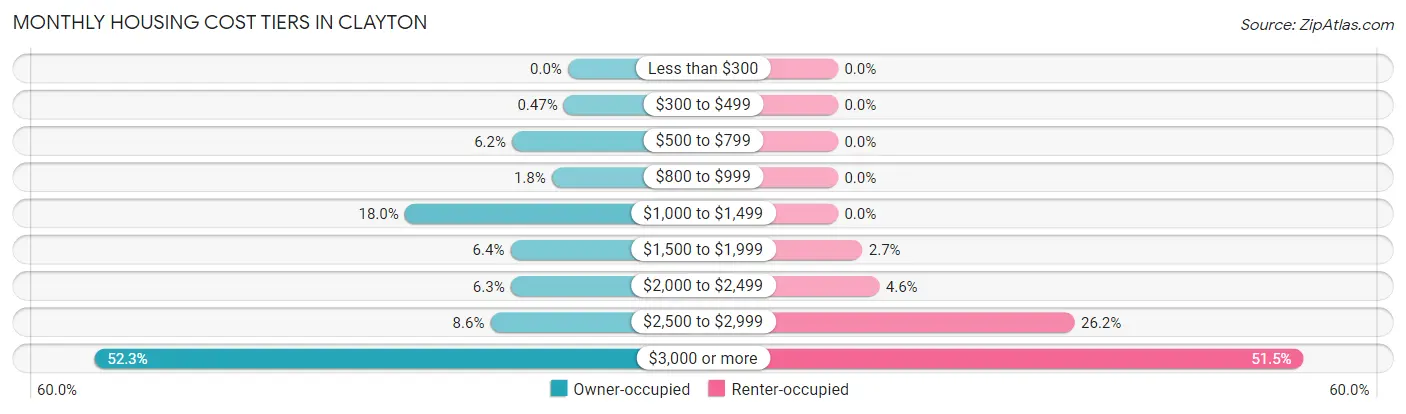
| Monthly Cost | Owner-occupied | Renter-occupied |
| Less than $300 | 0 (0.0%) | 0 (0.0%) |
| $300 to $499 | 17 (0.5%) | 0 (0.0%) |
| $500 to $799 | 224 (6.2%) | 0 (0.0%) |
| $800 to $999 | 65 (1.8%) | 0 (0.0%) |
| $1,000 to $1,499 | 653 (18.0%) | 0 (0.0%) |
| $1,500 to $1,999 | 230 (6.4%) | 10 (2.7%) |
| $2,000 to $2,499 | 229 (6.3%) | 17 (4.6%) |
| $2,500 to $2,999 | 310 (8.6%) | 97 (26.2%) |
| $3,000 or more | 1,894 (52.3%) | 191 (51.5%) |
| Total | 3,622 (100.0%) | 371 (100.0%) |
Physical Housing Characteristics in Clayton
Housing Structures in Clayton
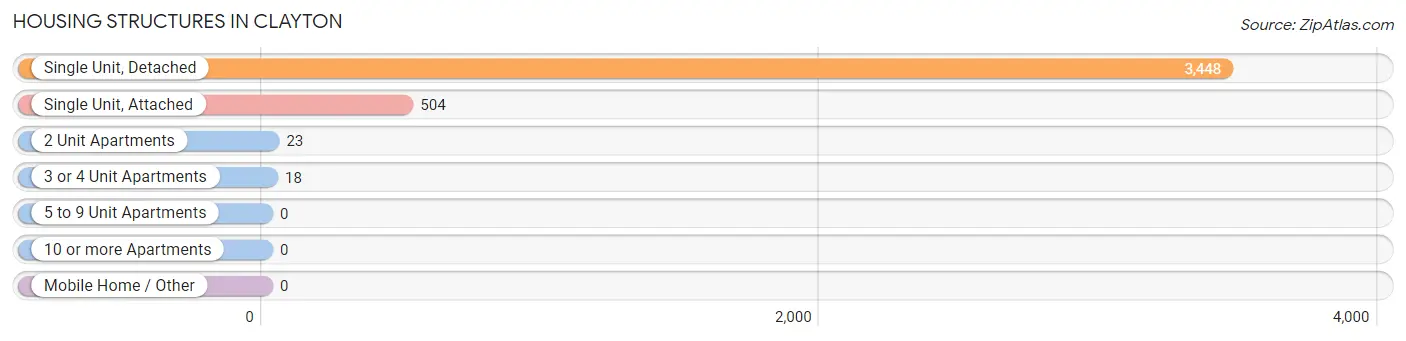
| Structure Type | # Housing Units | % Housing Units |
| Single Unit, Detached | 3,448 | 86.4% |
| Single Unit, Attached | 504 | 12.6% |
| 2 Unit Apartments | 23 | 0.6% |
| 3 or 4 Unit Apartments | 18 | 0.4% |
| 5 to 9 Unit Apartments | 0 | 0.0% |
| 10 or more Apartments | 0 | 0.0% |
| Mobile Home / Other | 0 | 0.0% |
| Total | 3,993 | 100.0% |
Housing Structures by Occupancy in Clayton
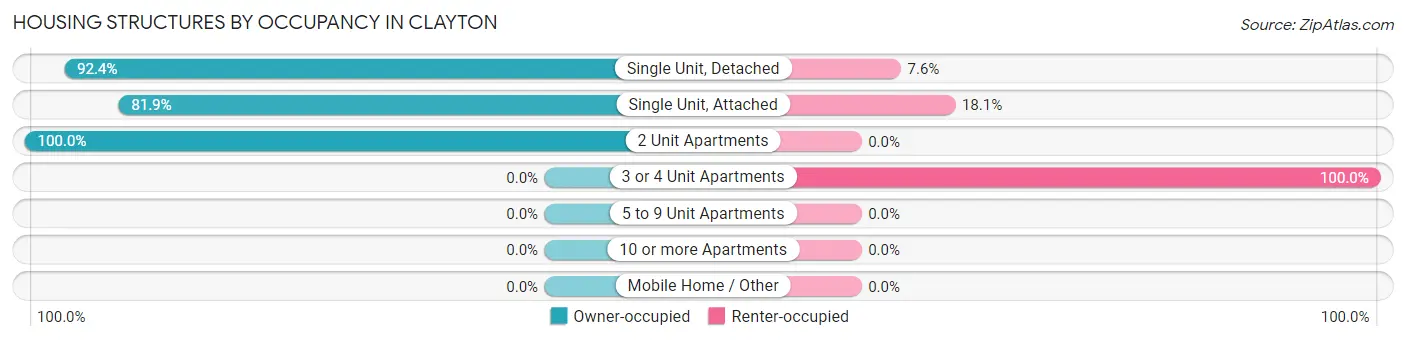
| Structure Type | Owner-occupied | Renter-occupied |
| Single Unit, Detached | 3,186 (92.4%) | 262 (7.6%) |
| Single Unit, Attached | 413 (81.9%) | 91 (18.1%) |
| 2 Unit Apartments | 23 (100.0%) | 0 (0.0%) |
| 3 or 4 Unit Apartments | 0 (0.0%) | 18 (100.0%) |
| 5 to 9 Unit Apartments | 0 (0.0%) | 0 (0.0%) |
| 10 or more Apartments | 0 (0.0%) | 0 (0.0%) |
| Mobile Home / Other | 0 (0.0%) | 0 (0.0%) |
| Total | 3,622 (90.7%) | 371 (9.3%) |
Housing Structures by Number of Rooms in Clayton
| Number of Rooms | Owner-occupied | Renter-occupied |
| 1 Room | 0 (0.0%) | 0 (0.0%) |
| 2 or 3 Rooms | 11 (0.3%) | 0 (0.0%) |
| 4 or 5 Rooms | 605 (16.7%) | 149 (40.2%) |
| 6 or 7 Rooms | 1,581 (43.6%) | 172 (46.4%) |
| 8 or more Rooms | 1,425 (39.3%) | 50 (13.5%) |
| Total | 3,622 (100.0%) | 371 (100.0%) |
Housing Structure by Heating Type in Clayton
| Heating Type | Owner-occupied | Renter-occupied |
| Utility Gas | 2,919 (80.6%) | 190 (51.2%) |
| Bottled, Tank, or LP Gas | 0 (0.0%) | 0 (0.0%) |
| Electricity | 618 (17.1%) | 181 (48.8%) |
| Fuel Oil or Kerosene | 0 (0.0%) | 0 (0.0%) |
| Coal or Coke | 0 (0.0%) | 0 (0.0%) |
| All other Fuels | 85 (2.4%) | 0 (0.0%) |
| No Fuel Used | 0 (0.0%) | 0 (0.0%) |
| Total | 3,622 (100.0%) | 371 (100.0%) |
Household Vehicle Usage in Clayton
| Vehicles per Household | Owner-occupied | Renter-occupied |
| No Vehicle | 128 (3.5%) | 0 (0.0%) |
| 1 Vehicle | 611 (16.9%) | 103 (27.8%) |
| 2 Vehicles | 1,418 (39.2%) | 181 (48.8%) |
| 3 or more Vehicles | 1,465 (40.5%) | 87 (23.4%) |
| Total | 3,622 (100.0%) | 371 (100.0%) |
Real Estate & Mortgages in Clayton
Real Estate and Mortgage Overview in Clayton
| Characteristic | Without Mortgage | With Mortgage |
| Housing Units | 937 | 2,685 |
| Median Property Value | $909,200 | $929,300 |
| Median Household Income | $93,417 | $1,745 |
| Monthly Housing Costs | $1,107 | $1,883 |
| Real Estate Taxes | $6,726 | $0 |
Property Value by Mortgage Status in Clayton
| Property Value | Without Mortgage | With Mortgage |
| Less than $50,000 | 0 (0.0%) | 0 (0.0%) |
| $50,000 to $99,999 | 0 (0.0%) | 0 (0.0%) |
| $100,000 to $299,999 | 0 (0.0%) | 43 (1.6%) |
| $300,000 to $499,999 | 13 (1.4%) | 0 (0.0%) |
| $500,000 to $749,999 | 232 (24.8%) | 388 (14.4%) |
| $750,000 to $999,999 | 351 (37.5%) | 1,271 (47.3%) |
| $1,000,000 or more | 341 (36.4%) | 983 (36.6%) |
| Total | 937 (100.0%) | 2,685 (100.0%) |
Household Income by Mortgage Status in Clayton
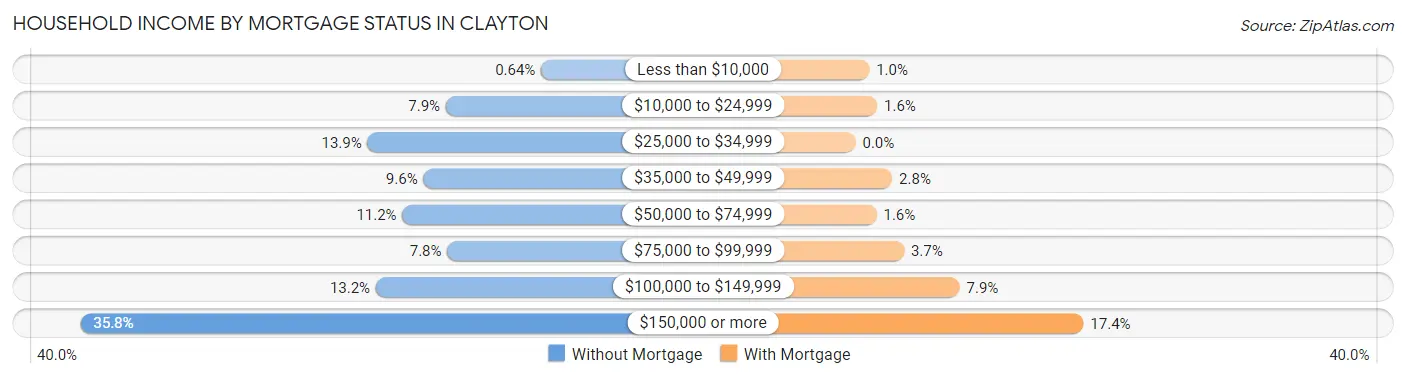
| Household Income | Without Mortgage | With Mortgage |
| Less than $10,000 | 6 (0.6%) | 28 (1.0%) |
| $10,000 to $24,999 | 74 (7.9%) | 44 (1.6%) |
| $25,000 to $34,999 | 130 (13.9%) | 0 (0.0%) |
| $35,000 to $49,999 | 90 (9.6%) | 75 (2.8%) |
| $50,000 to $74,999 | 105 (11.2%) | 43 (1.6%) |
| $75,000 to $99,999 | 73 (7.8%) | 99 (3.7%) |
| $100,000 to $149,999 | 124 (13.2%) | 213 (7.9%) |
| $150,000 or more | 335 (35.7%) | 466 (17.4%) |
| Total | 937 (100.0%) | 2,685 (100.0%) |
Property Value to Household Income Ratio in Clayton
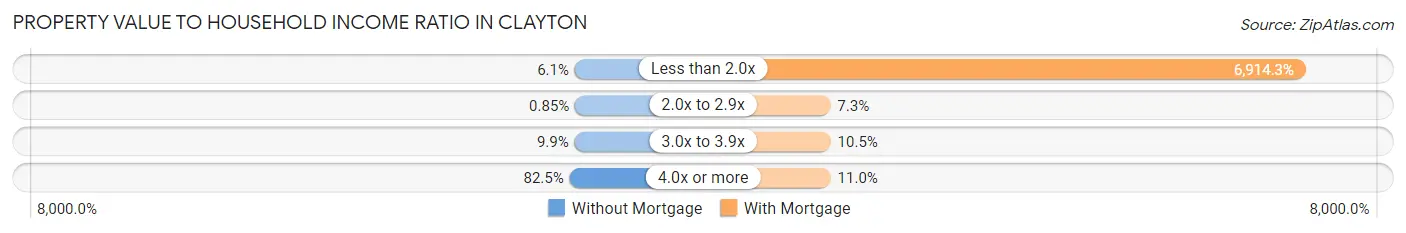
| Value-to-Income Ratio | Without Mortgage | With Mortgage |
| Less than 2.0x | 57 (6.1%) | 185,650 (6,914.3%) |
| 2.0x to 2.9x | 8 (0.9%) | 196 (7.3%) |
| 3.0x to 3.9x | 93 (9.9%) | 283 (10.5%) |
| 4.0x or more | 773 (82.5%) | 296 (11.0%) |
| Total | 937 (100.0%) | 2,685 (100.0%) |
Real Estate Taxes by Mortgage Status in Clayton
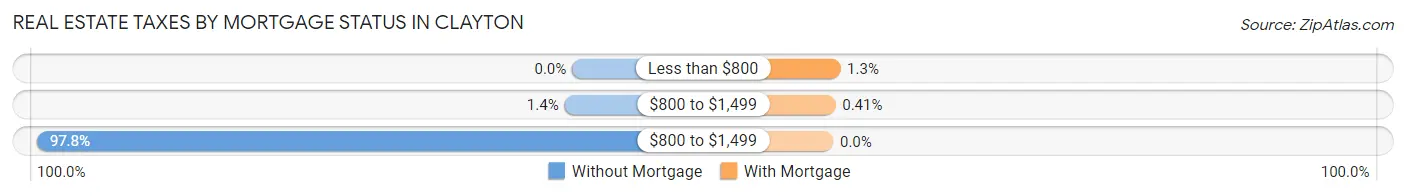
| Property Taxes | Without Mortgage | With Mortgage |
| Less than $800 | 0 (0.0%) | 35 (1.3%) |
| $800 to $1,499 | 13 (1.4%) | 11 (0.4%) |
| $800 to $1,499 | 916 (97.8%) | 0 (0.0%) |
| Total | 937 (100.0%) | 2,685 (100.0%) |
Health & Disability in Clayton
Health Insurance Coverage by Age in Clayton
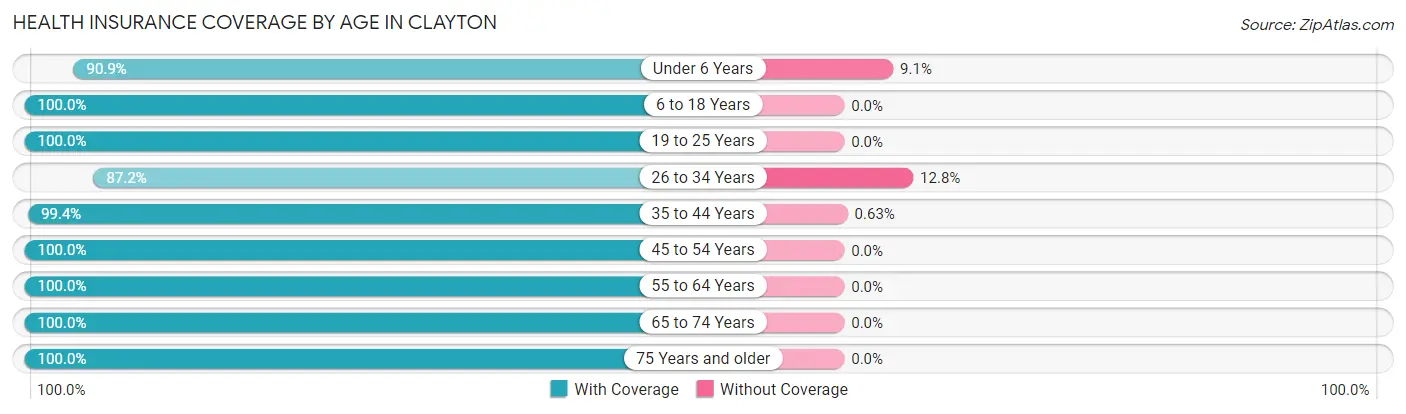
| Age Bracket | With Coverage | Without Coverage |
| Under 6 Years | 519 (90.9%) | 52 (9.1%) |
| 6 to 18 Years | 2,209 (100.0%) | 0 (0.0%) |
| 19 to 25 Years | 936 (100.0%) | 0 (0.0%) |
| 26 to 34 Years | 604 (87.2%) | 89 (12.8%) |
| 35 to 44 Years | 1,255 (99.4%) | 8 (0.6%) |
| 45 to 54 Years | 1,554 (100.0%) | 0 (0.0%) |
| 55 to 64 Years | 1,982 (100.0%) | 0 (0.0%) |
| 65 to 74 Years | 1,057 (100.0%) | 0 (0.0%) |
| 75 Years and older | 805 (100.0%) | 0 (0.0%) |
| Total | 10,921 (98.7%) | 149 (1.3%) |
Health Insurance Coverage by Citizenship Status in Clayton
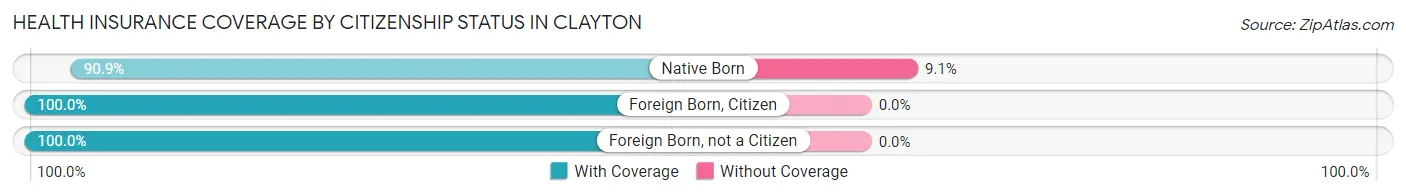
| Citizenship Status | With Coverage | Without Coverage |
| Native Born | 519 (90.9%) | 52 (9.1%) |
| Foreign Born, Citizen | 2,209 (100.0%) | 0 (0.0%) |
| Foreign Born, not a Citizen | 936 (100.0%) | 0 (0.0%) |
Health Insurance Coverage by Household Income in Clayton
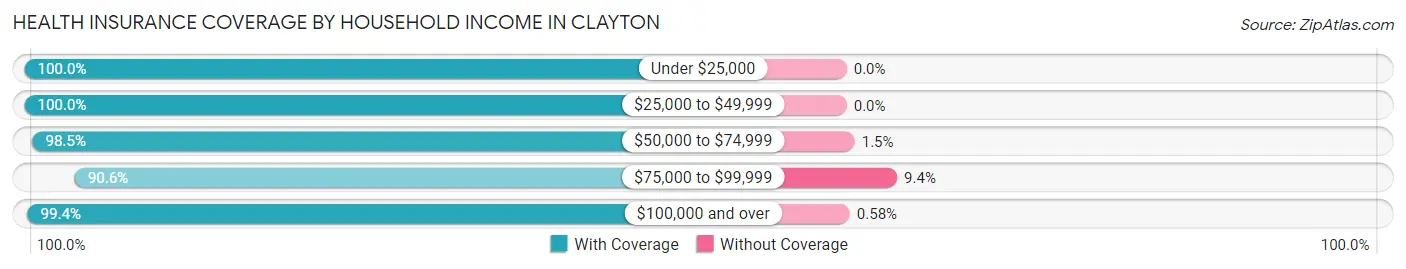
| Household Income | With Coverage | Without Coverage |
| Under $25,000 | 147 (100.0%) | 0 (0.0%) |
| $25,000 to $49,999 | 540 (100.0%) | 0 (0.0%) |
| $50,000 to $74,999 | 524 (98.5%) | 8 (1.5%) |
| $75,000 to $99,999 | 836 (90.6%) | 87 (9.4%) |
| $100,000 and over | 8,846 (99.4%) | 52 (0.6%) |
Public vs Private Health Insurance Coverage by Age in Clayton
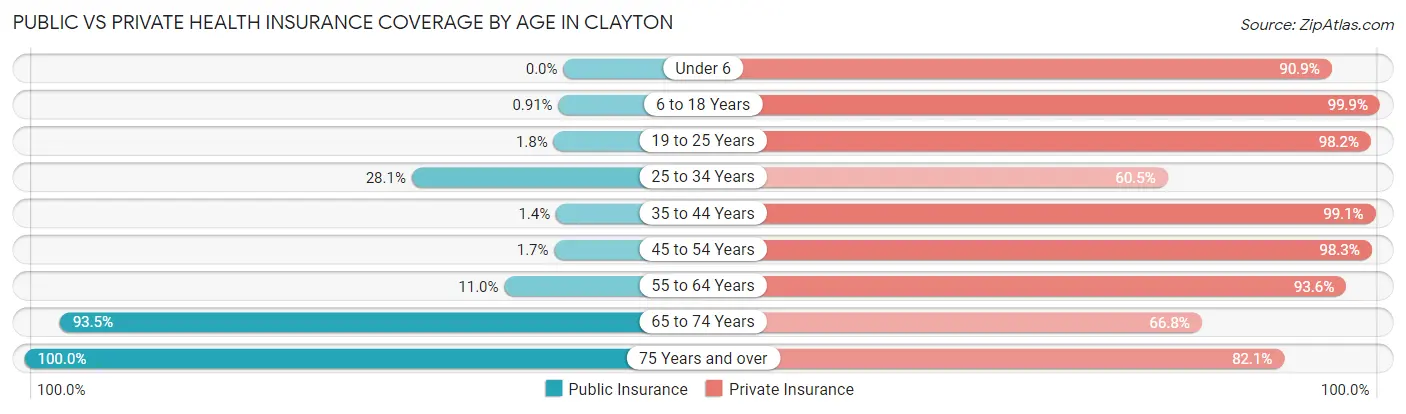
| Age Bracket | Public Insurance | Private Insurance |
| Under 6 | 0 (0.0%) | 519 (90.9%) |
| 6 to 18 Years | 20 (0.9%) | 2,206 (99.9%) |
| 19 to 25 Years | 17 (1.8%) | 919 (98.2%) |
| 25 to 34 Years | 195 (28.1%) | 419 (60.5%) |
| 35 to 44 Years | 17 (1.3%) | 1,251 (99.1%) |
| 45 to 54 Years | 26 (1.7%) | 1,528 (98.3%) |
| 55 to 64 Years | 217 (11.0%) | 1,855 (93.6%) |
| 65 to 74 Years | 988 (93.5%) | 706 (66.8%) |
| 75 Years and over | 805 (100.0%) | 661 (82.1%) |
| Total | 2,285 (20.6%) | 10,064 (90.9%) |
Disability Status by Sex by Age in Clayton
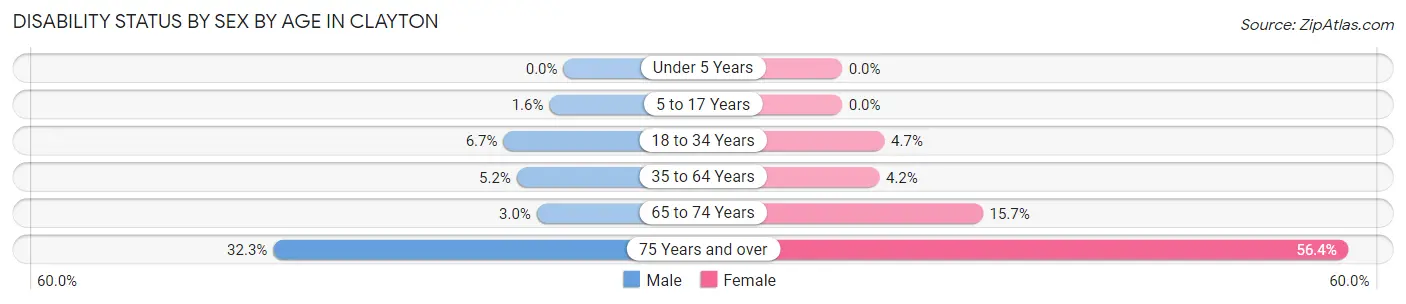
| Age Bracket | Male | Female |
| Under 5 Years | 0 (0.0%) | 0 (0.0%) |
| 5 to 17 Years | 18 (1.6%) | 0 (0.0%) |
| 18 to 34 Years | 60 (6.7%) | 43 (4.7%) |
| 35 to 64 Years | 123 (5.2%) | 101 (4.2%) |
| 65 to 74 Years | 13 (3.0%) | 97 (15.7%) |
| 75 Years and over | 117 (32.3%) | 250 (56.4%) |
Disability Class by Sex by Age in Clayton
Disability Class: Hearing Difficulty
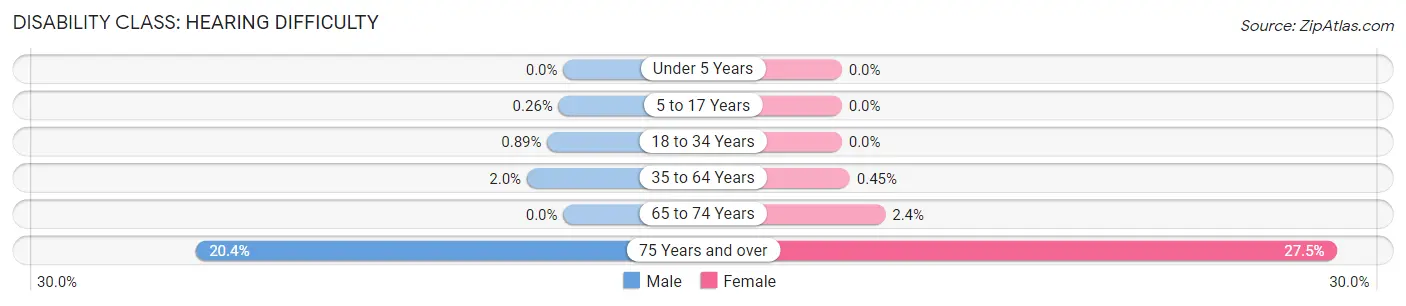
| Age Bracket | Male | Female |
| Under 5 Years | 0 (0.0%) | 0 (0.0%) |
| 5 to 17 Years | 3 (0.3%) | 0 (0.0%) |
| 18 to 34 Years | 8 (0.9%) | 0 (0.0%) |
| 35 to 64 Years | 48 (2.0%) | 11 (0.4%) |
| 65 to 74 Years | 0 (0.0%) | 15 (2.4%) |
| 75 Years and over | 74 (20.4%) | 122 (27.5%) |
Disability Class: Vision Difficulty
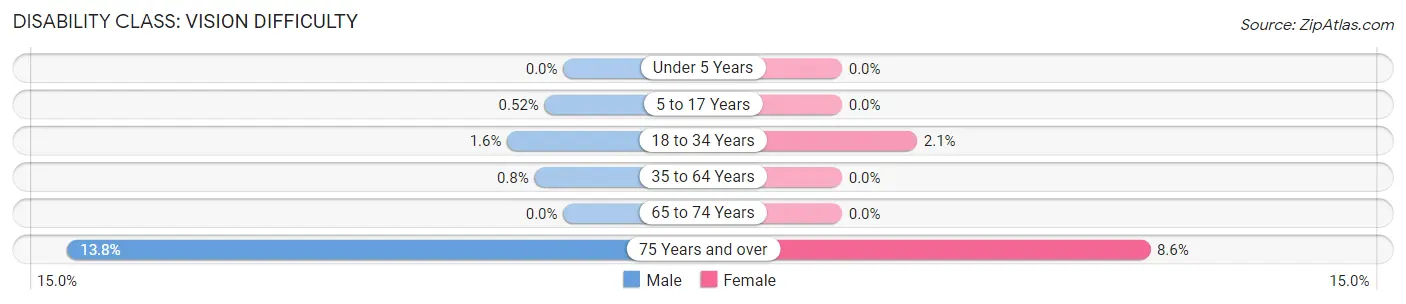
| Age Bracket | Male | Female |
| Under 5 Years | 0 (0.0%) | 0 (0.0%) |
| 5 to 17 Years | 6 (0.5%) | 0 (0.0%) |
| 18 to 34 Years | 14 (1.6%) | 19 (2.1%) |
| 35 to 64 Years | 19 (0.8%) | 0 (0.0%) |
| 65 to 74 Years | 0 (0.0%) | 0 (0.0%) |
| 75 Years and over | 50 (13.8%) | 38 (8.6%) |
Disability Class: Cognitive Difficulty
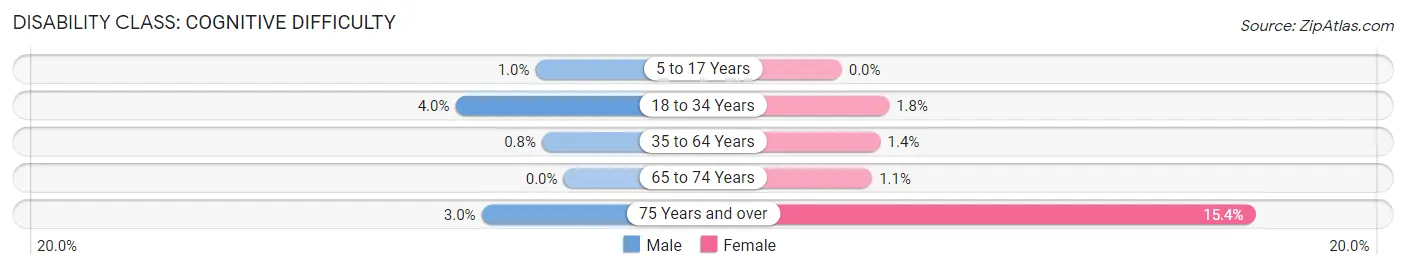
| Age Bracket | Male | Female |
| 5 to 17 Years | 12 (1.0%) | 0 (0.0%) |
| 18 to 34 Years | 36 (4.0%) | 16 (1.8%) |
| 35 to 64 Years | 19 (0.8%) | 35 (1.4%) |
| 65 to 74 Years | 0 (0.0%) | 7 (1.1%) |
| 75 Years and over | 11 (3.0%) | 68 (15.3%) |
Disability Class: Ambulatory Difficulty
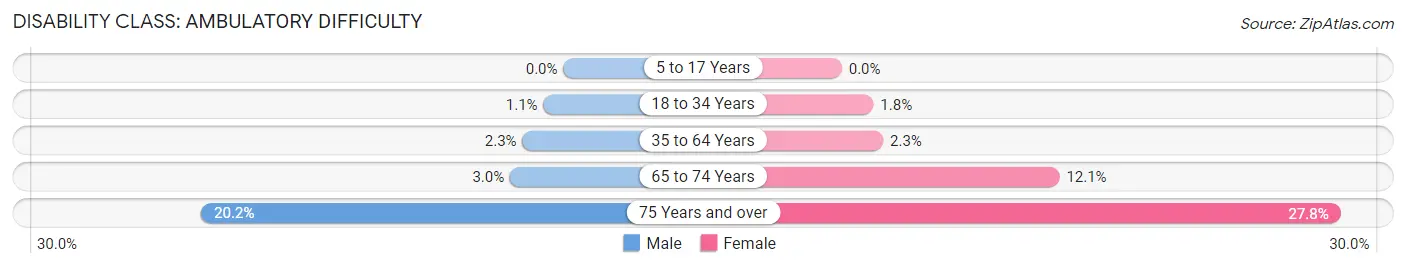
| Age Bracket | Male | Female |
| 5 to 17 Years | 0 (0.0%) | 0 (0.0%) |
| 18 to 34 Years | 10 (1.1%) | 16 (1.8%) |
| 35 to 64 Years | 54 (2.3%) | 56 (2.3%) |
| 65 to 74 Years | 13 (3.0%) | 75 (12.1%) |
| 75 Years and over | 73 (20.2%) | 123 (27.8%) |
Disability Class: Self-Care Difficulty
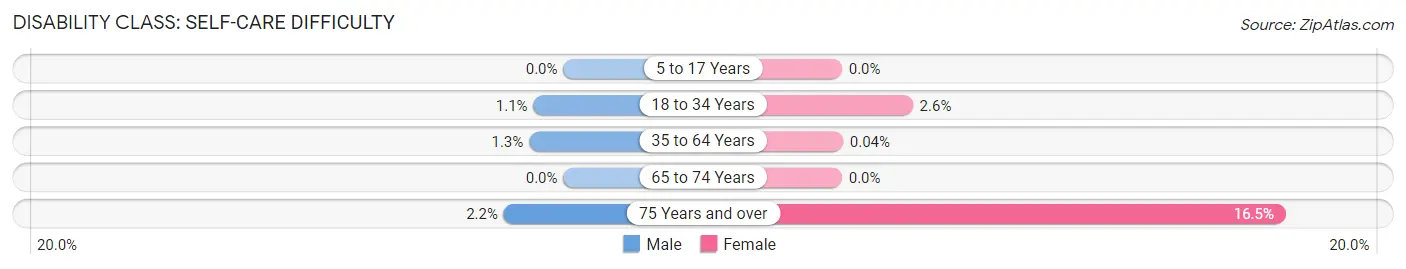
| Age Bracket | Male | Female |
| 5 to 17 Years | 0 (0.0%) | 0 (0.0%) |
| 18 to 34 Years | 10 (1.1%) | 24 (2.6%) |
| 35 to 64 Years | 30 (1.3%) | 1 (0.0%) |
| 65 to 74 Years | 0 (0.0%) | 0 (0.0%) |
| 75 Years and over | 8 (2.2%) | 73 (16.5%) |
Technology Access in Clayton
Computing Device Access in Clayton
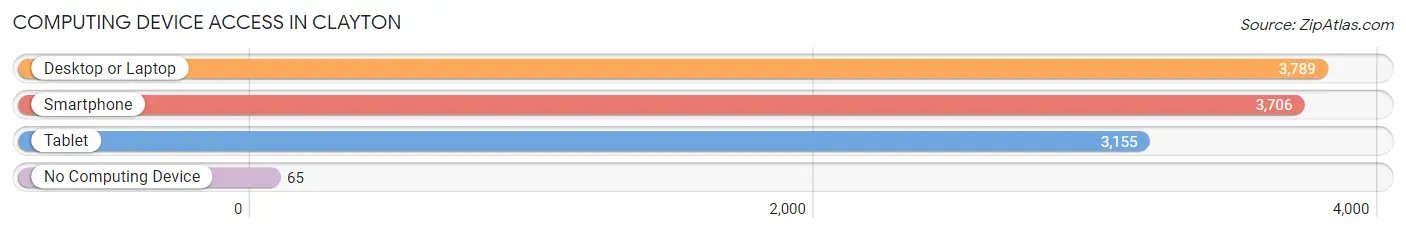
| Device Type | # Households | % Households |
| Desktop or Laptop | 3,789 | 94.9% |
| Smartphone | 3,706 | 92.8% |
| Tablet | 3,155 | 79.0% |
| No Computing Device | 65 | 1.6% |
| Total | 3,993 | 100.0% |
Internet Access in Clayton
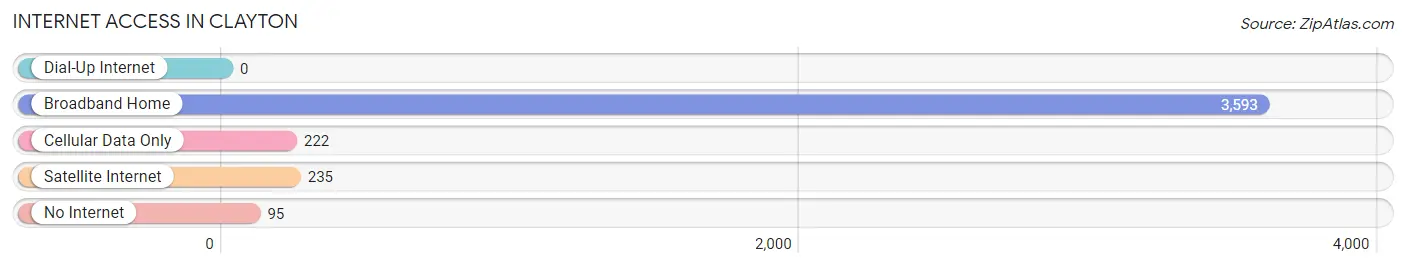
| Internet Type | # Households | % Households |
| Dial-Up Internet | 0 | 0.0% |
| Broadband Home | 3,593 | 90.0% |
| Cellular Data Only | 222 | 5.6% |
| Satellite Internet | 235 | 5.9% |
| No Internet | 95 | 2.4% |
| Total | 3,993 | 100.0% |
Clayton Summary
Clayton is a city located in Contra Costa County, California, United States. The city is situated in the East Bay region of the San Francisco Bay Area, approximately 25 miles east of San Francisco. As of the 2010 census, the population of Clayton was 10,897.
History
Clayton was founded in 1857 by Joel Henry Clayton and his wife, Ruth. The city was named after Joel Henry Clayton, who was a prominent landowner and rancher in the area. The city was incorporated in 1864.
In the late 19th century, Clayton was a popular destination for wealthy San Franciscans who wanted to escape the hustle and bustle of the city. The city was known for its beautiful views of the surrounding hills and valleys, and its rural atmosphere.
Geography
Clayton is located at 37°58'17" North, 121°56'17" West (37.9714, -121.9381). The city is situated in the East Bay region of the San Francisco Bay Area, approximately 25 miles east of San Francisco.
The city has a total area of 4.2 square miles, all of which is land. The city is located in the Diablo Range, and is surrounded by rolling hills and valleys. The city is located near the junction of Marsh Creek and Morgan Territory Creek.
Economy
Clayton is a primarily residential city, and the majority of its residents are employed in the service sector. The city is home to a number of small businesses, including restaurants, retail stores, and professional services.
The city is also home to a number of corporate headquarters, including Chevron, Bank of America, and Kaiser Permanente.
Demographics
As of the 2010 census, the population of Clayton was 10,897. The racial makeup of the city was 79.2% White, 8.2% Asian, 6.3% African American, 0.7% Native American, 0.2% Pacific Islander, and 4.4% from other races.
The median household income in Clayton was $103,844, and the median family income was $118,844. The per capita income in Clayton was $45,844.
The city is served by the Clayton Valley Unified School District, which includes three elementary schools, one middle school, and one high school. The city is also home to Diablo Valley College, a two-year community college.
Conclusion
Clayton is a city located in Contra Costa County, California, United States. The city is situated in the East Bay region of the San Francisco Bay Area, approximately 25 miles east of San Francisco. As of the 2010 census, the population of Clayton was 10,897. The city was founded in 1857 by Joel Henry Clayton and his wife, Ruth, and was incorporated in 1864. Clayton is a primarily residential city, and the majority of its residents are employed in the service sector. The city is also home to a number of corporate headquarters, including Chevron, Bank of America, and Kaiser Permanente. The racial makeup of the city was 79.2% White, 8.2% Asian, 6.3% African American, 0.7% Native American, 0.2% Pacific Islander, and 4.4% from other races. The median household income in Clayton was $103,844, and the median family income was $118,844. The city is served by the Clayton Valley Unified School District, which includes three elementary schools, one middle school, and one high school. The city is also home to Diablo Valley College, a two-year community college.
Common Questions
What is Per Capita Income in Clayton?
Per Capita income in Clayton is $75,862.
What is the Median Family Income in Clayton?
Median Family Income in Clayton is $184,693.
What is the Median Household income in Clayton?
Median Household Income in Clayton is $164,899.
What is Income or Wage Gap in Clayton?
Income or Wage Gap in Clayton is 50.7%.
Women in Clayton earn 49.3 cents for every dollar earned by a man.
What is Inequality or Gini Index in Clayton?
Inequality or Gini Index in Clayton is 0.43.
What is the Total Population of Clayton?
Total Population of Clayton is 11,070.
What is the Total Male Population of Clayton?
Total Male Population of Clayton is 5,465.
What is the Total Female Population of Clayton?
Total Female Population of Clayton is 5,605.
What is the Ratio of Males per 100 Females in Clayton?
There are 97.50 Males per 100 Females in Clayton.
What is the Ratio of Females per 100 Males in Clayton?
There are 102.56 Females per 100 Males in Clayton.
What is the Median Population Age in Clayton?
Median Population Age in Clayton is 44.4 Years.
What is the Average Family Size in Clayton
Average Family Size in Clayton is 3.2 People.
What is the Average Household Size in Clayton
Average Household Size in Clayton is 2.8 People.
How Large is the Labor Force in Clayton?
There are 5,418 People in the Labor Forcein in Clayton.
What is the Percentage of People in the Labor Force in Clayton?
62.2% of People are in the Labor Force in Clayton.
What is the Unemployment Rate in Clayton?
Unemployment Rate in Clayton is 5.4%.