Cities with the Lowest Poverty Level Among Seniors Over the Age of 75 in Oklahoma
RELATED REPORTS & OPTIONS
Lowest Poverty | Seniors 75+
Oklahoma
Compare Cities
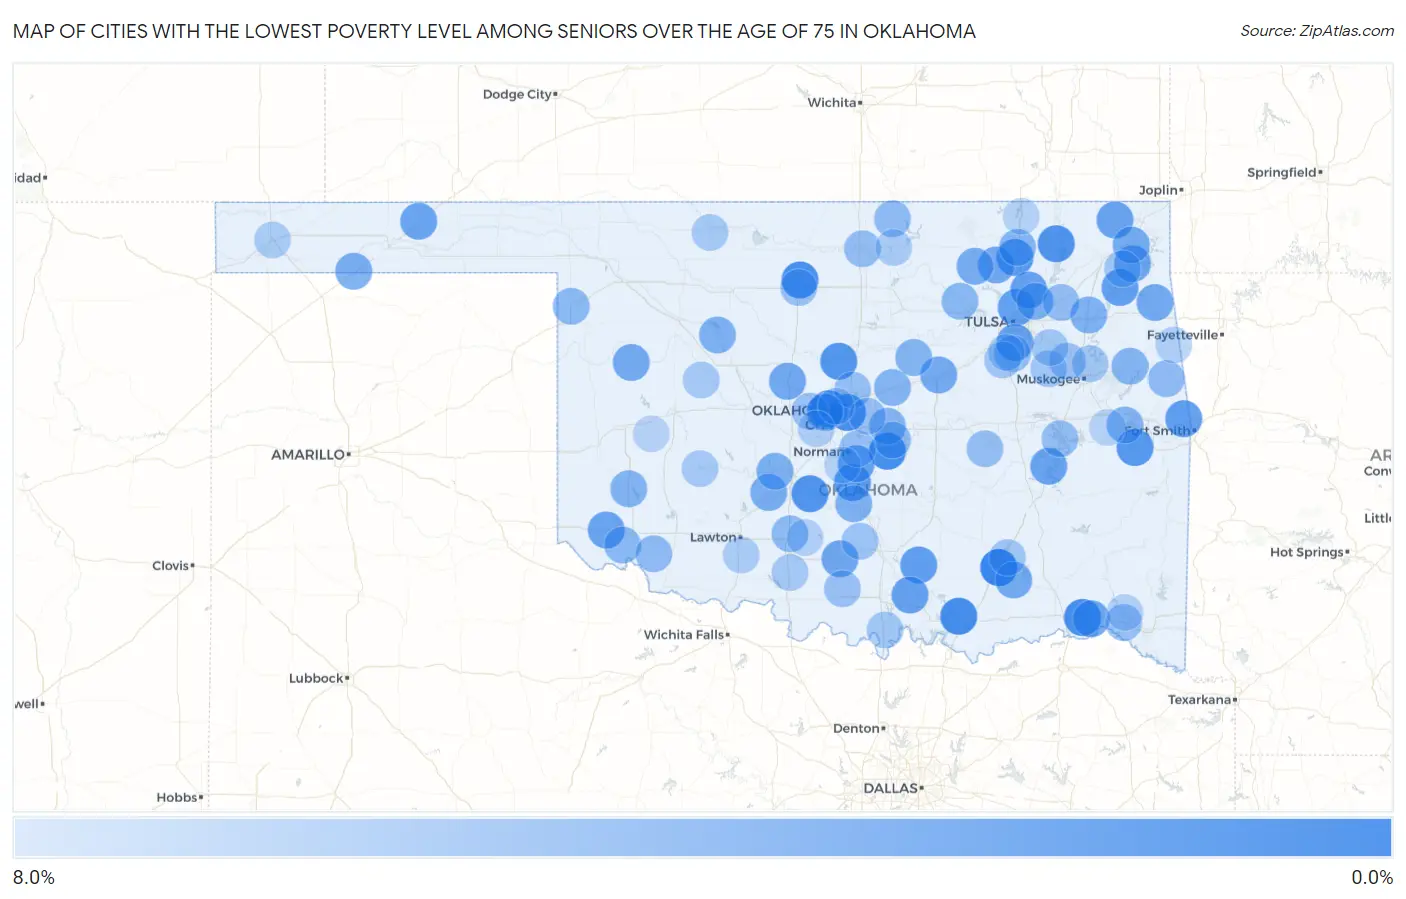
Map of Cities with the Lowest Poverty Level Among Seniors Over the Age of 75 in Oklahoma
8.0%
0.0%
Cities with the Lowest Poverty Level Among Seniors Over the Age of 75 in Oklahoma
| City | Senior Poverty | vs State | vs National | |
| 1. | Atoka | 0.45% | 9.7%(-9.26)#1 | 11.1%(-10.6)#46 |
| 2. | Cookson | 0.78% | 9.7%(-8.93)#2 | 11.1%(-10.3)#101 |
| 3. | Pink | 1.0% | 9.7%(-8.68)#3 | 11.1%(-10.0)#146 |
| 4. | Sawyer | 1.1% | 9.7%(-8.65)#4 | 11.1%(-10.0)#151 |
| 5. | Silo | 1.1% | 9.7%(-8.59)#5 | 11.1%(-9.94)#168 |
| 6. | Warr Acres | 1.2% | 9.7%(-8.49)#6 | 11.1%(-9.85)#188 |
| 7. | North Enid | 1.2% | 9.7%(-8.48)#7 | 11.1%(-9.83)#194 |
| 8. | Forest Park | 1.3% | 9.7%(-8.39)#8 | 11.1%(-9.75)#227 |
| 9. | Nowata | 1.6% | 9.7%(-8.15)#9 | 11.1%(-9.51)#319 |
| 10. | Alex | 1.7% | 9.7%(-8.01)#10 | 11.1%(-9.37)#381 |
| 11. | Cedar Valley | 1.8% | 9.7%(-7.96)#11 | 11.1%(-9.31)#409 |
| 12. | Keota | 2.0% | 9.7%(-7.75)#12 | 11.1%(-9.11)#500 |
| 13. | Purcell | 2.0% | 9.7%(-7.70)#13 | 11.1%(-9.05)#527 |
| 14. | Ochelata | 2.0% | 9.7%(-7.67)#14 | 11.1%(-9.03)#550 |
| 15. | Norwood | 2.3% | 9.7%(-7.41)#15 | 11.1%(-8.77)#721 |
| 16. | Remy | 2.3% | 9.7%(-7.38)#16 | 11.1%(-8.74)#738 |
| 17. | Mill Creek | 2.3% | 9.7%(-7.38)#17 | 11.1%(-8.74)#740 |
| 18. | Spavinaw | 2.4% | 9.7%(-7.27)#18 | 11.1%(-8.63)#811 |
| 19. | Turley | 2.5% | 9.7%(-7.24)#19 | 11.1%(-8.60)#831 |
| 20. | Jenks | 2.5% | 9.7%(-7.17)#20 | 11.1%(-8.53)#885 |
| 21. | Collinsville | 2.6% | 9.7%(-7.15)#21 | 11.1%(-8.50)#894 |
| 22. | Mannsville | 2.6% | 9.7%(-7.11)#22 | 11.1%(-8.47)#927 |
| 23. | Noble | 2.6% | 9.7%(-7.07)#23 | 11.1%(-8.42)#961 |
| 24. | Welch | 2.7% | 9.7%(-7.01)#24 | 11.1%(-8.36)#1,002 |
| 25. | East Duke | 2.7% | 9.7%(-7.01)#25 | 11.1%(-8.36)#1,004 |
| 26. | Crowder | 2.8% | 9.7%(-6.93)#26 | 11.1%(-8.29)#1,066 |
| 27. | Hooker | 2.9% | 9.7%(-6.85)#27 | 11.1%(-8.21)#1,126 |
| 28. | Fort Towson | 2.9% | 9.7%(-6.81)#28 | 11.1%(-8.17)#1,165 |
| 29. | Cleora | 3.0% | 9.7%(-6.72)#29 | 11.1%(-8.08)#1,223 |
| 30. | Ratliff City | 3.1% | 9.7%(-6.63)#30 | 11.1%(-7.99)#1,306 |
| 31. | Barnsdall | 3.1% | 9.7%(-6.58)#31 | 11.1%(-7.94)#1,343 |
| 32. | Okarche | 3.2% | 9.7%(-6.54)#32 | 11.1%(-7.89)#1,383 |
| 33. | Leedey | 3.2% | 9.7%(-6.48)#33 | 11.1%(-7.84)#1,434 |
| 34. | Cloud Creek | 3.2% | 9.7%(-6.48)#34 | 11.1%(-7.84)#1,444 |
| 35. | Stroud | 3.3% | 9.7%(-6.45)#35 | 11.1%(-7.81)#1,467 |
| 36. | Afton | 3.3% | 9.7%(-6.41)#36 | 11.1%(-7.77)#1,498 |
| 37. | Lane | 3.3% | 9.7%(-6.38)#37 | 11.1%(-7.73)#1,533 |
| 38. | Wynona | 3.4% | 9.7%(-6.30)#38 | 11.1%(-7.66)#1,606 |
| 39. | Woodlawn Park | 3.4% | 9.7%(-6.26)#39 | 11.1%(-7.62)#1,647 |
| 40. | Texhoma | 3.5% | 9.7%(-6.20)#40 | 11.1%(-7.56)#1,680 |
| 41. | Cement | 3.6% | 9.7%(-6.14)#41 | 11.1%(-7.50)#1,752 |
| 42. | Owasso | 3.6% | 9.7%(-6.07)#42 | 11.1%(-7.43)#1,812 |
| 43. | Verden | 3.8% | 9.7%(-5.94)#43 | 11.1%(-7.29)#1,951 |
| 44. | Chouteau | 3.8% | 9.7%(-5.91)#44 | 11.1%(-7.27)#1,969 |
| 45. | Canton | 3.8% | 9.7%(-5.86)#45 | 11.1%(-7.22)#2,016 |
| 46. | Maysville | 3.9% | 9.7%(-5.84)#46 | 11.1%(-7.19)#2,049 |
| 47. | Mcloud | 4.0% | 9.7%(-5.71)#47 | 11.1%(-7.07)#2,167 |
| 48. | Tamaha | 4.1% | 9.7%(-5.66)#48 | 11.1%(-7.01)#2,231 |
| 49. | Granite | 4.1% | 9.7%(-5.63)#49 | 11.1%(-6.99)#2,258 |
| 50. | Park Hill | 4.2% | 9.7%(-5.54)#50 | 11.1%(-6.90)#2,331 |
| 51. | Wellston | 4.2% | 9.7%(-5.54)#51 | 11.1%(-6.90)#2,341 |
| 52. | Agra | 4.2% | 9.7%(-5.54)#52 | 11.1%(-6.90)#2,343 |
| 53. | Bartlesville | 4.2% | 9.7%(-5.53)#53 | 11.1%(-6.89)#2,368 |
| 54. | Cleveland | 4.3% | 9.7%(-5.38)#54 | 11.1%(-6.73)#2,500 |
| 55. | Olustee | 4.3% | 9.7%(-5.36)#55 | 11.1%(-6.72)#2,530 |
| 56. | Shattuck | 4.4% | 9.7%(-5.30)#56 | 11.1%(-6.66)#2,597 |
| 57. | Marlow | 4.5% | 9.7%(-5.24)#57 | 11.1%(-6.60)#2,646 |
| 58. | Tipton | 4.5% | 9.7%(-5.16)#58 | 11.1%(-6.52)#2,737 |
| 59. | Cherry Tree | 4.7% | 9.7%(-5.06)#59 | 11.1%(-6.42)#2,858 |
| 60. | Newkirk | 4.7% | 9.7%(-5.04)#60 | 11.1%(-6.40)#2,876 |
| 61. | Bethel Acres | 4.7% | 9.7%(-5.02)#61 | 11.1%(-6.38)#2,889 |
| 62. | Glenpool | 4.8% | 9.7%(-4.93)#62 | 11.1%(-6.29)#2,984 |
| 63. | Tonkawa | 4.8% | 9.7%(-4.86)#63 | 11.1%(-6.22)#3,049 |
| 64. | Justice | 4.9% | 9.7%(-4.85)#64 | 11.1%(-6.20)#3,058 |
| 65. | Wetumka | 4.9% | 9.7%(-4.81)#65 | 11.1%(-6.17)#3,087 |
| 66. | Norman | 4.9% | 9.7%(-4.79)#66 | 11.1%(-6.15)#3,105 |
| 67. | Eufaula | 5.0% | 9.7%(-4.75)#67 | 11.1%(-6.11)#3,155 |
| 68. | Edmond | 5.0% | 9.7%(-4.73)#68 | 11.1%(-6.09)#3,171 |
| 69. | Healdton | 5.0% | 9.7%(-4.71)#69 | 11.1%(-6.07)#3,190 |
| 70. | Porter | 5.0% | 9.7%(-4.71)#70 | 11.1%(-6.07)#3,204 |
| 71. | Millerton | 5.0% | 9.7%(-4.71)#71 | 11.1%(-6.07)#3,225 |
| 72. | Choctaw | 5.0% | 9.7%(-4.68)#72 | 11.1%(-6.04)#3,243 |
| 73. | Enid | 5.0% | 9.7%(-4.67)#73 | 11.1%(-6.02)#3,258 |
| 74. | Yukon | 5.1% | 9.7%(-4.63)#74 | 11.1%(-5.99)#3,296 |
| 75. | Katie | 5.3% | 9.7%(-4.45)#75 | 11.1%(-5.80)#3,488 |
| 76. | Haskell | 5.4% | 9.7%(-4.30)#76 | 11.1%(-5.65)#3,620 |
| 77. | Mounds | 5.5% | 9.7%(-4.26)#77 | 11.1%(-5.61)#3,657 |
| 78. | Marietta | 5.5% | 9.7%(-4.22)#78 | 11.1%(-5.57)#3,689 |
| 79. | Ketchum | 5.6% | 9.7%(-4.15)#79 | 11.1%(-5.51)#3,768 |
| 80. | Stringtown | 5.6% | 9.7%(-4.15)#80 | 11.1%(-5.51)#3,776 |
| 81. | Okay | 5.6% | 9.7%(-4.15)#81 | 11.1%(-5.51)#3,777 |
| 82. | Coweta | 5.6% | 9.7%(-4.14)#82 | 11.1%(-5.50)#3,809 |
| 83. | Bethany | 5.7% | 9.7%(-4.06)#83 | 11.1%(-5.42)#3,873 |
| 84. | Comanche | 5.7% | 9.7%(-4.02)#84 | 11.1%(-5.38)#3,919 |
| 85. | Mountain View | 5.7% | 9.7%(-4.00)#85 | 11.1%(-5.35)#3,936 |
| 86. | Alva | 5.8% | 9.7%(-3.95)#86 | 11.1%(-5.30)#3,989 |
| 87. | Thomas | 5.8% | 9.7%(-3.94)#87 | 11.1%(-5.30)#3,994 |
| 88. | Nichols Hills | 5.8% | 9.7%(-3.86)#88 | 11.1%(-5.22)#4,070 |
| 89. | Kiefer | 5.9% | 9.7%(-3.83)#89 | 11.1%(-5.18)#4,103 |
| 90. | Geronimo | 5.9% | 9.7%(-3.83)#90 | 11.1%(-5.18)#4,110 |
| 91. | Boise City | 5.9% | 9.7%(-3.77)#91 | 11.1%(-5.13)#4,194 |
| 92. | Mccord | 6.0% | 9.7%(-3.74)#92 | 11.1%(-5.10)#4,221 |
| 93. | Mustang | 6.1% | 9.7%(-3.57)#93 | 11.1%(-4.93)#4,409 |
| 94. | Westville | 6.2% | 9.7%(-3.46)#94 | 11.1%(-4.82)#4,511 |
| 95. | Bray | 6.2% | 9.7%(-3.46)#95 | 11.1%(-4.82)#4,524 |
| 96. | Wright City | 6.2% | 9.7%(-3.46)#96 | 11.1%(-4.82)#4,541 |
| 97. | Goldsby | 6.3% | 9.7%(-3.40)#97 | 11.1%(-4.76)#4,605 |
| 98. | Copan | 6.3% | 9.7%(-3.38)#98 | 11.1%(-4.74)#4,627 |
| 99. | Simms | 6.4% | 9.7%(-3.33)#99 | 11.1%(-4.68)#4,691 |
| 100. | Burns Flat | 6.4% | 9.7%(-3.28)#100 | 11.1%(-4.64)#4,731 |
Common Questions
What are the Top 10 Cities with the Lowest Poverty Level Among Seniors Over the Age of 75 in Oklahoma?
Top 10 Cities with the Lowest Poverty Level Among Seniors Over the Age of 75 in Oklahoma are:
#1
0.45%
#2
1.0%
#3
1.1%
#4
1.1%
#5
1.2%
#6
1.2%
#7
1.3%
#8
1.6%
#9
1.7%
#10
1.8%
What city has the Lowest Poverty Level Among Seniors Over the Age of 75 in Oklahoma?
Atoka has the Lowest Poverty Level Among Seniors Over the Age of 75 in Oklahoma with 0.45%.
What is the Poverty Level Among Seniors Over the Age of 75 in the State of Oklahoma?
Poverty Level Among Seniors Over the Age of 75 in Oklahoma is 9.7%.
What is the Poverty Level Among Seniors Over the Age of 75 in the United States?
Poverty Level Among Seniors Over the Age of 75 in the United States is 11.1%.