San Diego Country Estates, CA Map & Demographics
San Diego Country Estates Map
San Diego Country Estates Overview
$52,900
PER CAPITA INCOME
$137,656
AVG FAMILY INCOME
$135,785
AVG HOUSEHOLD INCOME
18.6%
WAGE / INCOME GAP [ % ]
81.4¢/ $1
WAGE / INCOME GAP [ $ ]
0.28
INEQUALITY / GINI INDEX
10,241
TOTAL POPULATION
5,463
MALE POPULATION
4,778
FEMALE POPULATION
114.34
MALES / 100 FEMALES
87.46
FEMALES / 100 MALES
44.1
MEDIAN AGE
3.2
AVG FAMILY SIZE
3.0
AVG HOUSEHOLD SIZE
5,414
LABOR FORCE [ PEOPLE ]
66.1%
PERCENT IN LABOR FORCE
3.1%
UNEMPLOYMENT RATE
Income in San Diego Country Estates
Income Overview in San Diego Country Estates
Per Capita Income in San Diego Country Estates is $52,900, while median incomes of families and households are $137,656 and $135,785 respectively.
| Characteristic | Number | Measure |
| Per Capita Income | 10,241 | $52,900 |
| Median Family Income | 2,860 | $137,656 |
| Mean Family Income | 2,860 | $157,212 |
| Median Household Income | 3,382 | $135,785 |
| Mean Household Income | 3,382 | $153,652 |
| Income Deficit | 2,860 | $0 |
| Wage / Income Gap (%) | 10,241 | 18.61% |
| Wage / Income Gap ($) | 10,241 | 81.39¢ per $1 |
| Gini / Inequality Index | 10,241 | 0.28 |
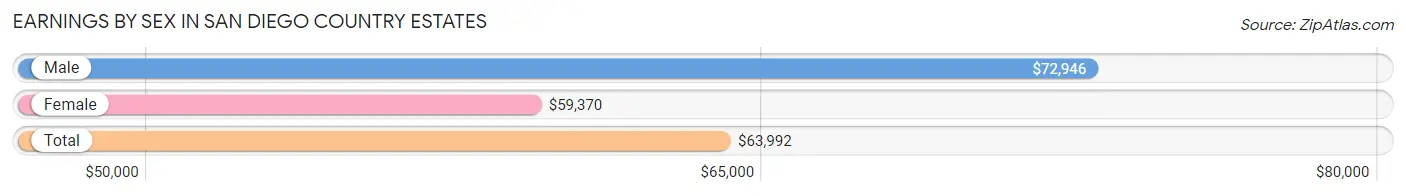
Earnings by Sex in San Diego Country Estates
Average Earnings in San Diego Country Estates are $63,992, $72,946 for men and $59,370 for women, a difference of 18.6%.
| Sex | Number | Average Earnings |
| Male | 3,278 (59.7%) | $72,946 |
| Female | 2,209 (40.3%) | $59,370 |
| Total | 5,487 (100.0%) | $63,992 |
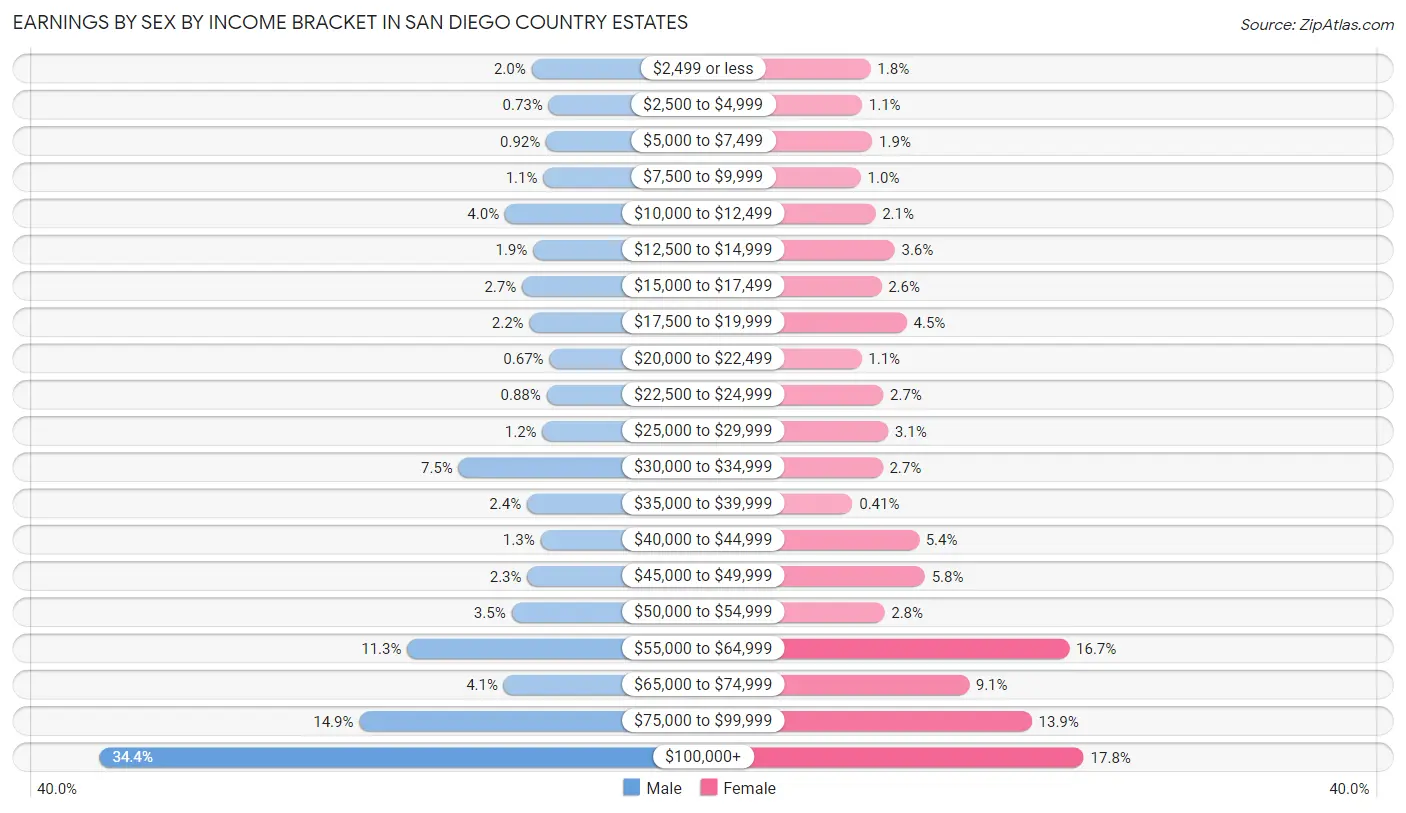
Earnings by Sex by Income Bracket in San Diego Country Estates
The most common earnings brackets in San Diego Country Estates are $100,000+ for men (1,127 | 34.4%) and $100,000+ for women (392 | 17.7%).
| Income | Male | Female |
| $2,499 or less | 66 (2.0%) | 39 (1.8%) |
| $2,500 to $4,999 | 24 (0.7%) | 25 (1.1%) |
| $5,000 to $7,499 | 30 (0.9%) | 42 (1.9%) |
| $7,500 to $9,999 | 37 (1.1%) | 23 (1.0%) |
| $10,000 to $12,499 | 131 (4.0%) | 47 (2.1%) |
| $12,500 to $14,999 | 62 (1.9%) | 79 (3.6%) |
| $15,000 to $17,499 | 89 (2.7%) | 57 (2.6%) |
| $17,500 to $19,999 | 71 (2.2%) | 99 (4.5%) |
| $20,000 to $22,499 | 22 (0.7%) | 24 (1.1%) |
| $22,500 to $24,999 | 29 (0.9%) | 60 (2.7%) |
| $25,000 to $29,999 | 39 (1.2%) | 68 (3.1%) |
| $30,000 to $34,999 | 245 (7.5%) | 59 (2.7%) |
| $35,000 to $39,999 | 77 (2.4%) | 9 (0.4%) |
| $40,000 to $44,999 | 44 (1.3%) | 119 (5.4%) |
| $45,000 to $49,999 | 76 (2.3%) | 129 (5.8%) |
| $50,000 to $54,999 | 115 (3.5%) | 62 (2.8%) |
| $55,000 to $64,999 | 371 (11.3%) | 368 (16.7%) |
| $65,000 to $74,999 | 134 (4.1%) | 202 (9.1%) |
| $75,000 to $99,999 | 489 (14.9%) | 306 (13.9%) |
| $100,000+ | 1,127 (34.4%) | 392 (17.7%) |
| Total | 3,278 (100.0%) | 2,209 (100.0%) |
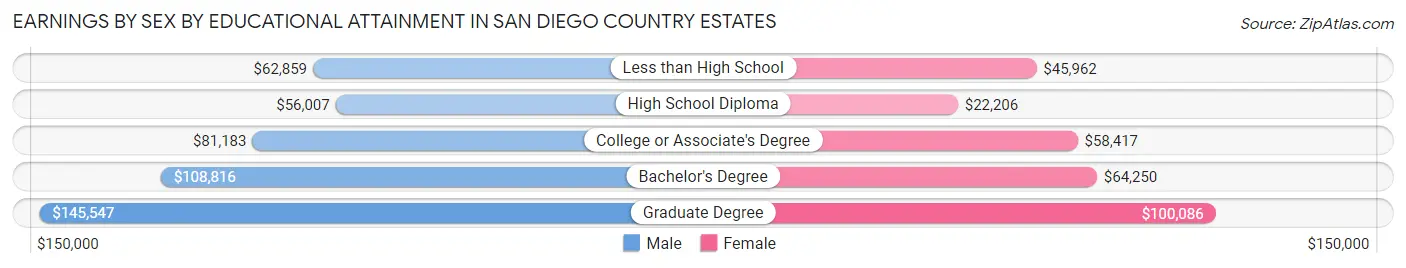
Earnings by Sex by Educational Attainment in San Diego Country Estates
Average earnings in San Diego Country Estates are $81,721 for men and $60,525 for women, a difference of 25.9%. Men with an educational attainment of graduate degree enjoy the highest average annual earnings of $145,547, while those with high school diploma education earn the least with $56,007. Women with an educational attainment of graduate degree earn the most with the average annual earnings of $100,086, while those with high school diploma education have the smallest earnings of $22,206.
| Educational Attainment | Male Income | Female Income |
| Less than High School | $62,859 | $45,962 |
| High School Diploma | $56,007 | $22,206 |
| College or Associate's Degree | $81,183 | $58,417 |
| Bachelor's Degree | $108,816 | $64,250 |
| Graduate Degree | $145,547 | $100,086 |
| Total | $81,721 | $60,525 |
Family Income in San Diego Country Estates
Family Income Brackets in San Diego Country Estates
According to the San Diego Country Estates family income data, there are 869 families falling into the $100,000 to $149,999 income range, which is the most common income bracket and makes up 30.4% of all families.
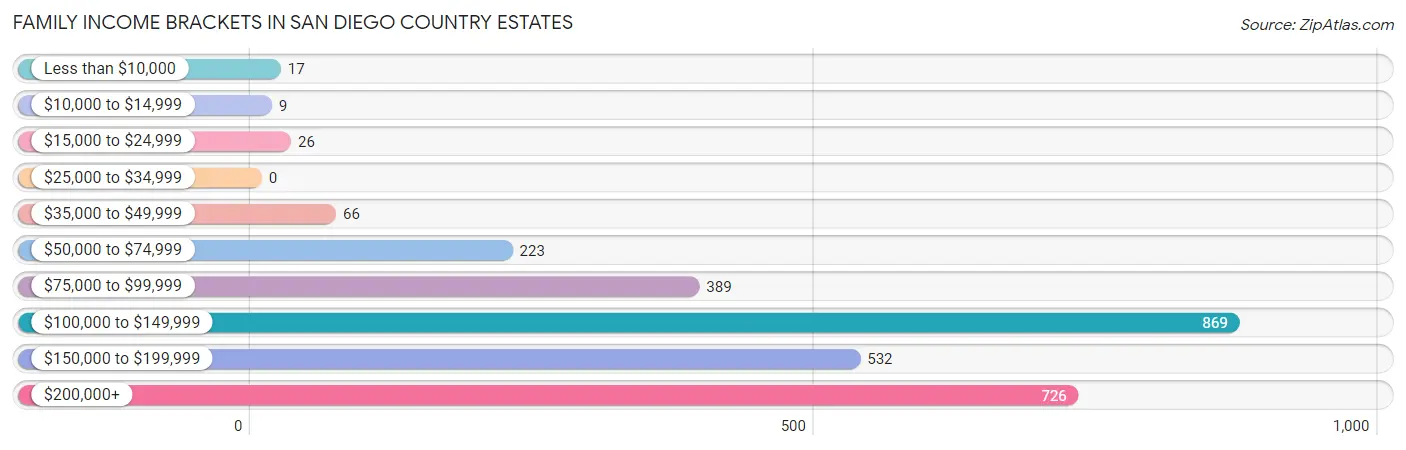
| Income Bracket | # Families | % Families |
| Less than $10,000 | 17 | 0.6% |
| $10,000 to $14,999 | 9 | 0.3% |
| $15,000 to $24,999 | 26 | 0.9% |
| $25,000 to $34,999 | 0 | 0.0% |
| $35,000 to $49,999 | 66 | 2.3% |
| $50,000 to $74,999 | 223 | 7.8% |
| $75,000 to $99,999 | 389 | 13.6% |
| $100,000 to $149,999 | 869 | 30.4% |
| $150,000 to $199,999 | 532 | 18.6% |
| $200,000+ | 726 | 25.4% |
Family Income by Famaliy Size in San Diego Country Estates
3-person families (659 | 23.0%) account for the highest median family income in San Diego Country Estates with $182,716 per family, while 3-person families (659 | 23.0%) have the highest median income of $60,905 per family member.
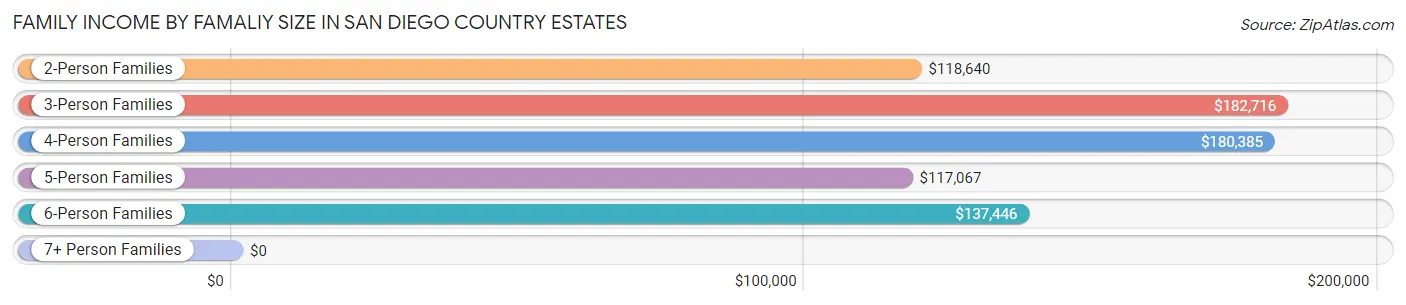
| Income Bracket | # Families | Median Income |
| 2-Person Families | 1,300 (45.5%) | $118,640 |
| 3-Person Families | 659 (23.0%) | $182,716 |
| 4-Person Families | 510 (17.8%) | $180,385 |
| 5-Person Families | 288 (10.1%) | $117,067 |
| 6-Person Families | 85 (3.0%) | $137,446 |
| 7+ Person Families | 18 (0.6%) | $0 |
| Total | 2,860 (100.0%) | $137,656 |
Family Income by Number of Earners in San Diego Country Estates
The median family income in San Diego Country Estates is $137,656, with families comprising 3+ earners (314) having the highest median family income of $187,500, while families with no earners (333) have the lowest median family income of $93,531, accounting for 11.0% and 11.6% of families, respectively.
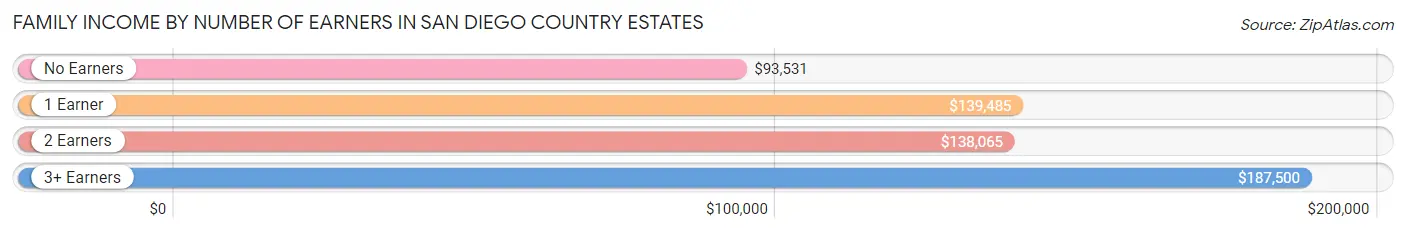
| Number of Earners | # Families | Median Income |
| No Earners | 333 (11.6%) | $93,531 |
| 1 Earner | 885 (30.9%) | $139,485 |
| 2 Earners | 1,328 (46.4%) | $138,065 |
| 3+ Earners | 314 (11.0%) | $187,500 |
| Total | 2,860 (100.0%) | $137,656 |
Household Income in San Diego Country Estates
Household Income Brackets in San Diego Country Estates
With 1,146 households falling in the category, the $100,000 to $149,999 income range is the most frequent in San Diego Country Estates, accounting for 33.9% of all households. In contrast, only 24 households (0.7%) fall into the less than $10,000 income bracket, making it the least populous group.
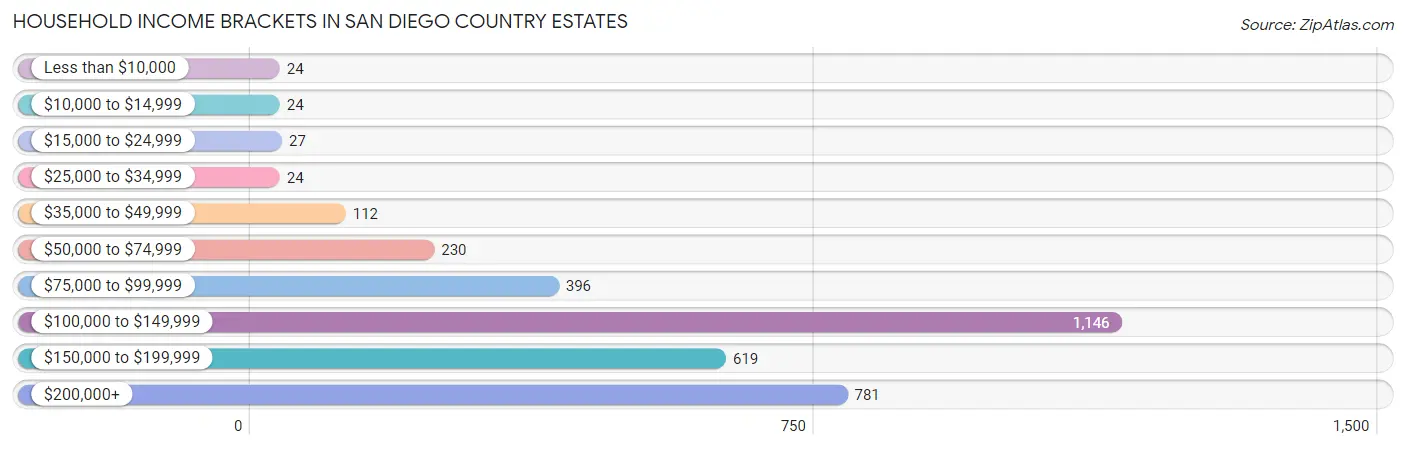
| Income Bracket | # Households | % Households |
| Less than $10,000 | 24 | 0.7% |
| $10,000 to $14,999 | 24 | 0.7% |
| $15,000 to $24,999 | 27 | 0.8% |
| $25,000 to $34,999 | 24 | 0.7% |
| $35,000 to $49,999 | 112 | 3.3% |
| $50,000 to $74,999 | 230 | 6.8% |
| $75,000 to $99,999 | 396 | 11.7% |
| $100,000 to $149,999 | 1,146 | 33.9% |
| $150,000 to $199,999 | 619 | 18.3% |
| $200,000+ | 781 | 23.1% |
Household Income by Householder Age in San Diego Country Estates
The median household income in San Diego Country Estates is $135,785, with the highest median household income of $157,708 found in the 45 to 64 years age bracket for the primary householder. A total of 1,822 households (53.9%) fall into this category. Meanwhile, the 15 to 24 years age bracket for the primary householder has the lowest median household income of $0, with 38 households (1.1%) in this group.
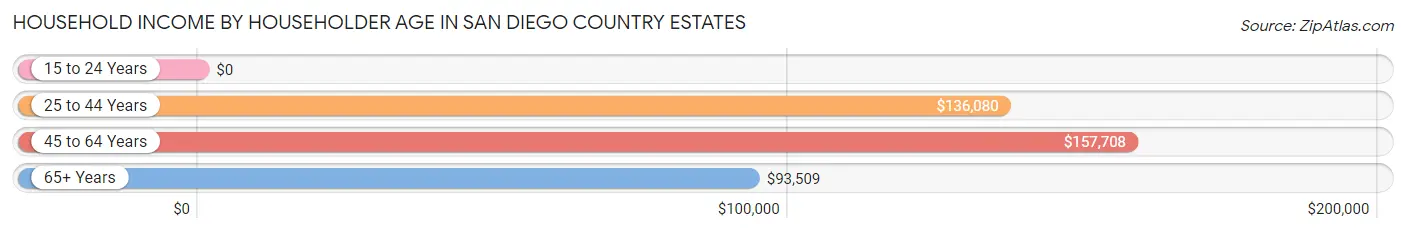
| Income Bracket | # Households | Median Income |
| 15 to 24 Years | 38 (1.1%) | $0 |
| 25 to 44 Years | 726 (21.5%) | $136,080 |
| 45 to 64 Years | 1,822 (53.9%) | $157,708 |
| 65+ Years | 796 (23.5%) | $93,509 |
| Total | 3,382 (100.0%) | $135,785 |
Poverty in San Diego Country Estates
Income Below Poverty by Sex and Age in San Diego Country Estates
With 2.4% poverty level for males and 1.5% for females among the residents of San Diego Country Estates, 6 to 11 year old males and 16 and 17 year old females are the most vulnerable to poverty, with 40 males (8.0%) and 29 females (8.9%) in their respective age groups living below the poverty level.
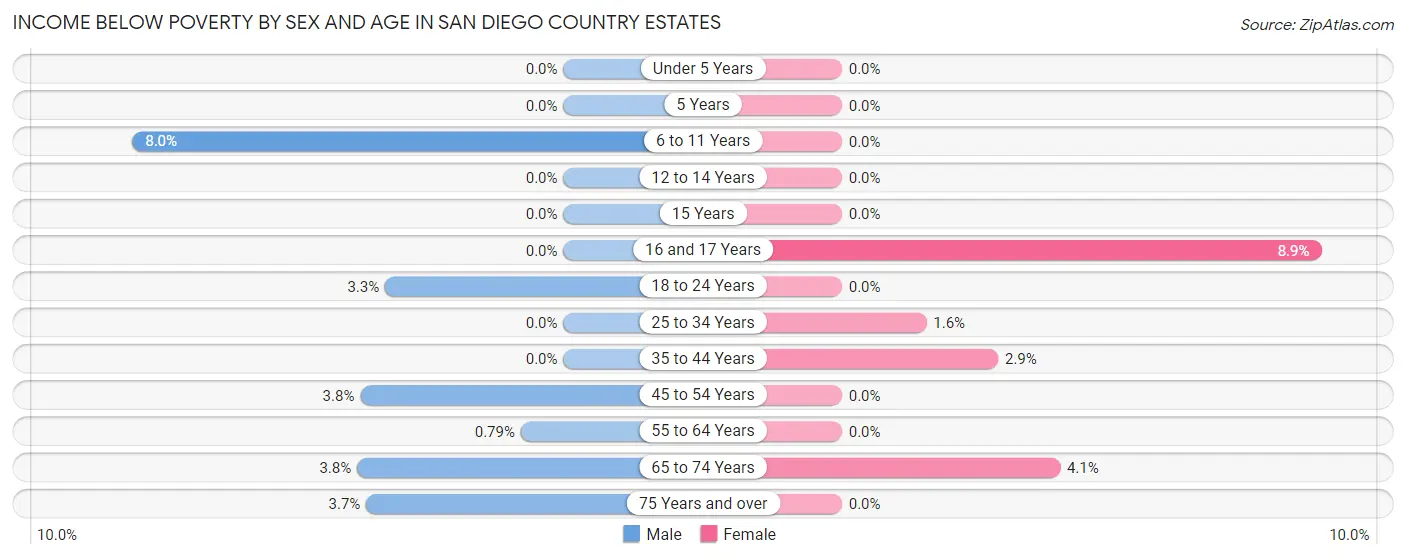
| Age Bracket | Male | Female |
| Under 5 Years | 0 (0.0%) | 0 (0.0%) |
| 5 Years | 0 (0.0%) | 0 (0.0%) |
| 6 to 11 Years | 40 (8.0%) | 0 (0.0%) |
| 12 to 14 Years | 0 (0.0%) | 0 (0.0%) |
| 15 Years | 0 (0.0%) | 0 (0.0%) |
| 16 and 17 Years | 0 (0.0%) | 29 (8.9%) |
| 18 to 24 Years | 16 (3.3%) | 0 (0.0%) |
| 25 to 34 Years | 0 (0.0%) | 7 (1.6%) |
| 35 to 44 Years | 0 (0.0%) | 17 (2.9%) |
| 45 to 54 Years | 38 (3.8%) | 0 (0.0%) |
| 55 to 64 Years | 7 (0.8%) | 0 (0.0%) |
| 65 to 74 Years | 17 (3.8%) | 21 (4.1%) |
| 75 Years and over | 10 (3.7%) | 0 (0.0%) |
| Total | 128 (2.4%) | 74 (1.5%) |
Income Above Poverty by Sex and Age in San Diego Country Estates
According to the poverty statistics in San Diego Country Estates, males aged under 5 years and females aged under 5 years are the age groups that are most secure financially, with 100.0% of males and 100.0% of females in these age groups living above the poverty line.
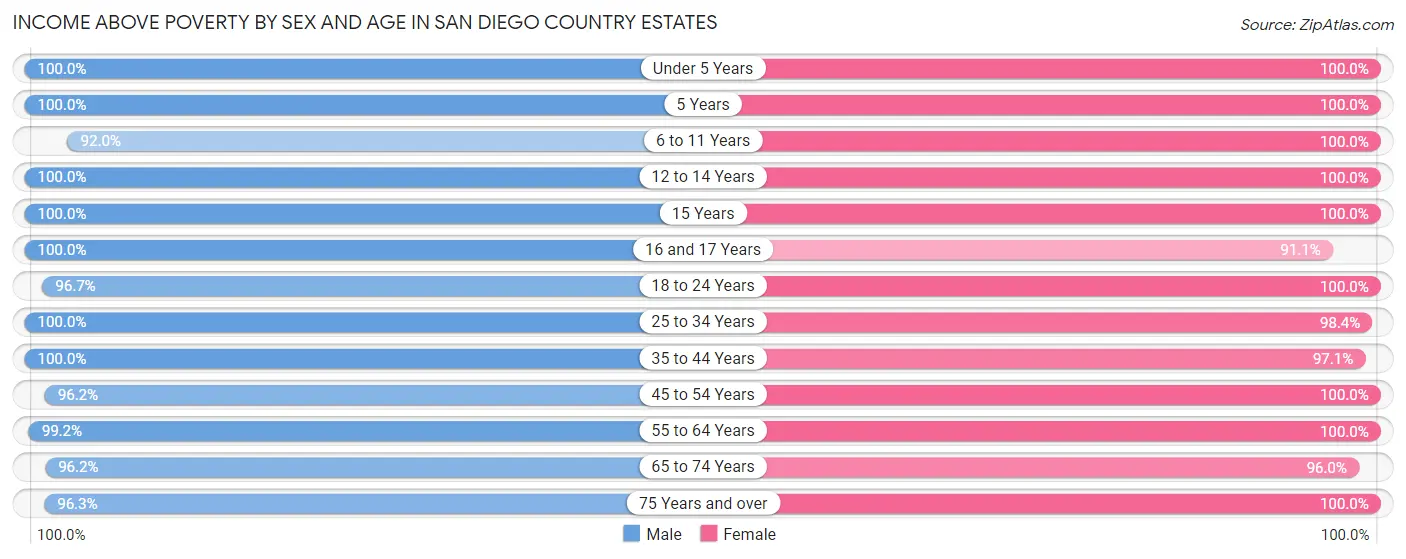
| Age Bracket | Male | Female |
| Under 5 Years | 407 (100.0%) | 172 (100.0%) |
| 5 Years | 79 (100.0%) | 56 (100.0%) |
| 6 to 11 Years | 460 (92.0%) | 330 (100.0%) |
| 12 to 14 Years | 167 (100.0%) | 181 (100.0%) |
| 15 Years | 62 (100.0%) | 82 (100.0%) |
| 16 and 17 Years | 59 (100.0%) | 297 (91.1%) |
| 18 to 24 Years | 467 (96.7%) | 172 (100.0%) |
| 25 to 34 Years | 583 (100.0%) | 439 (98.4%) |
| 35 to 44 Years | 501 (100.0%) | 570 (97.1%) |
| 45 to 54 Years | 970 (96.2%) | 887 (100.0%) |
| 55 to 64 Years | 875 (99.2%) | 714 (100.0%) |
| 65 to 74 Years | 427 (96.2%) | 497 (96.0%) |
| 75 Years and over | 263 (96.3%) | 307 (100.0%) |
| Total | 5,320 (97.7%) | 4,704 (98.5%) |
Income Below Poverty Among Married-Couple Families in San Diego Country Estates
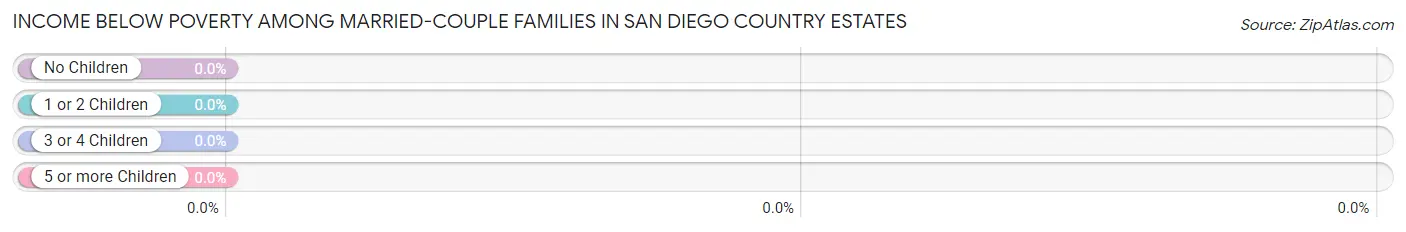
| Children | Above Poverty | Below Poverty |
| No Children | 1,262 (100.0%) | 0 (0.0%) |
| 1 or 2 Children | 953 (100.0%) | 0 (0.0%) |
| 3 or 4 Children | 182 (100.0%) | 0 (0.0%) |
| 5 or more Children | 15 (100.0%) | 0 (0.0%) |
| Total | 2,412 (100.0%) | 0 (0.0%) |
Income Below Poverty Among Single-Parent Households in San Diego Country Estates
According to the poverty data in San Diego Country Estates, 5.3% or 10 single-father households and 6.5% or 17 single-mother households are living below the poverty line. Among single-father households, those with no children have the highest poverty rate, with 10 households (6.7%) experiencing poverty. Likewise, among single-mother households, those with 1 or 2 children have the highest poverty rate, with 17 households (10.3%) falling below the poverty line.
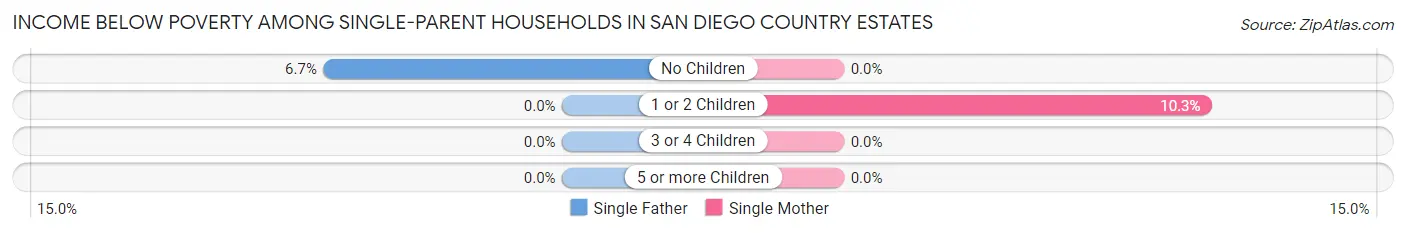
| Children | Single Father | Single Mother |
| No Children | 10 (6.7%) | 0 (0.0%) |
| 1 or 2 Children | 0 (0.0%) | 17 (10.3%) |
| 3 or 4 Children | 0 (0.0%) | 0 (0.0%) |
| 5 or more Children | 0 (0.0%) | 0 (0.0%) |
| Total | 10 (5.3%) | 17 (6.5%) |
Income Below Poverty Among Married-Couple vs Single-Parent Households in San Diego Country Estates
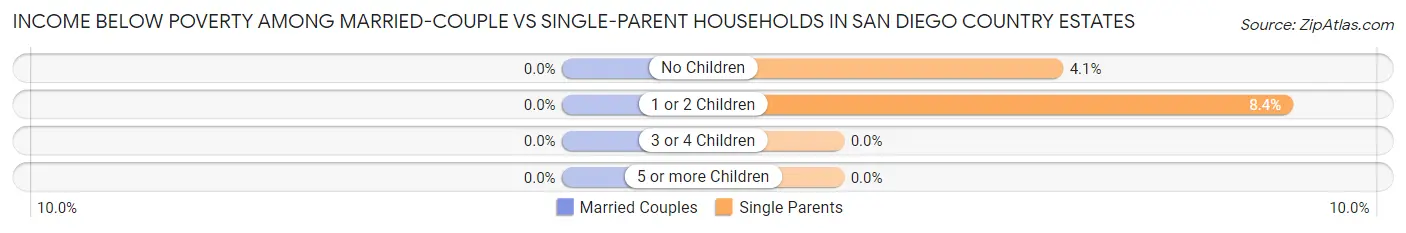
| Children | Married-Couple Families | Single-Parent Households |
| No Children | 0 (0.0%) | 10 (4.1%) |
| 1 or 2 Children | 0 (0.0%) | 17 (8.4%) |
| 3 or 4 Children | 0 (0.0%) | 0 (0.0%) |
| 5 or more Children | 0 (0.0%) | 0 (0.0%) |
| Total | 0 (0.0%) | 27 (6.0%) |
Race in San Diego Country Estates
The most populous races in San Diego Country Estates are White / Caucasian (7,654 | 74.7%), Hispanic or Latino (2,366 | 23.1%), and Two or more Races (1,858 | 18.1%).
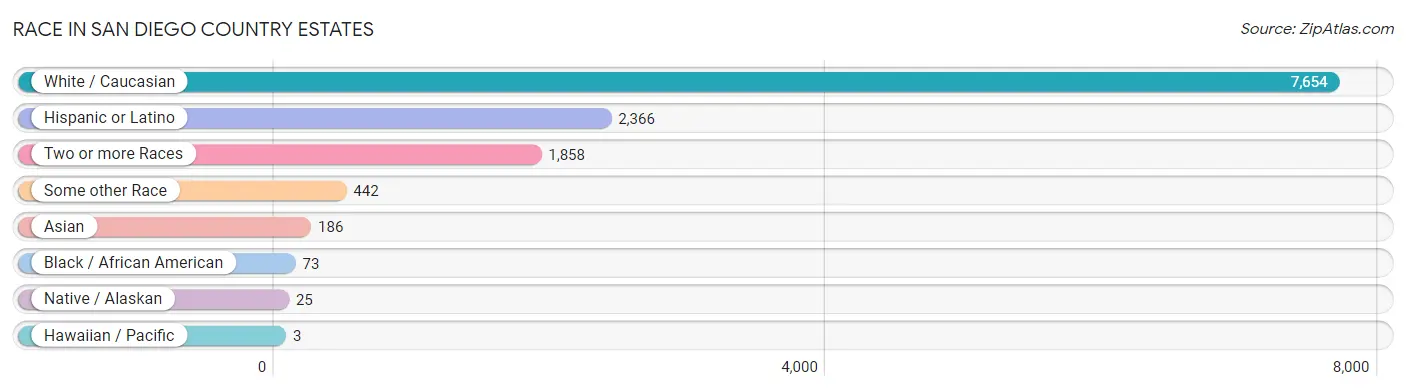
| Race | # Population | % Population |
| Asian | 186 | 1.8% |
| Black / African American | 73 | 0.7% |
| Hawaiian / Pacific | 3 | 0.0% |
| Hispanic or Latino | 2,366 | 23.1% |
| Native / Alaskan | 25 | 0.2% |
| White / Caucasian | 7,654 | 74.7% |
| Two or more Races | 1,858 | 18.1% |
| Some other Race | 442 | 4.3% |
| Total | 10,241 | 100.0% |
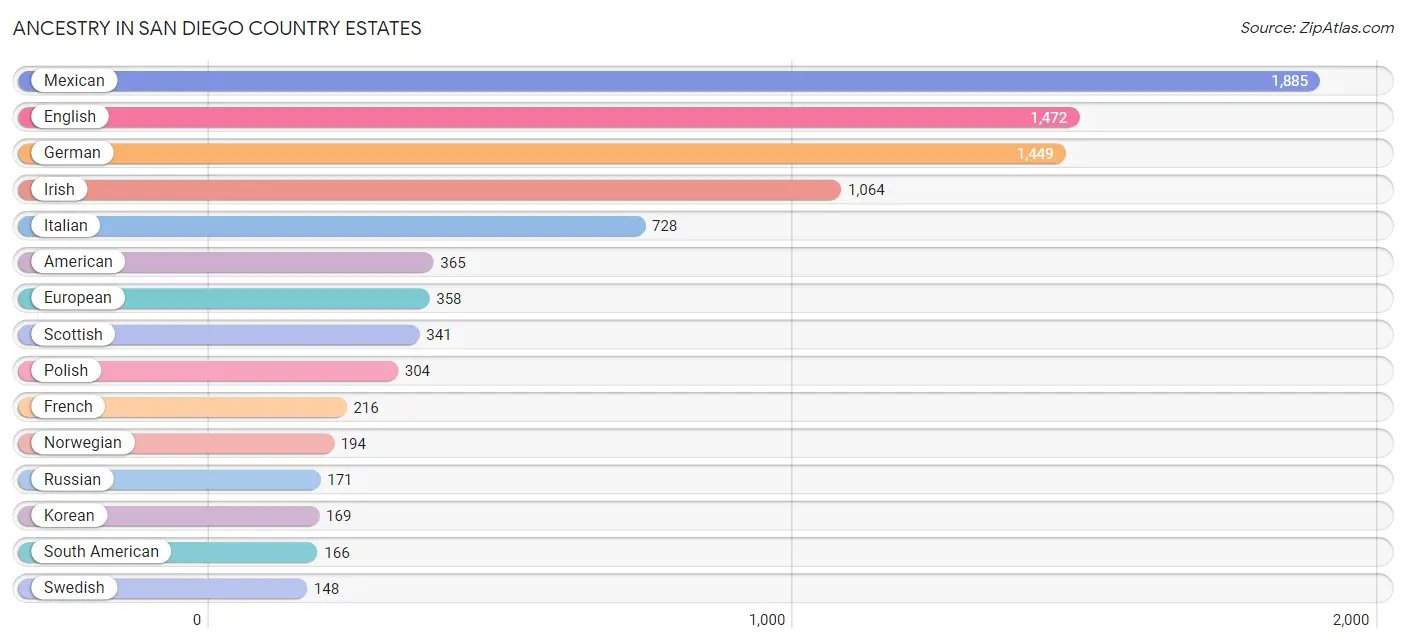
Ancestry in San Diego Country Estates
The most populous ancestries reported in San Diego Country Estates are Mexican (1,885 | 18.4%), English (1,472 | 14.4%), German (1,449 | 14.1%), Irish (1,064 | 10.4%), and Italian (728 | 7.1%), together accounting for 64.4% of all San Diego Country Estates residents.
| Ancestry | # Population | % Population |
| American | 365 | 3.6% |
| Argentinean | 104 | 1.0% |
| Armenian | 12 | 0.1% |
| Assyrian / Chaldean / Syriac | 10 | 0.1% |
| Austrian | 21 | 0.2% |
| Bangladeshi | 12 | 0.1% |
| Basque | 119 | 1.2% |
| Bhutanese | 49 | 0.5% |
| British | 91 | 0.9% |
| Burmese | 19 | 0.2% |
| Canadian | 9 | 0.1% |
| Central American | 45 | 0.4% |
| Central American Indian | 15 | 0.2% |
| Cherokee | 17 | 0.2% |
| Choctaw | 17 | 0.2% |
| Czech | 41 | 0.4% |
| Czechoslovakian | 21 | 0.2% |
| Danish | 35 | 0.3% |
| Dutch | 57 | 0.6% |
| Eastern European | 27 | 0.3% |
| English | 1,472 | 14.4% |
| European | 358 | 3.5% |
| French | 216 | 2.1% |
| French Canadian | 11 | 0.1% |
| German | 1,449 | 14.1% |
| Greek | 70 | 0.7% |
| Honduran | 9 | 0.1% |
| Hungarian | 69 | 0.7% |
| Indian (Asian) | 52 | 0.5% |
| Inupiat | 15 | 0.2% |
| Irish | 1,064 | 10.4% |
| Italian | 728 | 7.1% |
| Jamaican | 4 | 0.0% |
| Korean | 169 | 1.7% |
| Lithuanian | 37 | 0.4% |
| Mexican | 1,885 | 18.4% |
| Mexican American Indian | 23 | 0.2% |
| Navajo | 2 | 0.0% |
| Nicaraguan | 21 | 0.2% |
| Northern European | 12 | 0.1% |
| Norwegian | 194 | 1.9% |
| Ottawa | 12 | 0.1% |
| Polish | 304 | 3.0% |
| Portuguese | 52 | 0.5% |
| Puerto Rican | 60 | 0.6% |
| Russian | 171 | 1.7% |
| Samoan | 48 | 0.5% |
| Scandinavian | 58 | 0.6% |
| Scotch-Irish | 83 | 0.8% |
| Scottish | 341 | 3.3% |
| Serbian | 11 | 0.1% |
| South American | 166 | 1.6% |
| Spanish | 39 | 0.4% |
| Swedish | 148 | 1.5% |
| Swiss | 12 | 0.1% |
| Thai | 43 | 0.4% |
| Tongan | 3 | 0.0% |
| Ukrainian | 20 | 0.2% |
| Venezuelan | 62 | 0.6% |
| Welsh | 11 | 0.1% |
| Yaqui | 2 | 0.0% | View All 61 Rows |
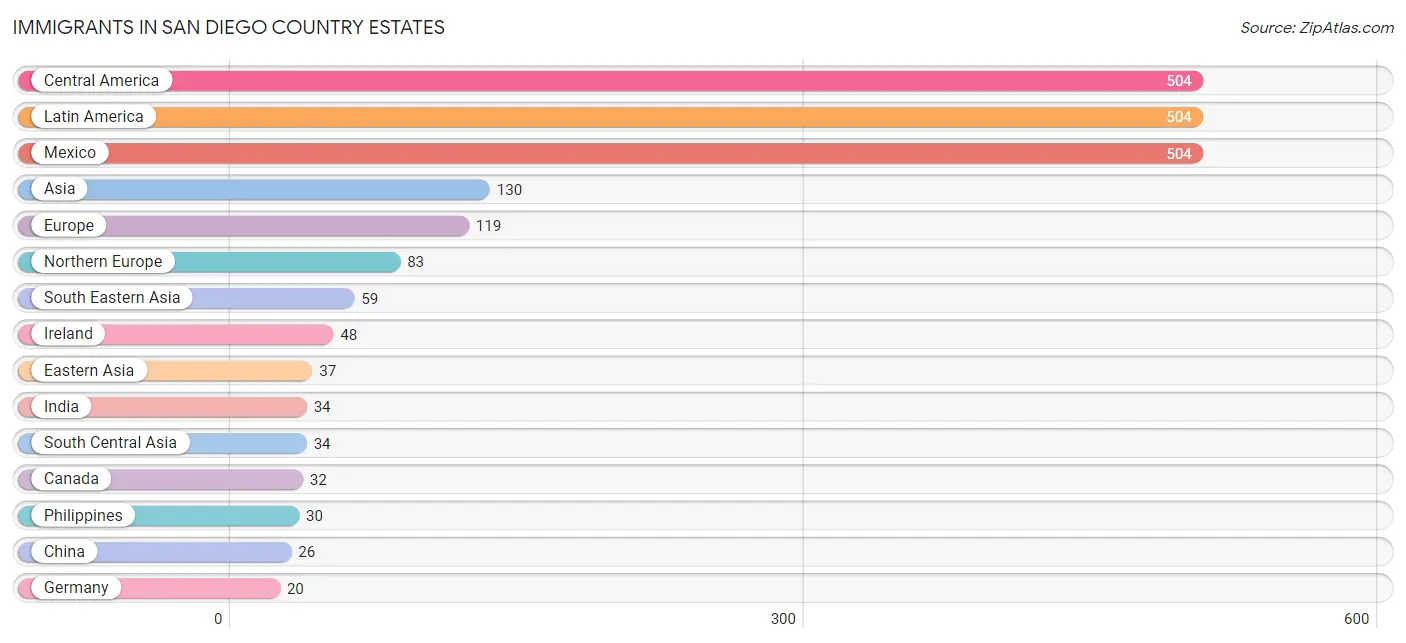
Immigrants in San Diego Country Estates
The most numerous immigrant groups reported in San Diego Country Estates came from Central America (504 | 4.9%), Latin America (504 | 4.9%), Mexico (504 | 4.9%), Asia (130 | 1.3%), and Europe (119 | 1.2%), together accounting for 17.2% of all San Diego Country Estates residents.
| Immigration Origin | # Population | % Population |
| Asia | 130 | 1.3% |
| Canada | 32 | 0.3% |
| Central America | 504 | 4.9% |
| China | 26 | 0.3% |
| Eastern Asia | 37 | 0.4% |
| England | 17 | 0.2% |
| Europe | 119 | 1.2% |
| Germany | 20 | 0.2% |
| Greece | 7 | 0.1% |
| India | 34 | 0.3% |
| Indonesia | 17 | 0.2% |
| Ireland | 48 | 0.5% |
| Japan | 11 | 0.1% |
| Laos | 12 | 0.1% |
| Latin America | 504 | 4.9% |
| Mexico | 504 | 4.9% |
| Northern Europe | 83 | 0.8% |
| Oceania | 3 | 0.0% |
| Philippines | 30 | 0.3% |
| Portugal | 9 | 0.1% |
| South Central Asia | 34 | 0.3% |
| South Eastern Asia | 59 | 0.6% |
| Southern Europe | 16 | 0.2% |
| Western Europe | 20 | 0.2% | View All 24 Rows |
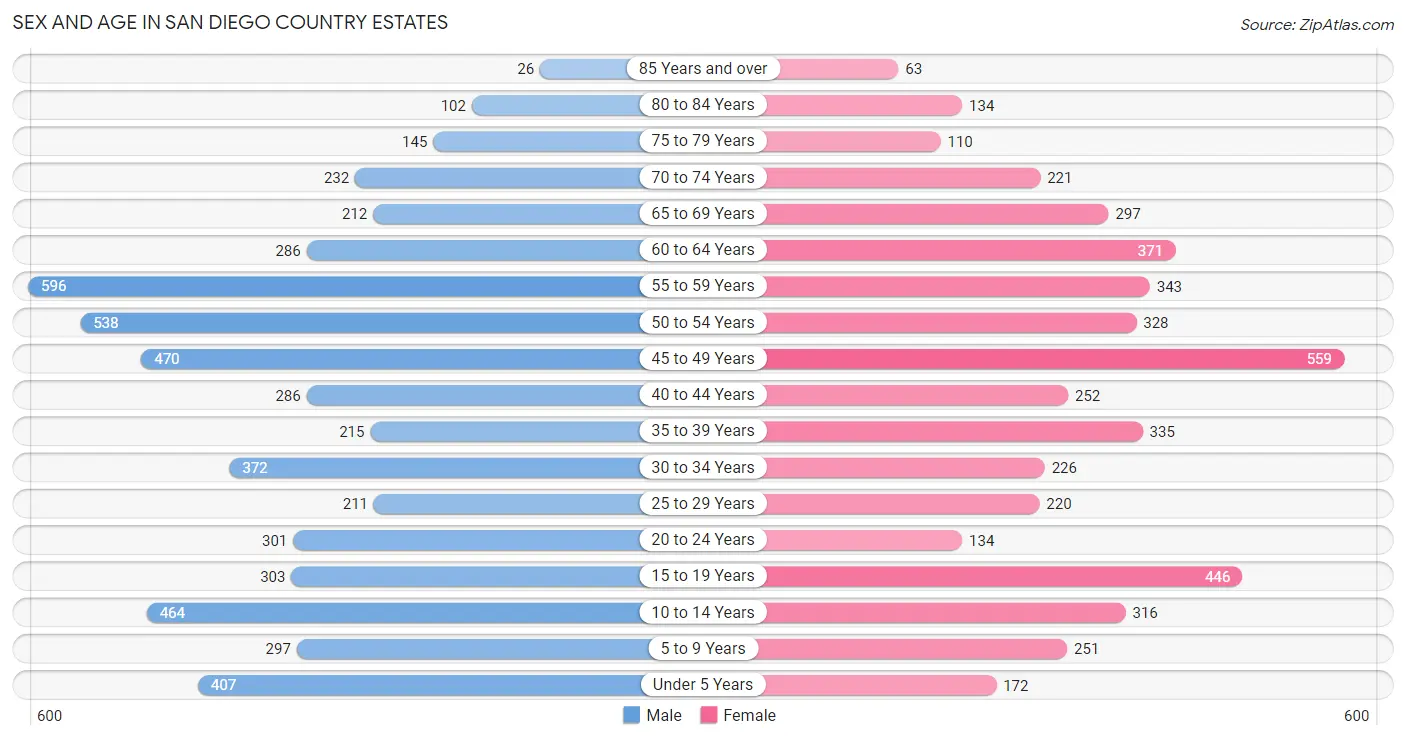
Sex and Age in San Diego Country Estates
Sex and Age in San Diego Country Estates
The most populous age groups in San Diego Country Estates are 55 to 59 Years (596 | 10.9%) for men and 45 to 49 Years (559 | 11.7%) for women.
| Age Bracket | Male | Female |
| Under 5 Years | 407 (7.4%) | 172 (3.6%) |
| 5 to 9 Years | 297 (5.4%) | 251 (5.2%) |
| 10 to 14 Years | 464 (8.5%) | 316 (6.6%) |
| 15 to 19 Years | 303 (5.6%) | 446 (9.3%) |
| 20 to 24 Years | 301 (5.5%) | 134 (2.8%) |
| 25 to 29 Years | 211 (3.9%) | 220 (4.6%) |
| 30 to 34 Years | 372 (6.8%) | 226 (4.7%) |
| 35 to 39 Years | 215 (3.9%) | 335 (7.0%) |
| 40 to 44 Years | 286 (5.2%) | 252 (5.3%) |
| 45 to 49 Years | 470 (8.6%) | 559 (11.7%) |
| 50 to 54 Years | 538 (9.9%) | 328 (6.9%) |
| 55 to 59 Years | 596 (10.9%) | 343 (7.2%) |
| 60 to 64 Years | 286 (5.2%) | 371 (7.8%) |
| 65 to 69 Years | 212 (3.9%) | 297 (6.2%) |
| 70 to 74 Years | 232 (4.3%) | 221 (4.6%) |
| 75 to 79 Years | 145 (2.6%) | 110 (2.3%) |
| 80 to 84 Years | 102 (1.9%) | 134 (2.8%) |
| 85 Years and over | 26 (0.5%) | 63 (1.3%) |
| Total | 5,463 (100.0%) | 4,778 (100.0%) |
Families and Households in San Diego Country Estates
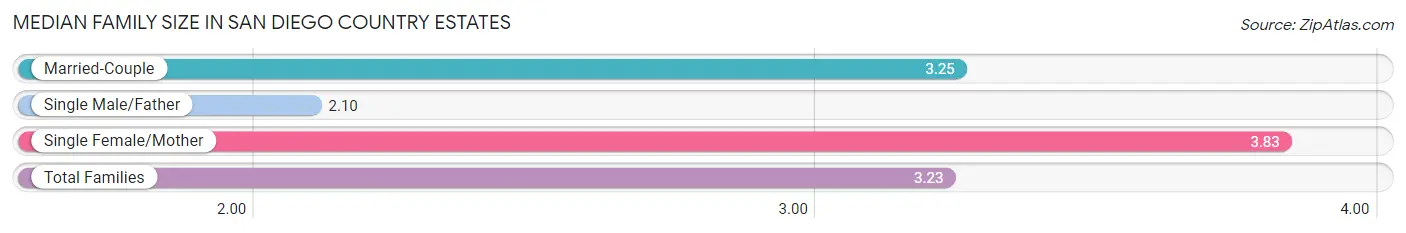
Median Family Size in San Diego Country Estates
The median family size in San Diego Country Estates is 3.23 persons per family, with single female/mother families (260 | 9.1%) accounting for the largest median family size of 3.83 persons per family. On the other hand, single male/father families (188 | 6.6%) represent the smallest median family size with 2.10 persons per family.
| Family Type | # Families | Family Size |
| Married-Couple | 2,412 (84.3%) | 3.25 |
| Single Male/Father | 188 (6.6%) | 2.10 |
| Single Female/Mother | 260 (9.1%) | 3.83 |
| Total Families | 2,860 (100.0%) | 3.23 |
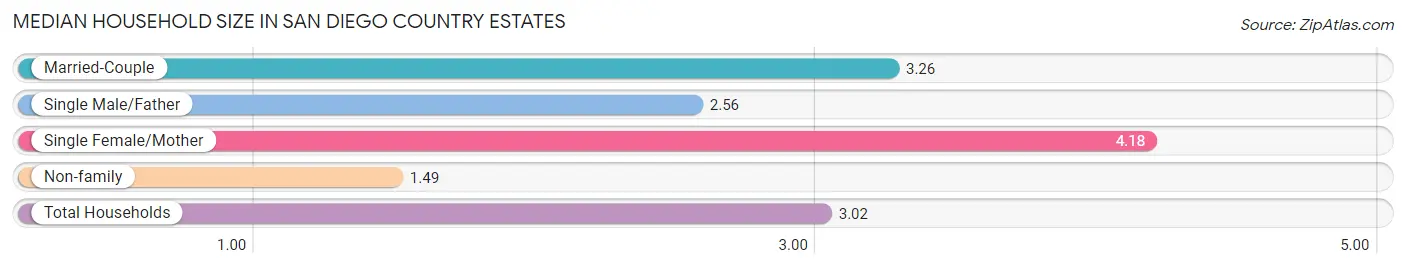
Median Household Size in San Diego Country Estates
The median household size in San Diego Country Estates is 3.02 persons per household, with single female/mother households (260 | 7.7%) accounting for the largest median household size of 4.18 persons per household. non-family households (522 | 15.4%) represent the smallest median household size with 1.49 persons per household.
| Household Type | # Households | Household Size |
| Married-Couple | 2,412 (71.3%) | 3.26 |
| Single Male/Father | 188 (5.6%) | 2.56 |
| Single Female/Mother | 260 (7.7%) | 4.18 |
| Non-family | 522 (15.4%) | 1.49 |
| Total Households | 3,382 (100.0%) | 3.02 |
Household Size by Marriage Status in San Diego Country Estates
Out of a total of 3,382 households in San Diego Country Estates, 2,860 (84.6%) are family households, while 522 (15.4%) are nonfamily households. The most numerous type of family households are 2-person households, comprising 1,212, and the most common type of nonfamily households are 1-person households, comprising 316.
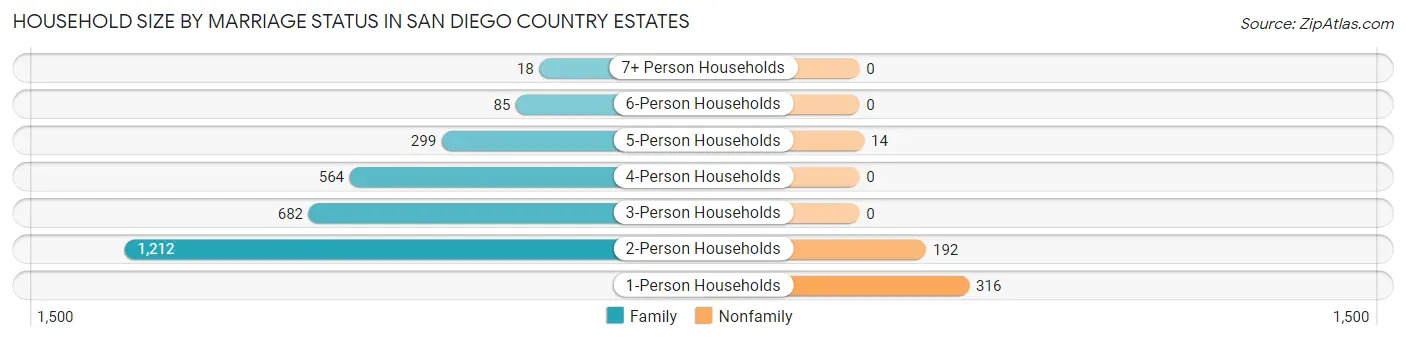
| Household Size | Family Households | Nonfamily Households |
| 1-Person Households | - | 316 (9.3%) |
| 2-Person Households | 1,212 (35.8%) | 192 (5.7%) |
| 3-Person Households | 682 (20.2%) | 0 (0.0%) |
| 4-Person Households | 564 (16.7%) | 0 (0.0%) |
| 5-Person Households | 299 (8.8%) | 14 (0.4%) |
| 6-Person Households | 85 (2.5%) | 0 (0.0%) |
| 7+ Person Households | 18 (0.5%) | 0 (0.0%) |
| Total | 2,860 (84.6%) | 522 (15.4%) |
Female Fertility in San Diego Country Estates
Fertility by Age in San Diego Country Estates
Average fertility rate in San Diego Country Estates is 42.0 births per 1,000 women. Women in the age bracket of 20 to 34 years have the highest fertility rate with 128.0 births per 1,000 women. Women in the age bracket of 20 to 34 years acount for 77.9% of all women with births.
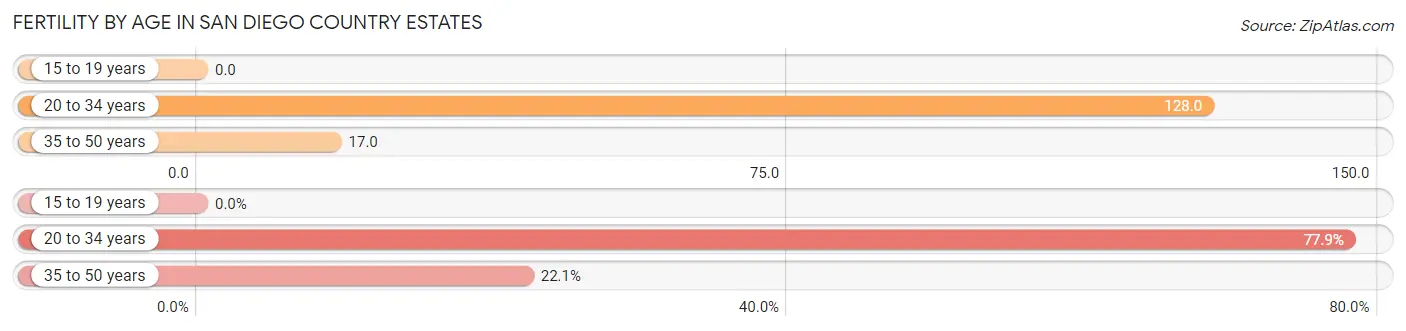
| Age Bracket | Women with Births | Births / 1,000 Women |
| 15 to 19 years | 0 (0.0%) | 0.0 |
| 20 to 34 years | 74 (77.9%) | 128.0 |
| 35 to 50 years | 21 (22.1%) | 17.0 |
| Total | 95 (100.0%) | 42.0 |
Fertility by Age by Marriage Status in San Diego Country Estates
45.3% of women with births (95) in San Diego Country Estates are married. The highest percentage of unmarried women with births falls into 20 to 34 years age bracket with 70.3% of them unmarried at the time of birth, while the lowest percentage of unmarried women with births belong to 35 to 50 years age bracket with 0.0% of them unmarried.
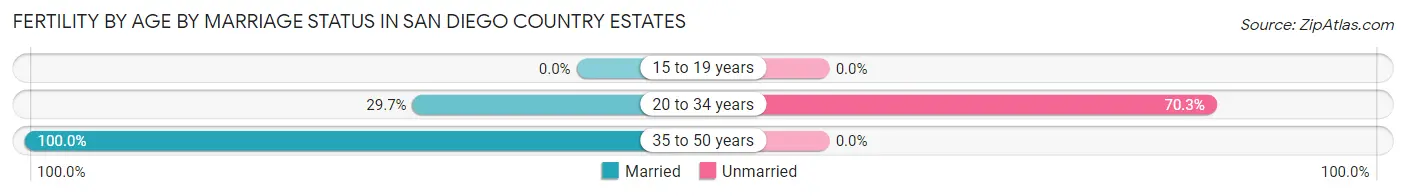
| Age Bracket | Married | Unmarried |
| 15 to 19 years | 0 (0.0%) | 0 (0.0%) |
| 20 to 34 years | 22 (29.7%) | 52 (70.3%) |
| 35 to 50 years | 21 (100.0%) | 0 (0.0%) |
| Total | 43 (45.3%) | 52 (54.7%) |
Fertility by Education in San Diego Country Estates
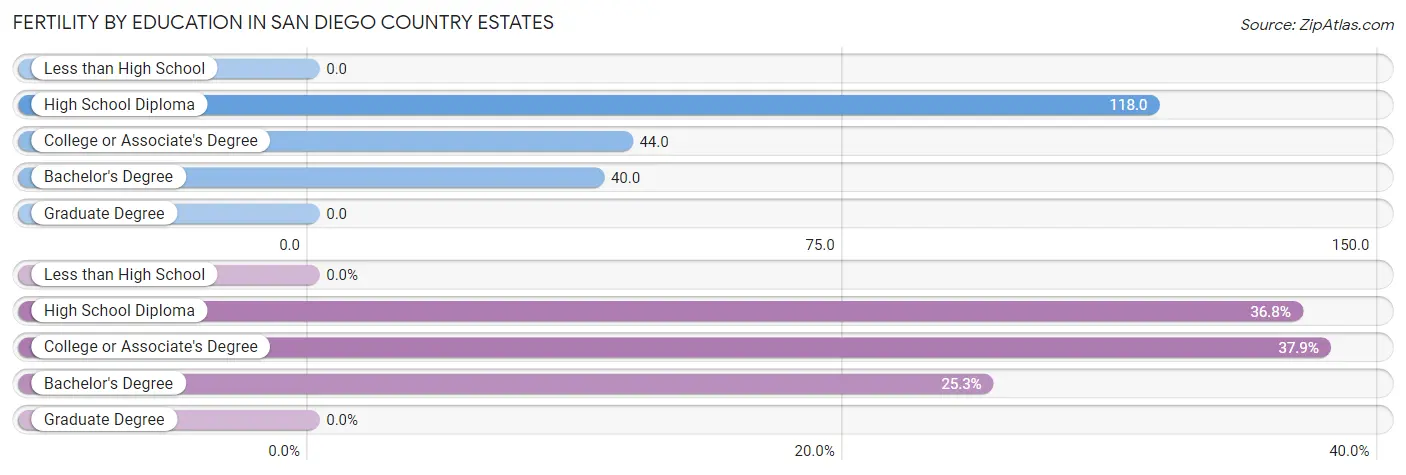
| Educational Attainment | Women with Births | Births / 1,000 Women |
| Less than High School | 0 (0.0%) | 0.0 |
| High School Diploma | 35 (36.8%) | 118.0 |
| College or Associate's Degree | 36 (37.9%) | 44.0 |
| Bachelor's Degree | 24 (25.3%) | 40.0 |
| Graduate Degree | 0 (0.0%) | 0.0 |
| Total | 95 (100.0%) | 42.0 |
Fertility by Education by Marriage Status in San Diego Country Estates
54.7% of women with births in San Diego Country Estates are unmarried. Women with the educational attainment of bachelor's degree are most likely to be married with 100.0% of them married at childbirth, while women with the educational attainment of high school diploma are least likely to be married with 100.0% of them unmarried at childbirth.
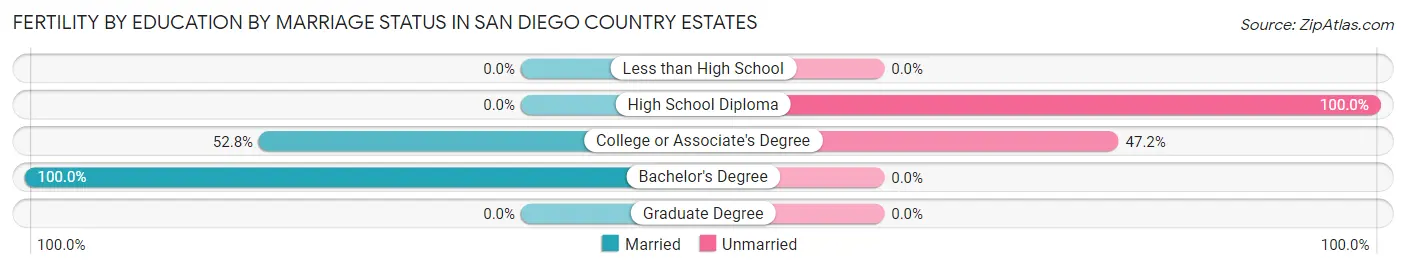
| Educational Attainment | Married | Unmarried |
| Less than High School | 0 (0.0%) | 0 (0.0%) |
| High School Diploma | 0 (0.0%) | 35 (100.0%) |
| College or Associate's Degree | 19 (52.8%) | 17 (47.2%) |
| Bachelor's Degree | 24 (100.0%) | 0 (0.0%) |
| Graduate Degree | 0 (0.0%) | 0 (0.0%) |
| Total | 43 (45.3%) | 52 (54.7%) |
Employment Characteristics in San Diego Country Estates
Employment by Class of Employer in San Diego Country Estates
Among the 5,092 employed individuals in San Diego Country Estates, private company employees (3,322 | 65.2%), federal government employees (543 | 10.7%), and not-for-profit organizations (382 | 7.5%) make up the most common classes of employment.
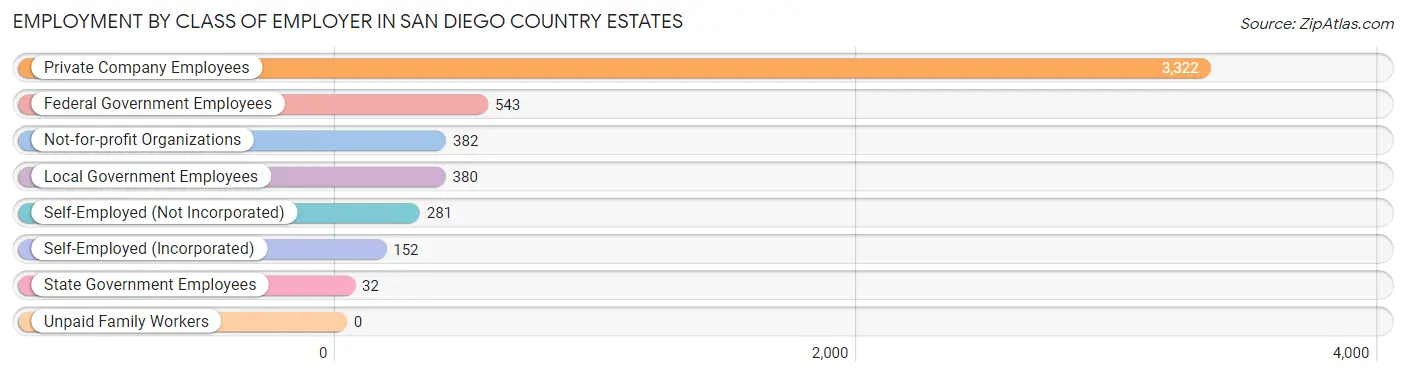
| Employer Class | # Employees | % Employees |
| Private Company Employees | 3,322 | 65.2% |
| Self-Employed (Incorporated) | 152 | 3.0% |
| Self-Employed (Not Incorporated) | 281 | 5.5% |
| Not-for-profit Organizations | 382 | 7.5% |
| Local Government Employees | 380 | 7.5% |
| State Government Employees | 32 | 0.6% |
| Federal Government Employees | 543 | 10.7% |
| Unpaid Family Workers | 0 | 0.0% |
| Total | 5,092 | 100.0% |
Employment Status by Age in San Diego Country Estates
According to the labor force statistics for San Diego Country Estates, out of the total population over 16 years of age (8,190), 66.1% or 5,414 individuals are in the labor force, with 3.1% or 168 of them unemployed. The age group with the highest labor force participation rate is 30 to 34 years, with 93.6% or 560 individuals in the labor force. Within the labor force, the 16 to 19 years age range has the highest percentage of unemployed individuals, with 8.6% or 16 of them being unemployed.
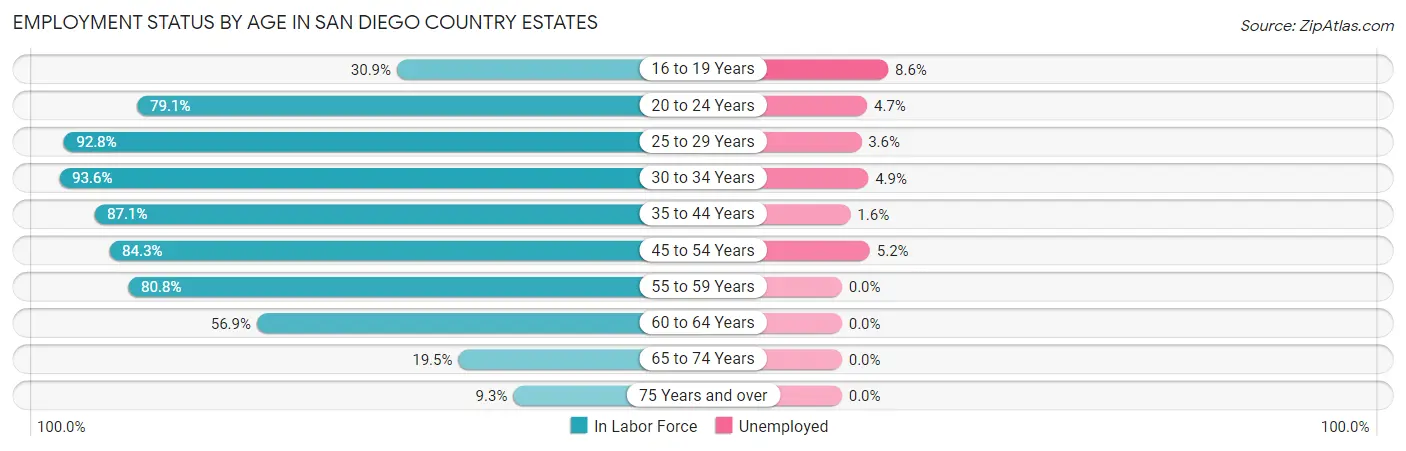
| Age Bracket | In Labor Force | Unemployed |
| 16 to 19 Years | 187 (30.9%) | 16 (8.6%) |
| 20 to 24 Years | 344 (79.1%) | 16 (4.7%) |
| 25 to 29 Years | 400 (92.8%) | 14 (3.6%) |
| 30 to 34 Years | 560 (93.6%) | 27 (4.9%) |
| 35 to 44 Years | 948 (87.1%) | 15 (1.6%) |
| 45 to 54 Years | 1,597 (84.3%) | 83 (5.2%) |
| 55 to 59 Years | 759 (80.8%) | 0 (0.0%) |
| 60 to 64 Years | 374 (56.9%) | 0 (0.0%) |
| 65 to 74 Years | 188 (19.5%) | 0 (0.0%) |
| 75 Years and over | 54 (9.3%) | 0 (0.0%) |
| Total | 5,414 (66.1%) | 168 (3.1%) |
Employment Status by Educational Attainment in San Diego Country Estates
According to labor force statistics for San Diego Country Estates, 82.7% of individuals (4,638) out of the total population between 25 and 64 years of age (5,608) are in the labor force, with 3.0% or 139 of them being unemployed. The group with the highest labor force participation rate are those with the educational attainment of less than high school, with 94.1% or 396 individuals in the labor force. Within the labor force, individuals with high school diploma education have the highest percentage of unemployment, with 8.7% or 73 of them being unemployed.
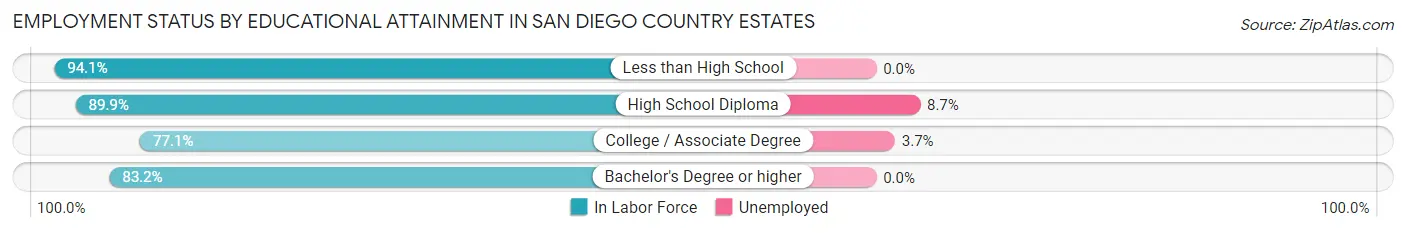
| Educational Attainment | In Labor Force | Unemployed |
| Less than High School | 396 (94.1%) | 0 (0.0%) |
| High School Diploma | 841 (89.9%) | 81 (8.7%) |
| College / Associate Degree | 1,729 (77.1%) | 83 (3.7%) |
| Bachelor's Degree or higher | 1,672 (83.2%) | 0 (0.0%) |
| Total | 4,638 (82.7%) | 168 (3.0%) |
Employment Occupations by Sex in San Diego Country Estates
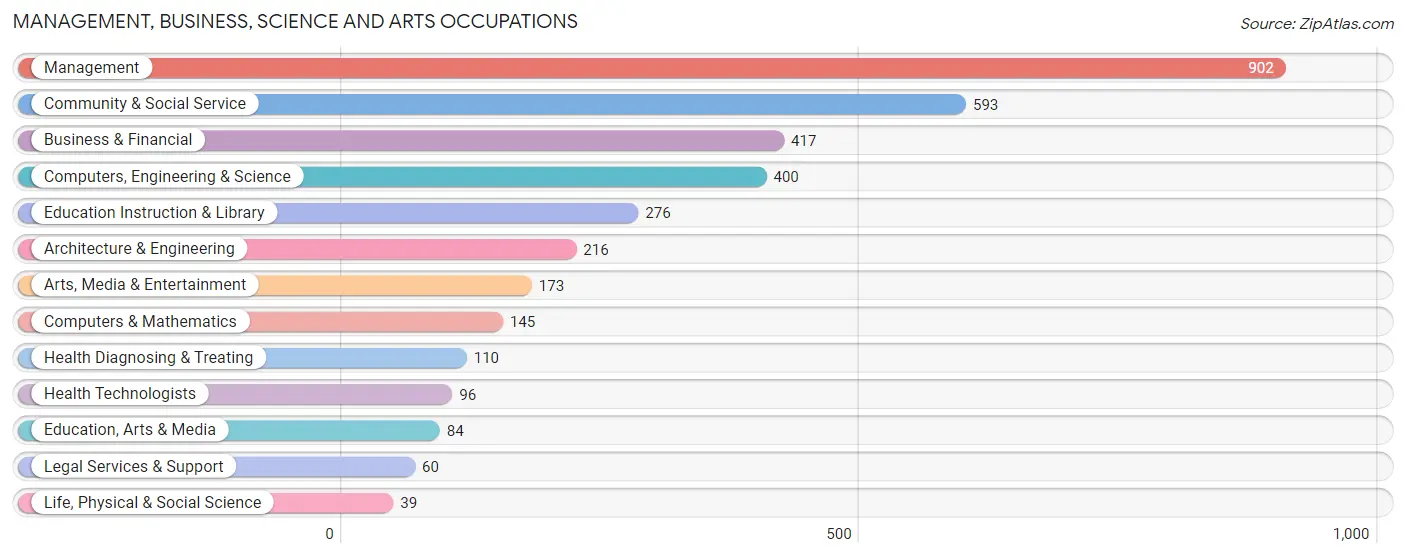
Management, Business, Science and Arts Occupations
The most common Management, Business, Science and Arts occupations in San Diego Country Estates are Management (902 | 17.9%), Community & Social Service (593 | 11.8%), Business & Financial (417 | 8.3%), Computers, Engineering & Science (400 | 8.0%), and Education Instruction & Library (276 | 5.5%).
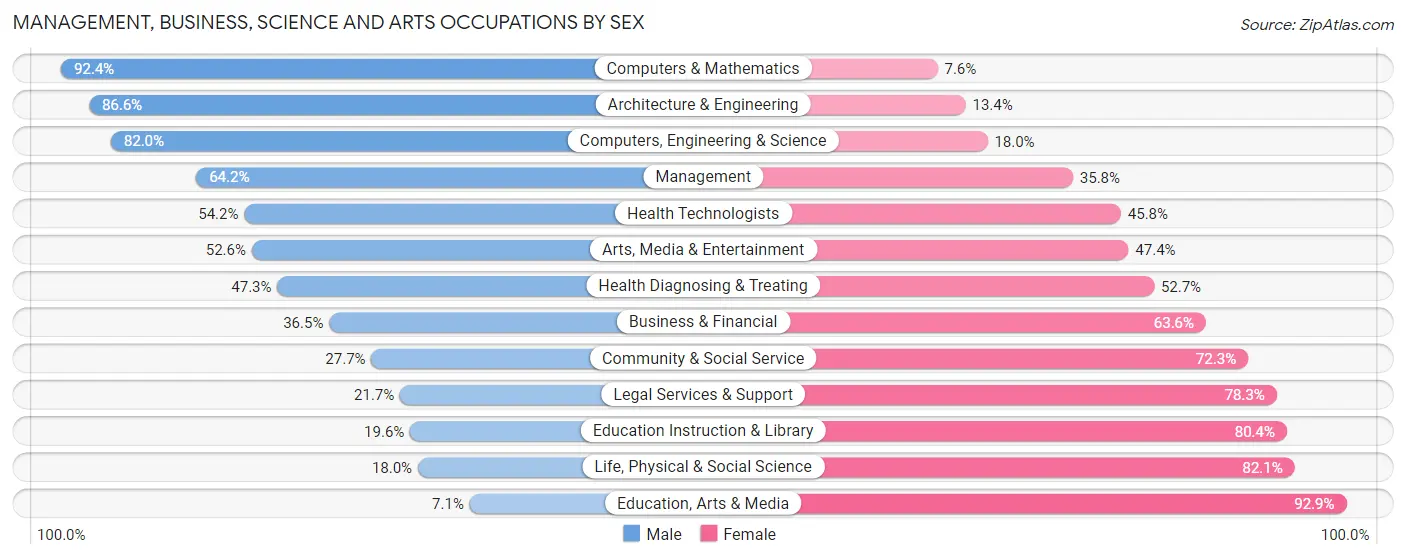
Management, Business, Science and Arts Occupations by Sex
Within the Management, Business, Science and Arts occupations in San Diego Country Estates, the most male-oriented occupations are Computers & Mathematics (92.4%), Architecture & Engineering (86.6%), and Computers, Engineering & Science (82.0%), while the most female-oriented occupations are Education, Arts & Media (92.9%), Life, Physical & Social Science (82.1%), and Education Instruction & Library (80.4%).
| Occupation | Male | Female |
| Management | 579 (64.2%) | 323 (35.8%) |
| Business & Financial | 152 (36.4%) | 265 (63.5%) |
| Computers, Engineering & Science | 328 (82.0%) | 72 (18.0%) |
| Computers & Mathematics | 134 (92.4%) | 11 (7.6%) |
| Architecture & Engineering | 187 (86.6%) | 29 (13.4%) |
| Life, Physical & Social Science | 7 (17.9%) | 32 (82.1%) |
| Community & Social Service | 164 (27.7%) | 429 (72.3%) |
| Education, Arts & Media | 6 (7.1%) | 78 (92.9%) |
| Legal Services & Support | 13 (21.7%) | 47 (78.3%) |
| Education Instruction & Library | 54 (19.6%) | 222 (80.4%) |
| Arts, Media & Entertainment | 91 (52.6%) | 82 (47.4%) |
| Health Diagnosing & Treating | 52 (47.3%) | 58 (52.7%) |
| Health Technologists | 52 (54.2%) | 44 (45.8%) |
| Total (Category) | 1,275 (52.6%) | 1,147 (47.4%) |
| Total (Overall) | 2,973 (59.1%) | 2,059 (40.9%) |
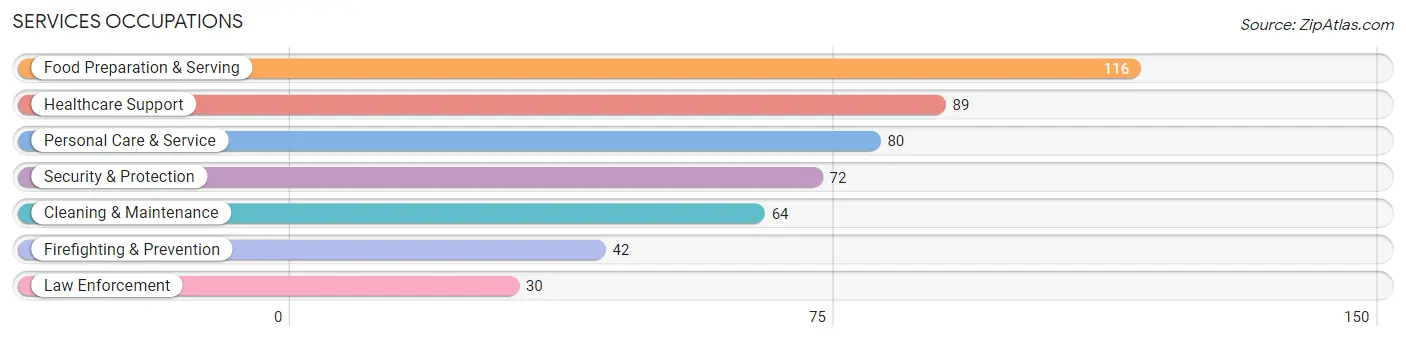
Services Occupations
The most common Services occupations in San Diego Country Estates are Food Preparation & Serving (116 | 2.3%), Healthcare Support (89 | 1.8%), Personal Care & Service (80 | 1.6%), Security & Protection (72 | 1.4%), and Cleaning & Maintenance (64 | 1.3%).
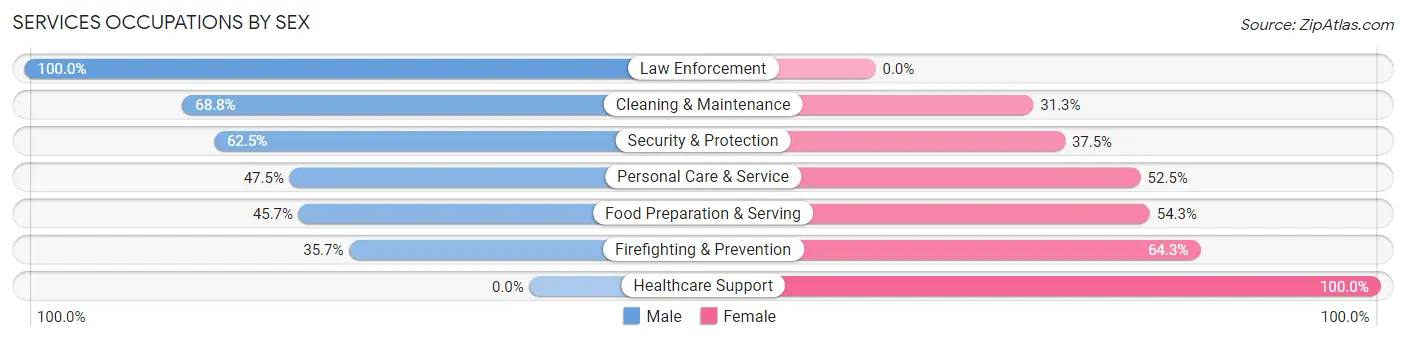
Services Occupations by Sex
Within the Services occupations in San Diego Country Estates, the most male-oriented occupations are Law Enforcement (100.0%), Cleaning & Maintenance (68.8%), and Security & Protection (62.5%), while the most female-oriented occupations are Healthcare Support (100.0%), Firefighting & Prevention (64.3%), and Food Preparation & Serving (54.3%).
| Occupation | Male | Female |
| Healthcare Support | 0 (0.0%) | 89 (100.0%) |
| Security & Protection | 45 (62.5%) | 27 (37.5%) |
| Firefighting & Prevention | 15 (35.7%) | 27 (64.3%) |
| Law Enforcement | 30 (100.0%) | 0 (0.0%) |
| Food Preparation & Serving | 53 (45.7%) | 63 (54.3%) |
| Cleaning & Maintenance | 44 (68.8%) | 20 (31.2%) |
| Personal Care & Service | 38 (47.5%) | 42 (52.5%) |
| Total (Category) | 180 (42.8%) | 241 (57.2%) |
| Total (Overall) | 2,973 (59.1%) | 2,059 (40.9%) |
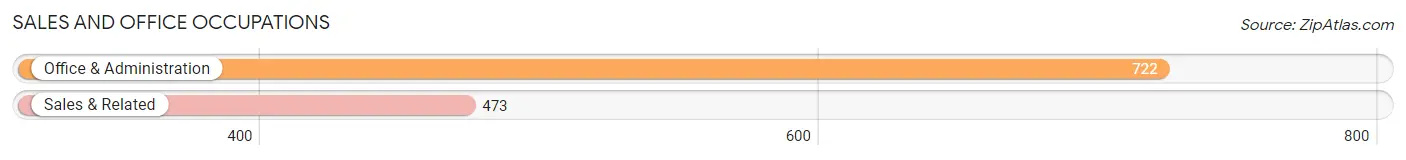
Sales and Office Occupations
The most common Sales and Office occupations in San Diego Country Estates are Office & Administration (722 | 14.3%), and Sales & Related (473 | 9.4%).
Sales and Office Occupations by Sex
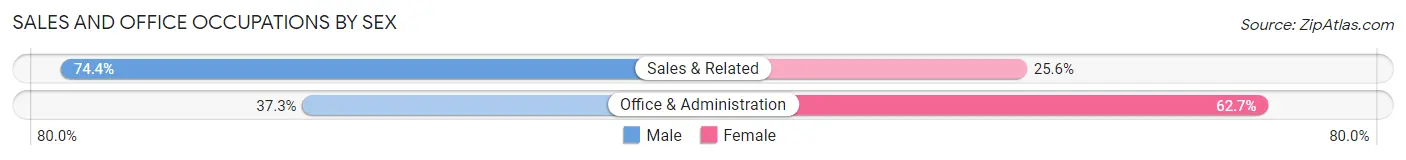
| Occupation | Male | Female |
| Sales & Related | 352 (74.4%) | 121 (25.6%) |
| Office & Administration | 269 (37.3%) | 453 (62.7%) |
| Total (Category) | 621 (52.0%) | 574 (48.0%) |
| Total (Overall) | 2,973 (59.1%) | 2,059 (40.9%) |
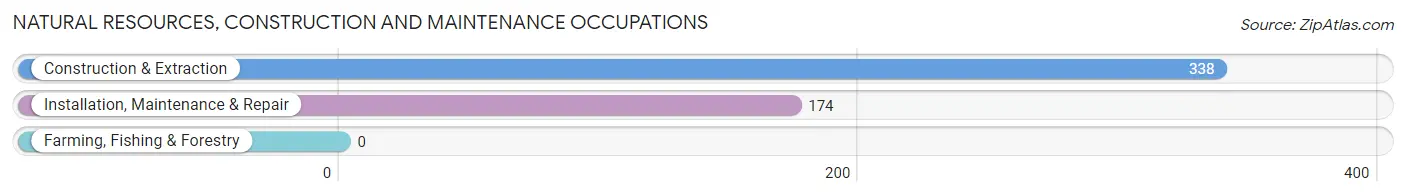
Natural Resources, Construction and Maintenance Occupations
The most common Natural Resources, Construction and Maintenance occupations in San Diego Country Estates are Construction & Extraction (338 | 6.7%), and Installation, Maintenance & Repair (174 | 3.5%).
Natural Resources, Construction and Maintenance Occupations by Sex
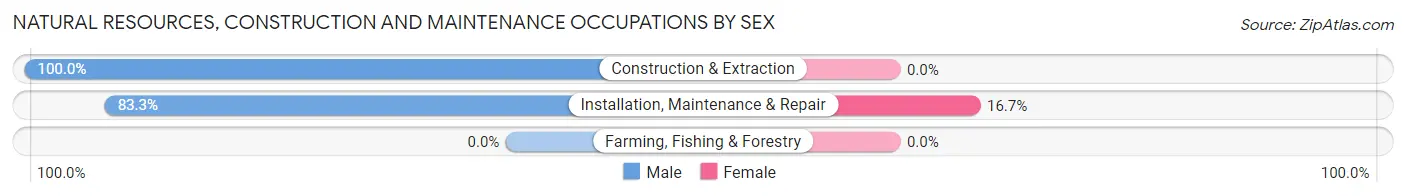
| Occupation | Male | Female |
| Farming, Fishing & Forestry | 0 (0.0%) | 0 (0.0%) |
| Construction & Extraction | 338 (100.0%) | 0 (0.0%) |
| Installation, Maintenance & Repair | 145 (83.3%) | 29 (16.7%) |
| Total (Category) | 483 (94.3%) | 29 (5.7%) |
| Total (Overall) | 2,973 (59.1%) | 2,059 (40.9%) |
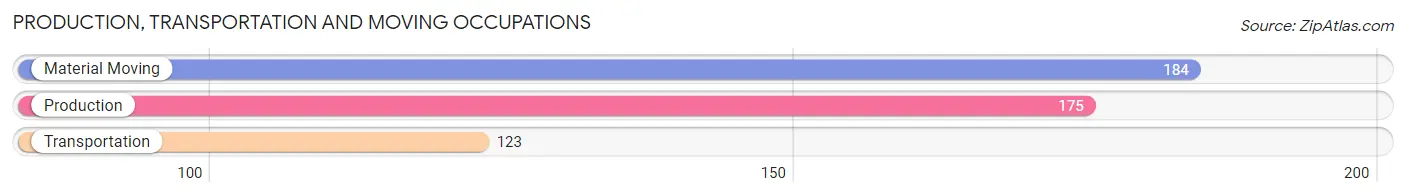
Production, Transportation and Moving Occupations
The most common Production, Transportation and Moving occupations in San Diego Country Estates are Material Moving (184 | 3.7%), Production (175 | 3.5%), and Transportation (123 | 2.4%).
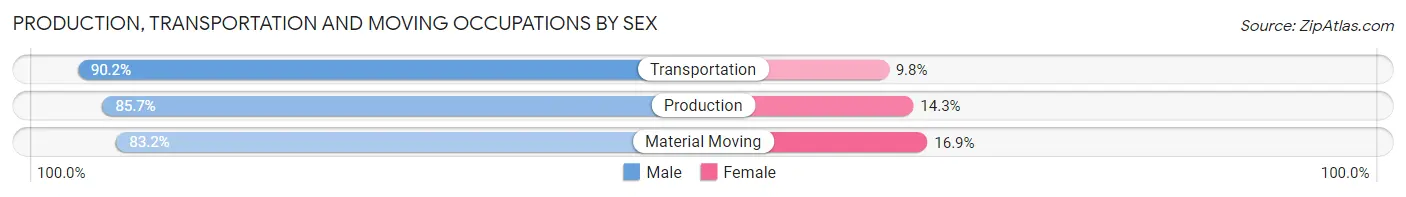
Production, Transportation and Moving Occupations by Sex
| Occupation | Male | Female |
| Production | 150 (85.7%) | 25 (14.3%) |
| Transportation | 111 (90.2%) | 12 (9.8%) |
| Material Moving | 153 (83.2%) | 31 (16.9%) |
| Total (Category) | 414 (85.9%) | 68 (14.1%) |
| Total (Overall) | 2,973 (59.1%) | 2,059 (40.9%) |
Employment Industries by Sex in San Diego Country Estates
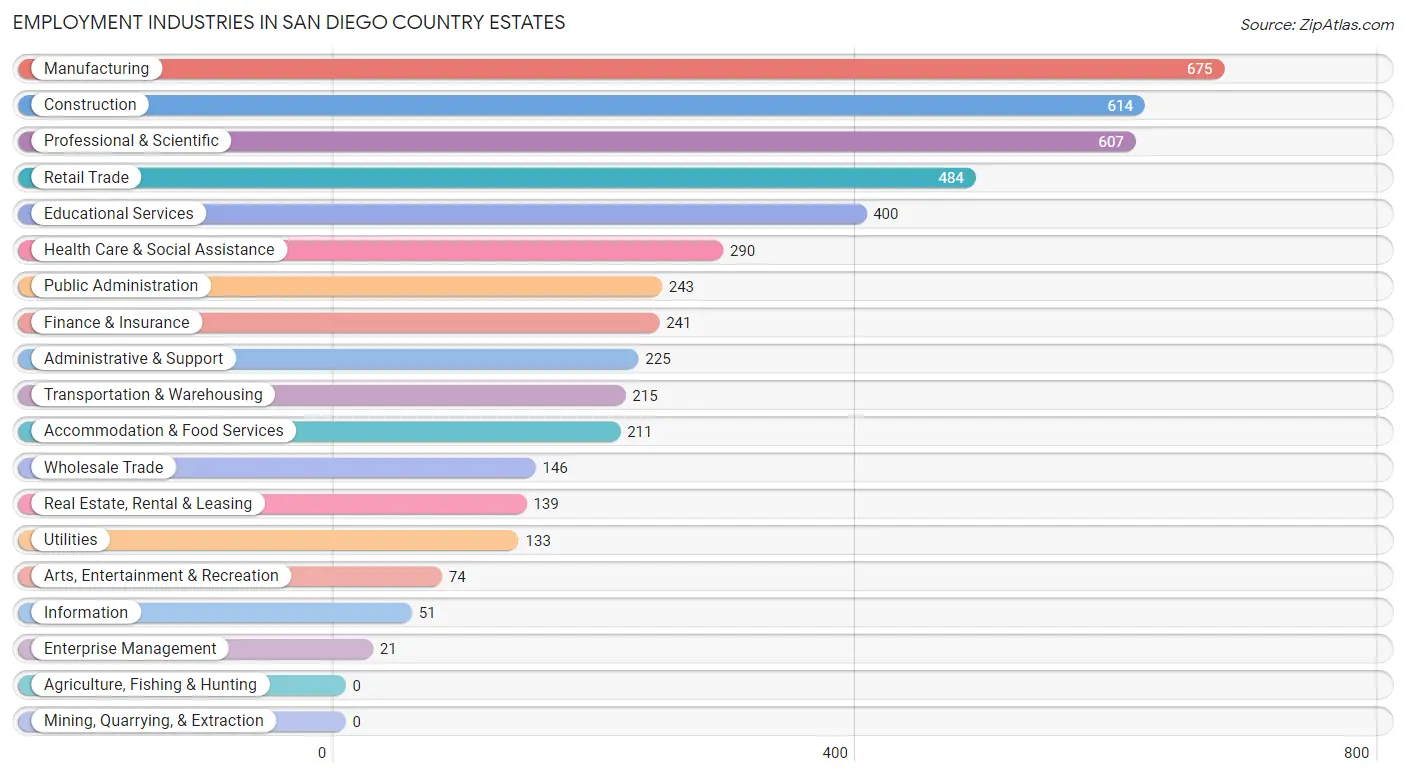
Employment Industries in San Diego Country Estates
The major employment industries in San Diego Country Estates include Manufacturing (675 | 13.4%), Construction (614 | 12.2%), Professional & Scientific (607 | 12.1%), Retail Trade (484 | 9.6%), and Educational Services (400 | 8.0%).
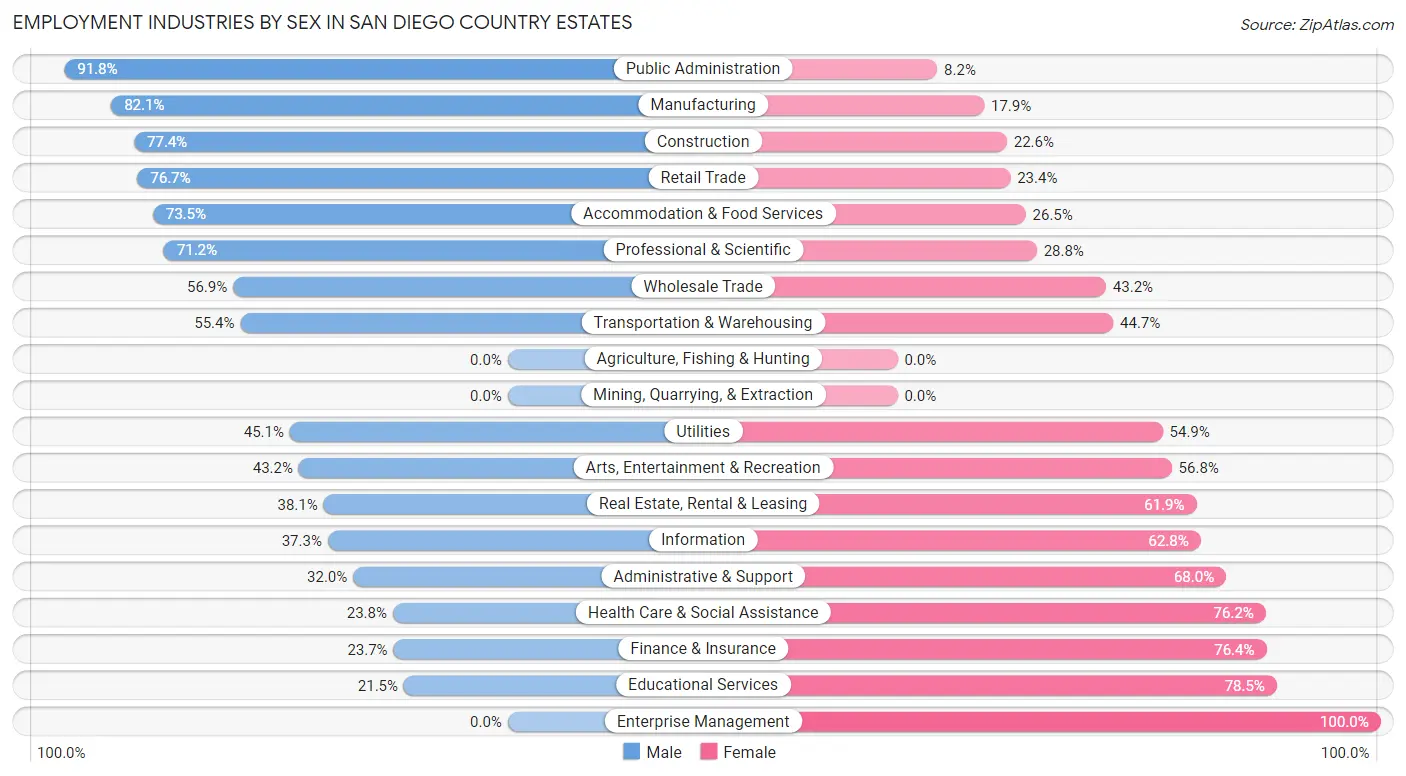
Employment Industries by Sex in San Diego Country Estates
The San Diego Country Estates industries that see more men than women are Public Administration (91.8%), Manufacturing (82.1%), and Construction (77.4%), whereas the industries that tend to have a higher number of women are Enterprise Management (100.0%), Educational Services (78.5%), and Finance & Insurance (76.3%).
| Industry | Male | Female |
| Agriculture, Fishing & Hunting | 0 (0.0%) | 0 (0.0%) |
| Mining, Quarrying, & Extraction | 0 (0.0%) | 0 (0.0%) |
| Construction | 475 (77.4%) | 139 (22.6%) |
| Manufacturing | 554 (82.1%) | 121 (17.9%) |
| Wholesale Trade | 83 (56.9%) | 63 (43.1%) |
| Retail Trade | 371 (76.6%) | 113 (23.4%) |
| Transportation & Warehousing | 119 (55.3%) | 96 (44.7%) |
| Utilities | 60 (45.1%) | 73 (54.9%) |
| Information | 19 (37.2%) | 32 (62.7%) |
| Finance & Insurance | 57 (23.6%) | 184 (76.3%) |
| Real Estate, Rental & Leasing | 53 (38.1%) | 86 (61.9%) |
| Professional & Scientific | 432 (71.2%) | 175 (28.8%) |
| Enterprise Management | 0 (0.0%) | 21 (100.0%) |
| Administrative & Support | 72 (32.0%) | 153 (68.0%) |
| Educational Services | 86 (21.5%) | 314 (78.5%) |
| Health Care & Social Assistance | 69 (23.8%) | 221 (76.2%) |
| Arts, Entertainment & Recreation | 32 (43.2%) | 42 (56.8%) |
| Accommodation & Food Services | 155 (73.5%) | 56 (26.5%) |
| Public Administration | 223 (91.8%) | 20 (8.2%) |
| Total | 2,973 (59.1%) | 2,059 (40.9%) |
Education in San Diego Country Estates
School Enrollment in San Diego Country Estates
The most common levels of schooling among the 2,618 students in San Diego Country Estates are middle school (636 | 24.3%), high school (619 | 23.6%), and college / undergraduate (599 | 22.9%).
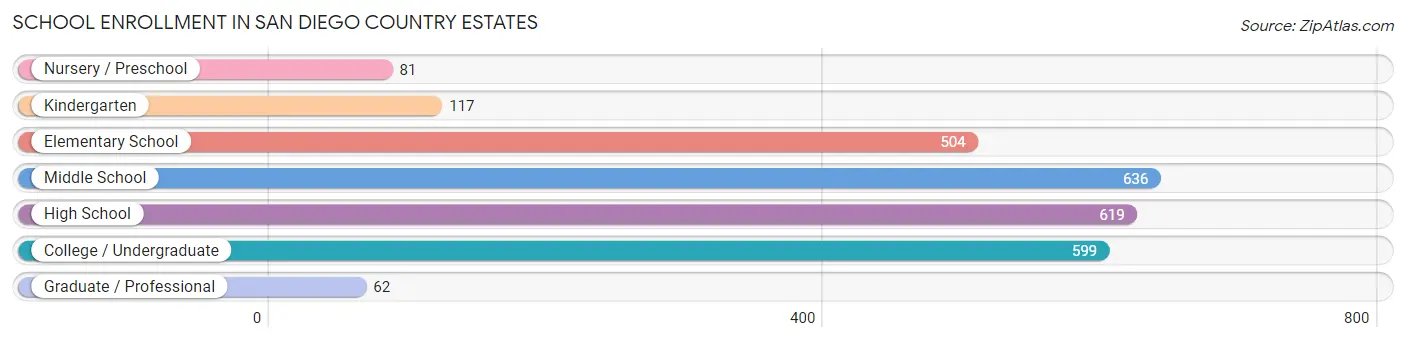
| School Level | # Students | % Students |
| Nursery / Preschool | 81 | 3.1% |
| Kindergarten | 117 | 4.5% |
| Elementary School | 504 | 19.3% |
| Middle School | 636 | 24.3% |
| High School | 619 | 23.6% |
| College / Undergraduate | 599 | 22.9% |
| Graduate / Professional | 62 | 2.4% |
| Total | 2,618 | 100.0% |
School Enrollment by Age by Funding Source in San Diego Country Estates
Out of a total of 2,618 students who are enrolled in schools in San Diego Country Estates, 453 (17.3%) attend a private institution, while the remaining 2,165 (82.7%) are enrolled in public schools. The age group of 25 to 34 year olds has the highest likelihood of being enrolled in private schools, with 46 (42.2% in the age bracket) enrolled. Conversely, the age group of 18 to 19 year olds has the lowest likelihood of being enrolled in a private school, with 164 (98.2% in the age bracket) attending a public institution.
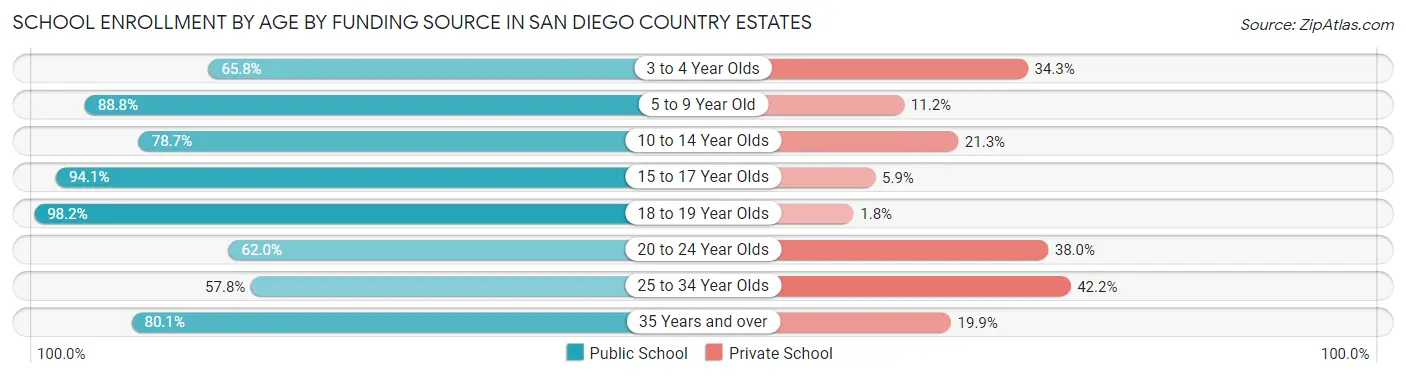
| Age Bracket | Public School | Private School |
| 3 to 4 Year Olds | 48 (65.7%) | 25 (34.3%) |
| 5 to 9 Year Old | 459 (88.8%) | 58 (11.2%) |
| 10 to 14 Year Olds | 614 (78.7%) | 166 (21.3%) |
| 15 to 17 Year Olds | 498 (94.1%) | 31 (5.9%) |
| 18 to 19 Year Olds | 164 (98.2%) | 3 (1.8%) |
| 20 to 24 Year Olds | 119 (62.0%) | 73 (38.0%) |
| 25 to 34 Year Olds | 63 (57.8%) | 46 (42.2%) |
| 35 Years and over | 201 (80.1%) | 50 (19.9%) |
| Total | 2,165 (82.7%) | 453 (17.3%) |
Educational Attainment by Field of Study in San Diego Country Estates
Business (723 | 28.1%), education (437 | 17.0%), social sciences (243 | 9.4%), bio, nature & agricultural (204 | 7.9%), and engineering (159 | 6.2%) are the most common fields of study among 2,574 individuals in San Diego Country Estates who have obtained a bachelor's degree or higher.
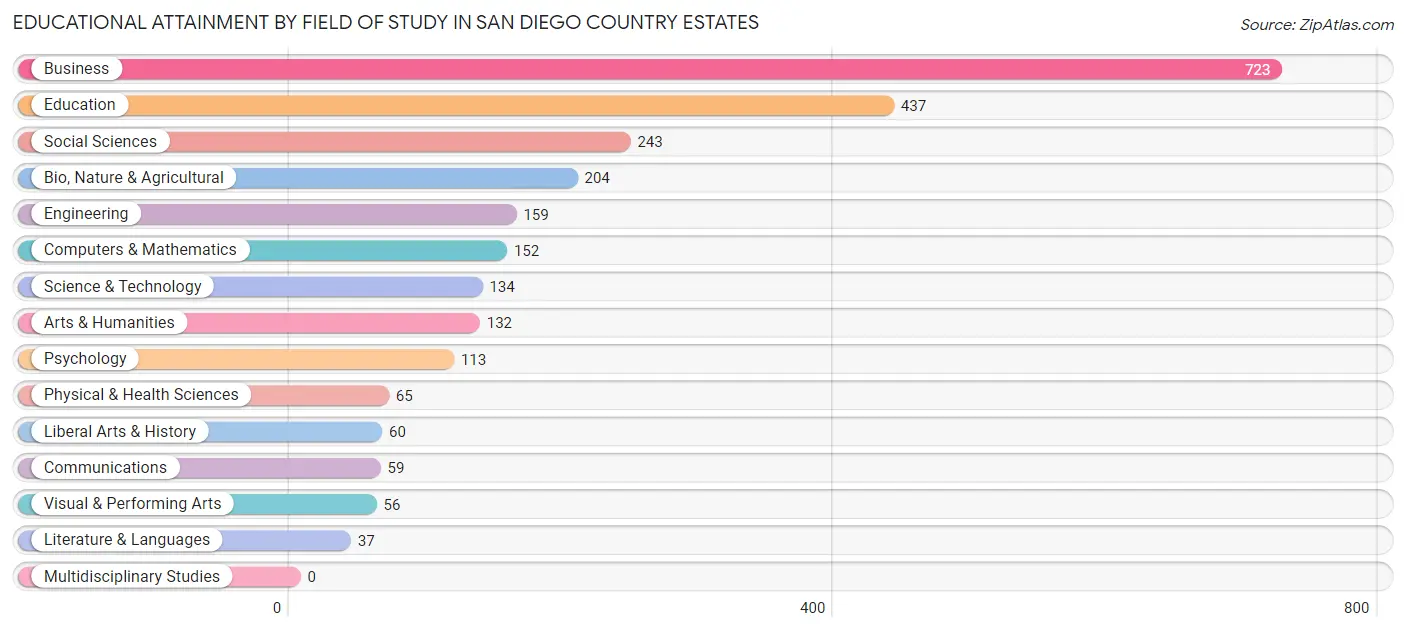
| Field of Study | # Graduates | % Graduates |
| Computers & Mathematics | 152 | 5.9% |
| Bio, Nature & Agricultural | 204 | 7.9% |
| Physical & Health Sciences | 65 | 2.5% |
| Psychology | 113 | 4.4% |
| Social Sciences | 243 | 9.4% |
| Engineering | 159 | 6.2% |
| Multidisciplinary Studies | 0 | 0.0% |
| Science & Technology | 134 | 5.2% |
| Business | 723 | 28.1% |
| Education | 437 | 17.0% |
| Literature & Languages | 37 | 1.4% |
| Liberal Arts & History | 60 | 2.3% |
| Visual & Performing Arts | 56 | 2.2% |
| Communications | 59 | 2.3% |
| Arts & Humanities | 132 | 5.1% |
| Total | 2,574 | 100.0% |
Transportation & Commute in San Diego Country Estates
Vehicle Availability by Sex in San Diego Country Estates
The most prevalent vehicle ownership categories in San Diego Country Estates are males with 2 vehicles (1,180, accounting for 38.1%) and females with 2 vehicles (933, making up 59.2%).
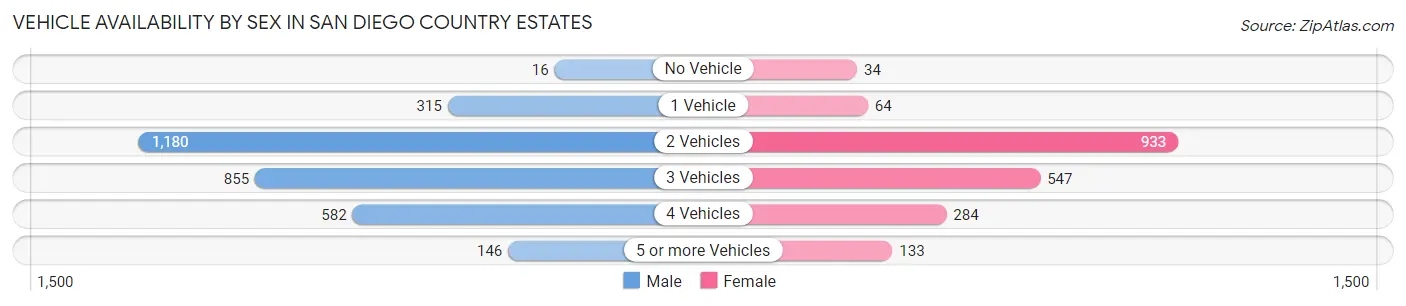
| Vehicles Available | Male | Female |
| No Vehicle | 16 (0.5%) | 34 (1.7%) |
| 1 Vehicle | 315 (10.2%) | 64 (3.2%) |
| 2 Vehicles | 1,180 (38.1%) | 933 (46.8%) |
| 3 Vehicles | 855 (27.6%) | 547 (27.4%) |
| 4 Vehicles | 582 (18.8%) | 284 (14.2%) |
| 5 or more Vehicles | 146 (4.7%) | 133 (6.7%) |
| Total | 3,094 (100.0%) | 1,995 (100.0%) |
Commute Time in San Diego Country Estates
The most frequently occuring commute durations in San Diego Country Estates are 45 to 59 minutes (1,137 commuters, 25.1%), 60 to 89 minutes (674 commuters, 14.9%), and 30 to 34 minutes (647 commuters, 14.3%).
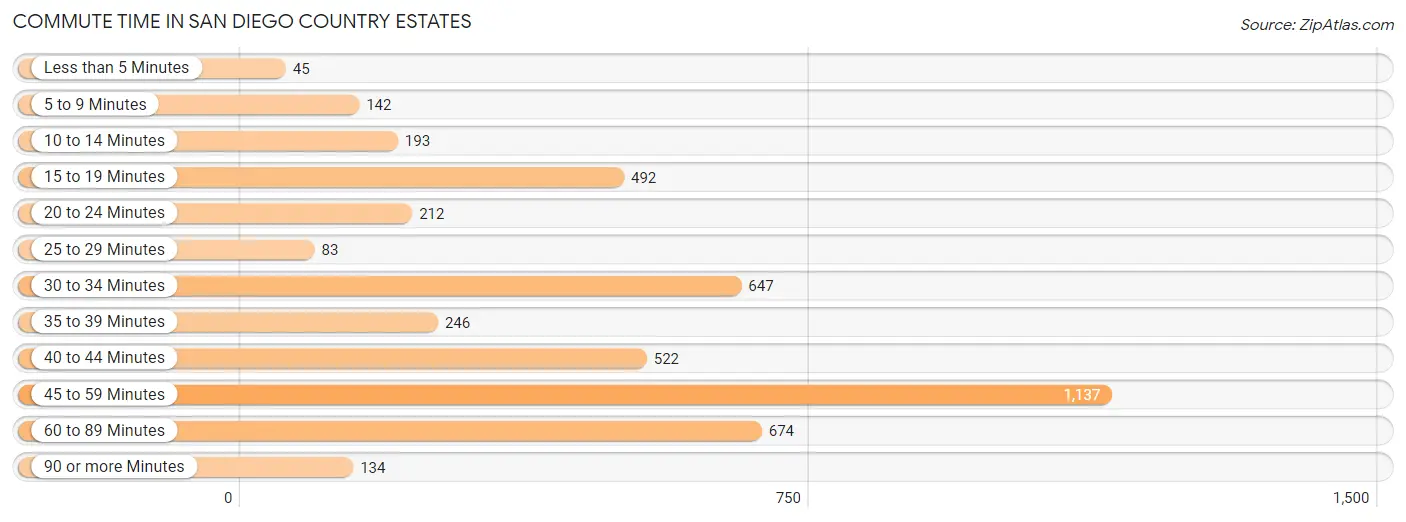
| Commute Time | # Commuters | % Commuters |
| Less than 5 Minutes | 45 | 1.0% |
| 5 to 9 Minutes | 142 | 3.1% |
| 10 to 14 Minutes | 193 | 4.3% |
| 15 to 19 Minutes | 492 | 10.9% |
| 20 to 24 Minutes | 212 | 4.7% |
| 25 to 29 Minutes | 83 | 1.8% |
| 30 to 34 Minutes | 647 | 14.3% |
| 35 to 39 Minutes | 246 | 5.4% |
| 40 to 44 Minutes | 522 | 11.5% |
| 45 to 59 Minutes | 1,137 | 25.1% |
| 60 to 89 Minutes | 674 | 14.9% |
| 90 or more Minutes | 134 | 3.0% |
Commute Time by Sex in San Diego Country Estates
The most common commute times in San Diego Country Estates are 45 to 59 minutes (642 commuters, 23.1%) for males and 45 to 59 minutes (495 commuters, 28.3%) for females.
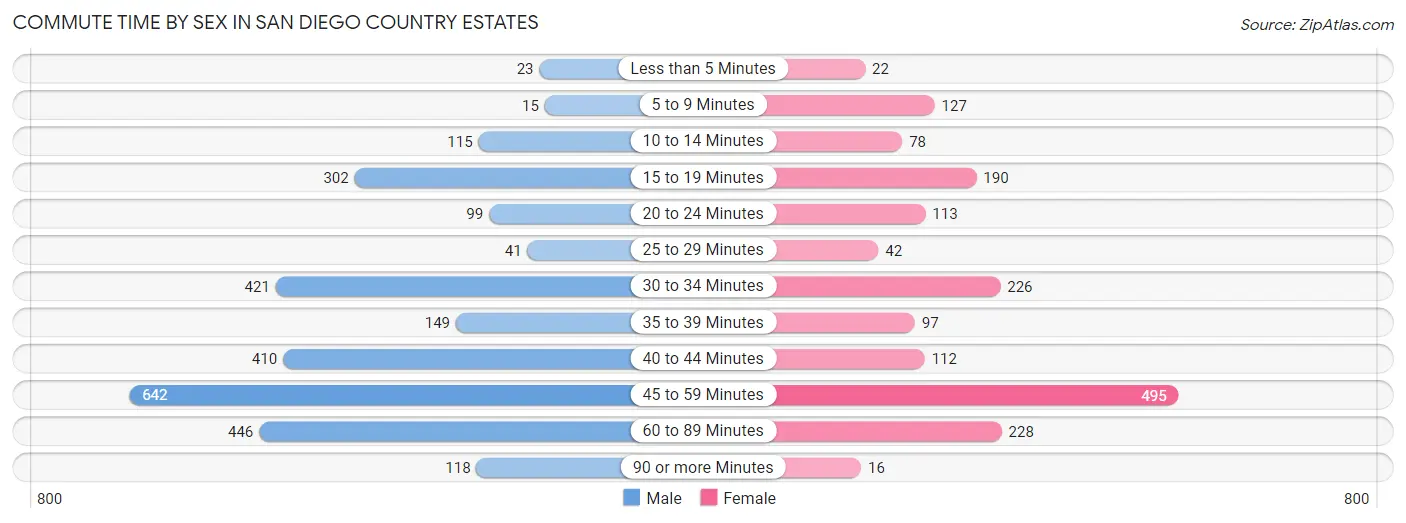
| Commute Time | Male | Female |
| Less than 5 Minutes | 23 (0.8%) | 22 (1.3%) |
| 5 to 9 Minutes | 15 (0.5%) | 127 (7.3%) |
| 10 to 14 Minutes | 115 (4.1%) | 78 (4.5%) |
| 15 to 19 Minutes | 302 (10.9%) | 190 (10.9%) |
| 20 to 24 Minutes | 99 (3.6%) | 113 (6.5%) |
| 25 to 29 Minutes | 41 (1.5%) | 42 (2.4%) |
| 30 to 34 Minutes | 421 (15.1%) | 226 (12.9%) |
| 35 to 39 Minutes | 149 (5.4%) | 97 (5.6%) |
| 40 to 44 Minutes | 410 (14.7%) | 112 (6.4%) |
| 45 to 59 Minutes | 642 (23.1%) | 495 (28.3%) |
| 60 to 89 Minutes | 446 (16.0%) | 228 (13.1%) |
| 90 or more Minutes | 118 (4.2%) | 16 (0.9%) |
Time of Departure to Work by Sex in San Diego Country Estates
The most frequent times of departure to work in San Diego Country Estates are 6:00 AM to 6:29 AM (569, 20.5%) for males and 7:00 AM to 7:29 AM (415, 23.8%) for females.
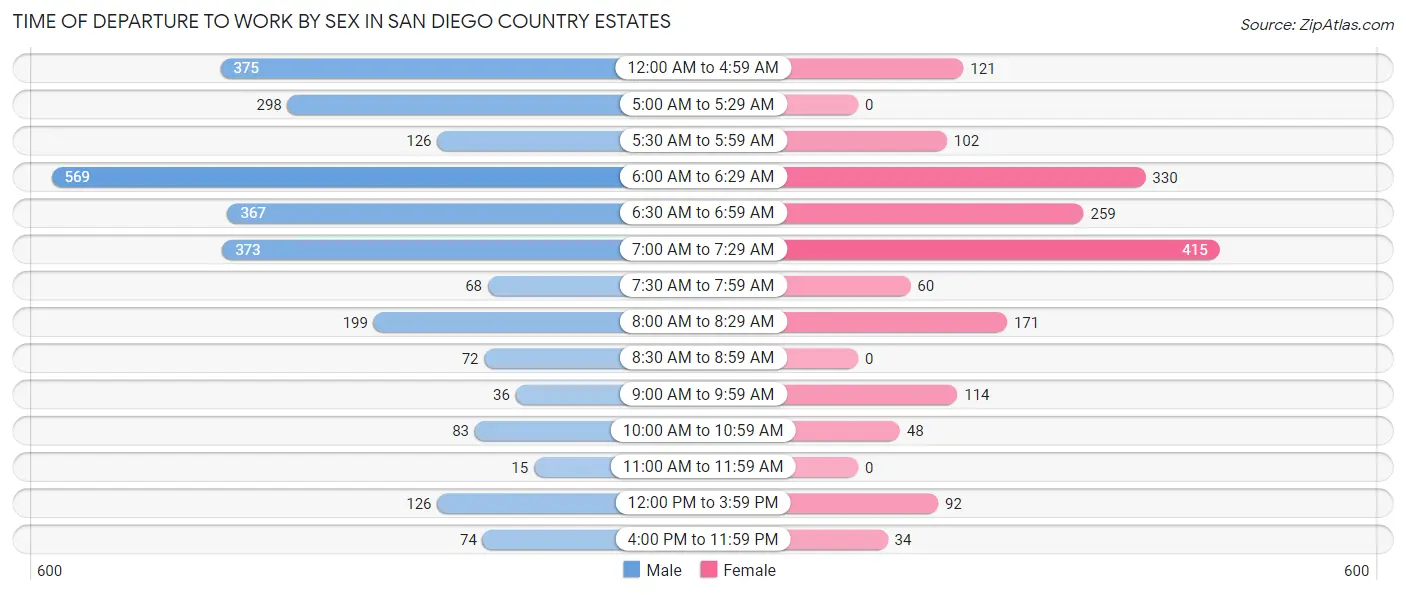
| Time of Departure | Male | Female |
| 12:00 AM to 4:59 AM | 375 (13.5%) | 121 (6.9%) |
| 5:00 AM to 5:29 AM | 298 (10.7%) | 0 (0.0%) |
| 5:30 AM to 5:59 AM | 126 (4.5%) | 102 (5.8%) |
| 6:00 AM to 6:29 AM | 569 (20.5%) | 330 (18.9%) |
| 6:30 AM to 6:59 AM | 367 (13.2%) | 259 (14.8%) |
| 7:00 AM to 7:29 AM | 373 (13.4%) | 415 (23.8%) |
| 7:30 AM to 7:59 AM | 68 (2.5%) | 60 (3.4%) |
| 8:00 AM to 8:29 AM | 199 (7.2%) | 171 (9.8%) |
| 8:30 AM to 8:59 AM | 72 (2.6%) | 0 (0.0%) |
| 9:00 AM to 9:59 AM | 36 (1.3%) | 114 (6.5%) |
| 10:00 AM to 10:59 AM | 83 (3.0%) | 48 (2.8%) |
| 11:00 AM to 11:59 AM | 15 (0.5%) | 0 (0.0%) |
| 12:00 PM to 3:59 PM | 126 (4.5%) | 92 (5.3%) |
| 4:00 PM to 11:59 PM | 74 (2.7%) | 34 (1.9%) |
| Total | 2,781 (100.0%) | 1,746 (100.0%) |
Housing Occupancy in San Diego Country Estates
Occupancy by Ownership in San Diego Country Estates
Of the total 3,382 dwellings in San Diego Country Estates, owner-occupied units account for 2,944 (87.1%), while renter-occupied units make up 438 (13.0%).
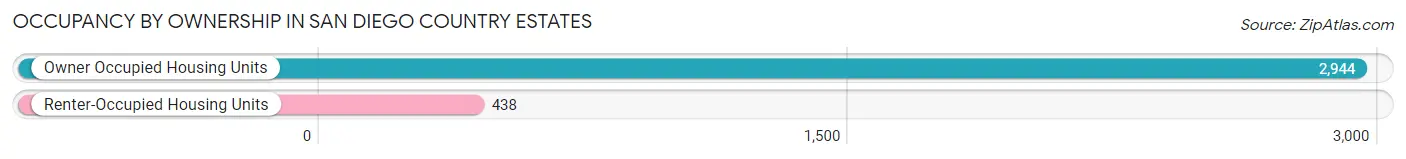
| Occupancy | # Housing Units | % Housing Units |
| Owner Occupied Housing Units | 2,944 | 87.1% |
| Renter-Occupied Housing Units | 438 | 13.0% |
| Total Occupied Housing Units | 3,382 | 100.0% |
Occupancy by Household Size in San Diego Country Estates
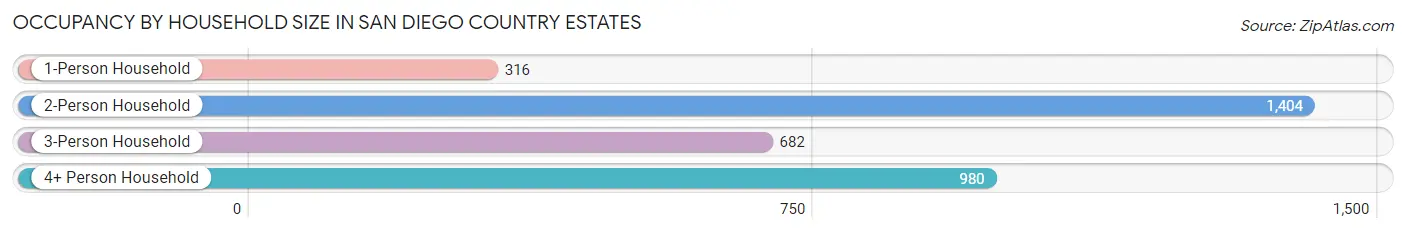
| Household Size | # Housing Units | % Housing Units |
| 1-Person Household | 316 | 9.3% |
| 2-Person Household | 1,404 | 41.5% |
| 3-Person Household | 682 | 20.2% |
| 4+ Person Household | 980 | 29.0% |
| Total Housing Units | 3,382 | 100.0% |
Occupancy by Ownership by Household Size in San Diego Country Estates
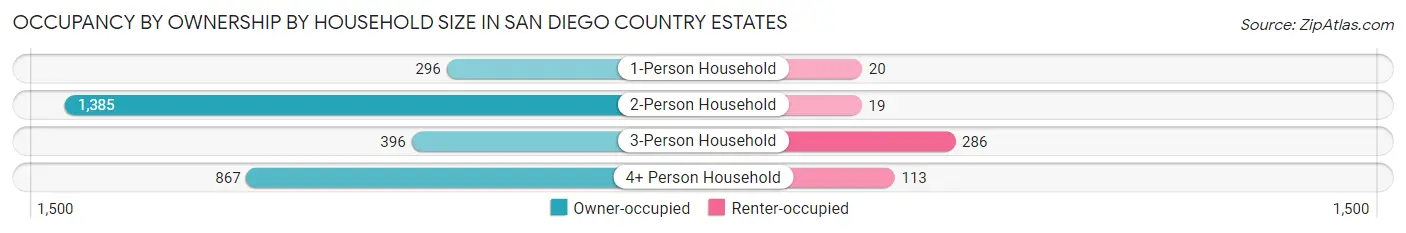
| Household Size | Owner-occupied | Renter-occupied |
| 1-Person Household | 296 (93.7%) | 20 (6.3%) |
| 2-Person Household | 1,385 (98.7%) | 19 (1.3%) |
| 3-Person Household | 396 (58.1%) | 286 (41.9%) |
| 4+ Person Household | 867 (88.5%) | 113 (11.5%) |
| Total Housing Units | 2,944 (87.1%) | 438 (13.0%) |
Occupancy by Educational Attainment in San Diego Country Estates
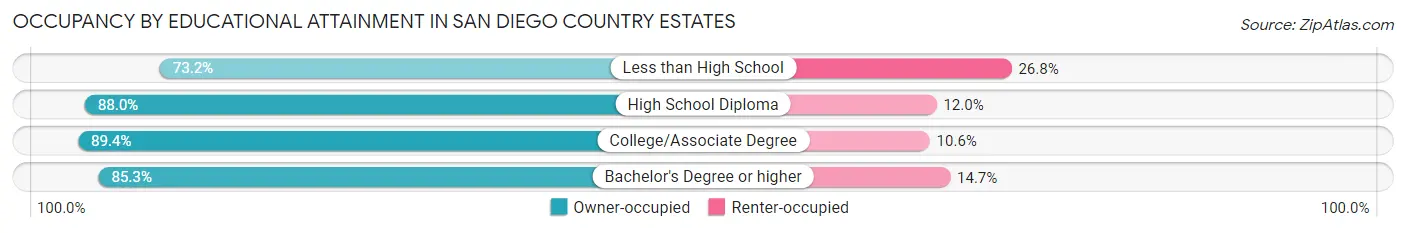
| Household Size | Owner-occupied | Renter-occupied |
| Less than High School | 60 (73.2%) | 22 (26.8%) |
| High School Diploma | 405 (88.0%) | 55 (12.0%) |
| College/Associate Degree | 1,222 (89.4%) | 145 (10.6%) |
| Bachelor's Degree or higher | 1,257 (85.3%) | 216 (14.7%) |
Occupancy by Age of Householder in San Diego Country Estates
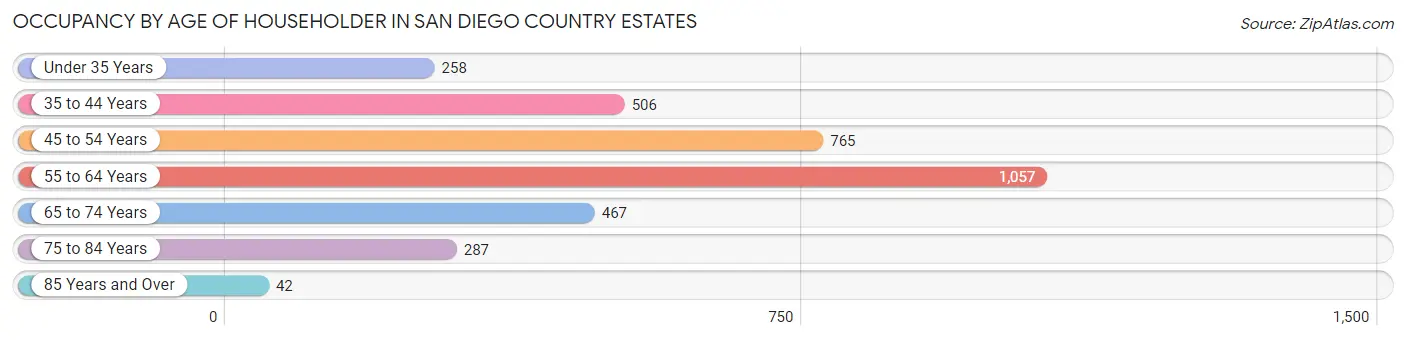
| Age Bracket | # Households | % Households |
| Under 35 Years | 258 | 7.6% |
| 35 to 44 Years | 506 | 15.0% |
| 45 to 54 Years | 765 | 22.6% |
| 55 to 64 Years | 1,057 | 31.2% |
| 65 to 74 Years | 467 | 13.8% |
| 75 to 84 Years | 287 | 8.5% |
| 85 Years and Over | 42 | 1.2% |
| Total | 3,382 | 100.0% |
Housing Finances in San Diego Country Estates
Median Income by Occupancy in San Diego Country Estates
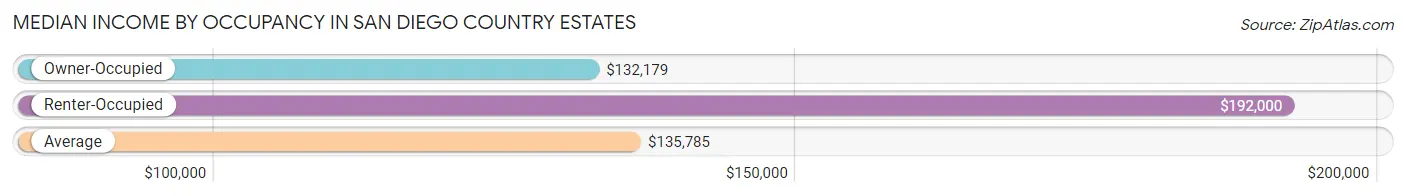
| Occupancy Type | # Households | Median Income |
| Owner-Occupied | 2,944 (87.1%) | $132,179 |
| Renter-Occupied | 438 (13.0%) | $192,000 |
| Average | 3,382 (100.0%) | $135,785 |
Occupancy by Householder Income Bracket in San Diego Country Estates
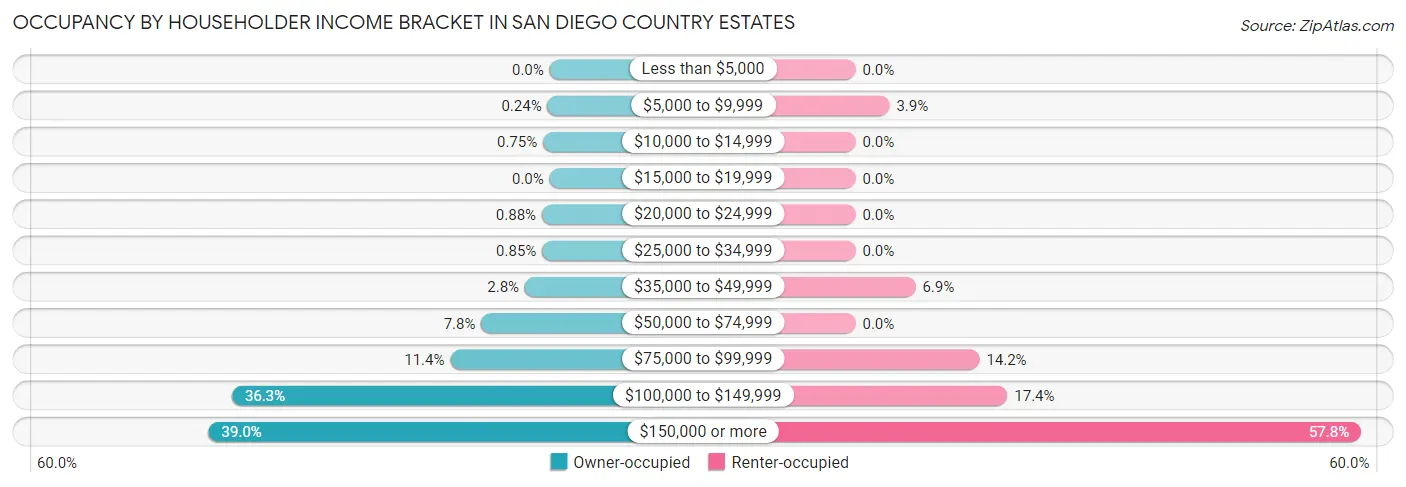
| Income Bracket | Owner-occupied | Renter-occupied |
| Less than $5,000 | 0 (0.0%) | 0 (0.0%) |
| $5,000 to $9,999 | 7 (0.2%) | 17 (3.9%) |
| $10,000 to $14,999 | 22 (0.7%) | 0 (0.0%) |
| $15,000 to $19,999 | 0 (0.0%) | 0 (0.0%) |
| $20,000 to $24,999 | 26 (0.9%) | 0 (0.0%) |
| $25,000 to $34,999 | 25 (0.9%) | 0 (0.0%) |
| $35,000 to $49,999 | 83 (2.8%) | 30 (6.9%) |
| $50,000 to $74,999 | 230 (7.8%) | 0 (0.0%) |
| $75,000 to $99,999 | 334 (11.4%) | 62 (14.2%) |
| $100,000 to $149,999 | 1,069 (36.3%) | 76 (17.3%) |
| $150,000 or more | 1,148 (39.0%) | 253 (57.8%) |
| Total | 2,944 (100.0%) | 438 (100.0%) |
Monthly Housing Cost Tiers in San Diego Country Estates
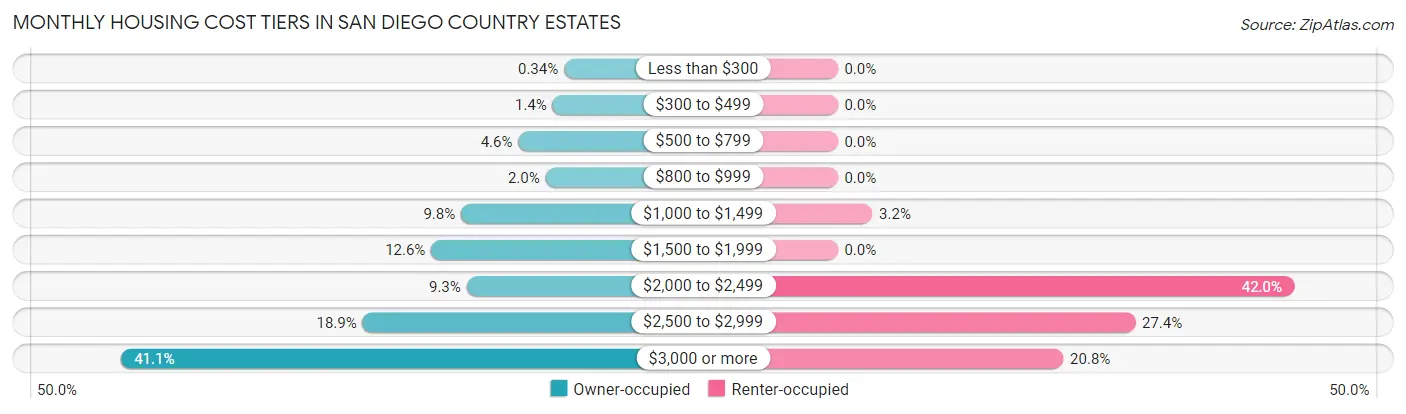
| Monthly Cost | Owner-occupied | Renter-occupied |
| Less than $300 | 10 (0.3%) | 0 (0.0%) |
| $300 to $499 | 41 (1.4%) | 0 (0.0%) |
| $500 to $799 | 134 (4.5%) | 0 (0.0%) |
| $800 to $999 | 60 (2.0%) | 0 (0.0%) |
| $1,000 to $1,499 | 289 (9.8%) | 14 (3.2%) |
| $1,500 to $1,999 | 370 (12.6%) | 0 (0.0%) |
| $2,000 to $2,499 | 274 (9.3%) | 184 (42.0%) |
| $2,500 to $2,999 | 556 (18.9%) | 120 (27.4%) |
| $3,000 or more | 1,210 (41.1%) | 91 (20.8%) |
| Total | 2,944 (100.0%) | 438 (100.0%) |
Physical Housing Characteristics in San Diego Country Estates
Housing Structures in San Diego Country Estates
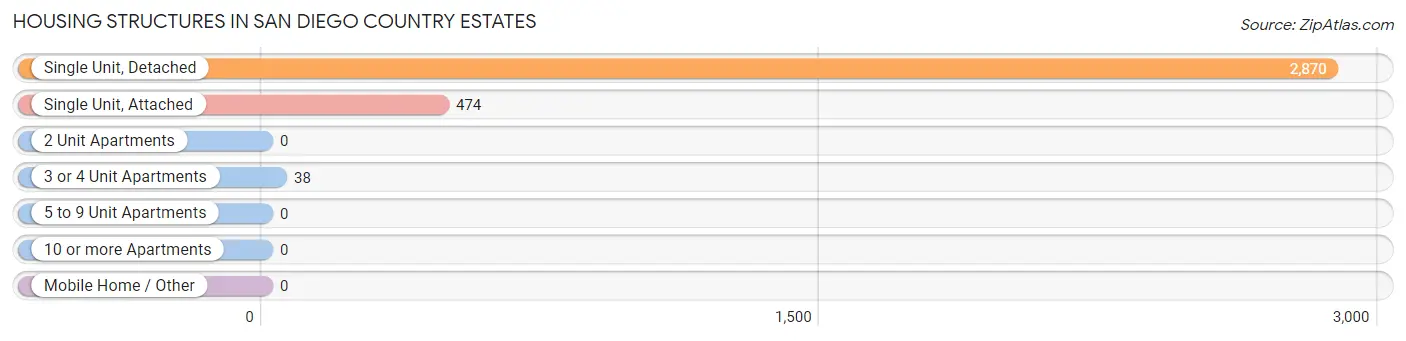
| Structure Type | # Housing Units | % Housing Units |
| Single Unit, Detached | 2,870 | 84.9% |
| Single Unit, Attached | 474 | 14.0% |
| 2 Unit Apartments | 0 | 0.0% |
| 3 or 4 Unit Apartments | 38 | 1.1% |
| 5 to 9 Unit Apartments | 0 | 0.0% |
| 10 or more Apartments | 0 | 0.0% |
| Mobile Home / Other | 0 | 0.0% |
| Total | 3,382 | 100.0% |
Housing Structures by Occupancy in San Diego Country Estates
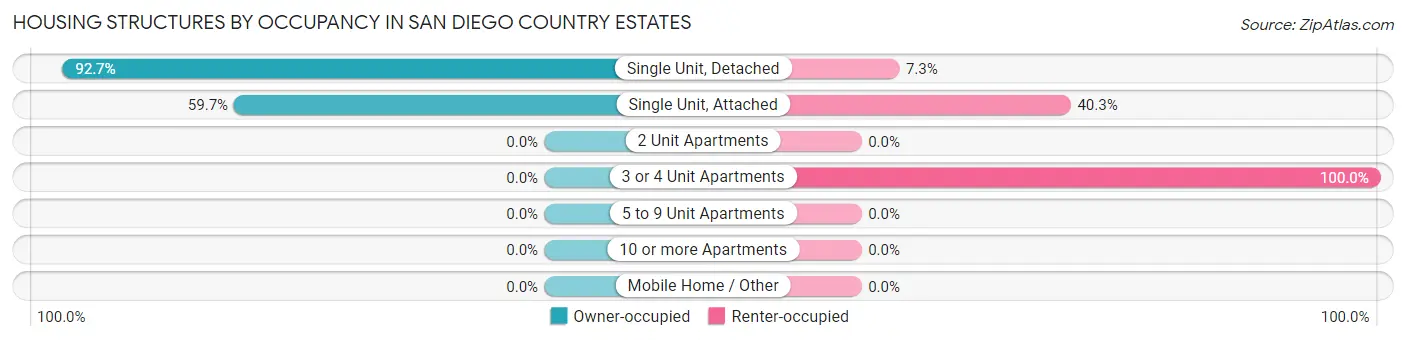
| Structure Type | Owner-occupied | Renter-occupied |
| Single Unit, Detached | 2,661 (92.7%) | 209 (7.3%) |
| Single Unit, Attached | 283 (59.7%) | 191 (40.3%) |
| 2 Unit Apartments | 0 (0.0%) | 0 (0.0%) |
| 3 or 4 Unit Apartments | 0 (0.0%) | 38 (100.0%) |
| 5 to 9 Unit Apartments | 0 (0.0%) | 0 (0.0%) |
| 10 or more Apartments | 0 (0.0%) | 0 (0.0%) |
| Mobile Home / Other | 0 (0.0%) | 0 (0.0%) |
| Total | 2,944 (87.1%) | 438 (13.0%) |
Housing Structures by Number of Rooms in San Diego Country Estates
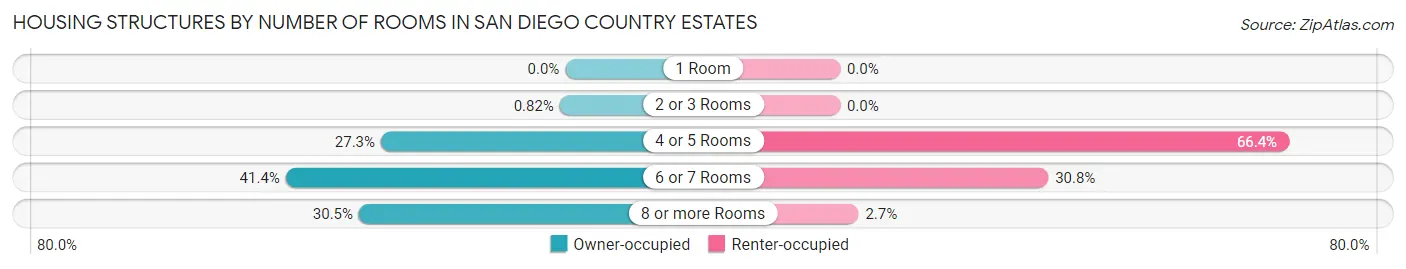
| Number of Rooms | Owner-occupied | Renter-occupied |
| 1 Room | 0 (0.0%) | 0 (0.0%) |
| 2 or 3 Rooms | 24 (0.8%) | 0 (0.0%) |
| 4 or 5 Rooms | 803 (27.3%) | 291 (66.4%) |
| 6 or 7 Rooms | 1,218 (41.4%) | 135 (30.8%) |
| 8 or more Rooms | 899 (30.5%) | 12 (2.7%) |
| Total | 2,944 (100.0%) | 438 (100.0%) |
Housing Structure by Heating Type in San Diego Country Estates
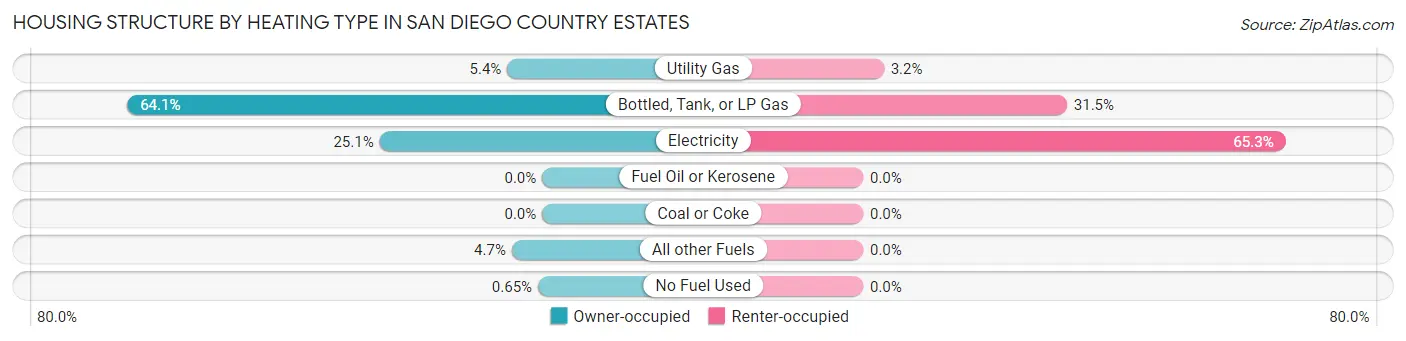
| Heating Type | Owner-occupied | Renter-occupied |
| Utility Gas | 159 (5.4%) | 14 (3.2%) |
| Bottled, Tank, or LP Gas | 1,888 (64.1%) | 138 (31.5%) |
| Electricity | 740 (25.1%) | 286 (65.3%) |
| Fuel Oil or Kerosene | 0 (0.0%) | 0 (0.0%) |
| Coal or Coke | 0 (0.0%) | 0 (0.0%) |
| All other Fuels | 138 (4.7%) | 0 (0.0%) |
| No Fuel Used | 19 (0.6%) | 0 (0.0%) |
| Total | 2,944 (100.0%) | 438 (100.0%) |
Household Vehicle Usage in San Diego Country Estates
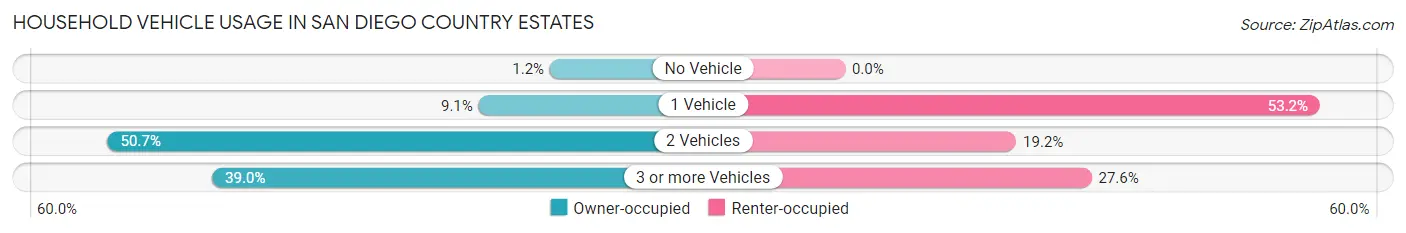
| Vehicles per Household | Owner-occupied | Renter-occupied |
| No Vehicle | 34 (1.1%) | 0 (0.0%) |
| 1 Vehicle | 269 (9.1%) | 233 (53.2%) |
| 2 Vehicles | 1,493 (50.7%) | 84 (19.2%) |
| 3 or more Vehicles | 1,148 (39.0%) | 121 (27.6%) |
| Total | 2,944 (100.0%) | 438 (100.0%) |
Real Estate & Mortgages in San Diego Country Estates
Real Estate and Mortgage Overview in San Diego Country Estates
| Characteristic | Without Mortgage | With Mortgage |
| Housing Units | 431 | 2,513 |
| Median Property Value | $659,000 | $656,200 |
| Median Household Income | $97,279 | $1,097 |
| Monthly Housing Costs | $1,055 | $1,210 |
| Real Estate Taxes | $5,030 | $58 |
Property Value by Mortgage Status in San Diego Country Estates
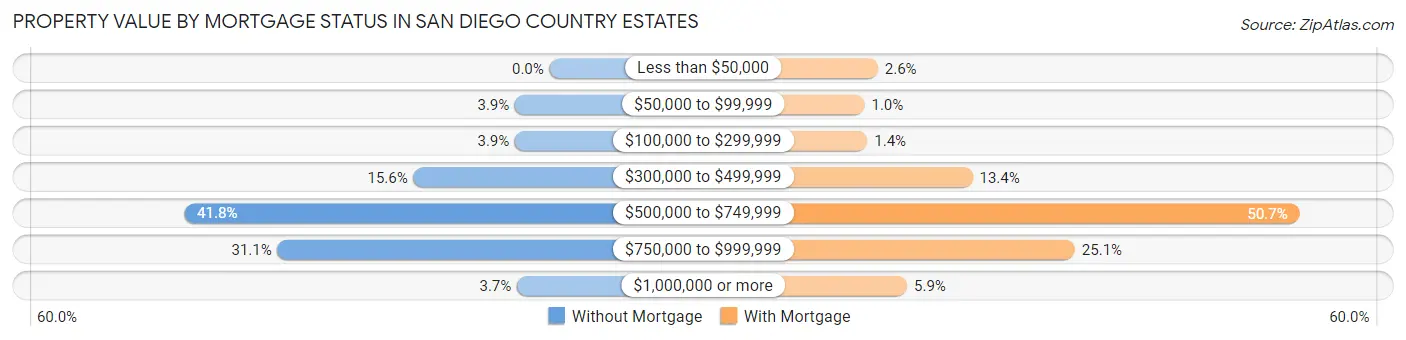
| Property Value | Without Mortgage | With Mortgage |
| Less than $50,000 | 0 (0.0%) | 64 (2.5%) |
| $50,000 to $99,999 | 17 (3.9%) | 26 (1.0%) |
| $100,000 to $299,999 | 17 (3.9%) | 34 (1.3%) |
| $300,000 to $499,999 | 67 (15.5%) | 336 (13.4%) |
| $500,000 to $749,999 | 180 (41.8%) | 1,275 (50.7%) |
| $750,000 to $999,999 | 134 (31.1%) | 630 (25.1%) |
| $1,000,000 or more | 16 (3.7%) | 148 (5.9%) |
| Total | 431 (100.0%) | 2,513 (100.0%) |
Household Income by Mortgage Status in San Diego Country Estates
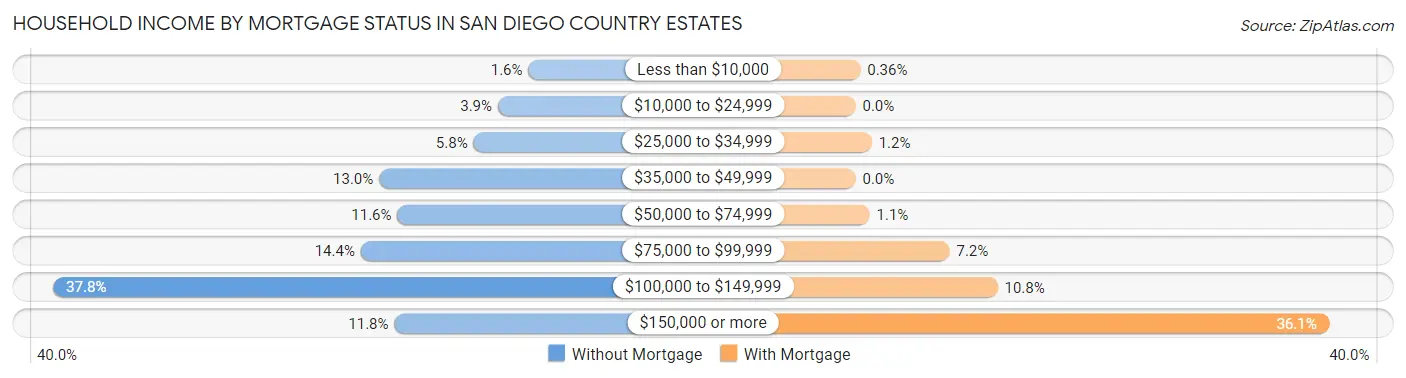
| Household Income | Without Mortgage | With Mortgage |
| Less than $10,000 | 7 (1.6%) | 9 (0.4%) |
| $10,000 to $24,999 | 17 (3.9%) | 0 (0.0%) |
| $25,000 to $34,999 | 25 (5.8%) | 31 (1.2%) |
| $35,000 to $49,999 | 56 (13.0%) | 0 (0.0%) |
| $50,000 to $74,999 | 50 (11.6%) | 27 (1.1%) |
| $75,000 to $99,999 | 62 (14.4%) | 180 (7.2%) |
| $100,000 to $149,999 | 163 (37.8%) | 272 (10.8%) |
| $150,000 or more | 51 (11.8%) | 906 (36.0%) |
| Total | 431 (100.0%) | 2,513 (100.0%) |
Property Value to Household Income Ratio in San Diego Country Estates
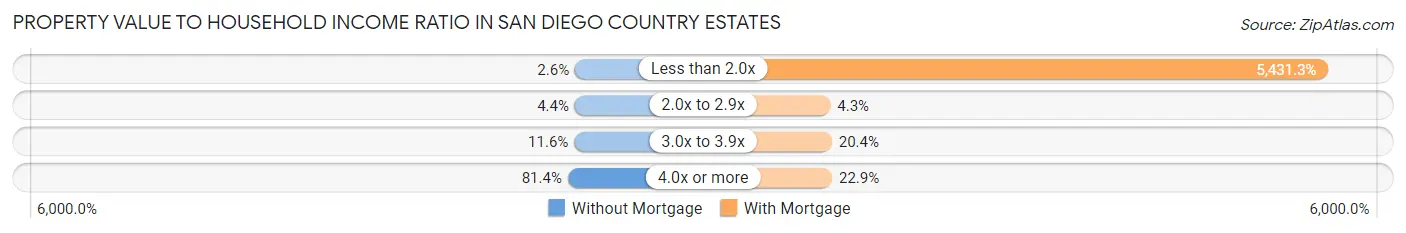
| Value-to-Income Ratio | Without Mortgage | With Mortgage |
| Less than 2.0x | 11 (2.5%) | 136,488 (5,431.3%) |
| 2.0x to 2.9x | 19 (4.4%) | 109 (4.3%) |
| 3.0x to 3.9x | 50 (11.6%) | 513 (20.4%) |
| 4.0x or more | 351 (81.4%) | 575 (22.9%) |
| Total | 431 (100.0%) | 2,513 (100.0%) |
Real Estate Taxes by Mortgage Status in San Diego Country Estates
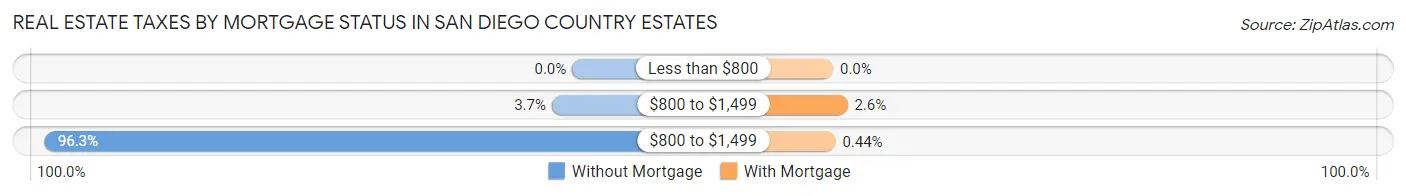
| Property Taxes | Without Mortgage | With Mortgage |
| Less than $800 | 0 (0.0%) | 0 (0.0%) |
| $800 to $1,499 | 16 (3.7%) | 66 (2.6%) |
| $800 to $1,499 | 415 (96.3%) | 11 (0.4%) |
| Total | 431 (100.0%) | 2,513 (100.0%) |
Health & Disability in San Diego Country Estates
Health Insurance Coverage by Age in San Diego Country Estates
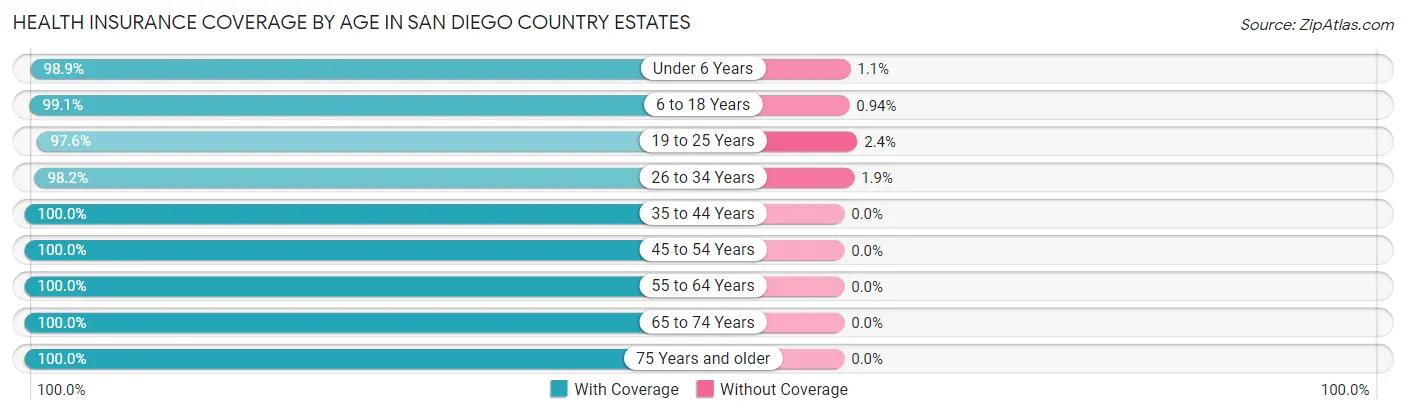
| Age Bracket | With Coverage | Without Coverage |
| Under 6 Years | 706 (98.9%) | 8 (1.1%) |
| 6 to 18 Years | 1,900 (99.1%) | 18 (0.9%) |
| 19 to 25 Years | 483 (97.6%) | 12 (2.4%) |
| 26 to 34 Years | 797 (98.2%) | 15 (1.8%) |
| 35 to 44 Years | 1,077 (100.0%) | 0 (0.0%) |
| 45 to 54 Years | 1,871 (100.0%) | 0 (0.0%) |
| 55 to 64 Years | 1,596 (100.0%) | 0 (0.0%) |
| 65 to 74 Years | 962 (100.0%) | 0 (0.0%) |
| 75 Years and older | 580 (100.0%) | 0 (0.0%) |
| Total | 9,972 (99.5%) | 53 (0.5%) |
Health Insurance Coverage by Citizenship Status in San Diego Country Estates
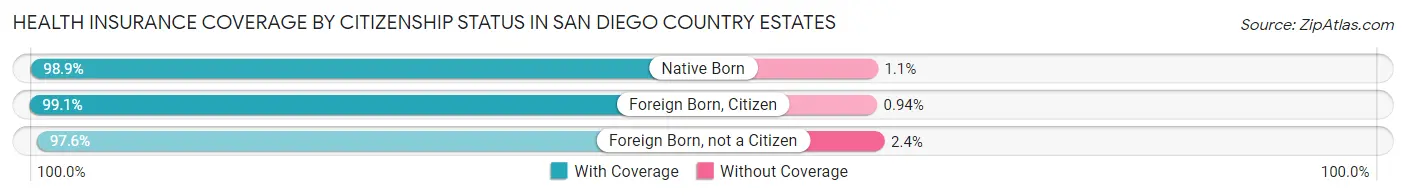
| Citizenship Status | With Coverage | Without Coverage |
| Native Born | 706 (98.9%) | 8 (1.1%) |
| Foreign Born, Citizen | 1,900 (99.1%) | 18 (0.9%) |
| Foreign Born, not a Citizen | 483 (97.6%) | 12 (2.4%) |
Health Insurance Coverage by Household Income in San Diego Country Estates
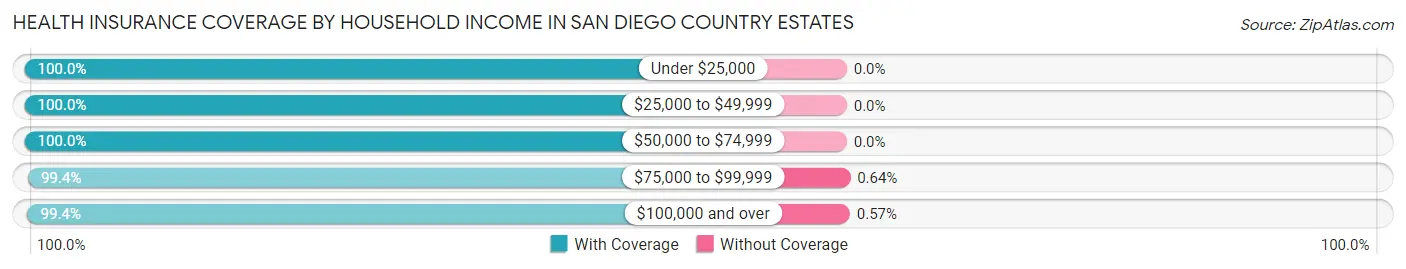
| Household Income | With Coverage | Without Coverage |
| Under $25,000 | 174 (100.0%) | 0 (0.0%) |
| $25,000 to $49,999 | 235 (100.0%) | 0 (0.0%) |
| $50,000 to $74,999 | 450 (100.0%) | 0 (0.0%) |
| $75,000 to $99,999 | 1,243 (99.4%) | 8 (0.6%) |
| $100,000 and over | 7,847 (99.4%) | 45 (0.6%) |
Public vs Private Health Insurance Coverage by Age in San Diego Country Estates
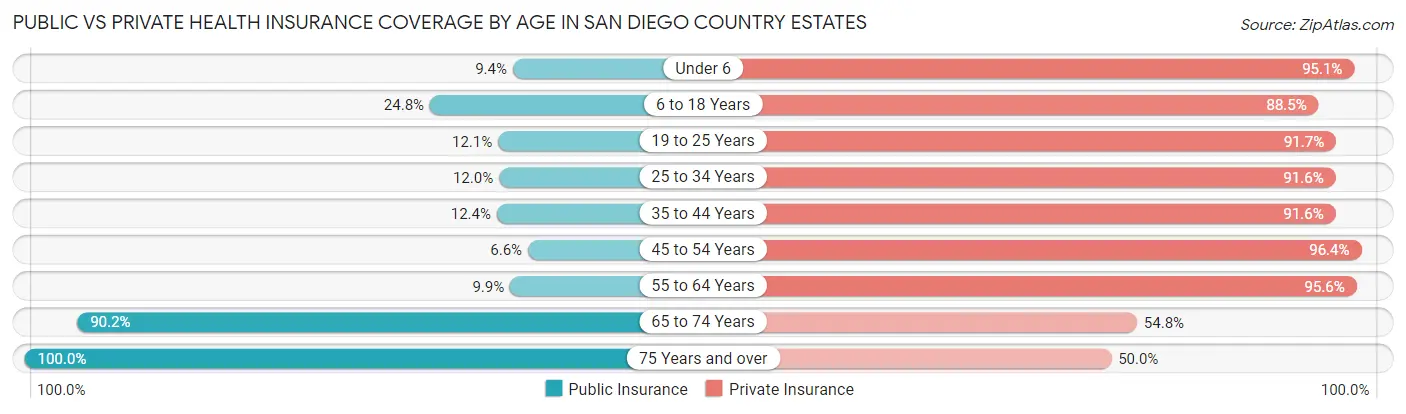
| Age Bracket | Public Insurance | Private Insurance |
| Under 6 | 67 (9.4%) | 679 (95.1%) |
| 6 to 18 Years | 475 (24.8%) | 1,697 (88.5%) |
| 19 to 25 Years | 60 (12.1%) | 454 (91.7%) |
| 25 to 34 Years | 97 (11.9%) | 744 (91.6%) |
| 35 to 44 Years | 133 (12.3%) | 987 (91.6%) |
| 45 to 54 Years | 123 (6.6%) | 1,804 (96.4%) |
| 55 to 64 Years | 158 (9.9%) | 1,525 (95.6%) |
| 65 to 74 Years | 868 (90.2%) | 527 (54.8%) |
| 75 Years and over | 580 (100.0%) | 290 (50.0%) |
| Total | 2,561 (25.6%) | 8,707 (86.9%) |
Disability Status by Sex by Age in San Diego Country Estates
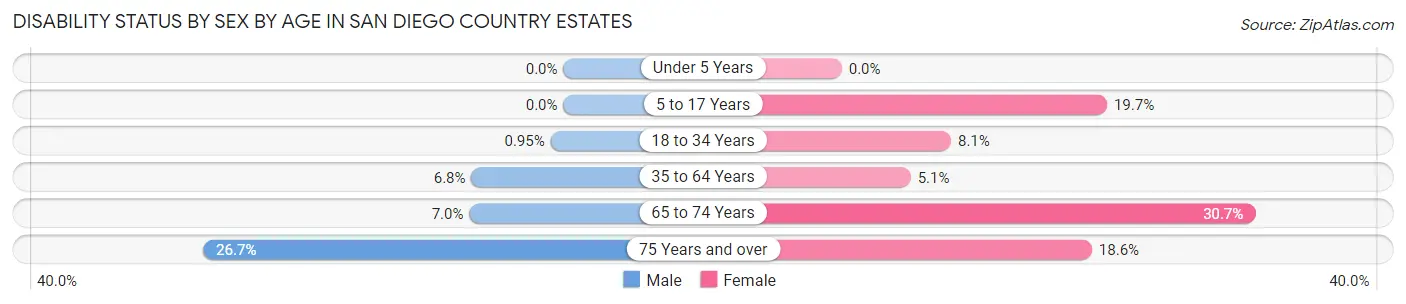
| Age Bracket | Male | Female |
| Under 5 Years | 0 (0.0%) | 0 (0.0%) |
| 5 to 17 Years | 0 (0.0%) | 192 (19.7%) |
| 18 to 34 Years | 9 (0.9%) | 45 (8.1%) |
| 35 to 64 Years | 161 (6.8%) | 112 (5.1%) |
| 65 to 74 Years | 31 (7.0%) | 159 (30.7%) |
| 75 Years and over | 73 (26.7%) | 57 (18.6%) |
Disability Class by Sex by Age in San Diego Country Estates
Disability Class: Hearing Difficulty
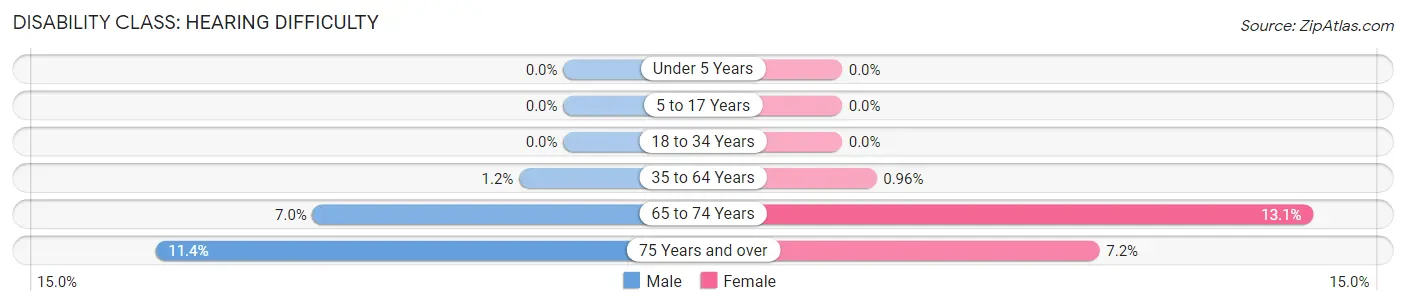
| Age Bracket | Male | Female |
| Under 5 Years | 0 (0.0%) | 0 (0.0%) |
| 5 to 17 Years | 0 (0.0%) | 0 (0.0%) |
| 18 to 34 Years | 0 (0.0%) | 0 (0.0%) |
| 35 to 64 Years | 29 (1.2%) | 21 (1.0%) |
| 65 to 74 Years | 31 (7.0%) | 68 (13.1%) |
| 75 Years and over | 31 (11.4%) | 22 (7.2%) |
Disability Class: Vision Difficulty
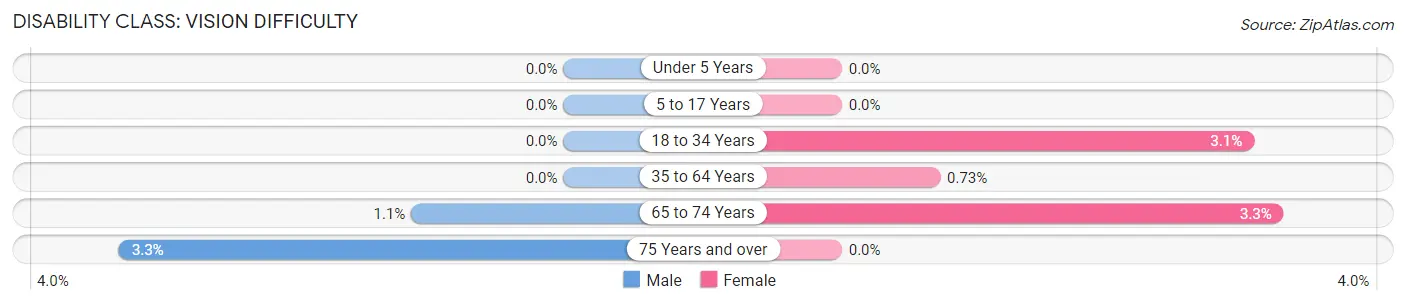
| Age Bracket | Male | Female |
| Under 5 Years | 0 (0.0%) | 0 (0.0%) |
| 5 to 17 Years | 0 (0.0%) | 0 (0.0%) |
| 18 to 34 Years | 0 (0.0%) | 17 (3.1%) |
| 35 to 64 Years | 0 (0.0%) | 16 (0.7%) |
| 65 to 74 Years | 5 (1.1%) | 17 (3.3%) |
| 75 Years and over | 9 (3.3%) | 0 (0.0%) |
Disability Class: Cognitive Difficulty
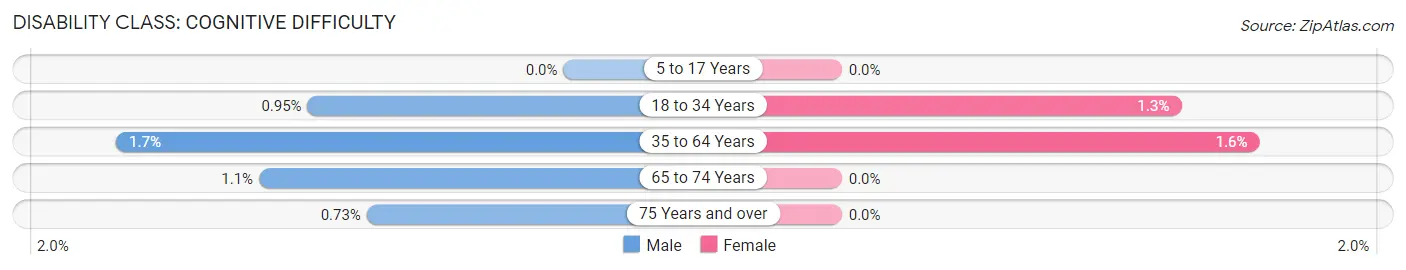
| Age Bracket | Male | Female |
| 5 to 17 Years | 0 (0.0%) | 0 (0.0%) |
| 18 to 34 Years | 9 (0.9%) | 7 (1.3%) |
| 35 to 64 Years | 39 (1.7%) | 34 (1.5%) |
| 65 to 74 Years | 5 (1.1%) | 0 (0.0%) |
| 75 Years and over | 2 (0.7%) | 0 (0.0%) |
Disability Class: Ambulatory Difficulty
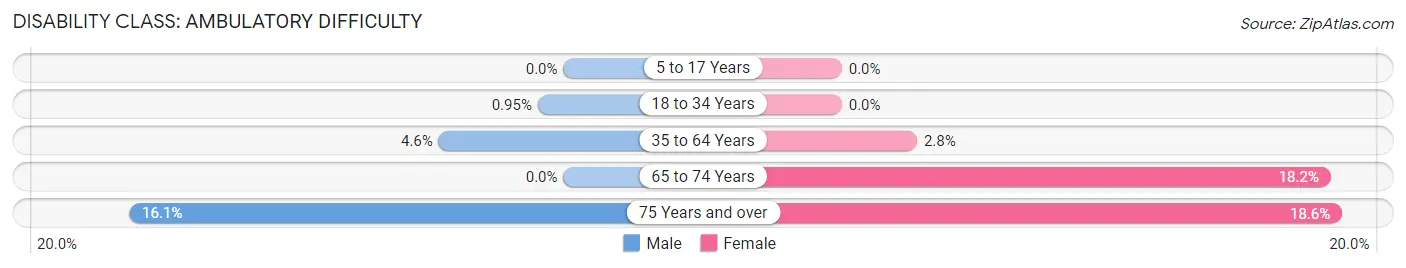
| Age Bracket | Male | Female |
| 5 to 17 Years | 0 (0.0%) | 0 (0.0%) |
| 18 to 34 Years | 9 (0.9%) | 0 (0.0%) |
| 35 to 64 Years | 109 (4.6%) | 61 (2.8%) |
| 65 to 74 Years | 0 (0.0%) | 94 (18.1%) |
| 75 Years and over | 44 (16.1%) | 57 (18.6%) |
Disability Class: Self-Care Difficulty
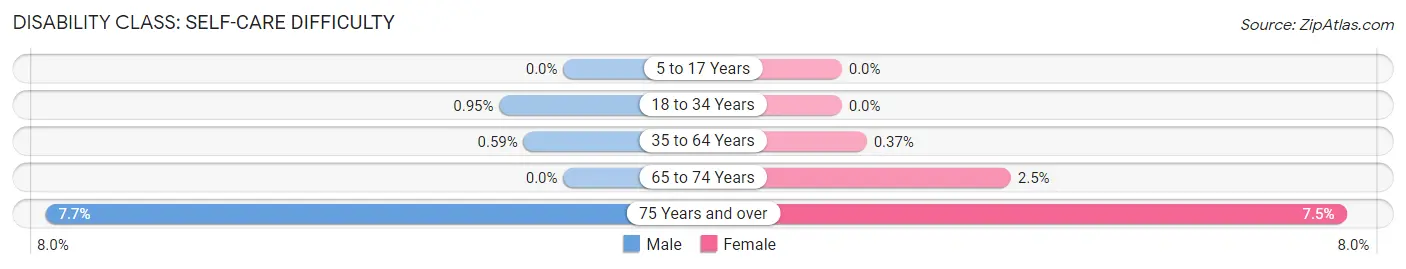
| Age Bracket | Male | Female |
| 5 to 17 Years | 0 (0.0%) | 0 (0.0%) |
| 18 to 34 Years | 9 (0.9%) | 0 (0.0%) |
| 35 to 64 Years | 14 (0.6%) | 8 (0.4%) |
| 65 to 74 Years | 0 (0.0%) | 13 (2.5%) |
| 75 Years and over | 21 (7.7%) | 23 (7.5%) |
Technology Access in San Diego Country Estates
Computing Device Access in San Diego Country Estates
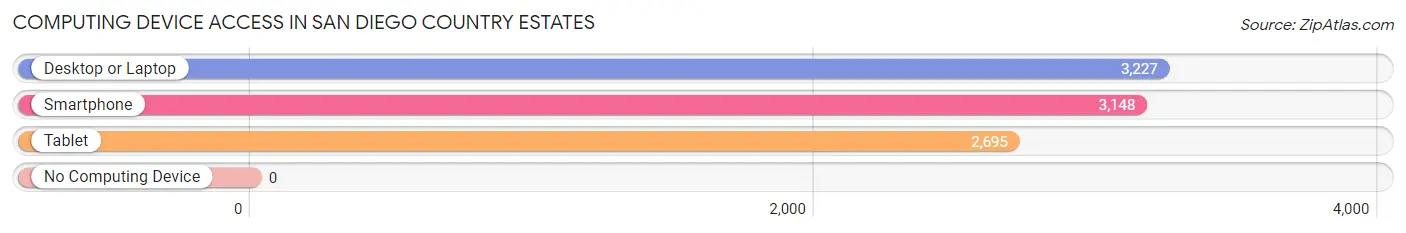
| Device Type | # Households | % Households |
| Desktop or Laptop | 3,227 | 95.4% |
| Smartphone | 3,148 | 93.1% |
| Tablet | 2,695 | 79.7% |
| No Computing Device | 0 | 0.0% |
| Total | 3,382 | 100.0% |
Internet Access in San Diego Country Estates
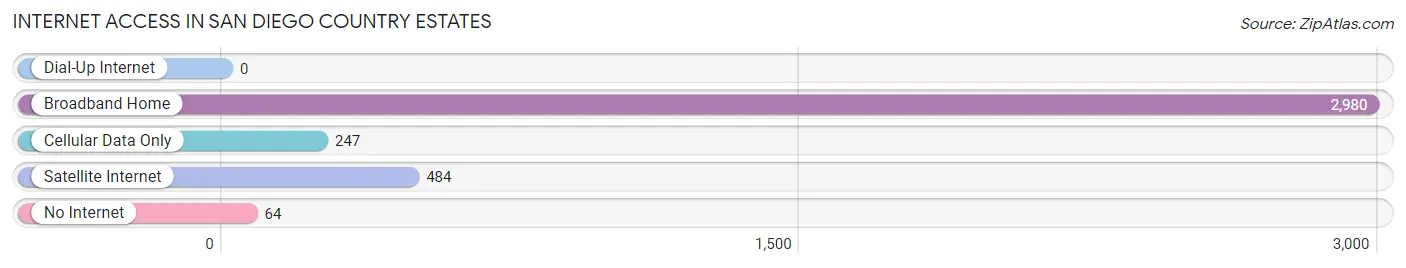
| Internet Type | # Households | % Households |
| Dial-Up Internet | 0 | 0.0% |
| Broadband Home | 2,980 | 88.1% |
| Cellular Data Only | 247 | 7.3% |
| Satellite Internet | 484 | 14.3% |
| No Internet | 64 | 1.9% |
| Total | 3,382 | 100.0% |
San Diego Country Estates Summary
San Diego Country Estates is a census-designated place located in San Diego County, California. It is located in the foothills of the Cuyamaca Mountains, approximately 25 miles east of downtown San Diego. The area is known for its rural atmosphere and is home to a variety of recreational activities, including golf, tennis, swimming, and horseback riding.
History
San Diego Country Estates was established in the late 1960s as a planned community. The area was originally part of the Rancho Cuyamaca, a Mexican land grant given to Juan Bautista Alvarado in 1845. The land was later purchased by the San Diego Country Estates Development Company, which began developing the area in 1967. The development company was owned by the San Diego-based real estate firm, Coldwell Banker.
The first homes in the area were built in 1968 and the community was officially incorporated in 1970. The community was designed to be a self-contained, master-planned community with a variety of amenities, including a golf course, tennis courts, swimming pools, and horseback riding trails.
Geography
San Diego Country Estates is located in the foothills of the Cuyamaca Mountains, approximately 25 miles east of downtown San Diego. The area is characterized by rolling hills and valleys, with elevations ranging from 1,000 to 3,000 feet. The area is home to a variety of wildlife, including deer, coyotes, bobcats, and mountain lions.
The climate in San Diego Country Estates is mild and temperate, with temperatures ranging from the mid-50s to the mid-80s. The area receives an average of 10 inches of rain per year.
Economy
San Diego Country Estates is primarily a residential community, with most of the population employed in the service sector. The area is home to a variety of businesses, including restaurants, retail stores, and professional services. The area is also home to a number of golf courses, tennis courts, and other recreational facilities.
Demographics
As of the 2010 census, the population of San Diego Country Estates was 8,845. The population is primarily white (83.3%), with smaller percentages of Hispanic (7.3%), Asian (3.7%), and African American (2.2%) residents. The median household income in the area is $90,845, and the median home value is $541,000.
Conclusion
San Diego Country Estates is a census-designated place located in San Diego County, California. It is located in the foothills of the Cuyamaca Mountains, approximately 25 miles east of downtown San Diego. The area is known for its rural atmosphere and is home to a variety of recreational activities, including golf, tennis, swimming, and horseback riding. The area is primarily residential, with most of the population employed in the service sector. The population is primarily white, with smaller percentages of Hispanic, Asian, and African American residents. The median household income in the area is $90,845, and the median home value is $541,000.
Common Questions
What is Per Capita Income in San Diego Country Estates?
Per Capita income in San Diego Country Estates is $52,900.
What is the Median Family Income in San Diego Country Estates?
Median Family Income in San Diego Country Estates is $137,656.
What is the Median Household income in San Diego Country Estates?
Median Household Income in San Diego Country Estates is $135,785.
What is Income or Wage Gap in San Diego Country Estates?
Income or Wage Gap in San Diego Country Estates is 18.6%.
Women in San Diego Country Estates earn 81.4 cents for every dollar earned by a man.
What is Inequality or Gini Index in San Diego Country Estates?
Inequality or Gini Index in San Diego Country Estates is 0.28.
What is the Total Population of San Diego Country Estates?
Total Population of San Diego Country Estates is 10,241.
What is the Total Male Population of San Diego Country Estates?
Total Male Population of San Diego Country Estates is 5,463.
What is the Total Female Population of San Diego Country Estates?
Total Female Population of San Diego Country Estates is 4,778.
What is the Ratio of Males per 100 Females in San Diego Country Estates?
There are 114.34 Males per 100 Females in San Diego Country Estates.
What is the Ratio of Females per 100 Males in San Diego Country Estates?
There are 87.46 Females per 100 Males in San Diego Country Estates.
What is the Median Population Age in San Diego Country Estates?
Median Population Age in San Diego Country Estates is 44.1 Years.
What is the Average Family Size in San Diego Country Estates
Average Family Size in San Diego Country Estates is 3.2 People.
What is the Average Household Size in San Diego Country Estates
Average Household Size in San Diego Country Estates is 3.0 People.
How Large is the Labor Force in San Diego Country Estates?
There are 5,414 People in the Labor Forcein in San Diego Country Estates.
What is the Percentage of People in the Labor Force in San Diego Country Estates?
66.1% of People are in the Labor Force in San Diego Country Estates.
What is the Unemployment Rate in San Diego Country Estates?
Unemployment Rate in San Diego Country Estates is 3.1%.