Hidden Valley Lake, CA Map & Demographics
Hidden Valley Lake Map
Hidden Valley Lake Overview
$37,483
PER CAPITA INCOME
$102,222
AVG FAMILY INCOME
$82,673
AVG HOUSEHOLD INCOME
28.9%
WAGE / INCOME GAP [ % ]
71.1¢/ $1
WAGE / INCOME GAP [ $ ]
0.43
INEQUALITY / GINI INDEX
5,852
TOTAL POPULATION
2,997
MALE POPULATION
2,855
FEMALE POPULATION
104.97
MALES / 100 FEMALES
95.26
FEMALES / 100 MALES
44.4
MEDIAN AGE
3.1
AVG FAMILY SIZE
2.6
AVG HOUSEHOLD SIZE
2,334
LABOR FORCE [ PEOPLE ]
51.5%
PERCENT IN LABOR FORCE
11.3%
UNEMPLOYMENT RATE
Hidden Valley Lake Zip Codes
Hidden Valley Lake Area Codes
Income in Hidden Valley Lake
Income Overview in Hidden Valley Lake
Per Capita Income in Hidden Valley Lake is $37,483, while median incomes of families and households are $102,222 and $82,673 respectively.
| Characteristic | Number | Measure |
| Per Capita Income | 5,852 | $37,483 |
| Median Family Income | 1,542 | $102,222 |
| Mean Family Income | 1,542 | $119,631 |
| Median Household Income | 2,209 | $82,673 |
| Mean Household Income | 2,209 | $99,094 |
| Income Deficit | 1,542 | $0 |
| Wage / Income Gap (%) | 5,852 | 28.90% |
| Wage / Income Gap ($) | 5,852 | 71.10¢ per $1 |
| Gini / Inequality Index | 5,852 | 0.43 |
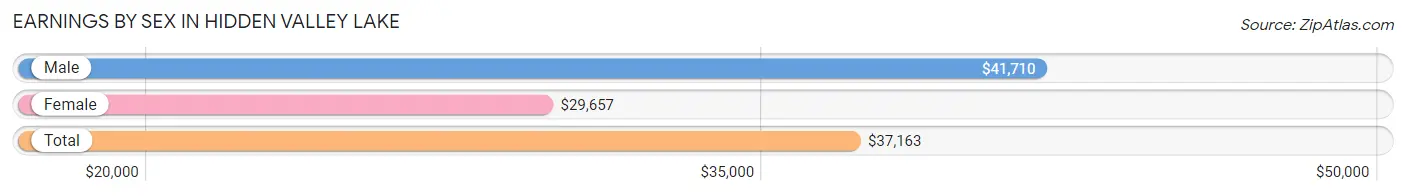
Earnings by Sex in Hidden Valley Lake
Average Earnings in Hidden Valley Lake are $37,163, $41,710 for men and $29,657 for women, a difference of 28.9%.
| Sex | Number | Average Earnings |
| Male | 1,339 (53.4%) | $41,710 |
| Female | 1,169 (46.6%) | $29,657 |
| Total | 2,508 (100.0%) | $37,163 |
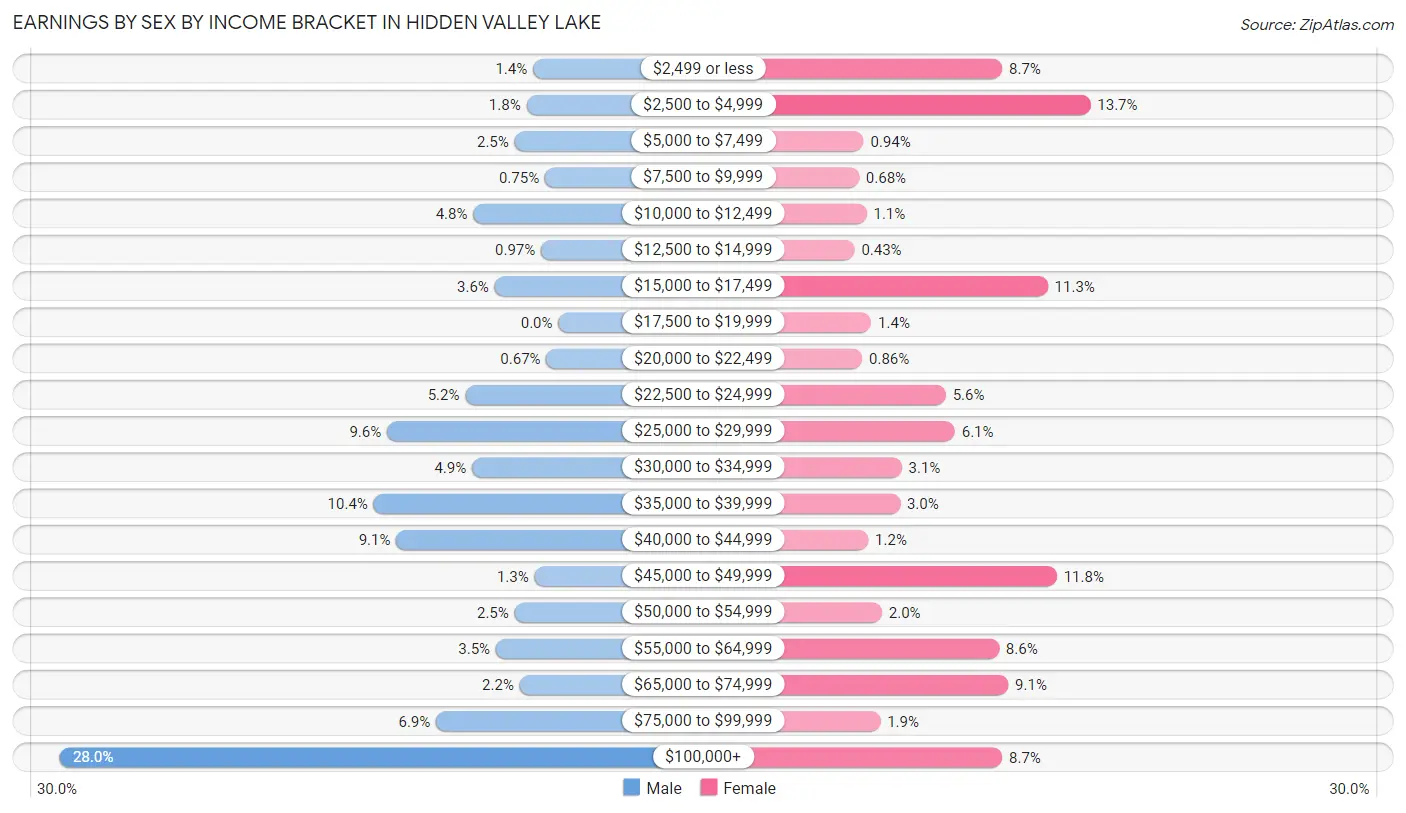
Earnings by Sex by Income Bracket in Hidden Valley Lake
The most common earnings brackets in Hidden Valley Lake are $100,000+ for men (375 | 28.0%) and $2,500 to $4,999 for women (160 | 13.7%).
| Income | Male | Female |
| $2,499 or less | 19 (1.4%) | 102 (8.7%) |
| $2,500 to $4,999 | 24 (1.8%) | 160 (13.7%) |
| $5,000 to $7,499 | 33 (2.5%) | 11 (0.9%) |
| $7,500 to $9,999 | 10 (0.7%) | 8 (0.7%) |
| $10,000 to $12,499 | 64 (4.8%) | 13 (1.1%) |
| $12,500 to $14,999 | 13 (1.0%) | 5 (0.4%) |
| $15,000 to $17,499 | 48 (3.6%) | 132 (11.3%) |
| $17,500 to $19,999 | 0 (0.0%) | 16 (1.4%) |
| $20,000 to $22,499 | 9 (0.7%) | 10 (0.9%) |
| $22,500 to $24,999 | 70 (5.2%) | 65 (5.6%) |
| $25,000 to $29,999 | 129 (9.6%) | 71 (6.1%) |
| $30,000 to $34,999 | 65 (4.9%) | 36 (3.1%) |
| $35,000 to $39,999 | 139 (10.4%) | 35 (3.0%) |
| $40,000 to $44,999 | 122 (9.1%) | 14 (1.2%) |
| $45,000 to $49,999 | 18 (1.3%) | 138 (11.8%) |
| $50,000 to $54,999 | 33 (2.5%) | 23 (2.0%) |
| $55,000 to $64,999 | 47 (3.5%) | 100 (8.6%) |
| $65,000 to $74,999 | 29 (2.2%) | 106 (9.1%) |
| $75,000 to $99,999 | 92 (6.9%) | 22 (1.9%) |
| $100,000+ | 375 (28.0%) | 102 (8.7%) |
| Total | 1,339 (100.0%) | 1,169 (100.0%) |
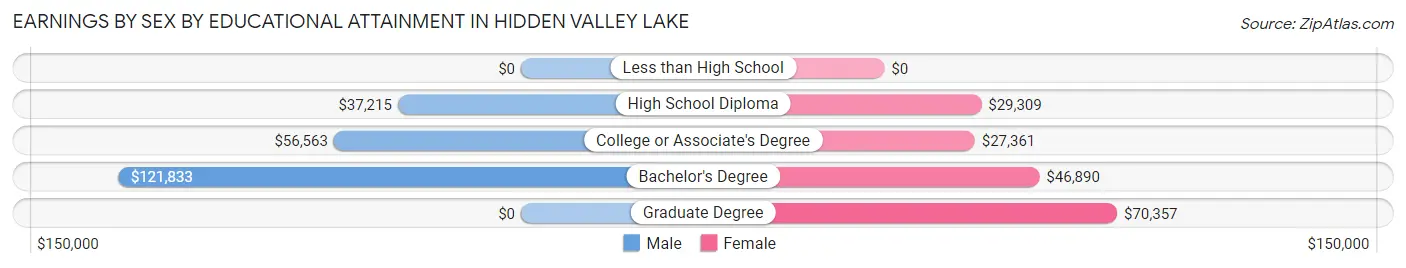
Earnings by Sex by Educational Attainment in Hidden Valley Lake
Average earnings in Hidden Valley Lake are $55,156 for men and $37,098 for women, a difference of 32.7%. Men with an educational attainment of bachelor's degree enjoy the highest average annual earnings of $121,833, while those with high school diploma education earn the least with $37,215. Women with an educational attainment of graduate degree earn the most with the average annual earnings of $70,357, while those with college or associate's degree education have the smallest earnings of $27,361.
| Educational Attainment | Male Income | Female Income |
| Less than High School | - | - |
| High School Diploma | $37,215 | $29,309 |
| College or Associate's Degree | $56,563 | $27,361 |
| Bachelor's Degree | $121,833 | $46,890 |
| Graduate Degree | - | - |
| Total | $55,156 | $37,098 |
Family Income in Hidden Valley Lake
Family Income Brackets in Hidden Valley Lake
According to the Hidden Valley Lake family income data, there are 409 families falling into the $100,000 to $149,999 income range, which is the most common income bracket and makes up 26.5% of all families.
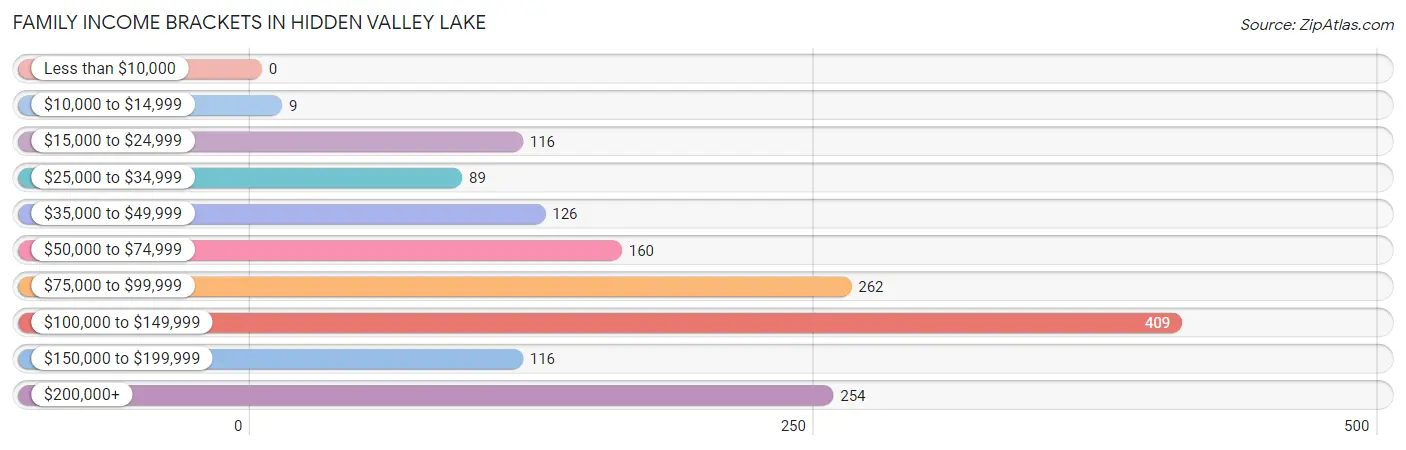
| Income Bracket | # Families | % Families |
| Less than $10,000 | 0 | 0.0% |
| $10,000 to $14,999 | 9 | 0.6% |
| $15,000 to $24,999 | 116 | 7.5% |
| $25,000 to $34,999 | 89 | 5.8% |
| $35,000 to $49,999 | 126 | 8.2% |
| $50,000 to $74,999 | 160 | 10.4% |
| $75,000 to $99,999 | 262 | 17.0% |
| $100,000 to $149,999 | 409 | 26.5% |
| $150,000 to $199,999 | 116 | 7.5% |
| $200,000+ | 254 | 16.5% |
Family Income by Famaliy Size in Hidden Valley Lake
5-person families (117 | 7.6%) account for the highest median family income in Hidden Valley Lake with $211,008 per family, while 2-person families (767 | 49.7%) have the highest median income of $42,463 per family member.
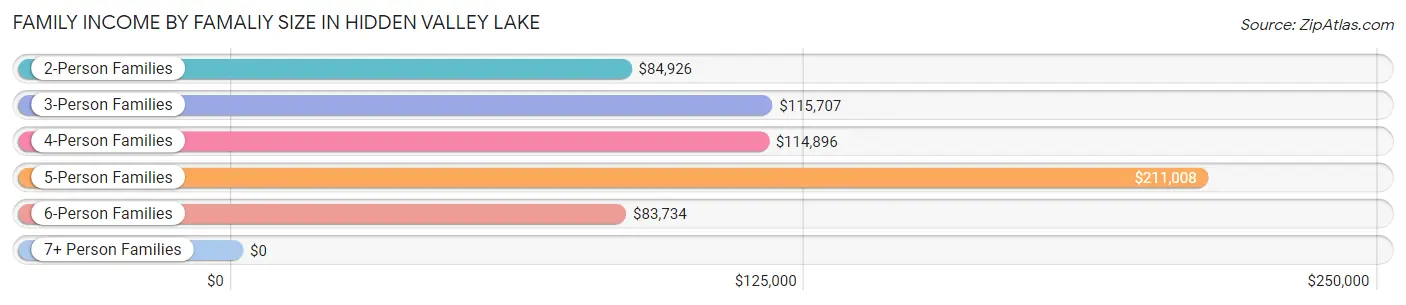
| Income Bracket | # Families | Median Income |
| 2-Person Families | 767 (49.7%) | $84,926 |
| 3-Person Families | 319 (20.7%) | $115,707 |
| 4-Person Families | 214 (13.9%) | $114,896 |
| 5-Person Families | 117 (7.6%) | $211,008 |
| 6-Person Families | 116 (7.5%) | $83,734 |
| 7+ Person Families | 9 (0.6%) | $0 |
| Total | 1,542 (100.0%) | $102,222 |
Family Income by Number of Earners in Hidden Valley Lake
The median family income in Hidden Valley Lake is $102,222, with families comprising 3+ earners (164) having the highest median family income of $171,364, while families with no earners (494) have the lowest median family income of $68,318, accounting for 10.6% and 32.0% of families, respectively.
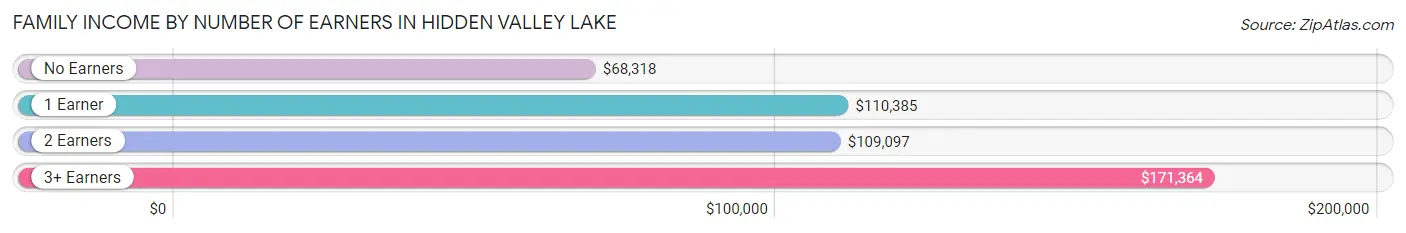
| Number of Earners | # Families | Median Income |
| No Earners | 494 (32.0%) | $68,318 |
| 1 Earner | 440 (28.5%) | $110,385 |
| 2 Earners | 444 (28.8%) | $109,097 |
| 3+ Earners | 164 (10.6%) | $171,364 |
| Total | 1,542 (100.0%) | $102,222 |
Household Income in Hidden Valley Lake
Household Income Brackets in Hidden Valley Lake
With 479 households falling in the category, the $100,000 to $149,999 income range is the most frequent in Hidden Valley Lake, accounting for 21.7% of all households. In contrast, only 46 households (2.1%) fall into the less than $10,000 income bracket, making it the least populous group.
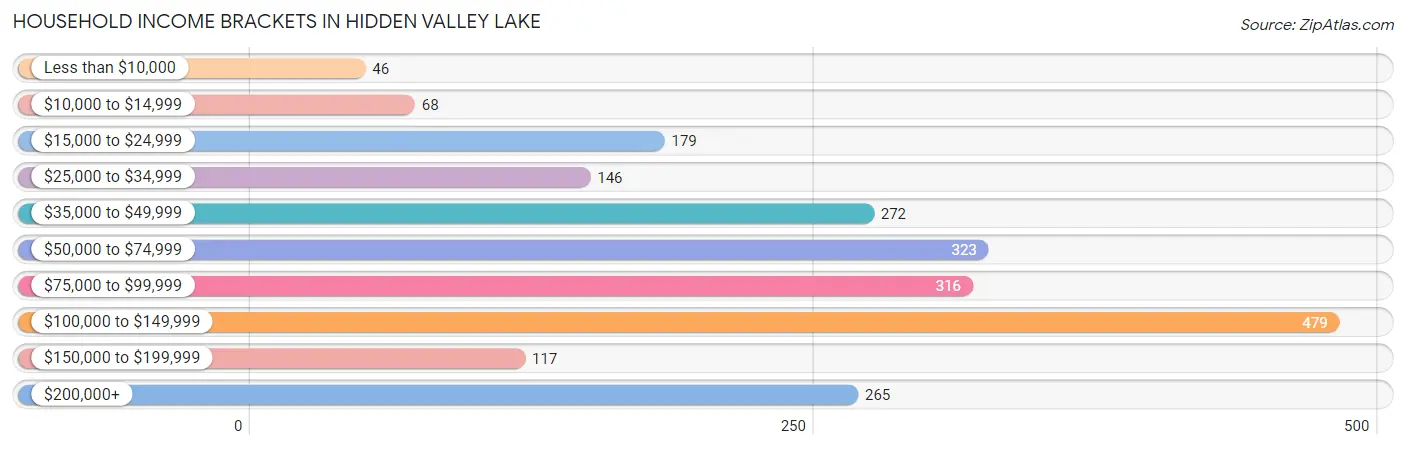
| Income Bracket | # Households | % Households |
| Less than $10,000 | 46 | 2.1% |
| $10,000 to $14,999 | 68 | 3.1% |
| $15,000 to $24,999 | 179 | 8.1% |
| $25,000 to $34,999 | 146 | 6.6% |
| $35,000 to $49,999 | 272 | 12.3% |
| $50,000 to $74,999 | 323 | 14.6% |
| $75,000 to $99,999 | 316 | 14.3% |
| $100,000 to $149,999 | 479 | 21.7% |
| $150,000 to $199,999 | 117 | 5.3% |
| $200,000+ | 265 | 12.0% |
Household Income by Householder Age in Hidden Valley Lake
The median household income in Hidden Valley Lake is $82,673, with the highest median household income of $97,370 found in the 45 to 64 years age bracket for the primary householder. A total of 671 households (30.4%) fall into this category. Meanwhile, the 15 to 24 years age bracket for the primary householder has the lowest median household income of $44,504, with 101 households (4.6%) in this group.
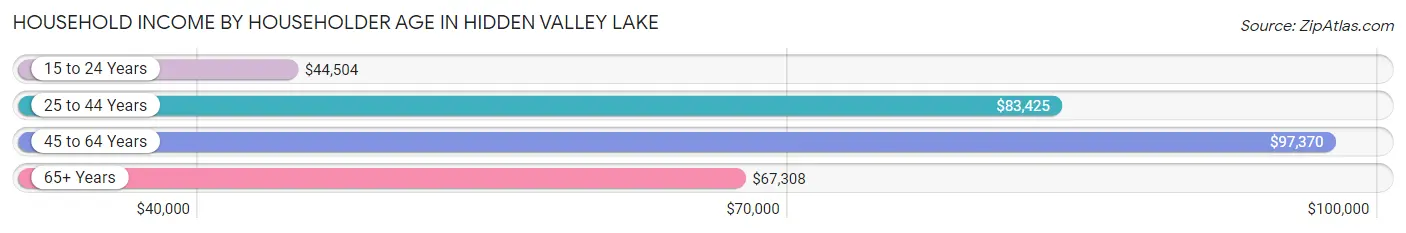
| Income Bracket | # Households | Median Income |
| 15 to 24 Years | 101 (4.6%) | $44,504 |
| 25 to 44 Years | 533 (24.1%) | $83,425 |
| 45 to 64 Years | 671 (30.4%) | $97,370 |
| 65+ Years | 904 (40.9%) | $67,308 |
| Total | 2,209 (100.0%) | $82,673 |
Poverty in Hidden Valley Lake
Income Below Poverty by Sex and Age in Hidden Valley Lake
With 6.7% poverty level for males and 7.1% for females among the residents of Hidden Valley Lake, 65 to 74 year old males and 35 to 44 year old females are the most vulnerable to poverty, with 96 males (23.6%) and 95 females (22.9%) in their respective age groups living below the poverty level.
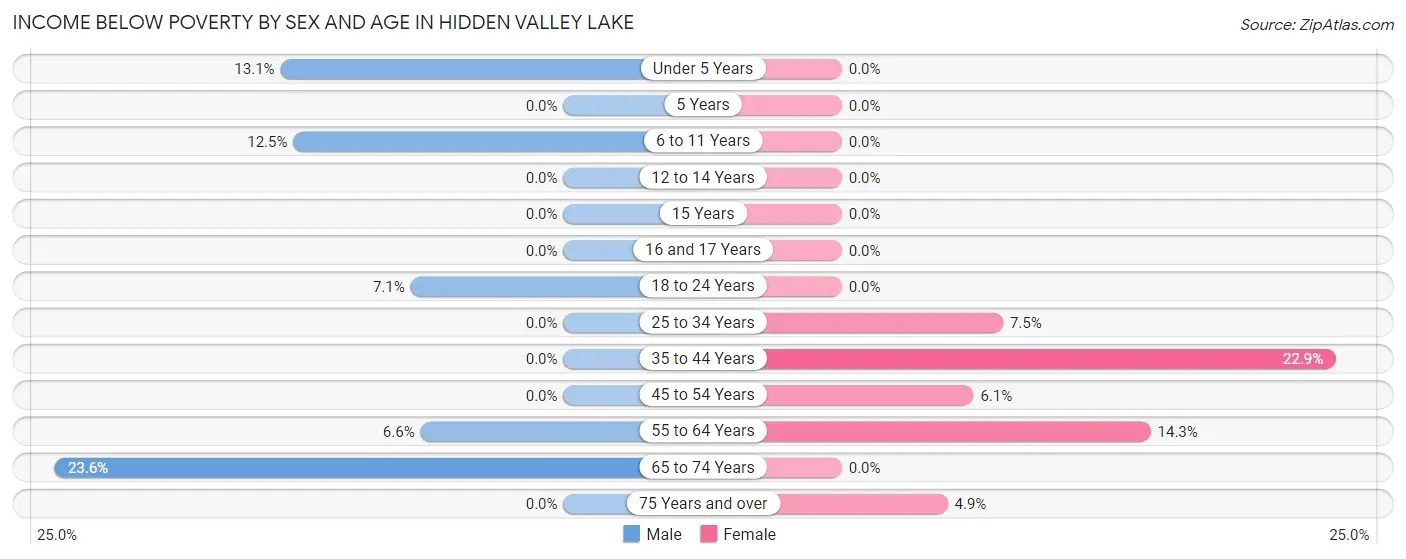
| Age Bracket | Male | Female |
| Under 5 Years | 13 (13.1%) | 0 (0.0%) |
| 5 Years | 0 (0.0%) | 0 (0.0%) |
| 6 to 11 Years | 47 (12.5%) | 0 (0.0%) |
| 12 to 14 Years | 0 (0.0%) | 0 (0.0%) |
| 15 Years | 0 (0.0%) | 0 (0.0%) |
| 16 and 17 Years | 0 (0.0%) | 0 (0.0%) |
| 18 to 24 Years | 18 (7.1%) | 0 (0.0%) |
| 25 to 34 Years | 0 (0.0%) | 16 (7.5%) |
| 35 to 44 Years | 0 (0.0%) | 95 (22.9%) |
| 45 to 54 Years | 0 (0.0%) | 19 (6.1%) |
| 55 to 64 Years | 23 (6.6%) | 52 (14.3%) |
| 65 to 74 Years | 96 (23.6%) | 0 (0.0%) |
| 75 Years and over | 0 (0.0%) | 17 (4.9%) |
| Total | 197 (6.7%) | 199 (7.1%) |
Income Above Poverty by Sex and Age in Hidden Valley Lake
According to the poverty statistics in Hidden Valley Lake, males aged 5 years and females aged under 5 years are the age groups that are most secure financially, with 100.0% of males and 100.0% of females in these age groups living above the poverty line.
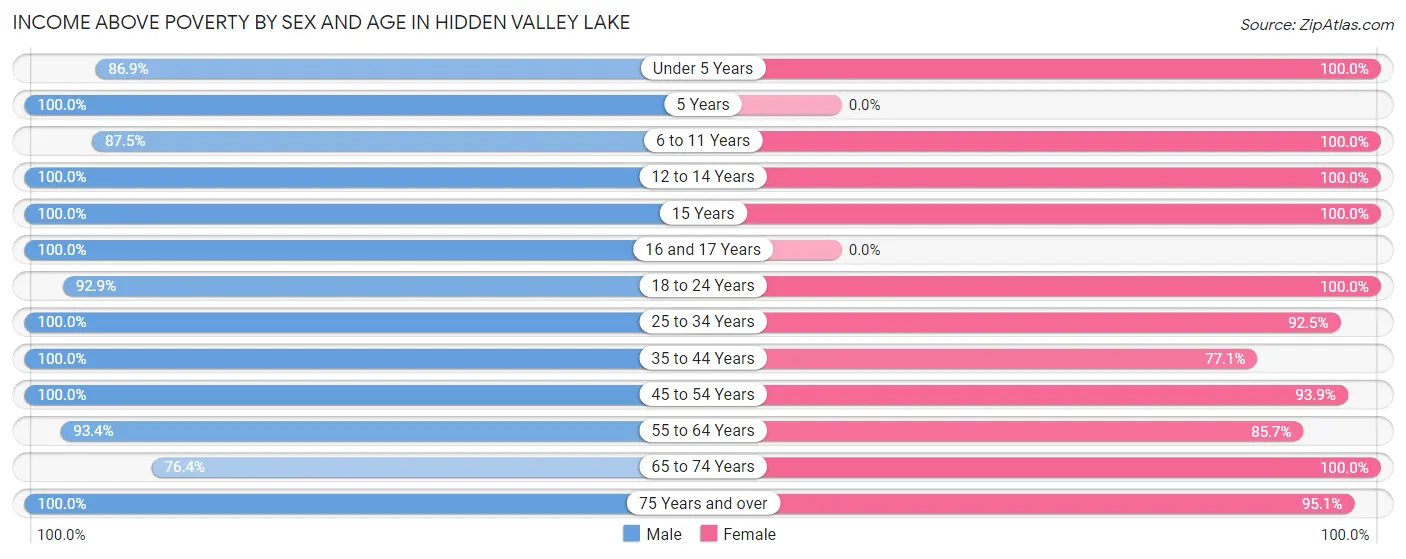
| Age Bracket | Male | Female |
| Under 5 Years | 86 (86.9%) | 96 (100.0%) |
| 5 Years | 21 (100.0%) | 0 (0.0%) |
| 6 to 11 Years | 328 (87.5%) | 252 (100.0%) |
| 12 to 14 Years | 199 (100.0%) | 88 (100.0%) |
| 15 Years | 93 (100.0%) | 16 (100.0%) |
| 16 and 17 Years | 38 (100.0%) | 0 (0.0%) |
| 18 to 24 Years | 236 (92.9%) | 170 (100.0%) |
| 25 to 34 Years | 270 (100.0%) | 198 (92.5%) |
| 35 to 44 Years | 275 (100.0%) | 320 (77.1%) |
| 45 to 54 Years | 219 (100.0%) | 292 (93.9%) |
| 55 to 64 Years | 324 (93.4%) | 311 (85.7%) |
| 65 to 74 Years | 311 (76.4%) | 548 (100.0%) |
| 75 Years and over | 356 (100.0%) | 329 (95.1%) |
| Total | 2,756 (93.3%) | 2,620 (92.9%) |
Income Below Poverty Among Married-Couple Families in Hidden Valley Lake
The poverty statistics for married-couple families in Hidden Valley Lake show that 1.8% or 25 of the total 1,387 families live below the poverty line. Families with 1 or 2 children have the highest poverty rate of 2.6%, comprising of 9 families. On the other hand, families with 3 or 4 children have the lowest poverty rate of 0.0%, which includes 0 families.
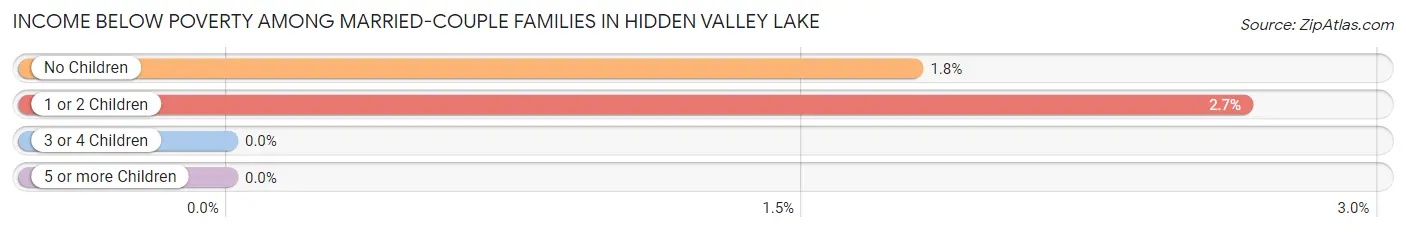
| Children | Above Poverty | Below Poverty |
| No Children | 879 (98.2%) | 16 (1.8%) |
| 1 or 2 Children | 330 (97.4%) | 9 (2.6%) |
| 3 or 4 Children | 153 (100.0%) | 0 (0.0%) |
| 5 or more Children | 0 (0.0%) | 0 (0.0%) |
| Total | 1,362 (98.2%) | 25 (1.8%) |
Income Below Poverty Among Single-Parent Households in Hidden Valley Lake
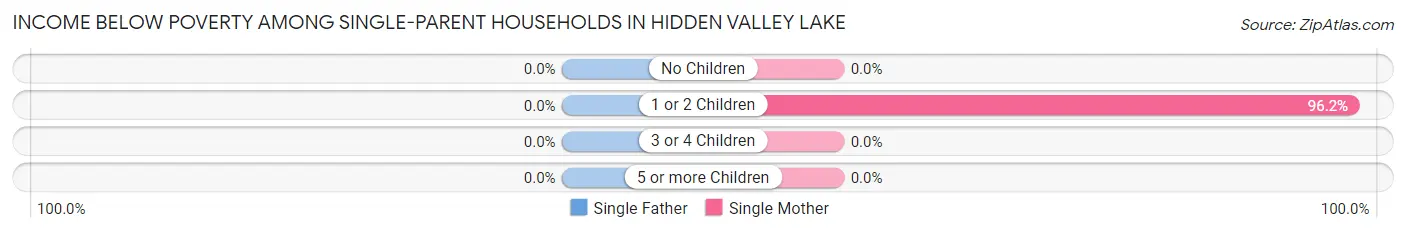
| Children | Single Father | Single Mother |
| No Children | 0 (0.0%) | 0 (0.0%) |
| 1 or 2 Children | 0 (0.0%) | 100 (96.2%) |
| 3 or 4 Children | 0 (0.0%) | 0 (0.0%) |
| 5 or more Children | 0 (0.0%) | 0 (0.0%) |
| Total | 0 (0.0%) | 100 (80.0%) |
Income Below Poverty Among Married-Couple vs Single-Parent Households in Hidden Valley Lake
The poverty data for Hidden Valley Lake shows that 25 of the married-couple family households (1.8%) and 100 of the single-parent households (64.5%) are living below the poverty level. Within the married-couple family households, those with 1 or 2 children have the highest poverty rate, with 9 households (2.6%) falling below the poverty line. Among the single-parent households, those with 1 or 2 children have the highest poverty rate, with 100 household (78.7%) living below poverty.
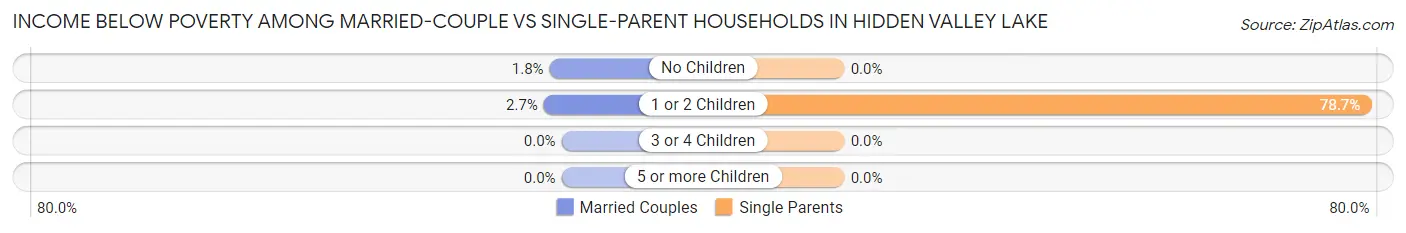
| Children | Married-Couple Families | Single-Parent Households |
| No Children | 16 (1.8%) | 0 (0.0%) |
| 1 or 2 Children | 9 (2.6%) | 100 (78.7%) |
| 3 or 4 Children | 0 (0.0%) | 0 (0.0%) |
| 5 or more Children | 0 (0.0%) | 0 (0.0%) |
| Total | 25 (1.8%) | 100 (64.5%) |
Race in Hidden Valley Lake
The most populous races in Hidden Valley Lake are White / Caucasian (5,001 | 85.5%), Hispanic or Latino (697 | 11.9%), and Two or more Races (435 | 7.4%).
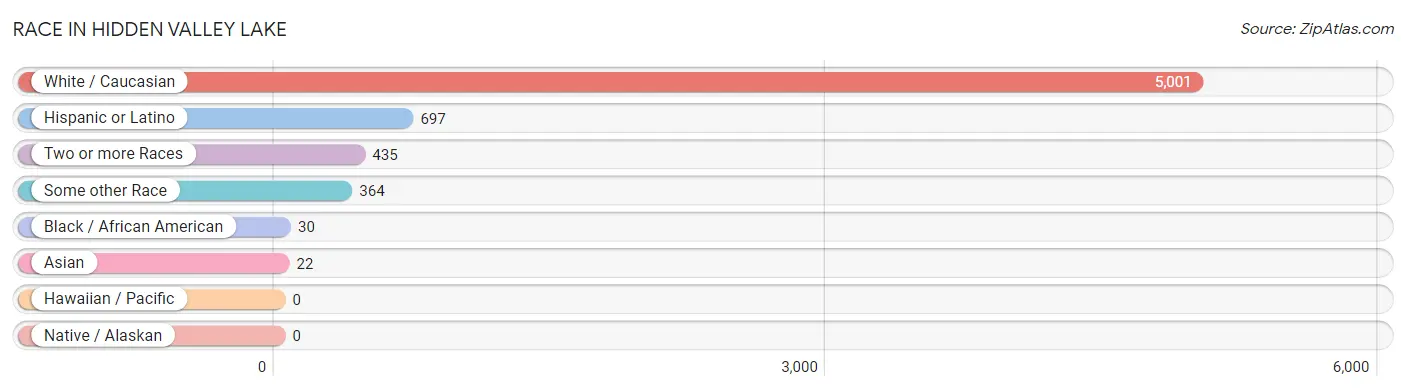
| Race | # Population | % Population |
| Asian | 22 | 0.4% |
| Black / African American | 30 | 0.5% |
| Hawaiian / Pacific | 0 | 0.0% |
| Hispanic or Latino | 697 | 11.9% |
| Native / Alaskan | 0 | 0.0% |
| White / Caucasian | 5,001 | 85.5% |
| Two or more Races | 435 | 7.4% |
| Some other Race | 364 | 6.2% |
| Total | 5,852 | 100.0% |
Ancestry in Hidden Valley Lake
The most populous ancestries reported in Hidden Valley Lake are English (1,086 | 18.6%), German (788 | 13.5%), Irish (625 | 10.7%), Mexican (449 | 7.7%), and Welsh (410 | 7.0%), together accounting for 57.4% of all Hidden Valley Lake residents.
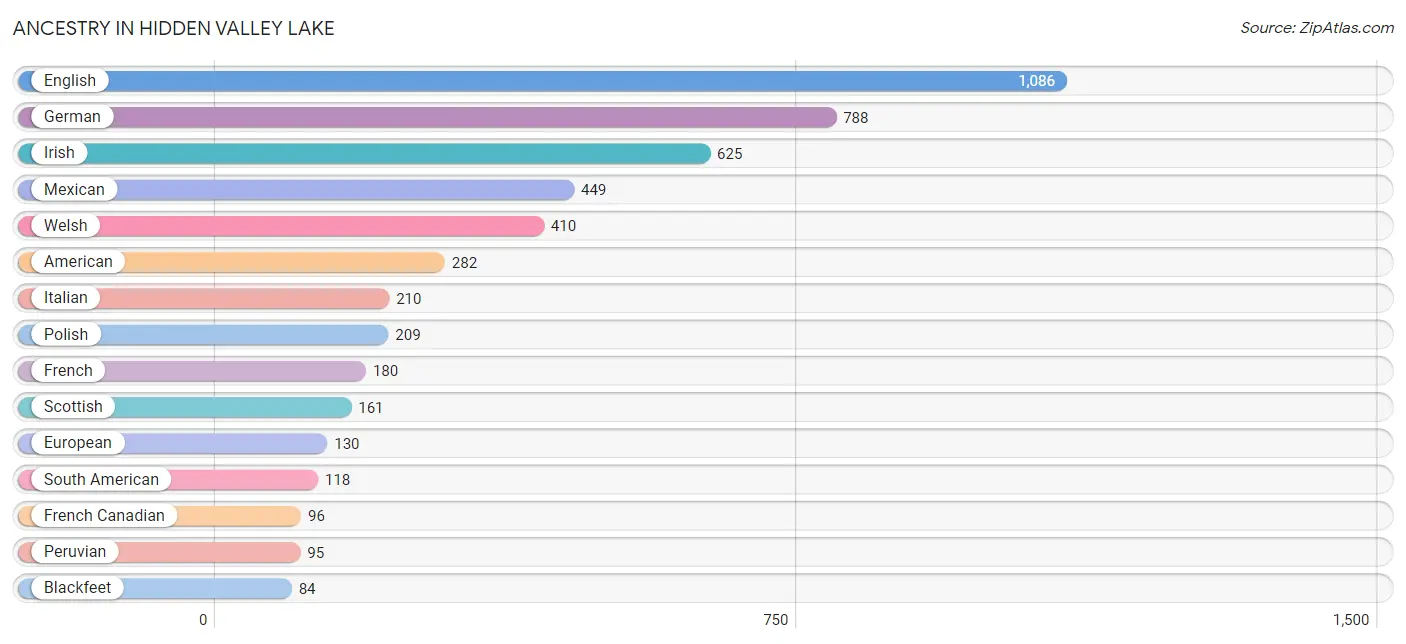
| Ancestry | # Population | % Population |
| American | 282 | 4.8% |
| Apache | 31 | 0.5% |
| Austrian | 35 | 0.6% |
| Blackfeet | 84 | 1.4% |
| British | 45 | 0.8% |
| Bulgarian | 35 | 0.6% |
| Canadian | 20 | 0.3% |
| Central American | 27 | 0.5% |
| Cherokee | 54 | 0.9% |
| Chilean | 23 | 0.4% |
| Choctaw | 46 | 0.8% |
| Cuban | 7 | 0.1% |
| Czech | 20 | 0.3% |
| Danish | 12 | 0.2% |
| Dutch | 36 | 0.6% |
| English | 1,086 | 18.6% |
| European | 130 | 2.2% |
| Finnish | 8 | 0.1% |
| French | 180 | 3.1% |
| French Canadian | 96 | 1.6% |
| German | 788 | 13.5% |
| Greek | 60 | 1.0% |
| Guamanian / Chamorro | 19 | 0.3% |
| Indian (Asian) | 9 | 0.2% |
| Irish | 625 | 10.7% |
| Italian | 210 | 3.6% |
| Korean | 26 | 0.4% |
| Latvian | 19 | 0.3% |
| Mexican | 449 | 7.7% |
| Mexican American Indian | 39 | 0.7% |
| Native Hawaiian | 8 | 0.1% |
| Norwegian | 60 | 1.0% |
| Peruvian | 95 | 1.6% |
| Polish | 209 | 3.6% |
| Portuguese | 44 | 0.7% |
| Puerto Rican | 12 | 0.2% |
| Romanian | 42 | 0.7% |
| Russian | 33 | 0.6% |
| Salvadoran | 27 | 0.5% |
| Samoan | 8 | 0.1% |
| Scotch-Irish | 79 | 1.3% |
| Scottish | 161 | 2.8% |
| South American | 118 | 2.0% |
| Spaniard | 37 | 0.6% |
| Spanish | 47 | 0.8% |
| Sri Lankan | 22 | 0.4% |
| Swedish | 66 | 1.1% |
| Swiss | 13 | 0.2% |
| Tongan | 8 | 0.1% |
| Welsh | 410 | 7.0% |
| Yugoslavian | 19 | 0.3% | View All 51 Rows |
Immigrants in Hidden Valley Lake
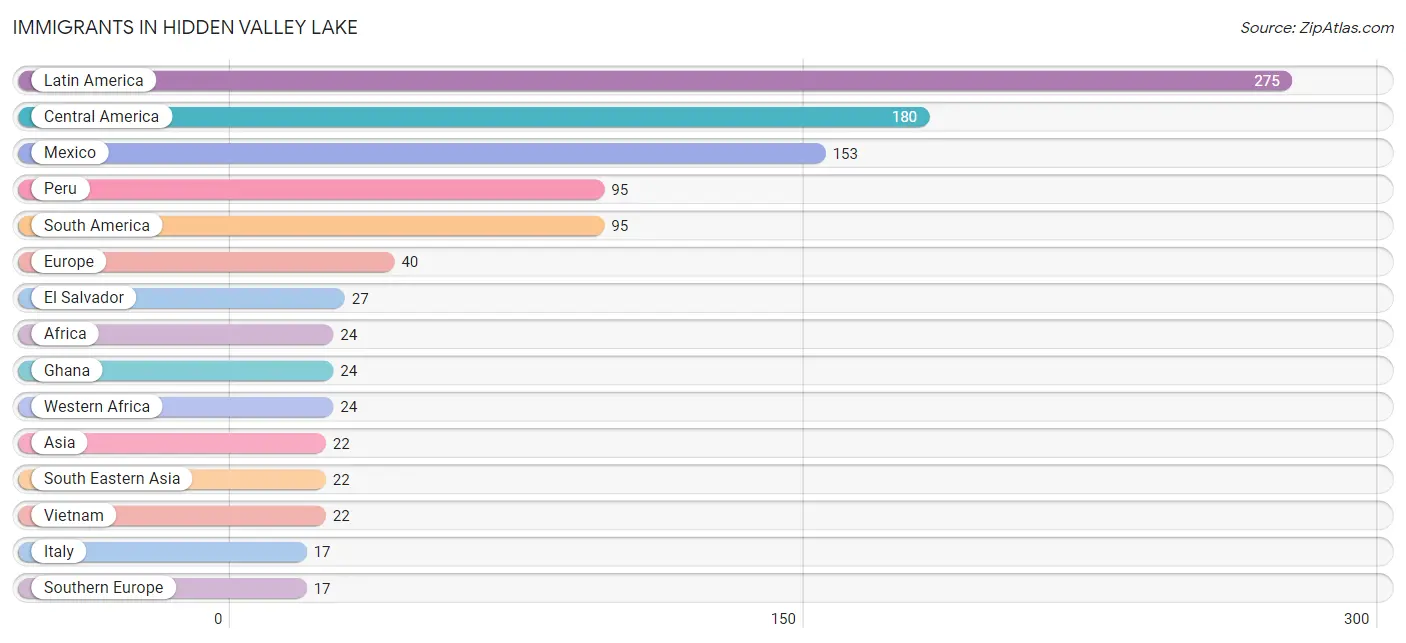
The most numerous immigrant groups reported in Hidden Valley Lake came from Latin America (275 | 4.7%), Central America (180 | 3.1%), Mexico (153 | 2.6%), Peru (95 | 1.6%), and South America (95 | 1.6%), together accounting for 13.6% of all Hidden Valley Lake residents.
| Immigration Origin | # Population | % Population |
| Africa | 24 | 0.4% |
| Asia | 22 | 0.4% |
| Bulgaria | 11 | 0.2% |
| Canada | 7 | 0.1% |
| Central America | 180 | 3.1% |
| Eastern Europe | 11 | 0.2% |
| El Salvador | 27 | 0.5% |
| Europe | 40 | 0.7% |
| Ghana | 24 | 0.4% |
| Italy | 17 | 0.3% |
| Latin America | 275 | 4.7% |
| Mexico | 153 | 2.6% |
| Netherlands | 12 | 0.2% |
| Peru | 95 | 1.6% |
| South America | 95 | 1.6% |
| South Eastern Asia | 22 | 0.4% |
| Southern Europe | 17 | 0.3% |
| Vietnam | 22 | 0.4% |
| Western Africa | 24 | 0.4% |
| Western Europe | 12 | 0.2% | View All 20 Rows |
Sex and Age in Hidden Valley Lake
Sex and Age in Hidden Valley Lake
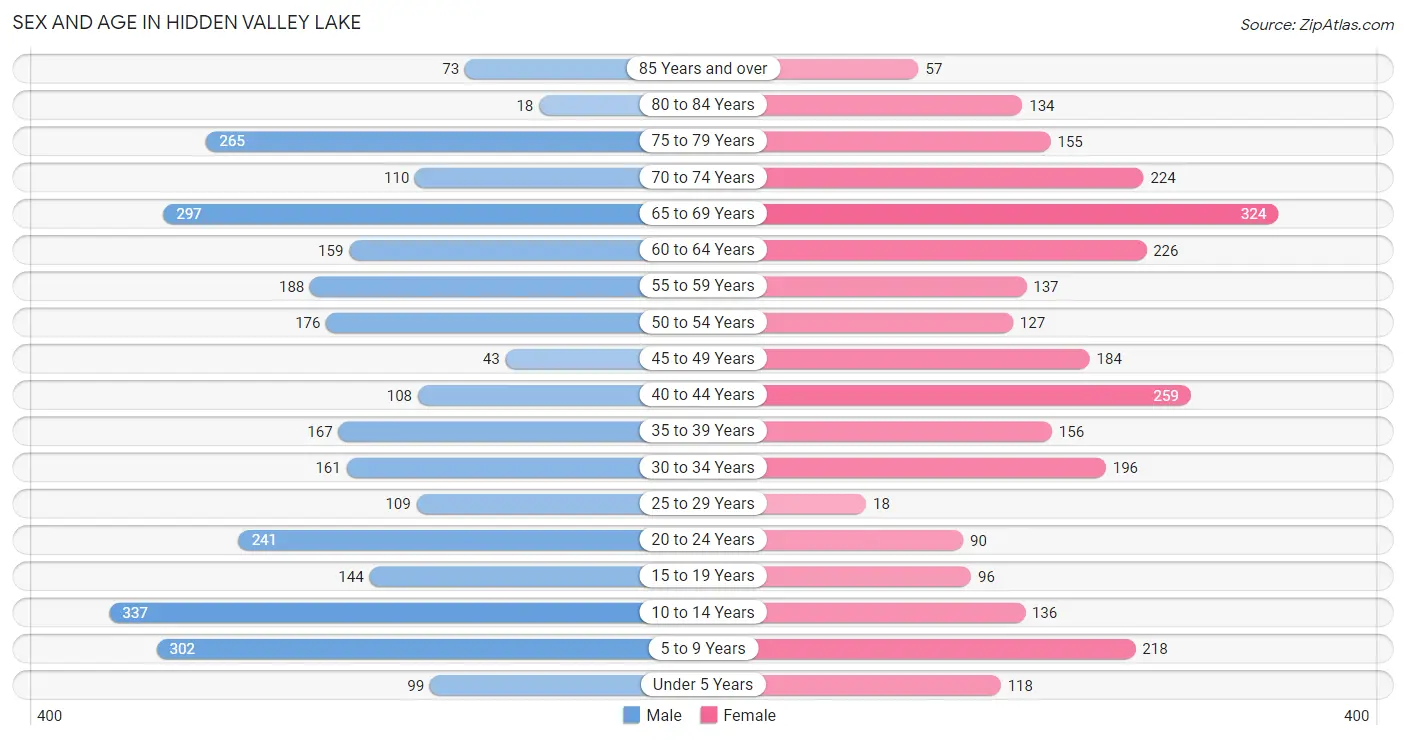
The most populous age groups in Hidden Valley Lake are 10 to 14 Years (337 | 11.2%) for men and 65 to 69 Years (324 | 11.4%) for women.
| Age Bracket | Male | Female |
| Under 5 Years | 99 (3.3%) | 118 (4.1%) |
| 5 to 9 Years | 302 (10.1%) | 218 (7.6%) |
| 10 to 14 Years | 337 (11.2%) | 136 (4.8%) |
| 15 to 19 Years | 144 (4.8%) | 96 (3.4%) |
| 20 to 24 Years | 241 (8.0%) | 90 (3.2%) |
| 25 to 29 Years | 109 (3.6%) | 18 (0.6%) |
| 30 to 34 Years | 161 (5.4%) | 196 (6.9%) |
| 35 to 39 Years | 167 (5.6%) | 156 (5.5%) |
| 40 to 44 Years | 108 (3.6%) | 259 (9.1%) |
| 45 to 49 Years | 43 (1.4%) | 184 (6.4%) |
| 50 to 54 Years | 176 (5.9%) | 127 (4.4%) |
| 55 to 59 Years | 188 (6.3%) | 137 (4.8%) |
| 60 to 64 Years | 159 (5.3%) | 226 (7.9%) |
| 65 to 69 Years | 297 (9.9%) | 324 (11.4%) |
| 70 to 74 Years | 110 (3.7%) | 224 (7.9%) |
| 75 to 79 Years | 265 (8.8%) | 155 (5.4%) |
| 80 to 84 Years | 18 (0.6%) | 134 (4.7%) |
| 85 Years and over | 73 (2.4%) | 57 (2.0%) |
| Total | 2,997 (100.0%) | 2,855 (100.0%) |
Families and Households in Hidden Valley Lake
Median Family Size in Hidden Valley Lake
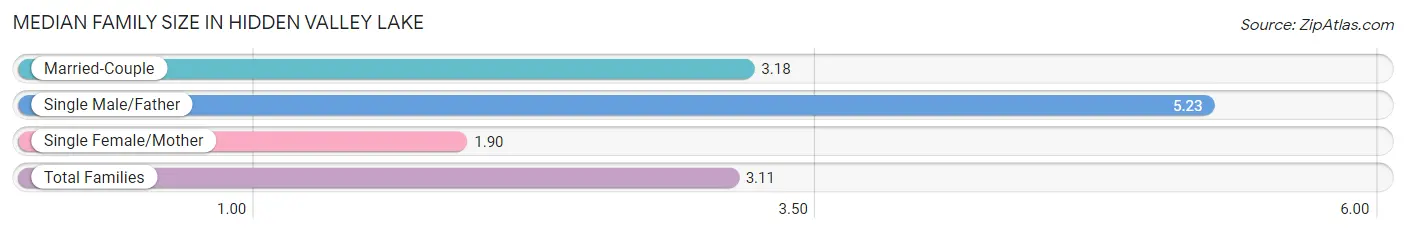
The median family size in Hidden Valley Lake is 3.11 persons per family, with single male/father families (30 | 1.9%) accounting for the largest median family size of 5.23 persons per family. On the other hand, single female/mother families (125 | 8.1%) represent the smallest median family size with 1.90 persons per family.
| Family Type | # Families | Family Size |
| Married-Couple | 1,387 (89.9%) | 3.18 |
| Single Male/Father | 30 (1.9%) | 5.23 |
| Single Female/Mother | 125 (8.1%) | 1.90 |
| Total Families | 1,542 (100.0%) | 3.11 |
Median Household Size in Hidden Valley Lake
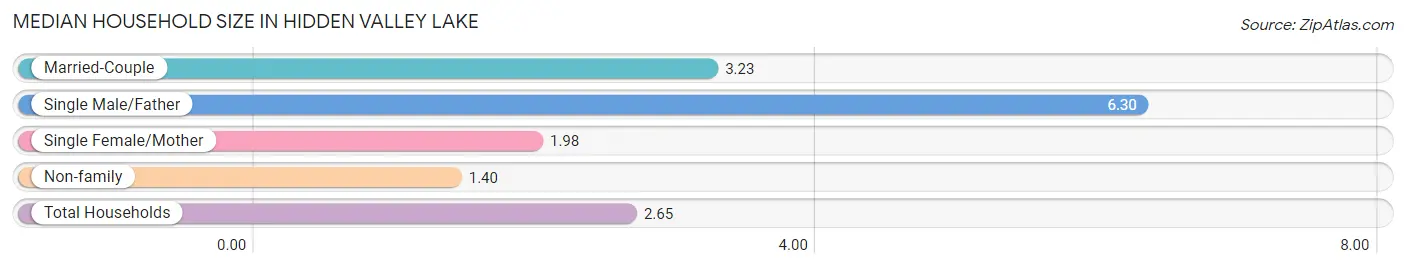
The median household size in Hidden Valley Lake is 2.65 persons per household, with single male/father households (30 | 1.4%) accounting for the largest median household size of 6.3 persons per household. non-family households (667 | 30.2%) represent the smallest median household size with 1.40 persons per household.
| Household Type | # Households | Household Size |
| Married-Couple | 1,387 (62.8%) | 3.23 |
| Single Male/Father | 30 (1.4%) | 6.30 |
| Single Female/Mother | 125 (5.7%) | 1.98 |
| Non-family | 667 (30.2%) | 1.40 |
| Total Households | 2,209 (100.0%) | 2.65 |
Household Size by Marriage Status in Hidden Valley Lake
Out of a total of 2,209 households in Hidden Valley Lake, 1,542 (69.8%) are family households, while 667 (30.2%) are nonfamily households. The most numerous type of family households are 2-person households, comprising 722, and the most common type of nonfamily households are 1-person households, comprising 488.
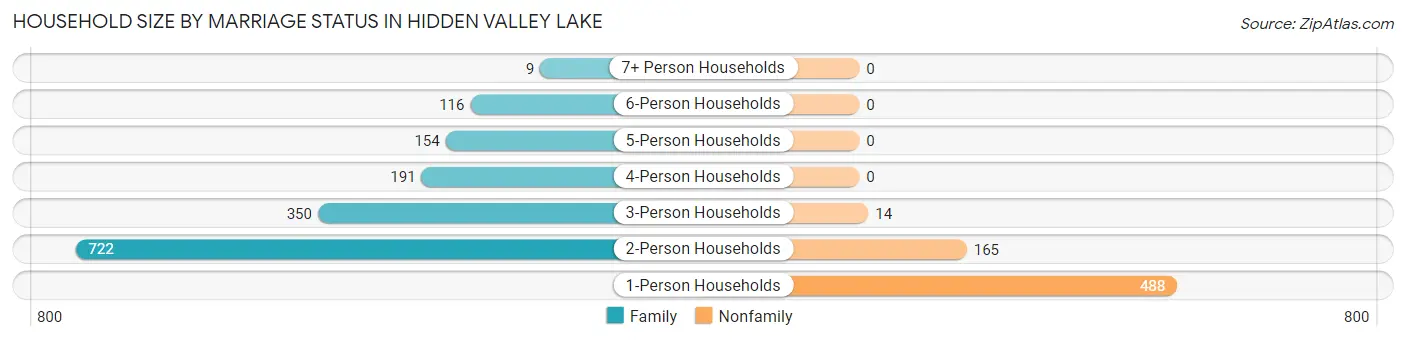
| Household Size | Family Households | Nonfamily Households |
| 1-Person Households | - | 488 (22.1%) |
| 2-Person Households | 722 (32.7%) | 165 (7.5%) |
| 3-Person Households | 350 (15.8%) | 14 (0.6%) |
| 4-Person Households | 191 (8.6%) | 0 (0.0%) |
| 5-Person Households | 154 (7.0%) | 0 (0.0%) |
| 6-Person Households | 116 (5.2%) | 0 (0.0%) |
| 7+ Person Households | 9 (0.4%) | 0 (0.0%) |
| Total | 1,542 (69.8%) | 667 (30.2%) |
Female Fertility in Hidden Valley Lake
Fertility by Age in Hidden Valley Lake
Average fertility rate in Hidden Valley Lake is 9.0 births per 1,000 women. Women in the age bracket of 20 to 34 years have the highest fertility rate with 30.0 births per 1,000 women. Women in the age bracket of 20 to 34 years acount for 100.0% of all women with births.
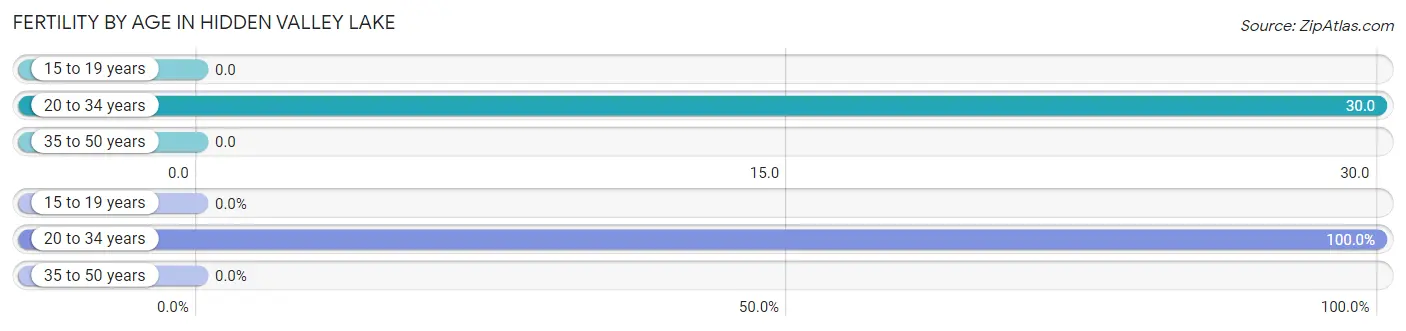
| Age Bracket | Women with Births | Births / 1,000 Women |
| 15 to 19 years | 0 (0.0%) | 0.0 |
| 20 to 34 years | 9 (100.0%) | 30.0 |
| 35 to 50 years | 0 (0.0%) | 0.0 |
| Total | 9 (100.0%) | 9.0 |
Fertility by Age by Marriage Status in Hidden Valley Lake
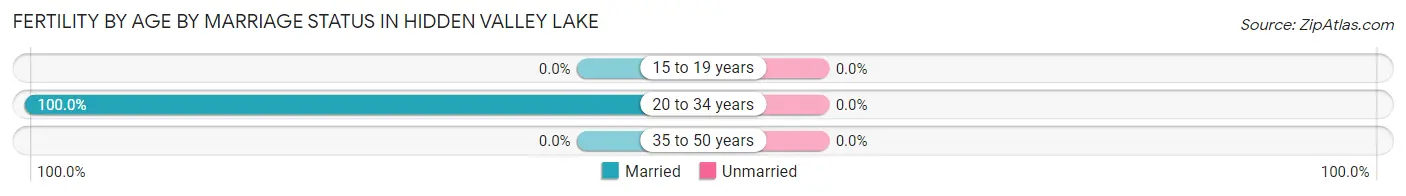
| Age Bracket | Married | Unmarried |
| 15 to 19 years | 0 (0.0%) | 0 (0.0%) |
| 20 to 34 years | 9 (100.0%) | 0 (0.0%) |
| 35 to 50 years | 0 (0.0%) | 0 (0.0%) |
| Total | 9 (100.0%) | 0 (0.0%) |
Fertility by Education in Hidden Valley Lake
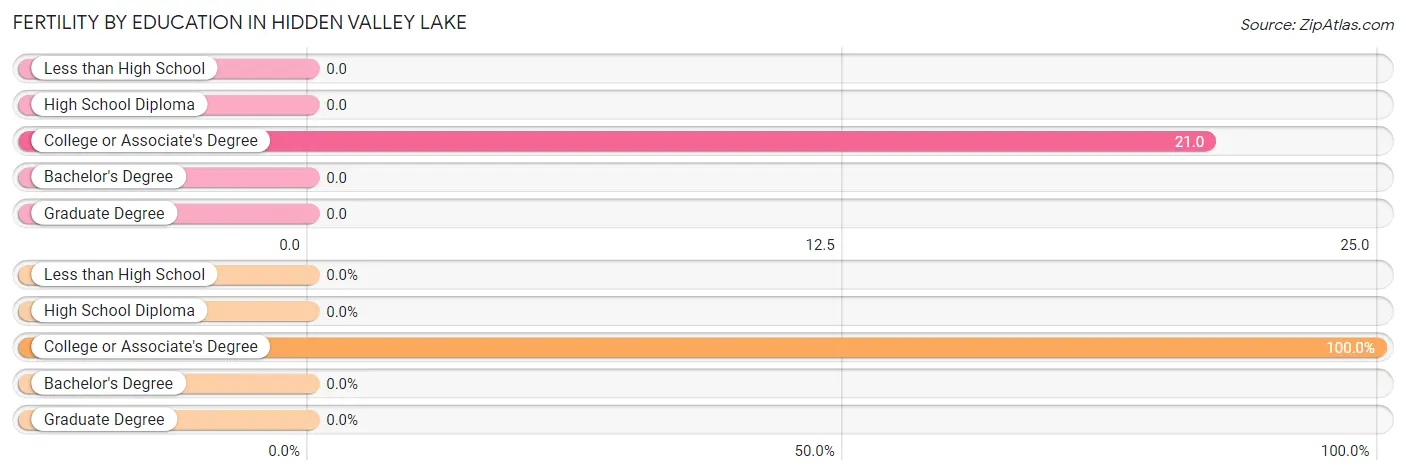
| Educational Attainment | Women with Births | Births / 1,000 Women |
| Less than High School | 0 (0.0%) | 0.0 |
| High School Diploma | 0 (0.0%) | 0.0 |
| College or Associate's Degree | 9 (100.0%) | 21.0 |
| Bachelor's Degree | 0 (0.0%) | 0.0 |
| Graduate Degree | 0 (0.0%) | 0.0 |
| Total | 9 (100.0%) | 9.0 |
Fertility by Education by Marriage Status in Hidden Valley Lake
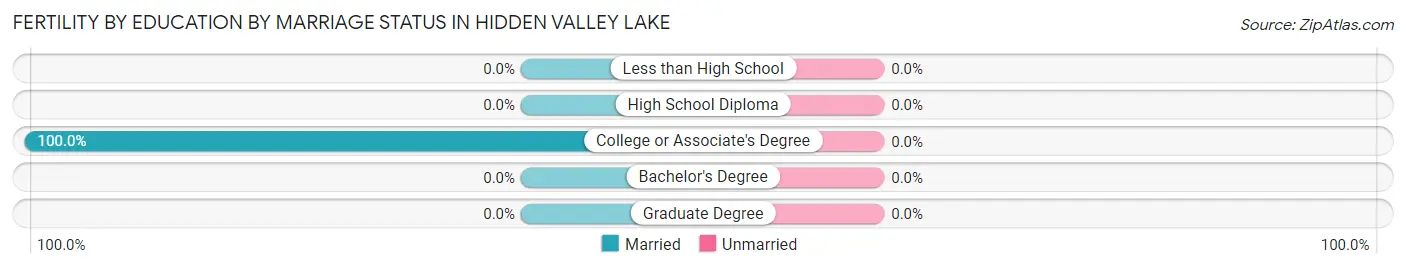
| Educational Attainment | Married | Unmarried |
| Less than High School | 0 (0.0%) | 0 (0.0%) |
| High School Diploma | 0 (0.0%) | 0 (0.0%) |
| College or Associate's Degree | 9 (100.0%) | 0 (0.0%) |
| Bachelor's Degree | 0 (0.0%) | 0 (0.0%) |
| Graduate Degree | 0 (0.0%) | 0 (0.0%) |
| Total | 9 (100.0%) | 0 (0.0%) |
Employment Characteristics in Hidden Valley Lake
Employment by Class of Employer in Hidden Valley Lake
Among the 2,059 employed individuals in Hidden Valley Lake, private company employees (1,154 | 56.0%), local government employees (309 | 15.0%), and self-employed (not incorporated) (186 | 9.0%) make up the most common classes of employment.
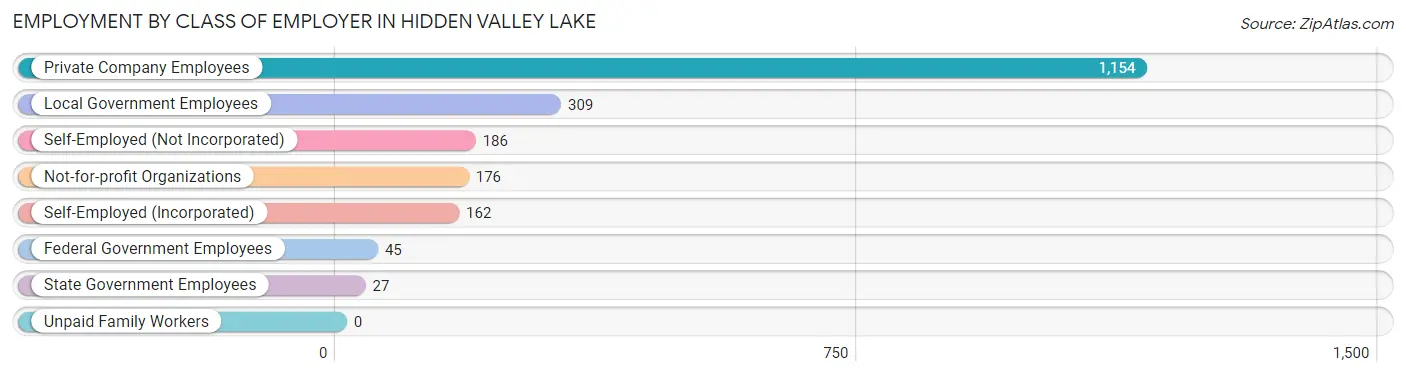
| Employer Class | # Employees | % Employees |
| Private Company Employees | 1,154 | 56.0% |
| Self-Employed (Incorporated) | 162 | 7.9% |
| Self-Employed (Not Incorporated) | 186 | 9.0% |
| Not-for-profit Organizations | 176 | 8.6% |
| Local Government Employees | 309 | 15.0% |
| State Government Employees | 27 | 1.3% |
| Federal Government Employees | 45 | 2.2% |
| Unpaid Family Workers | 0 | 0.0% |
| Total | 2,059 | 100.0% |
Employment Status by Age in Hidden Valley Lake
According to the labor force statistics for Hidden Valley Lake, out of the total population over 16 years of age (4,533), 51.5% or 2,334 individuals are in the labor force, with 11.3% or 264 of them unemployed. The age group with the highest labor force participation rate is 25 to 29 years, with 100.0% or 127 individuals in the labor force. Within the labor force, the 20 to 24 years age range has the highest percentage of unemployed individuals, with 32.5% or 95 of them being unemployed.
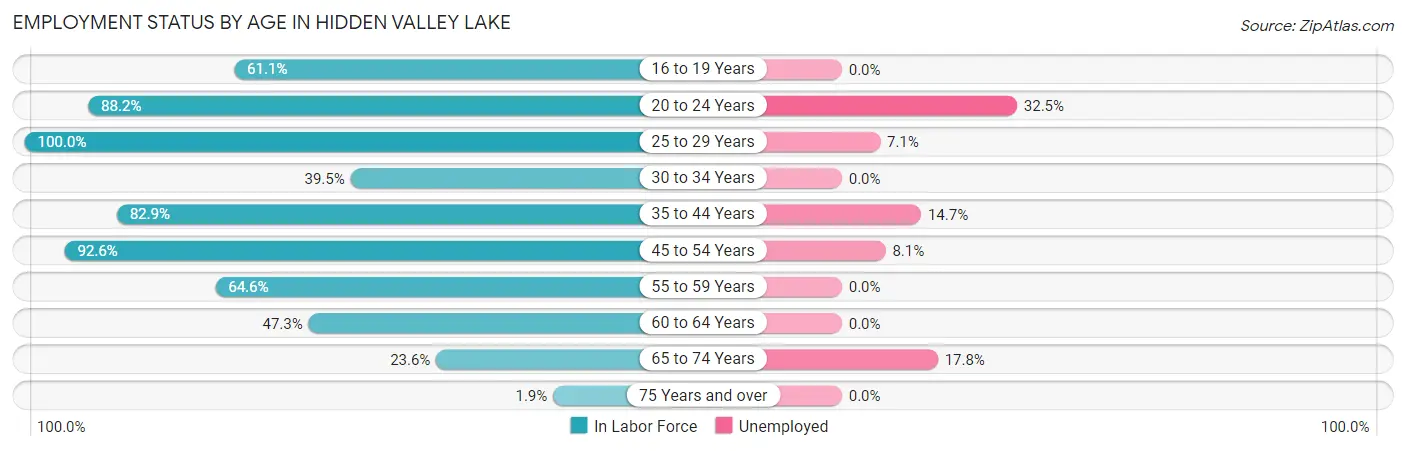
| Age Bracket | In Labor Force | Unemployed |
| 16 to 19 Years | 80 (61.1%) | 0 (0.0%) |
| 20 to 24 Years | 292 (88.2%) | 95 (32.5%) |
| 25 to 29 Years | 127 (100.0%) | 9 (7.1%) |
| 30 to 34 Years | 141 (39.5%) | 0 (0.0%) |
| 35 to 44 Years | 572 (82.9%) | 84 (14.7%) |
| 45 to 54 Years | 491 (92.6%) | 40 (8.1%) |
| 55 to 59 Years | 210 (64.6%) | 0 (0.0%) |
| 60 to 64 Years | 182 (47.3%) | 0 (0.0%) |
| 65 to 74 Years | 225 (23.6%) | 40 (17.8%) |
| 75 Years and over | 13 (1.9%) | 0 (0.0%) |
| Total | 2,334 (51.5%) | 264 (11.3%) |
Employment Status by Educational Attainment in Hidden Valley Lake
According to labor force statistics for Hidden Valley Lake, 71.4% of individuals (1,724) out of the total population between 25 and 64 years of age (2,414) are in the labor force, with 7.7% or 133 of them being unemployed. The group with the highest labor force participation rate are those with the educational attainment of high school diploma, with 78.0% or 471 individuals in the labor force. Within the labor force, individuals with college / associate degree education have the highest percentage of unemployment, with 14.7% or 133 of them being unemployed.
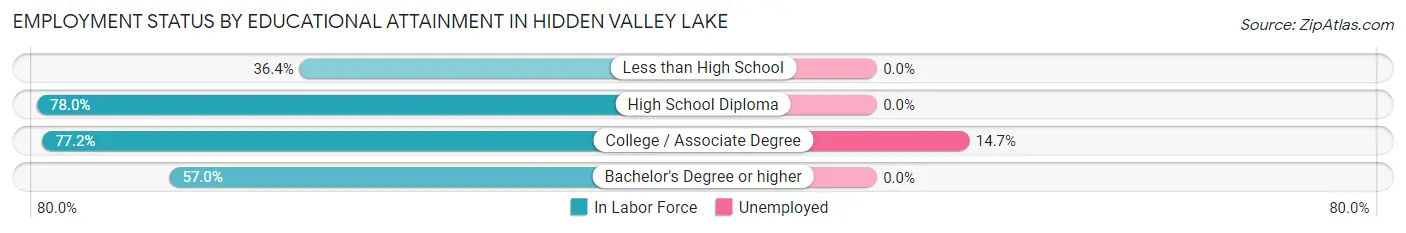
| Educational Attainment | In Labor Force | Unemployed |
| Less than High School | 28 (36.4%) | 0 (0.0%) |
| High School Diploma | 471 (78.0%) | 0 (0.0%) |
| College / Associate Degree | 906 (77.2%) | 172 (14.7%) |
| Bachelor's Degree or higher | 319 (57.0%) | 0 (0.0%) |
| Total | 1,724 (71.4%) | 186 (7.7%) |
Employment Occupations by Sex in Hidden Valley Lake
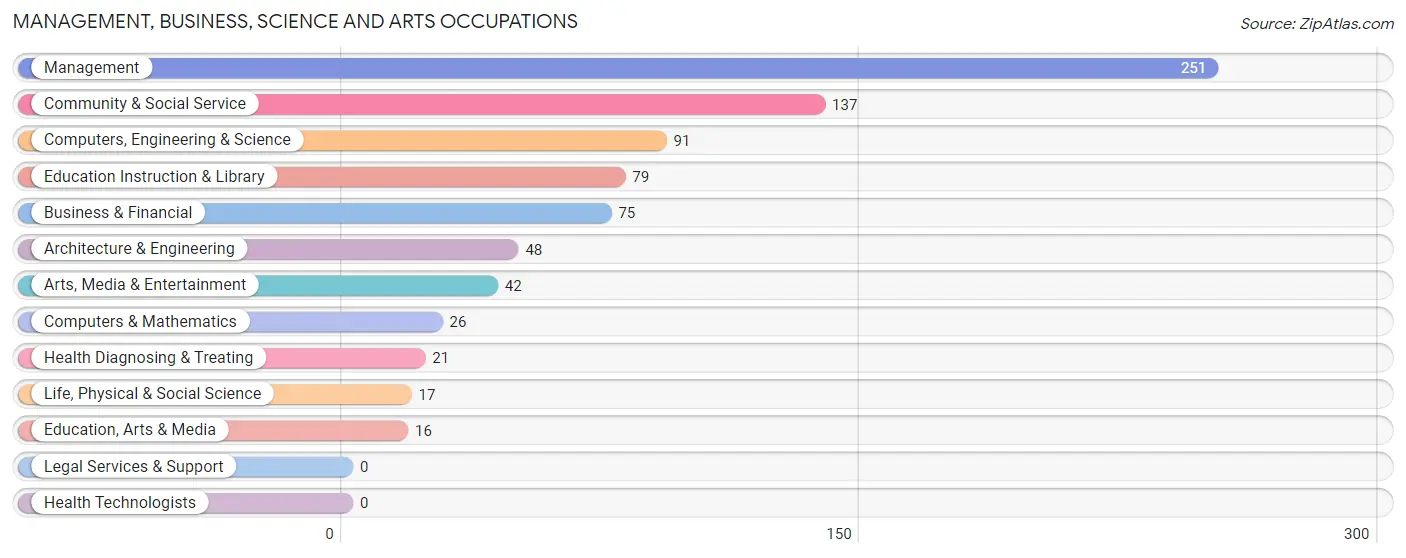
Management, Business, Science and Arts Occupations
The most common Management, Business, Science and Arts occupations in Hidden Valley Lake are Management (251 | 12.2%), Community & Social Service (137 | 6.7%), Computers, Engineering & Science (91 | 4.4%), Education Instruction & Library (79 | 3.8%), and Business & Financial (75 | 3.6%).
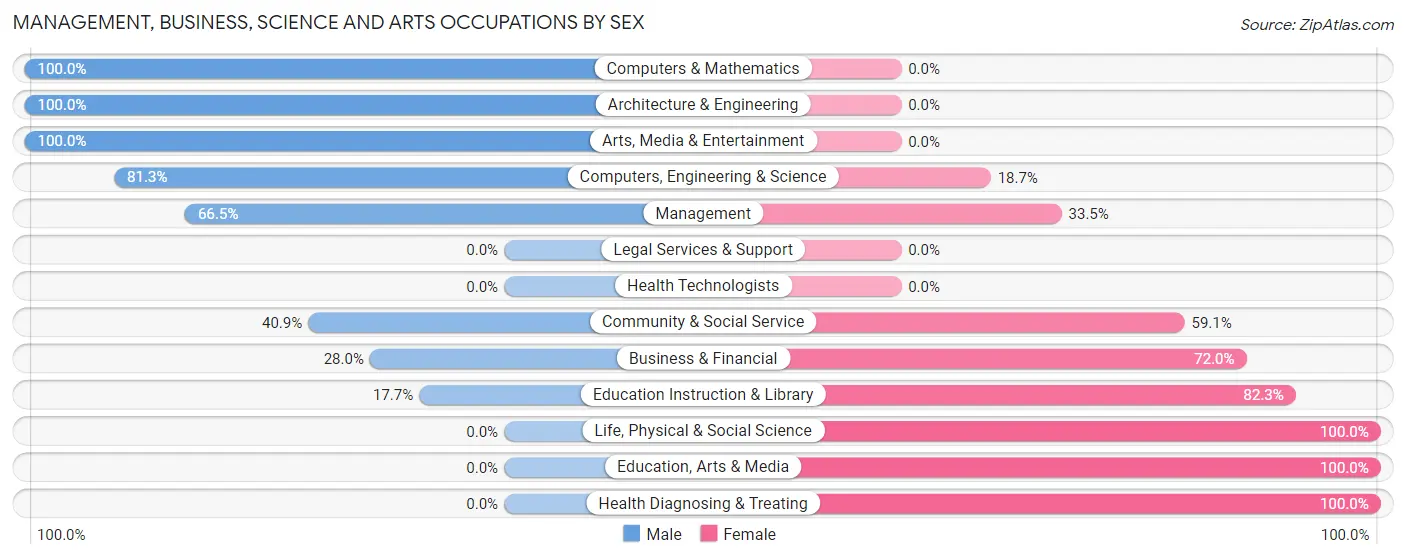
Management, Business, Science and Arts Occupations by Sex
Within the Management, Business, Science and Arts occupations in Hidden Valley Lake, the most male-oriented occupations are Computers & Mathematics (100.0%), Architecture & Engineering (100.0%), and Arts, Media & Entertainment (100.0%), while the most female-oriented occupations are Life, Physical & Social Science (100.0%), Education, Arts & Media (100.0%), and Health Diagnosing & Treating (100.0%).
| Occupation | Male | Female |
| Management | 167 (66.5%) | 84 (33.5%) |
| Business & Financial | 21 (28.0%) | 54 (72.0%) |
| Computers, Engineering & Science | 74 (81.3%) | 17 (18.7%) |
| Computers & Mathematics | 26 (100.0%) | 0 (0.0%) |
| Architecture & Engineering | 48 (100.0%) | 0 (0.0%) |
| Life, Physical & Social Science | 0 (0.0%) | 17 (100.0%) |
| Community & Social Service | 56 (40.9%) | 81 (59.1%) |
| Education, Arts & Media | 0 (0.0%) | 16 (100.0%) |
| Legal Services & Support | 0 (0.0%) | 0 (0.0%) |
| Education Instruction & Library | 14 (17.7%) | 65 (82.3%) |
| Arts, Media & Entertainment | 42 (100.0%) | 0 (0.0%) |
| Health Diagnosing & Treating | 0 (0.0%) | 21 (100.0%) |
| Health Technologists | 0 (0.0%) | 0 (0.0%) |
| Total (Category) | 318 (55.3%) | 257 (44.7%) |
| Total (Overall) | 1,140 (55.5%) | 913 (44.5%) |
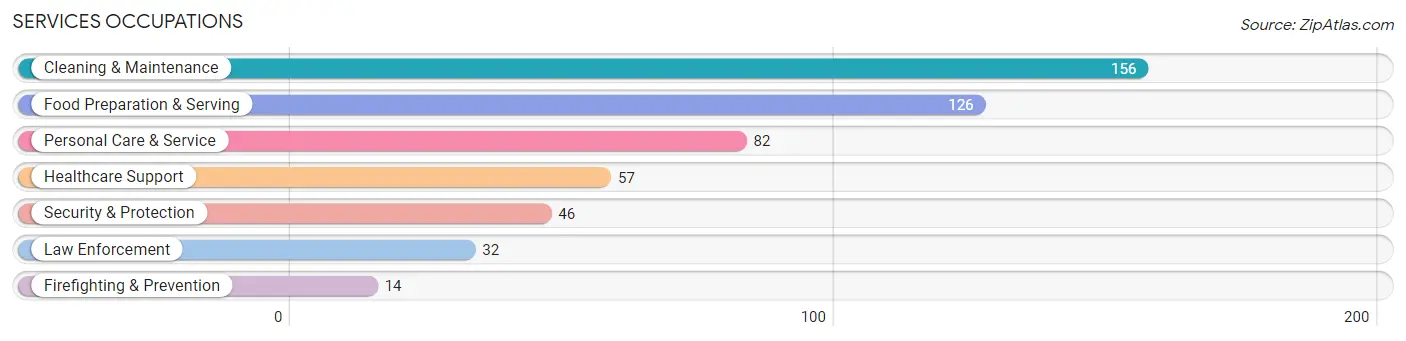
Services Occupations
The most common Services occupations in Hidden Valley Lake are Cleaning & Maintenance (156 | 7.6%), Food Preparation & Serving (126 | 6.1%), Personal Care & Service (82 | 4.0%), Healthcare Support (57 | 2.8%), and Security & Protection (46 | 2.2%).
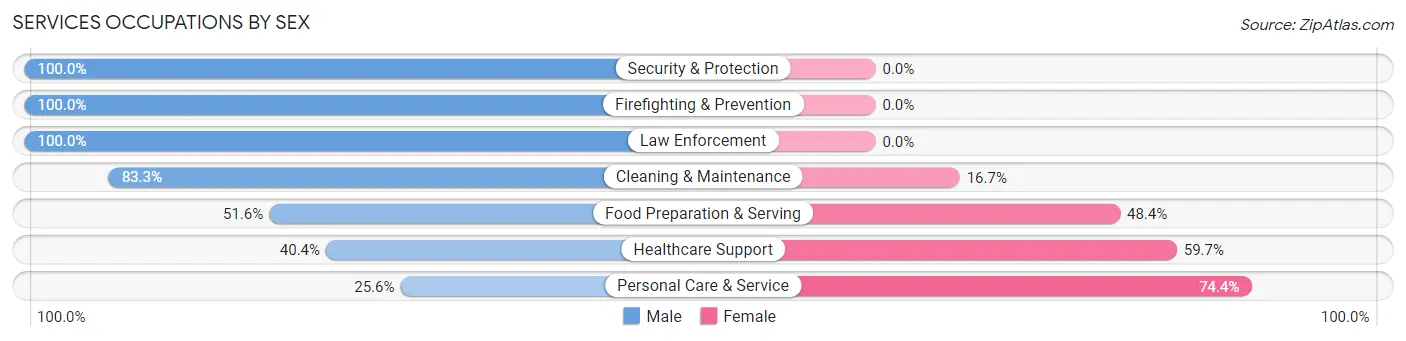
Services Occupations by Sex
Within the Services occupations in Hidden Valley Lake, the most male-oriented occupations are Security & Protection (100.0%), Firefighting & Prevention (100.0%), and Law Enforcement (100.0%), while the most female-oriented occupations are Personal Care & Service (74.4%), Healthcare Support (59.7%), and Food Preparation & Serving (48.4%).
| Occupation | Male | Female |
| Healthcare Support | 23 (40.4%) | 34 (59.7%) |
| Security & Protection | 46 (100.0%) | 0 (0.0%) |
| Firefighting & Prevention | 14 (100.0%) | 0 (0.0%) |
| Law Enforcement | 32 (100.0%) | 0 (0.0%) |
| Food Preparation & Serving | 65 (51.6%) | 61 (48.4%) |
| Cleaning & Maintenance | 130 (83.3%) | 26 (16.7%) |
| Personal Care & Service | 21 (25.6%) | 61 (74.4%) |
| Total (Category) | 285 (61.0%) | 182 (39.0%) |
| Total (Overall) | 1,140 (55.5%) | 913 (44.5%) |
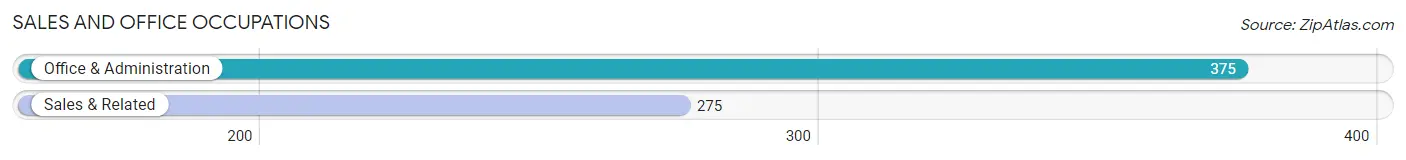
Sales and Office Occupations
The most common Sales and Office occupations in Hidden Valley Lake are Office & Administration (375 | 18.3%), and Sales & Related (275 | 13.4%).
Sales and Office Occupations by Sex
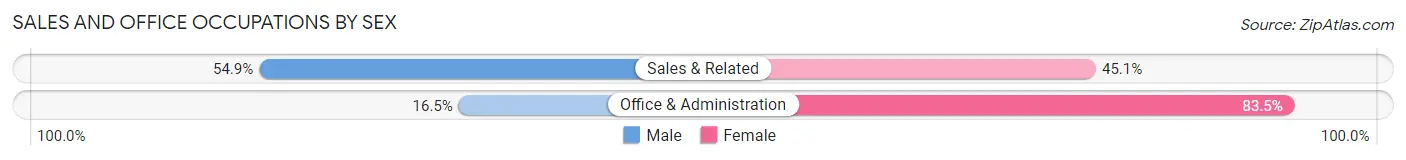
| Occupation | Male | Female |
| Sales & Related | 151 (54.9%) | 124 (45.1%) |
| Office & Administration | 62 (16.5%) | 313 (83.5%) |
| Total (Category) | 213 (32.8%) | 437 (67.2%) |
| Total (Overall) | 1,140 (55.5%) | 913 (44.5%) |
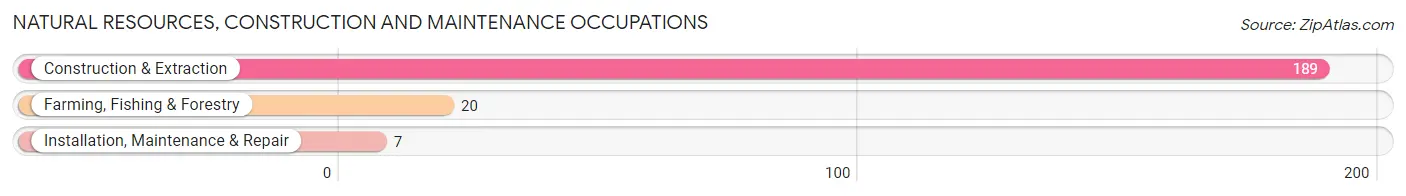
Natural Resources, Construction and Maintenance Occupations
The most common Natural Resources, Construction and Maintenance occupations in Hidden Valley Lake are Construction & Extraction (189 | 9.2%), Farming, Fishing & Forestry (20 | 1.0%), and Installation, Maintenance & Repair (7 | 0.3%).
Natural Resources, Construction and Maintenance Occupations by Sex
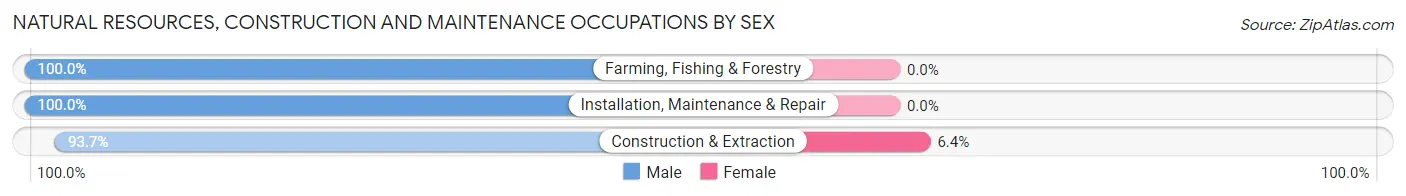
| Occupation | Male | Female |
| Farming, Fishing & Forestry | 20 (100.0%) | 0 (0.0%) |
| Construction & Extraction | 177 (93.6%) | 12 (6.4%) |
| Installation, Maintenance & Repair | 7 (100.0%) | 0 (0.0%) |
| Total (Category) | 204 (94.4%) | 12 (5.6%) |
| Total (Overall) | 1,140 (55.5%) | 913 (44.5%) |
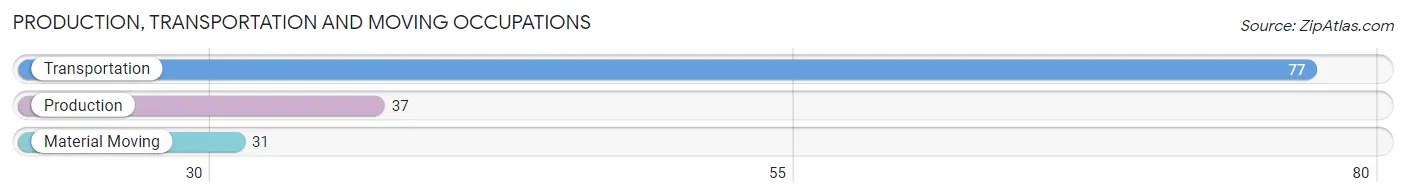
Production, Transportation and Moving Occupations
The most common Production, Transportation and Moving occupations in Hidden Valley Lake are Transportation (77 | 3.7%), Production (37 | 1.8%), and Material Moving (31 | 1.5%).
Production, Transportation and Moving Occupations by Sex
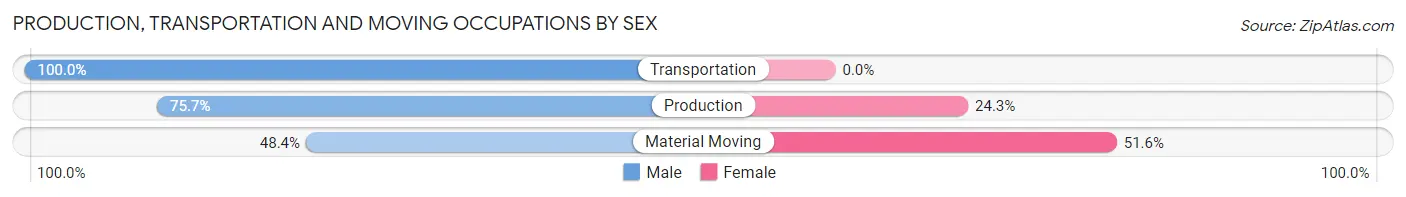
| Occupation | Male | Female |
| Production | 28 (75.7%) | 9 (24.3%) |
| Transportation | 77 (100.0%) | 0 (0.0%) |
| Material Moving | 15 (48.4%) | 16 (51.6%) |
| Total (Category) | 120 (82.8%) | 25 (17.2%) |
| Total (Overall) | 1,140 (55.5%) | 913 (44.5%) |
Employment Industries by Sex in Hidden Valley Lake
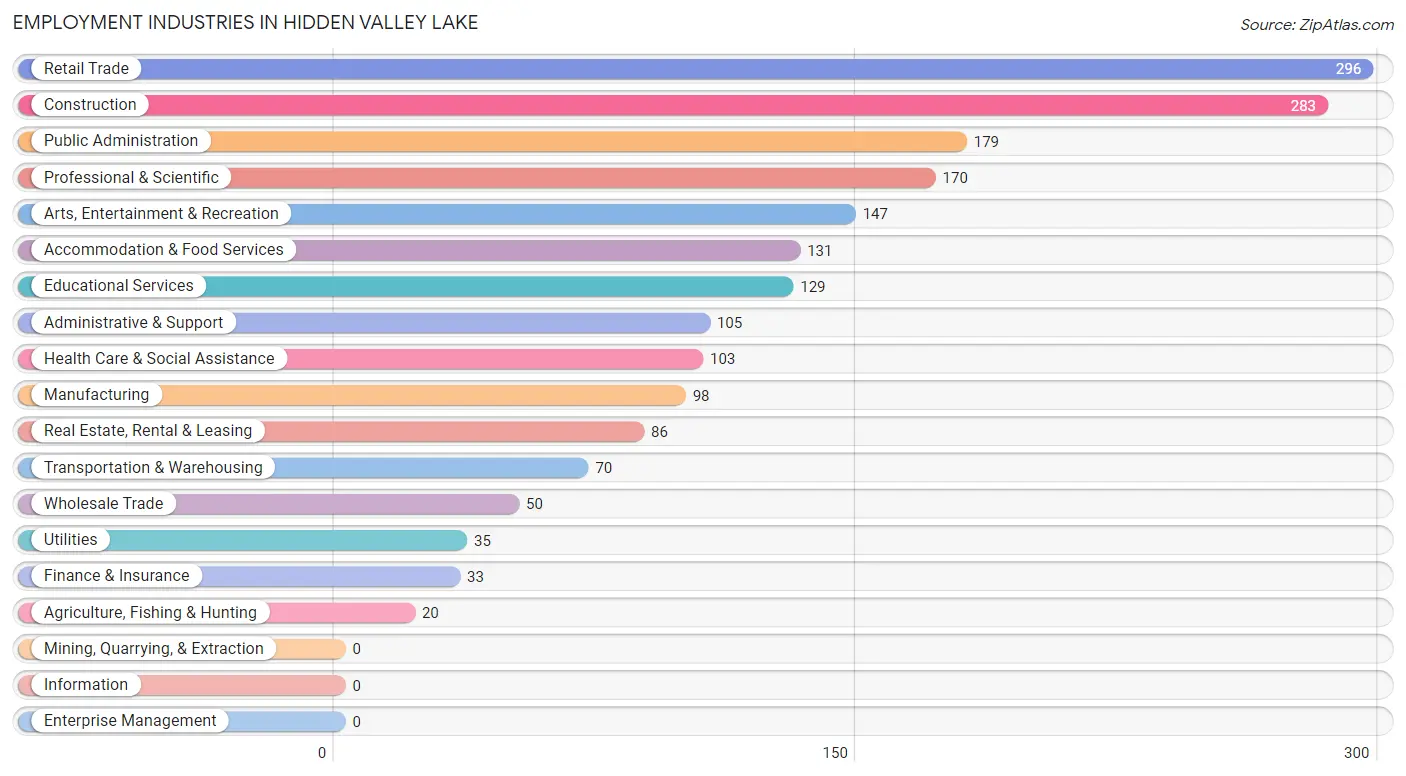
Employment Industries in Hidden Valley Lake
The major employment industries in Hidden Valley Lake include Retail Trade (296 | 14.4%), Construction (283 | 13.8%), Public Administration (179 | 8.7%), Professional & Scientific (170 | 8.3%), and Arts, Entertainment & Recreation (147 | 7.2%).
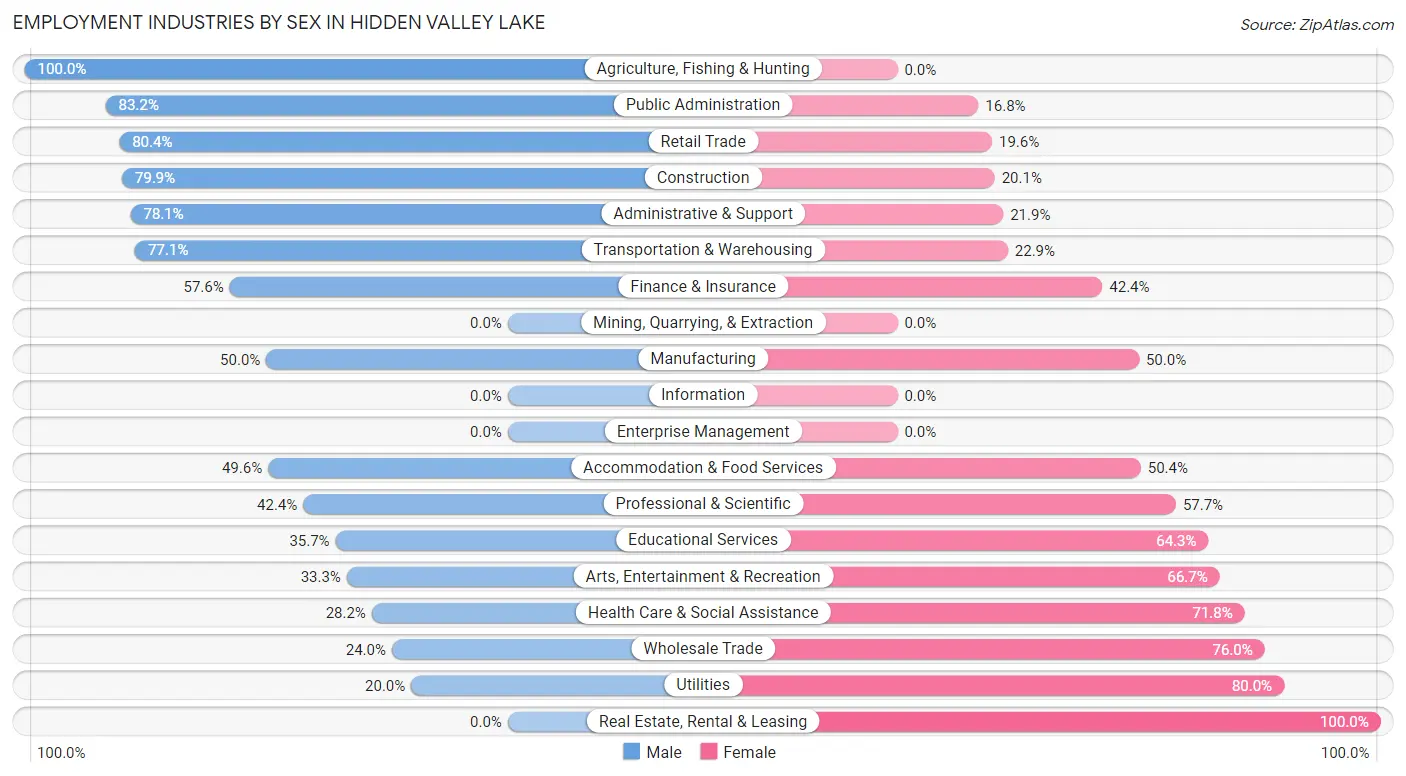
Employment Industries by Sex in Hidden Valley Lake
The Hidden Valley Lake industries that see more men than women are Agriculture, Fishing & Hunting (100.0%), Public Administration (83.2%), and Retail Trade (80.4%), whereas the industries that tend to have a higher number of women are Real Estate, Rental & Leasing (100.0%), Utilities (80.0%), and Wholesale Trade (76.0%).
| Industry | Male | Female |
| Agriculture, Fishing & Hunting | 20 (100.0%) | 0 (0.0%) |
| Mining, Quarrying, & Extraction | 0 (0.0%) | 0 (0.0%) |
| Construction | 226 (79.9%) | 57 (20.1%) |
| Manufacturing | 49 (50.0%) | 49 (50.0%) |
| Wholesale Trade | 12 (24.0%) | 38 (76.0%) |
| Retail Trade | 238 (80.4%) | 58 (19.6%) |
| Transportation & Warehousing | 54 (77.1%) | 16 (22.9%) |
| Utilities | 7 (20.0%) | 28 (80.0%) |
| Information | 0 (0.0%) | 0 (0.0%) |
| Finance & Insurance | 19 (57.6%) | 14 (42.4%) |
| Real Estate, Rental & Leasing | 0 (0.0%) | 86 (100.0%) |
| Professional & Scientific | 72 (42.3%) | 98 (57.7%) |
| Enterprise Management | 0 (0.0%) | 0 (0.0%) |
| Administrative & Support | 82 (78.1%) | 23 (21.9%) |
| Educational Services | 46 (35.7%) | 83 (64.3%) |
| Health Care & Social Assistance | 29 (28.2%) | 74 (71.8%) |
| Arts, Entertainment & Recreation | 49 (33.3%) | 98 (66.7%) |
| Accommodation & Food Services | 65 (49.6%) | 66 (50.4%) |
| Public Administration | 149 (83.2%) | 30 (16.8%) |
| Total | 1,140 (55.5%) | 913 (44.5%) |
Education in Hidden Valley Lake
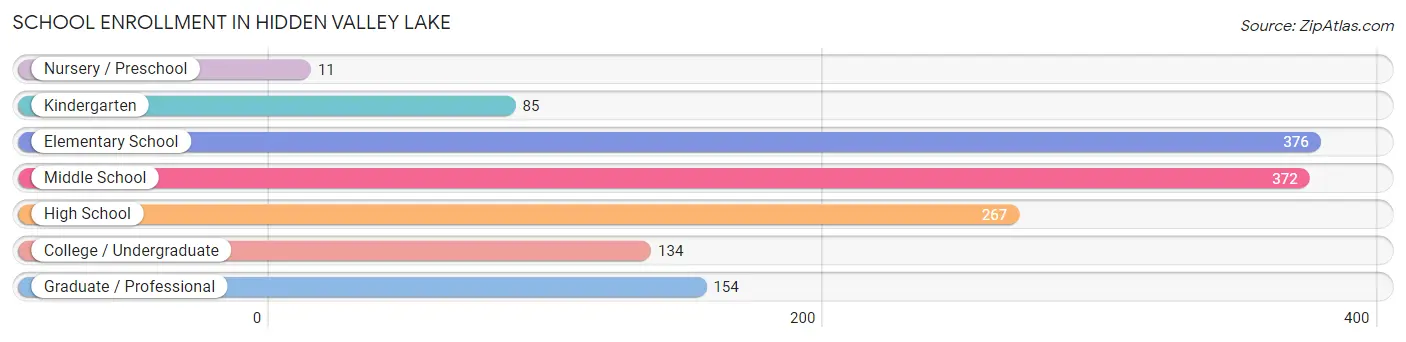
School Enrollment in Hidden Valley Lake
The most common levels of schooling among the 1,399 students in Hidden Valley Lake are elementary school (376 | 26.9%), middle school (372 | 26.6%), and high school (267 | 19.1%).
| School Level | # Students | % Students |
| Nursery / Preschool | 11 | 0.8% |
| Kindergarten | 85 | 6.1% |
| Elementary School | 376 | 26.9% |
| Middle School | 372 | 26.6% |
| High School | 267 | 19.1% |
| College / Undergraduate | 134 | 9.6% |
| Graduate / Professional | 154 | 11.0% |
| Total | 1,399 | 100.0% |
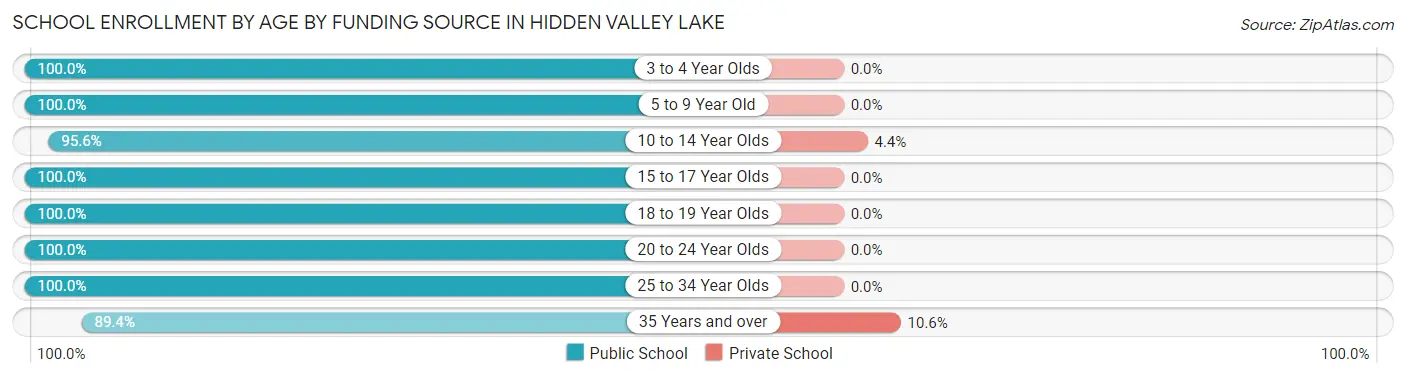
School Enrollment by Age by Funding Source in Hidden Valley Lake
Out of a total of 1,399 students who are enrolled in schools in Hidden Valley Lake, 28 (2.0%) attend a private institution, while the remaining 1,371 (98.0%) are enrolled in public schools. The age group of 35 years and over has the highest likelihood of being enrolled in private schools, with 7 (10.6% in the age bracket) enrolled. Conversely, the age group of 3 to 4 year olds has the lowest likelihood of being enrolled in a private school, with 11 (100.0% in the age bracket) attending a public institution.
| Age Bracket | Public School | Private School |
| 3 to 4 Year Olds | 11 (100.0%) | 0 (0.0%) |
| 5 to 9 Year Old | 447 (100.0%) | 0 (0.0%) |
| 10 to 14 Year Olds | 452 (95.6%) | 21 (4.4%) |
| 15 to 17 Year Olds | 147 (100.0%) | 0 (0.0%) |
| 18 to 19 Year Olds | 61 (100.0%) | 0 (0.0%) |
| 20 to 24 Year Olds | 99 (100.0%) | 0 (0.0%) |
| 25 to 34 Year Olds | 95 (100.0%) | 0 (0.0%) |
| 35 Years and over | 59 (89.4%) | 7 (10.6%) |
| Total | 1,371 (98.0%) | 28 (2.0%) |
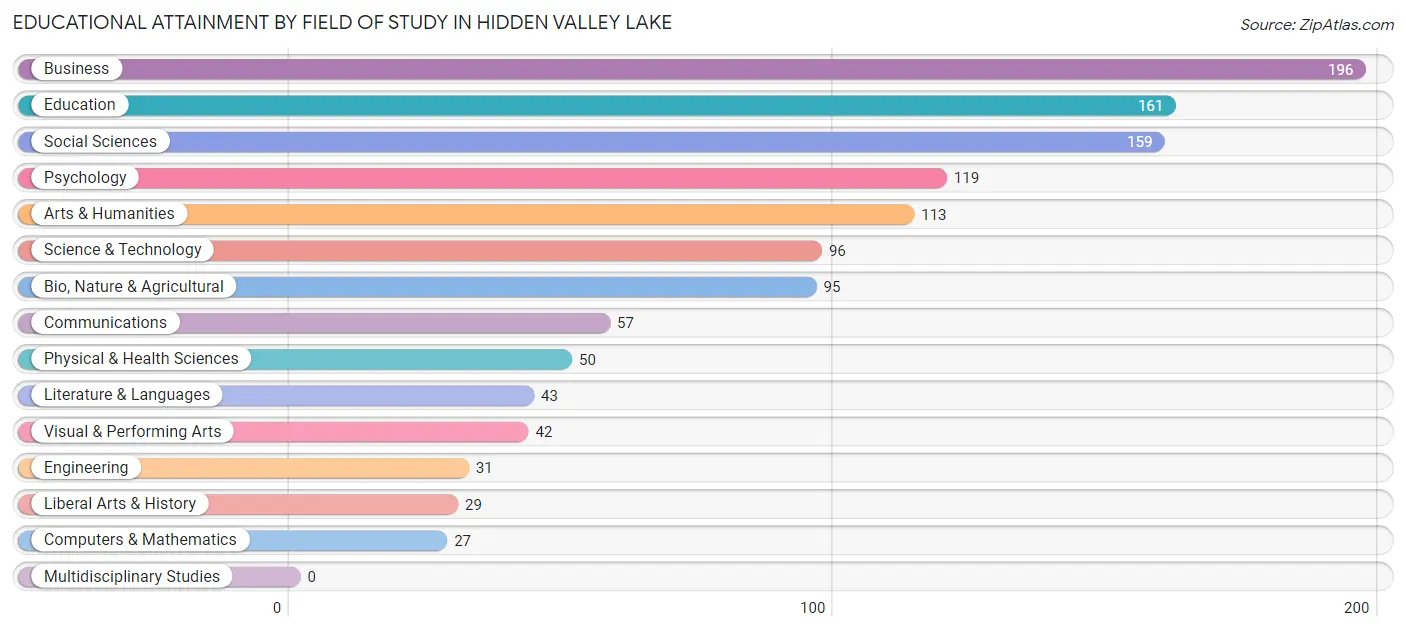
Educational Attainment by Field of Study in Hidden Valley Lake
Business (196 | 16.1%), education (161 | 13.2%), social sciences (159 | 13.1%), psychology (119 | 9.8%), and arts & humanities (113 | 9.3%) are the most common fields of study among 1,218 individuals in Hidden Valley Lake who have obtained a bachelor's degree or higher.
| Field of Study | # Graduates | % Graduates |
| Computers & Mathematics | 27 | 2.2% |
| Bio, Nature & Agricultural | 95 | 7.8% |
| Physical & Health Sciences | 50 | 4.1% |
| Psychology | 119 | 9.8% |
| Social Sciences | 159 | 13.1% |
| Engineering | 31 | 2.5% |
| Multidisciplinary Studies | 0 | 0.0% |
| Science & Technology | 96 | 7.9% |
| Business | 196 | 16.1% |
| Education | 161 | 13.2% |
| Literature & Languages | 43 | 3.5% |
| Liberal Arts & History | 29 | 2.4% |
| Visual & Performing Arts | 42 | 3.5% |
| Communications | 57 | 4.7% |
| Arts & Humanities | 113 | 9.3% |
| Total | 1,218 | 100.0% |
Transportation & Commute in Hidden Valley Lake
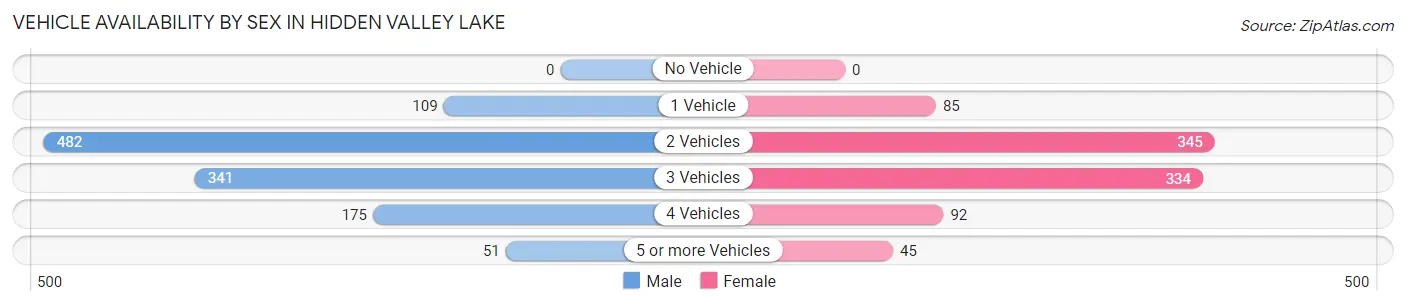
Vehicle Availability by Sex in Hidden Valley Lake
The most prevalent vehicle ownership categories in Hidden Valley Lake are males with 2 vehicles (482, accounting for 41.6%) and females with 2 vehicles (345, making up 53.5%).
| Vehicles Available | Male | Female |
| No Vehicle | 0 (0.0%) | 0 (0.0%) |
| 1 Vehicle | 109 (9.4%) | 85 (9.4%) |
| 2 Vehicles | 482 (41.6%) | 345 (38.3%) |
| 3 Vehicles | 341 (29.4%) | 334 (37.1%) |
| 4 Vehicles | 175 (15.1%) | 92 (10.2%) |
| 5 or more Vehicles | 51 (4.4%) | 45 (5.0%) |
| Total | 1,158 (100.0%) | 901 (100.0%) |
Commute Time in Hidden Valley Lake
The most frequently occuring commute durations in Hidden Valley Lake are 60 to 89 minutes (366 commuters, 20.8%), 10 to 14 minutes (206 commuters, 11.7%), and 45 to 59 minutes (188 commuters, 10.7%).
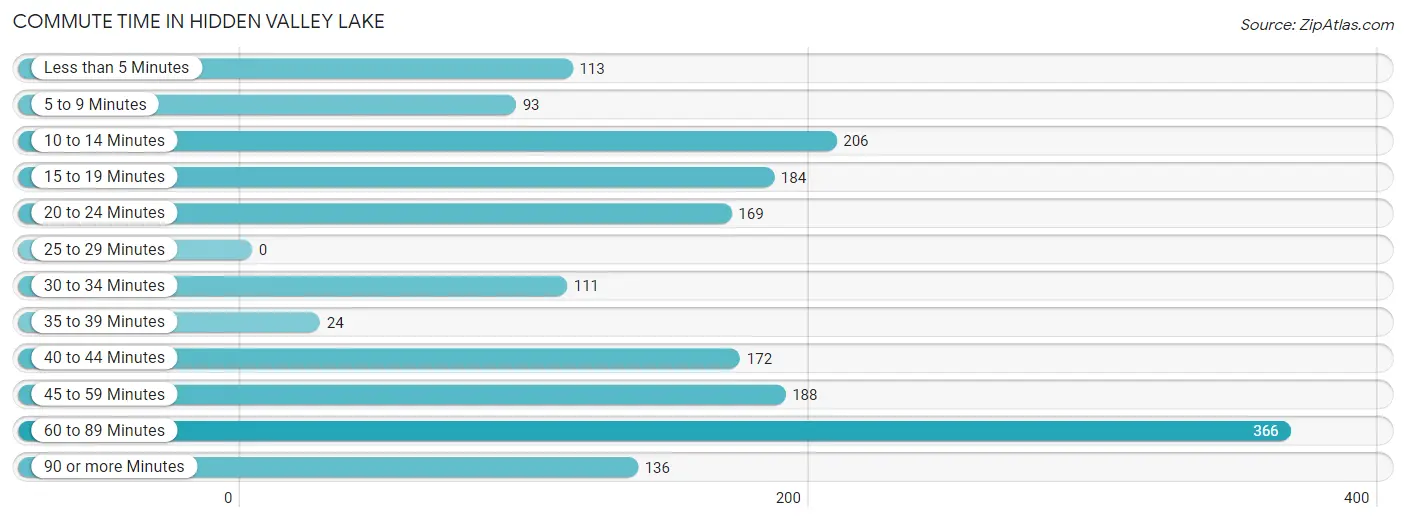
| Commute Time | # Commuters | % Commuters |
| Less than 5 Minutes | 113 | 6.4% |
| 5 to 9 Minutes | 93 | 5.3% |
| 10 to 14 Minutes | 206 | 11.7% |
| 15 to 19 Minutes | 184 | 10.4% |
| 20 to 24 Minutes | 169 | 9.6% |
| 25 to 29 Minutes | 0 | 0.0% |
| 30 to 34 Minutes | 111 | 6.3% |
| 35 to 39 Minutes | 24 | 1.4% |
| 40 to 44 Minutes | 172 | 9.8% |
| 45 to 59 Minutes | 188 | 10.7% |
| 60 to 89 Minutes | 366 | 20.8% |
| 90 or more Minutes | 136 | 7.7% |
Commute Time by Sex in Hidden Valley Lake
The most common commute times in Hidden Valley Lake are 60 to 89 minutes (269 commuters, 26.9%) for males and 15 to 19 minutes (163 commuters, 21.4%) for females.
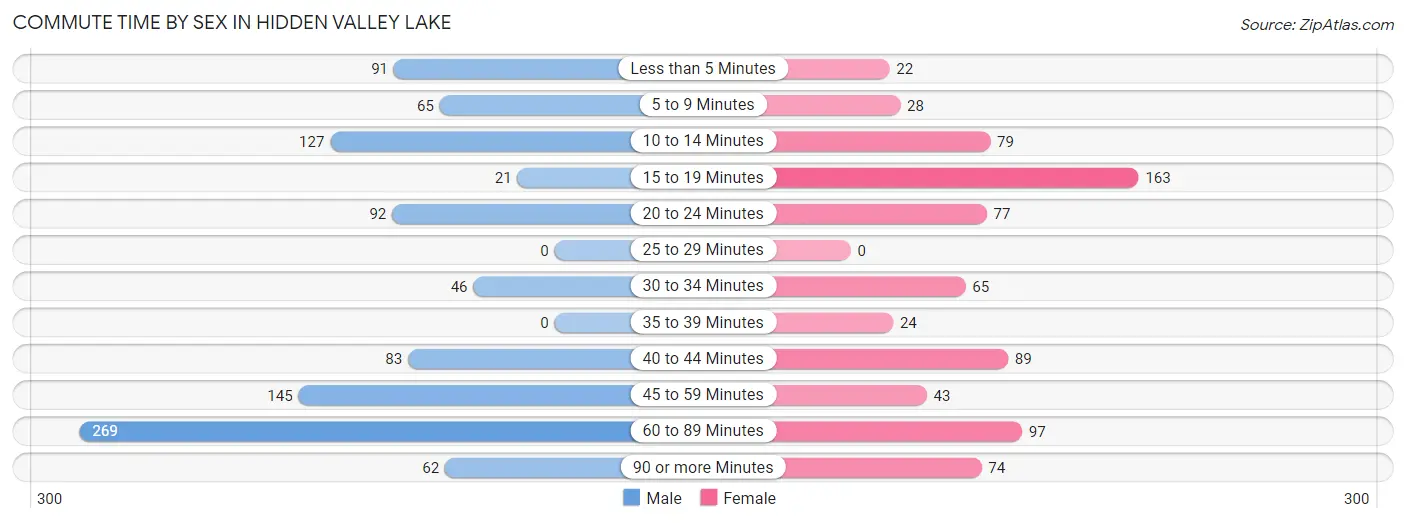
| Commute Time | Male | Female |
| Less than 5 Minutes | 91 (9.1%) | 22 (2.9%) |
| 5 to 9 Minutes | 65 (6.5%) | 28 (3.7%) |
| 10 to 14 Minutes | 127 (12.7%) | 79 (10.4%) |
| 15 to 19 Minutes | 21 (2.1%) | 163 (21.4%) |
| 20 to 24 Minutes | 92 (9.2%) | 77 (10.1%) |
| 25 to 29 Minutes | 0 (0.0%) | 0 (0.0%) |
| 30 to 34 Minutes | 46 (4.6%) | 65 (8.5%) |
| 35 to 39 Minutes | 0 (0.0%) | 24 (3.2%) |
| 40 to 44 Minutes | 83 (8.3%) | 89 (11.7%) |
| 45 to 59 Minutes | 145 (14.5%) | 43 (5.7%) |
| 60 to 89 Minutes | 269 (26.9%) | 97 (12.8%) |
| 90 or more Minutes | 62 (6.2%) | 74 (9.7%) |
Time of Departure to Work by Sex in Hidden Valley Lake
The most frequent times of departure to work in Hidden Valley Lake are 6:00 AM to 6:29 AM (221, 22.1%) for males and 7:30 AM to 7:59 AM (236, 31.0%) for females.
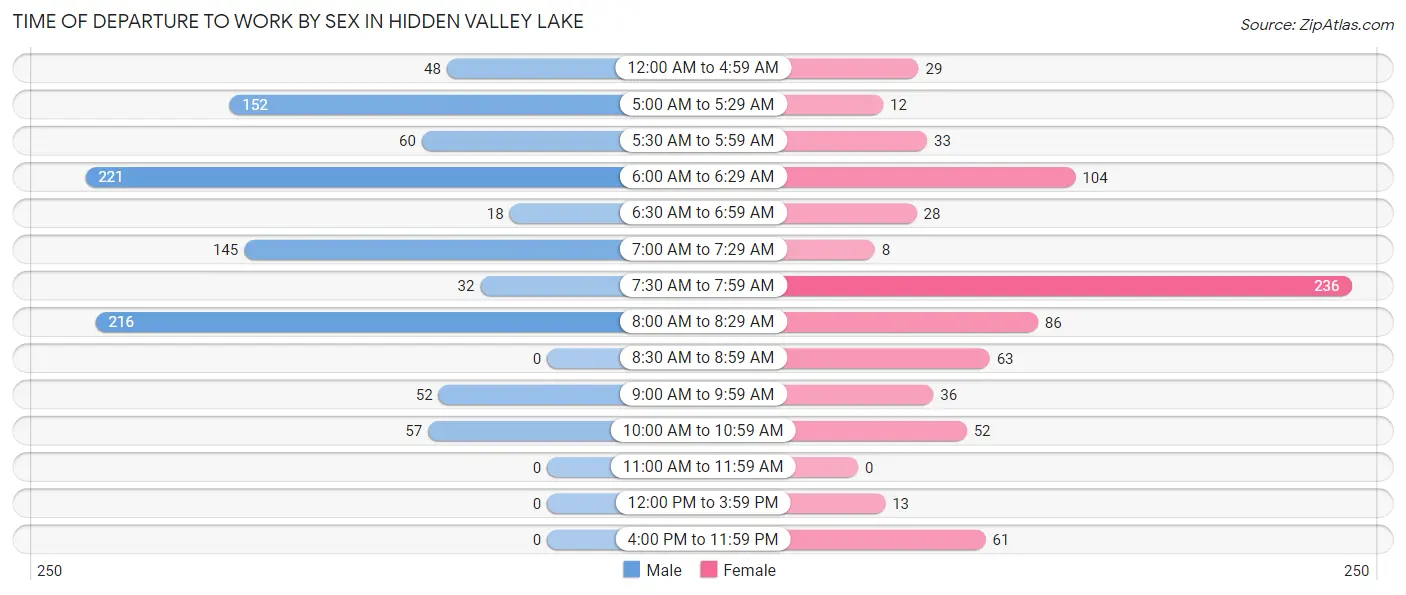
| Time of Departure | Male | Female |
| 12:00 AM to 4:59 AM | 48 (4.8%) | 29 (3.8%) |
| 5:00 AM to 5:29 AM | 152 (15.2%) | 12 (1.6%) |
| 5:30 AM to 5:59 AM | 60 (6.0%) | 33 (4.3%) |
| 6:00 AM to 6:29 AM | 221 (22.1%) | 104 (13.7%) |
| 6:30 AM to 6:59 AM | 18 (1.8%) | 28 (3.7%) |
| 7:00 AM to 7:29 AM | 145 (14.5%) | 8 (1.1%) |
| 7:30 AM to 7:59 AM | 32 (3.2%) | 236 (31.0%) |
| 8:00 AM to 8:29 AM | 216 (21.6%) | 86 (11.3%) |
| 8:30 AM to 8:59 AM | 0 (0.0%) | 63 (8.3%) |
| 9:00 AM to 9:59 AM | 52 (5.2%) | 36 (4.7%) |
| 10:00 AM to 10:59 AM | 57 (5.7%) | 52 (6.8%) |
| 11:00 AM to 11:59 AM | 0 (0.0%) | 0 (0.0%) |
| 12:00 PM to 3:59 PM | 0 (0.0%) | 13 (1.7%) |
| 4:00 PM to 11:59 PM | 0 (0.0%) | 61 (8.0%) |
| Total | 1,001 (100.0%) | 761 (100.0%) |
Housing Occupancy in Hidden Valley Lake
Occupancy by Ownership in Hidden Valley Lake
Of the total 2,209 dwellings in Hidden Valley Lake, owner-occupied units account for 1,686 (76.3%), while renter-occupied units make up 523 (23.7%).
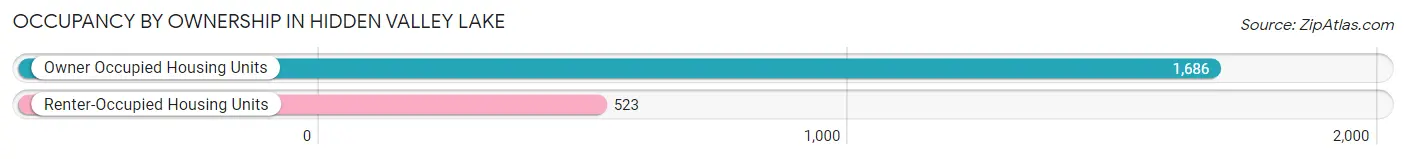
| Occupancy | # Housing Units | % Housing Units |
| Owner Occupied Housing Units | 1,686 | 76.3% |
| Renter-Occupied Housing Units | 523 | 23.7% |
| Total Occupied Housing Units | 2,209 | 100.0% |
Occupancy by Household Size in Hidden Valley Lake
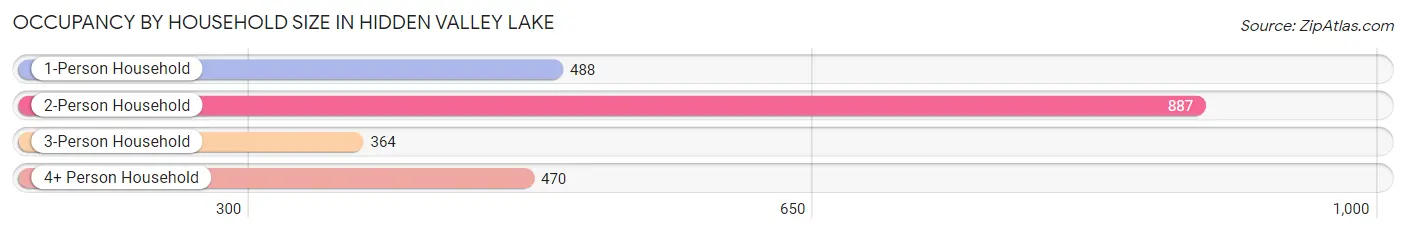
| Household Size | # Housing Units | % Housing Units |
| 1-Person Household | 488 | 22.1% |
| 2-Person Household | 887 | 40.2% |
| 3-Person Household | 364 | 16.5% |
| 4+ Person Household | 470 | 21.3% |
| Total Housing Units | 2,209 | 100.0% |
Occupancy by Ownership by Household Size in Hidden Valley Lake
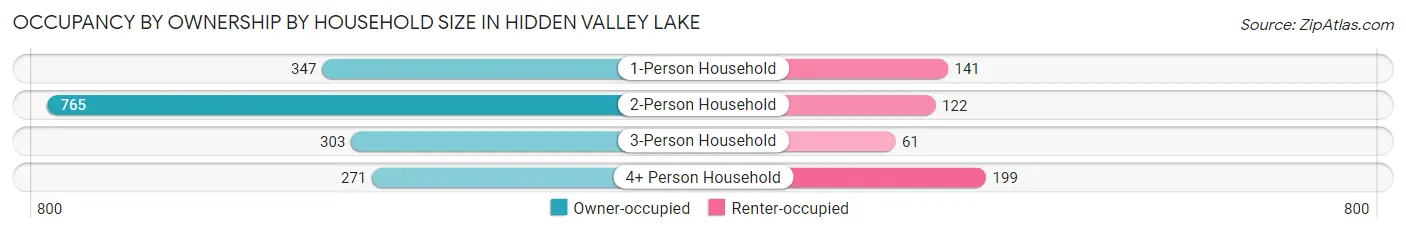
| Household Size | Owner-occupied | Renter-occupied |
| 1-Person Household | 347 (71.1%) | 141 (28.9%) |
| 2-Person Household | 765 (86.3%) | 122 (13.8%) |
| 3-Person Household | 303 (83.2%) | 61 (16.8%) |
| 4+ Person Household | 271 (57.7%) | 199 (42.3%) |
| Total Housing Units | 1,686 (76.3%) | 523 (23.7%) |
Occupancy by Educational Attainment in Hidden Valley Lake
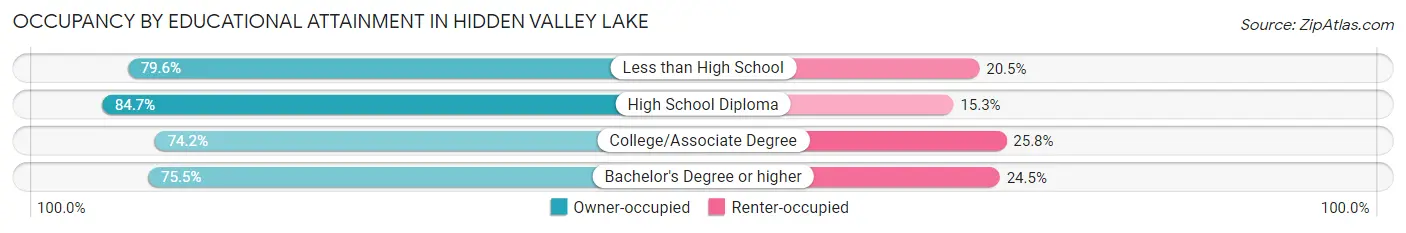
| Household Size | Owner-occupied | Renter-occupied |
| Less than High School | 35 (79.5%) | 9 (20.4%) |
| High School Diploma | 282 (84.7%) | 51 (15.3%) |
| College/Associate Degree | 802 (74.2%) | 279 (25.8%) |
| Bachelor's Degree or higher | 567 (75.5%) | 184 (24.5%) |
Occupancy by Age of Householder in Hidden Valley Lake
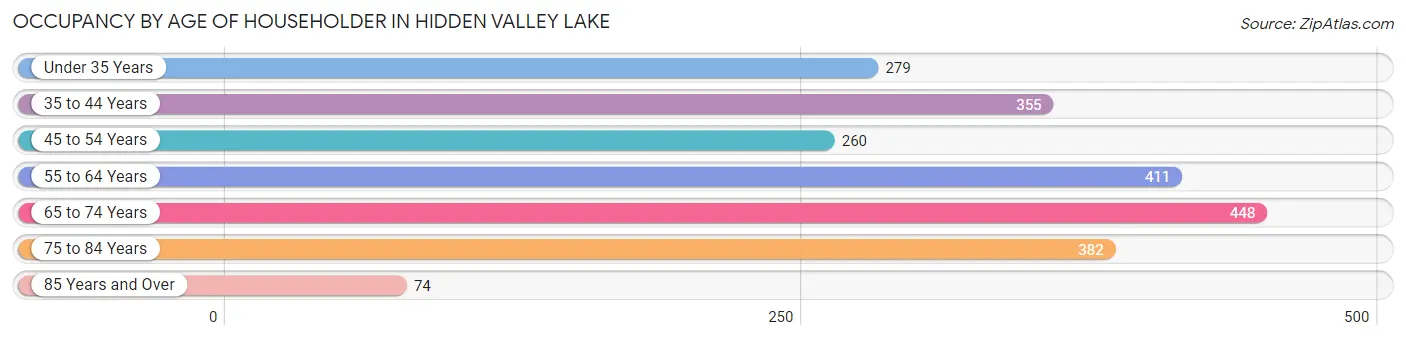
| Age Bracket | # Households | % Households |
| Under 35 Years | 279 | 12.6% |
| 35 to 44 Years | 355 | 16.1% |
| 45 to 54 Years | 260 | 11.8% |
| 55 to 64 Years | 411 | 18.6% |
| 65 to 74 Years | 448 | 20.3% |
| 75 to 84 Years | 382 | 17.3% |
| 85 Years and Over | 74 | 3.4% |
| Total | 2,209 | 100.0% |
Housing Finances in Hidden Valley Lake
Median Income by Occupancy in Hidden Valley Lake
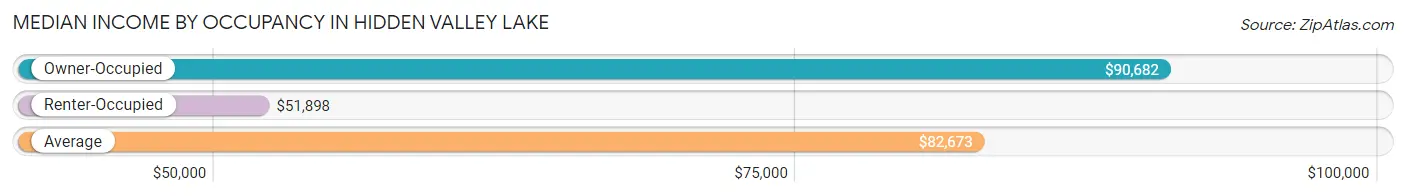
| Occupancy Type | # Households | Median Income |
| Owner-Occupied | 1,686 (76.3%) | $90,682 |
| Renter-Occupied | 523 (23.7%) | $51,898 |
| Average | 2,209 (100.0%) | $82,673 |
Occupancy by Householder Income Bracket in Hidden Valley Lake
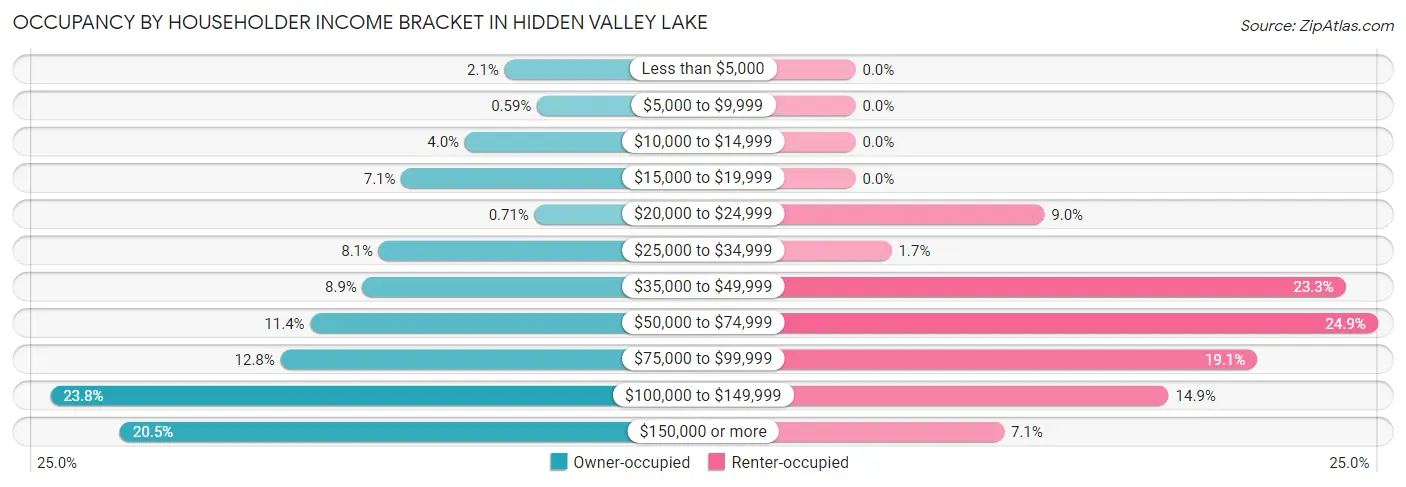
| Income Bracket | Owner-occupied | Renter-occupied |
| Less than $5,000 | 36 (2.1%) | 0 (0.0%) |
| $5,000 to $9,999 | 10 (0.6%) | 0 (0.0%) |
| $10,000 to $14,999 | 68 (4.0%) | 0 (0.0%) |
| $15,000 to $19,999 | 119 (7.1%) | 0 (0.0%) |
| $20,000 to $24,999 | 12 (0.7%) | 47 (9.0%) |
| $25,000 to $34,999 | 137 (8.1%) | 9 (1.7%) |
| $35,000 to $49,999 | 150 (8.9%) | 122 (23.3%) |
| $50,000 to $74,999 | 192 (11.4%) | 130 (24.9%) |
| $75,000 to $99,999 | 216 (12.8%) | 100 (19.1%) |
| $100,000 to $149,999 | 401 (23.8%) | 78 (14.9%) |
| $150,000 or more | 345 (20.5%) | 37 (7.1%) |
| Total | 1,686 (100.0%) | 523 (100.0%) |
Monthly Housing Cost Tiers in Hidden Valley Lake
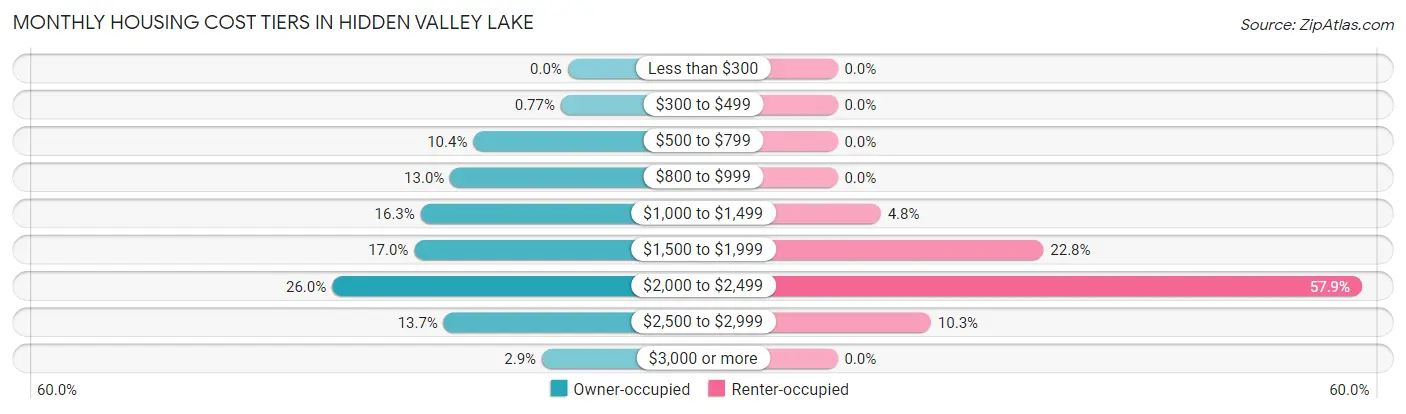
| Monthly Cost | Owner-occupied | Renter-occupied |
| Less than $300 | 0 (0.0%) | 0 (0.0%) |
| $300 to $499 | 13 (0.8%) | 0 (0.0%) |
| $500 to $799 | 176 (10.4%) | 0 (0.0%) |
| $800 to $999 | 219 (13.0%) | 0 (0.0%) |
| $1,000 to $1,499 | 274 (16.3%) | 25 (4.8%) |
| $1,500 to $1,999 | 286 (17.0%) | 119 (22.8%) |
| $2,000 to $2,499 | 439 (26.0%) | 303 (57.9%) |
| $2,500 to $2,999 | 231 (13.7%) | 54 (10.3%) |
| $3,000 or more | 48 (2.9%) | 0 (0.0%) |
| Total | 1,686 (100.0%) | 523 (100.0%) |
Physical Housing Characteristics in Hidden Valley Lake
Housing Structures in Hidden Valley Lake
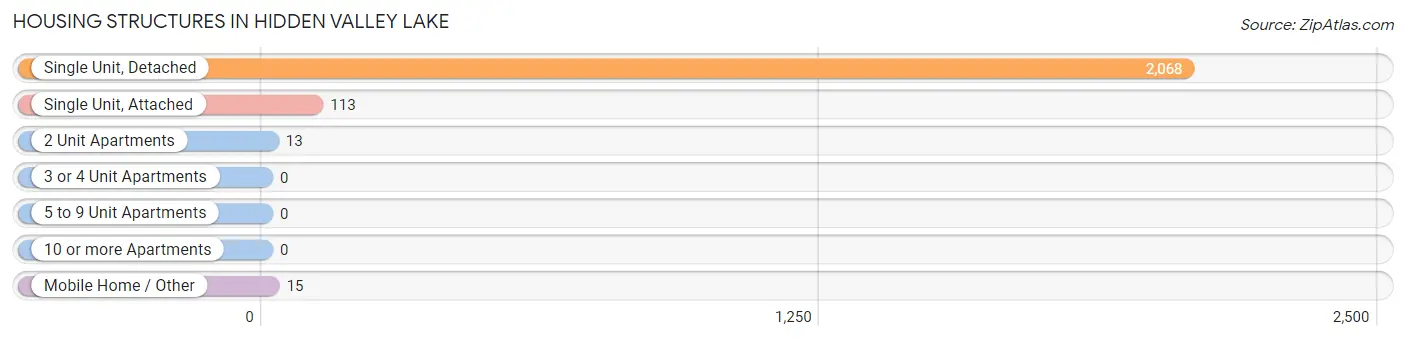
| Structure Type | # Housing Units | % Housing Units |
| Single Unit, Detached | 2,068 | 93.6% |
| Single Unit, Attached | 113 | 5.1% |
| 2 Unit Apartments | 13 | 0.6% |
| 3 or 4 Unit Apartments | 0 | 0.0% |
| 5 to 9 Unit Apartments | 0 | 0.0% |
| 10 or more Apartments | 0 | 0.0% |
| Mobile Home / Other | 15 | 0.7% |
| Total | 2,209 | 100.0% |
Housing Structures by Occupancy in Hidden Valley Lake
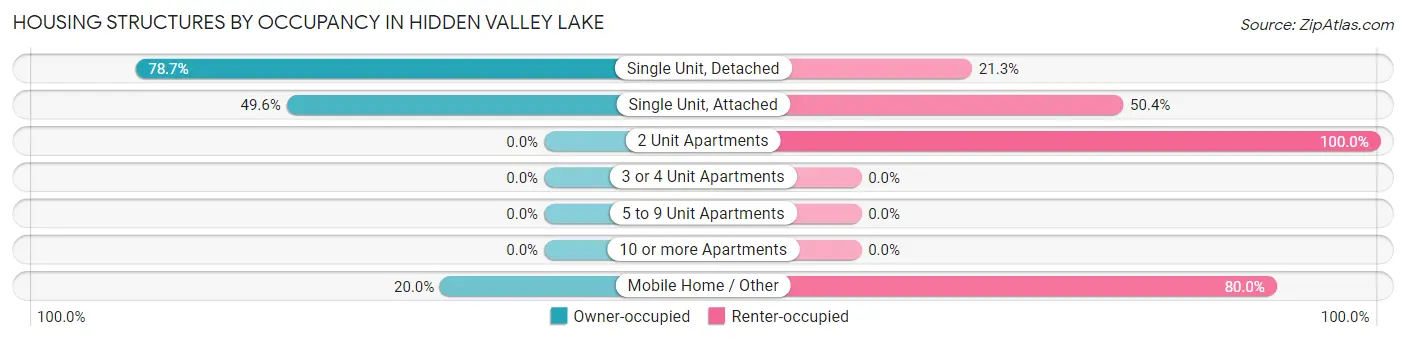
| Structure Type | Owner-occupied | Renter-occupied |
| Single Unit, Detached | 1,627 (78.7%) | 441 (21.3%) |
| Single Unit, Attached | 56 (49.6%) | 57 (50.4%) |
| 2 Unit Apartments | 0 (0.0%) | 13 (100.0%) |
| 3 or 4 Unit Apartments | 0 (0.0%) | 0 (0.0%) |
| 5 to 9 Unit Apartments | 0 (0.0%) | 0 (0.0%) |
| 10 or more Apartments | 0 (0.0%) | 0 (0.0%) |
| Mobile Home / Other | 3 (20.0%) | 12 (80.0%) |
| Total | 1,686 (76.3%) | 523 (23.7%) |
Housing Structures by Number of Rooms in Hidden Valley Lake
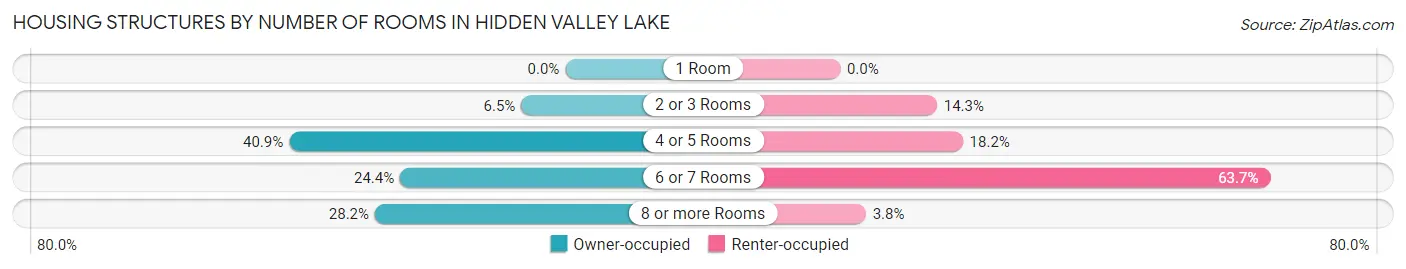
| Number of Rooms | Owner-occupied | Renter-occupied |
| 1 Room | 0 (0.0%) | 0 (0.0%) |
| 2 or 3 Rooms | 110 (6.5%) | 75 (14.3%) |
| 4 or 5 Rooms | 689 (40.9%) | 95 (18.2%) |
| 6 or 7 Rooms | 412 (24.4%) | 333 (63.7%) |
| 8 or more Rooms | 475 (28.2%) | 20 (3.8%) |
| Total | 1,686 (100.0%) | 523 (100.0%) |
Housing Structure by Heating Type in Hidden Valley Lake
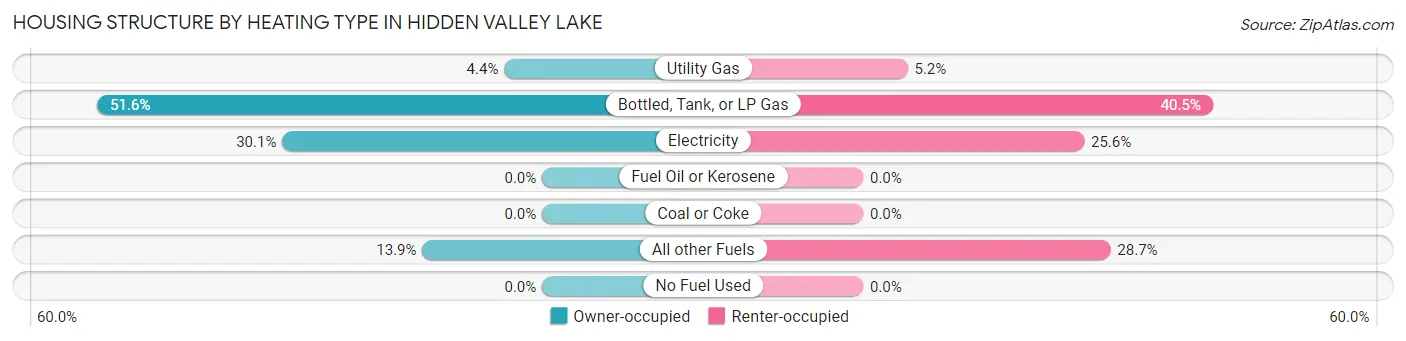
| Heating Type | Owner-occupied | Renter-occupied |
| Utility Gas | 74 (4.4%) | 27 (5.2%) |
| Bottled, Tank, or LP Gas | 870 (51.6%) | 212 (40.5%) |
| Electricity | 508 (30.1%) | 134 (25.6%) |
| Fuel Oil or Kerosene | 0 (0.0%) | 0 (0.0%) |
| Coal or Coke | 0 (0.0%) | 0 (0.0%) |
| All other Fuels | 234 (13.9%) | 150 (28.7%) |
| No Fuel Used | 0 (0.0%) | 0 (0.0%) |
| Total | 1,686 (100.0%) | 523 (100.0%) |
Household Vehicle Usage in Hidden Valley Lake
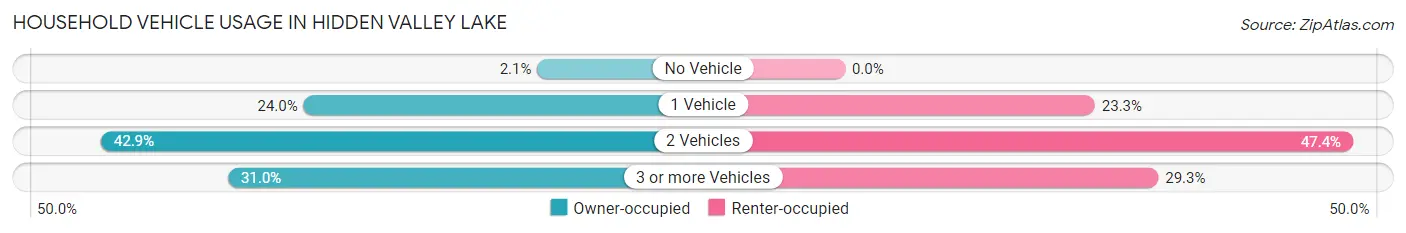
| Vehicles per Household | Owner-occupied | Renter-occupied |
| No Vehicle | 36 (2.1%) | 0 (0.0%) |
| 1 Vehicle | 404 (24.0%) | 122 (23.3%) |
| 2 Vehicles | 723 (42.9%) | 248 (47.4%) |
| 3 or more Vehicles | 523 (31.0%) | 153 (29.2%) |
| Total | 1,686 (100.0%) | 523 (100.0%) |
Real Estate & Mortgages in Hidden Valley Lake
Real Estate and Mortgage Overview in Hidden Valley Lake
| Characteristic | Without Mortgage | With Mortgage |
| Housing Units | 512 | 1,174 |
| Median Property Value | $421,900 | $403,400 |
| Median Household Income | $81,111 | $272 |
| Monthly Housing Costs | $871 | $48 |
| Real Estate Taxes | $3,458 | $0 |
Property Value by Mortgage Status in Hidden Valley Lake
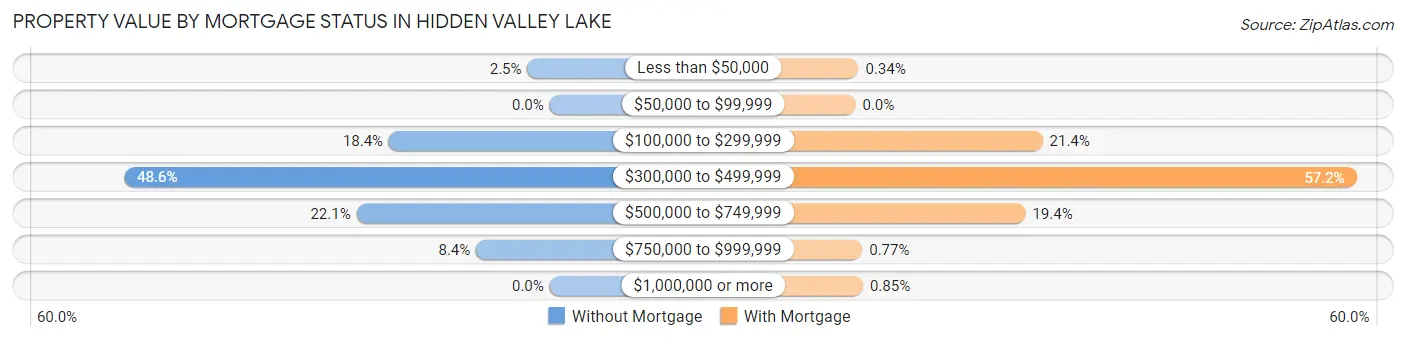
| Property Value | Without Mortgage | With Mortgage |
| Less than $50,000 | 13 (2.5%) | 4 (0.3%) |
| $50,000 to $99,999 | 0 (0.0%) | 0 (0.0%) |
| $100,000 to $299,999 | 94 (18.4%) | 251 (21.4%) |
| $300,000 to $499,999 | 249 (48.6%) | 672 (57.2%) |
| $500,000 to $749,999 | 113 (22.1%) | 228 (19.4%) |
| $750,000 to $999,999 | 43 (8.4%) | 9 (0.8%) |
| $1,000,000 or more | 0 (0.0%) | 10 (0.9%) |
| Total | 512 (100.0%) | 1,174 (100.0%) |
Household Income by Mortgage Status in Hidden Valley Lake
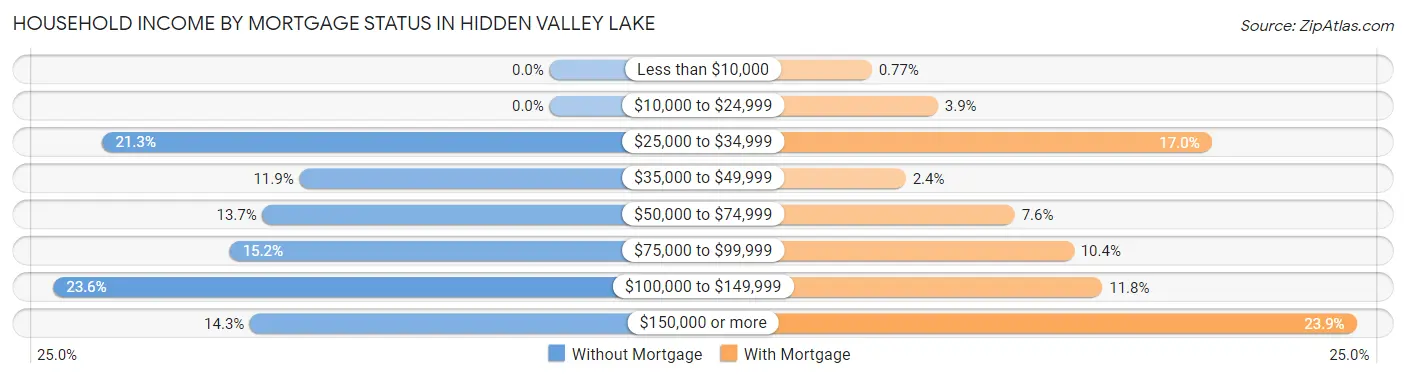
| Household Income | Without Mortgage | With Mortgage |
| Less than $10,000 | 0 (0.0%) | 9 (0.8%) |
| $10,000 to $24,999 | 0 (0.0%) | 46 (3.9%) |
| $25,000 to $34,999 | 109 (21.3%) | 199 (17.0%) |
| $35,000 to $49,999 | 61 (11.9%) | 28 (2.4%) |
| $50,000 to $74,999 | 70 (13.7%) | 89 (7.6%) |
| $75,000 to $99,999 | 78 (15.2%) | 122 (10.4%) |
| $100,000 to $149,999 | 121 (23.6%) | 138 (11.7%) |
| $150,000 or more | 73 (14.3%) | 280 (23.8%) |
| Total | 512 (100.0%) | 1,174 (100.0%) |
Property Value to Household Income Ratio in Hidden Valley Lake
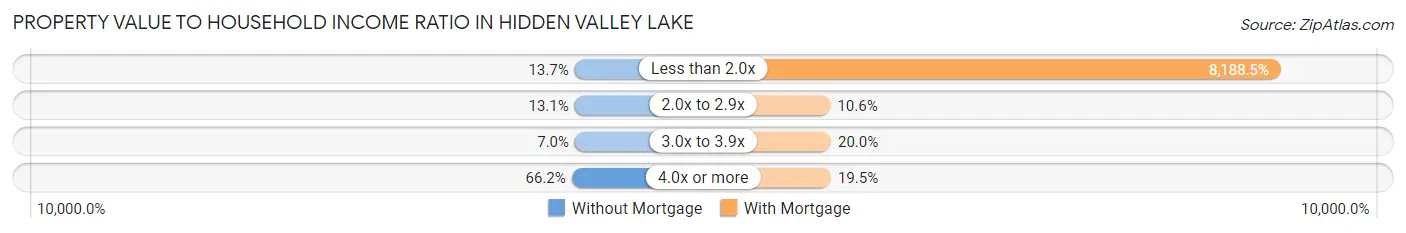
| Value-to-Income Ratio | Without Mortgage | With Mortgage |
| Less than 2.0x | 70 (13.7%) | 96,133 (8,188.5%) |
| 2.0x to 2.9x | 67 (13.1%) | 124 (10.6%) |
| 3.0x to 3.9x | 36 (7.0%) | 235 (20.0%) |
| 4.0x or more | 339 (66.2%) | 229 (19.5%) |
| Total | 512 (100.0%) | 1,174 (100.0%) |
Real Estate Taxes by Mortgage Status in Hidden Valley Lake
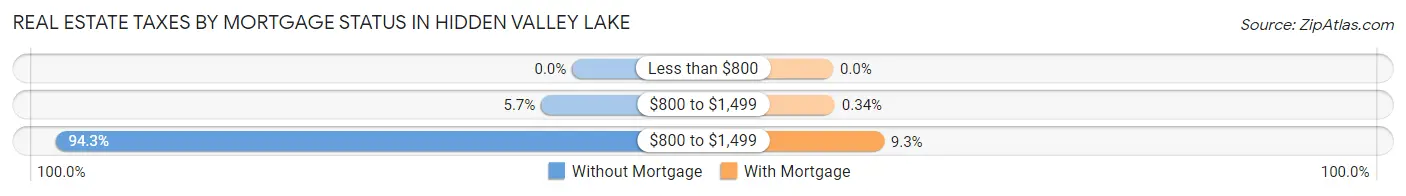
| Property Taxes | Without Mortgage | With Mortgage |
| Less than $800 | 0 (0.0%) | 0 (0.0%) |
| $800 to $1,499 | 29 (5.7%) | 4 (0.3%) |
| $800 to $1,499 | 483 (94.3%) | 109 (9.3%) |
| Total | 512 (100.0%) | 1,174 (100.0%) |
Health & Disability in Hidden Valley Lake
Health Insurance Coverage by Age in Hidden Valley Lake
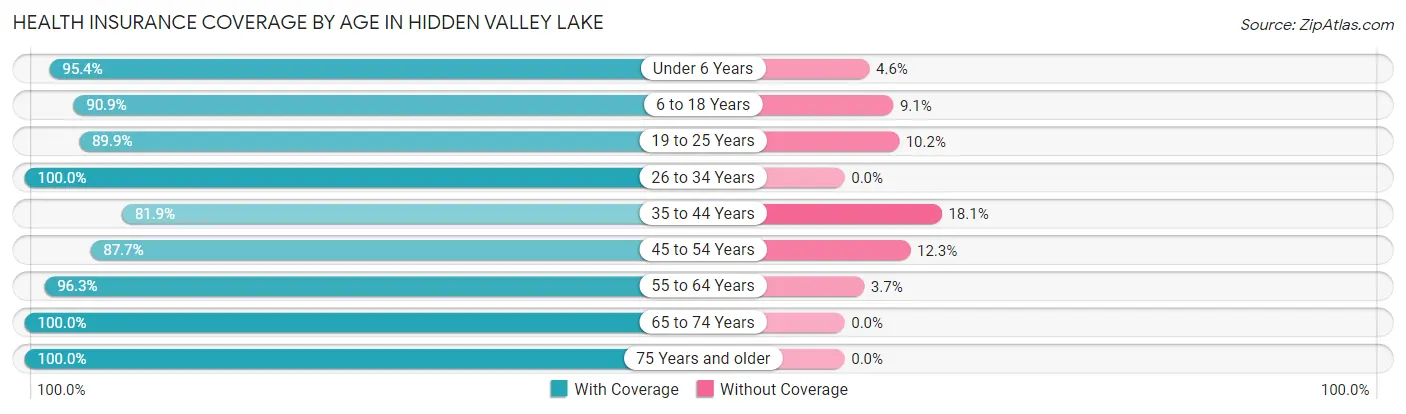
| Age Bracket | With Coverage | Without Coverage |
| Under 6 Years | 227 (95.4%) | 11 (4.6%) |
| 6 to 18 Years | 1,041 (90.9%) | 104 (9.1%) |
| 19 to 25 Years | 354 (89.8%) | 40 (10.2%) |
| 26 to 34 Years | 470 (100.0%) | 0 (0.0%) |
| 35 to 44 Years | 565 (81.9%) | 125 (18.1%) |
| 45 to 54 Years | 465 (87.7%) | 65 (12.3%) |
| 55 to 64 Years | 684 (96.3%) | 26 (3.7%) |
| 65 to 74 Years | 955 (100.0%) | 0 (0.0%) |
| 75 Years and older | 702 (100.0%) | 0 (0.0%) |
| Total | 5,463 (93.6%) | 371 (6.4%) |
Health Insurance Coverage by Citizenship Status in Hidden Valley Lake
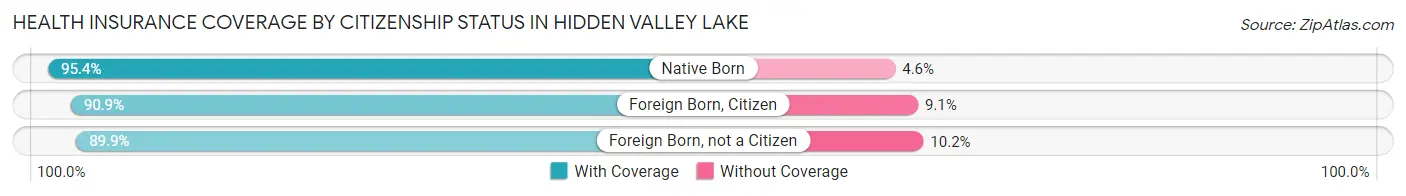
| Citizenship Status | With Coverage | Without Coverage |
| Native Born | 227 (95.4%) | 11 (4.6%) |
| Foreign Born, Citizen | 1,041 (90.9%) | 104 (9.1%) |
| Foreign Born, not a Citizen | 354 (89.8%) | 40 (10.2%) |
Health Insurance Coverage by Household Income in Hidden Valley Lake
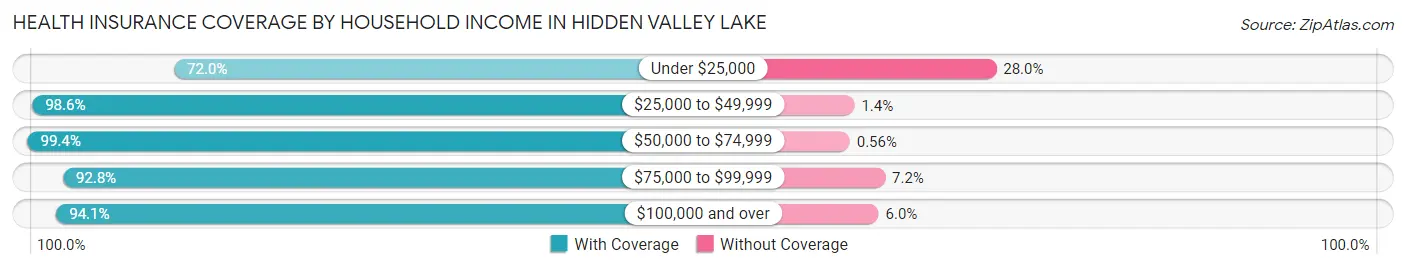
| Household Income | With Coverage | Without Coverage |
| Under $25,000 | 275 (72.0%) | 107 (28.0%) |
| $25,000 to $49,999 | 752 (98.6%) | 11 (1.4%) |
| $50,000 to $74,999 | 712 (99.4%) | 4 (0.6%) |
| $75,000 to $99,999 | 956 (92.8%) | 74 (7.2%) |
| $100,000 and over | 2,768 (94.1%) | 175 (5.9%) |
Public vs Private Health Insurance Coverage by Age in Hidden Valley Lake
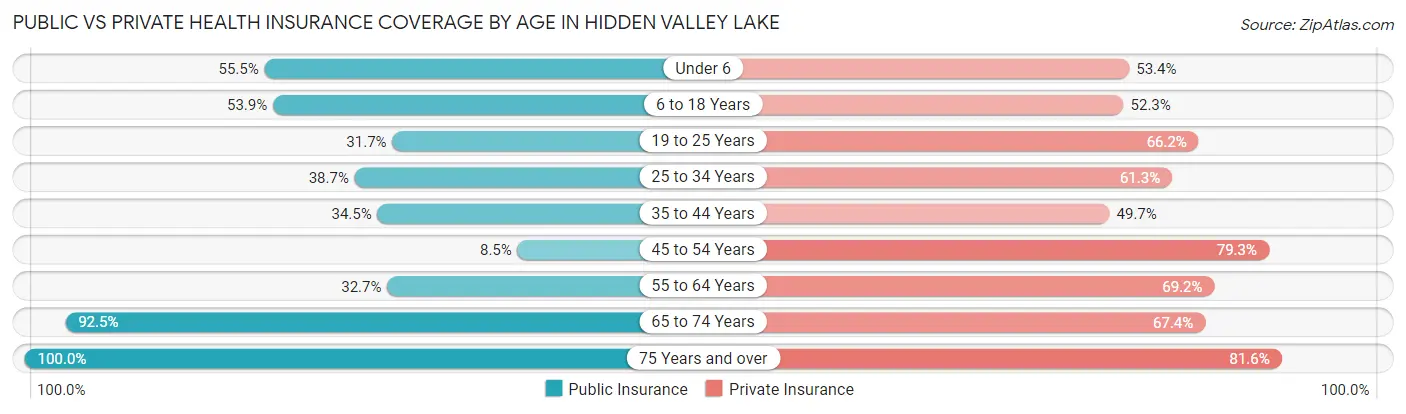
| Age Bracket | Public Insurance | Private Insurance |
| Under 6 | 132 (55.5%) | 127 (53.4%) |
| 6 to 18 Years | 617 (53.9%) | 599 (52.3%) |
| 19 to 25 Years | 125 (31.7%) | 261 (66.2%) |
| 25 to 34 Years | 182 (38.7%) | 288 (61.3%) |
| 35 to 44 Years | 238 (34.5%) | 343 (49.7%) |
| 45 to 54 Years | 45 (8.5%) | 420 (79.2%) |
| 55 to 64 Years | 232 (32.7%) | 491 (69.2%) |
| 65 to 74 Years | 883 (92.5%) | 644 (67.4%) |
| 75 Years and over | 702 (100.0%) | 573 (81.6%) |
| Total | 3,156 (54.1%) | 3,746 (64.2%) |
Disability Status by Sex by Age in Hidden Valley Lake
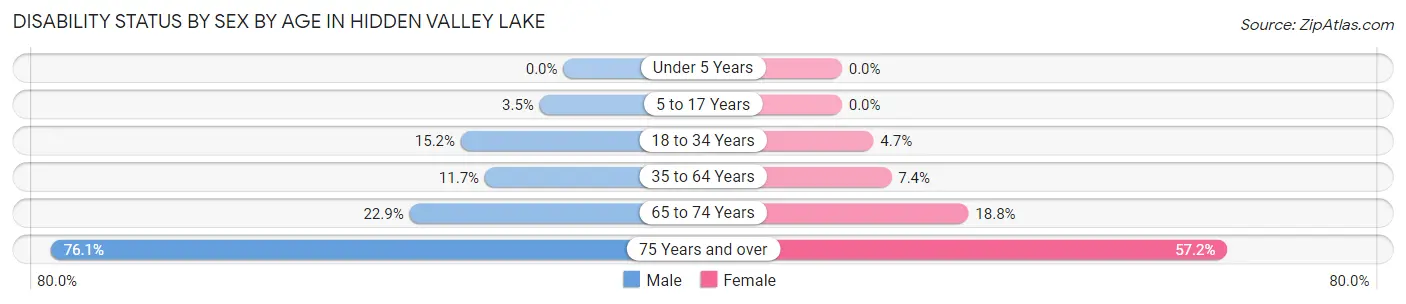
| Age Bracket | Male | Female |
| Under 5 Years | 0 (0.0%) | 0 (0.0%) |
| 5 to 17 Years | 27 (3.5%) | 0 (0.0%) |
| 18 to 34 Years | 77 (15.2%) | 18 (4.7%) |
| 35 to 64 Years | 98 (11.7%) | 80 (7.3%) |
| 65 to 74 Years | 93 (22.9%) | 103 (18.8%) |
| 75 Years and over | 271 (76.1%) | 198 (57.2%) |
Disability Class by Sex by Age in Hidden Valley Lake
Disability Class: Hearing Difficulty
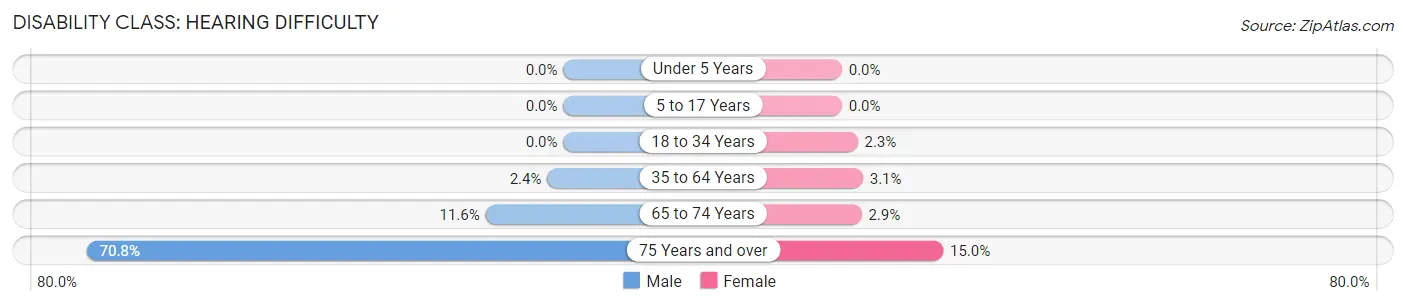
| Age Bracket | Male | Female |
| Under 5 Years | 0 (0.0%) | 0 (0.0%) |
| 5 to 17 Years | 0 (0.0%) | 0 (0.0%) |
| 18 to 34 Years | 0 (0.0%) | 9 (2.3%) |
| 35 to 64 Years | 20 (2.4%) | 34 (3.1%) |
| 65 to 74 Years | 47 (11.6%) | 16 (2.9%) |
| 75 Years and over | 252 (70.8%) | 52 (15.0%) |
Disability Class: Vision Difficulty
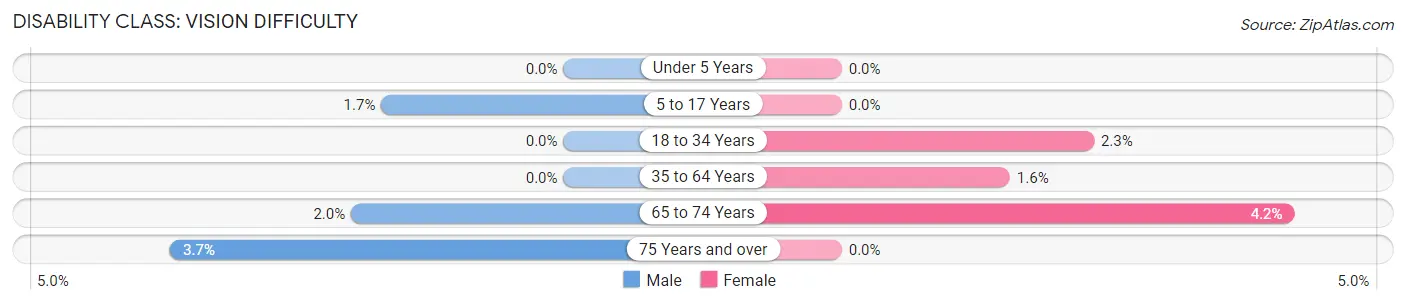
| Age Bracket | Male | Female |
| Under 5 Years | 0 (0.0%) | 0 (0.0%) |
| 5 to 17 Years | 13 (1.7%) | 0 (0.0%) |
| 18 to 34 Years | 0 (0.0%) | 9 (2.3%) |
| 35 to 64 Years | 0 (0.0%) | 17 (1.6%) |
| 65 to 74 Years | 8 (2.0%) | 23 (4.2%) |
| 75 Years and over | 13 (3.6%) | 0 (0.0%) |
Disability Class: Cognitive Difficulty
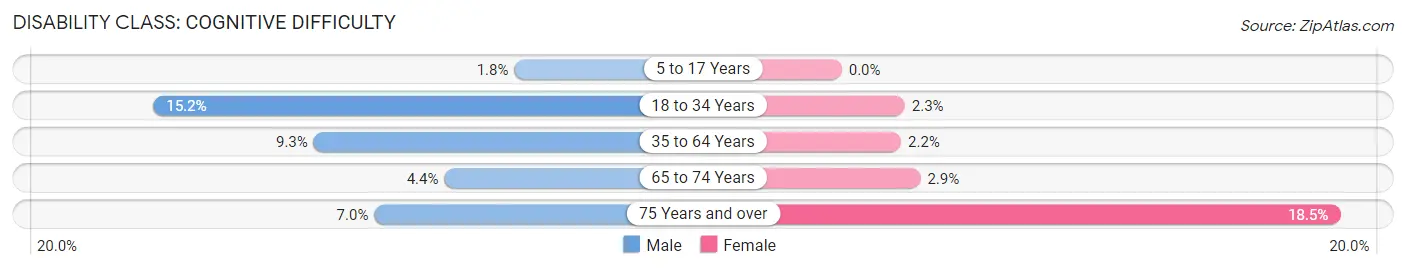
| Age Bracket | Male | Female |
| 5 to 17 Years | 14 (1.8%) | 0 (0.0%) |
| 18 to 34 Years | 77 (15.2%) | 9 (2.3%) |
| 35 to 64 Years | 78 (9.3%) | 24 (2.2%) |
| 65 to 74 Years | 18 (4.4%) | 16 (2.9%) |
| 75 Years and over | 25 (7.0%) | 64 (18.5%) |
Disability Class: Ambulatory Difficulty
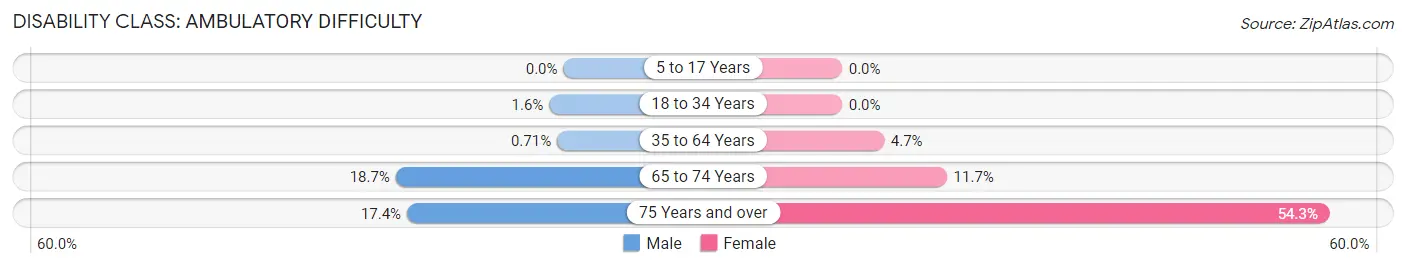
| Age Bracket | Male | Female |
| 5 to 17 Years | 0 (0.0%) | 0 (0.0%) |
| 18 to 34 Years | 8 (1.6%) | 0 (0.0%) |
| 35 to 64 Years | 6 (0.7%) | 51 (4.7%) |
| 65 to 74 Years | 76 (18.7%) | 64 (11.7%) |
| 75 Years and over | 62 (17.4%) | 188 (54.3%) |
Disability Class: Self-Care Difficulty
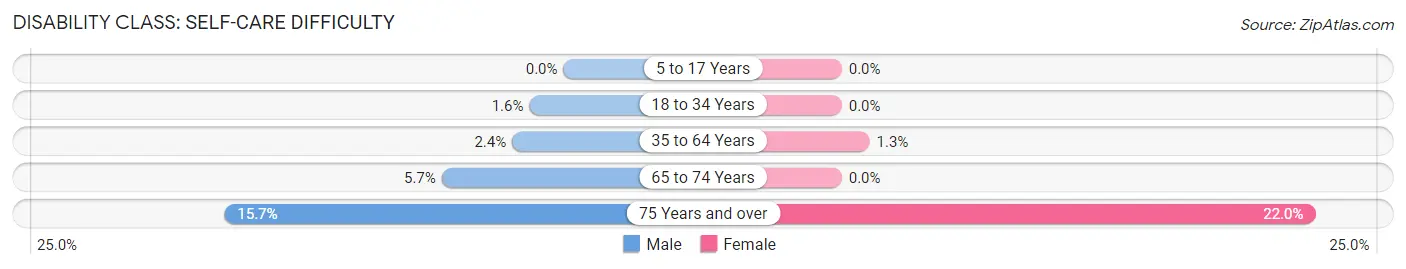
| Age Bracket | Male | Female |
| 5 to 17 Years | 0 (0.0%) | 0 (0.0%) |
| 18 to 34 Years | 8 (1.6%) | 0 (0.0%) |
| 35 to 64 Years | 20 (2.4%) | 14 (1.3%) |
| 65 to 74 Years | 23 (5.7%) | 0 (0.0%) |
| 75 Years and over | 56 (15.7%) | 76 (22.0%) |
Technology Access in Hidden Valley Lake
Computing Device Access in Hidden Valley Lake
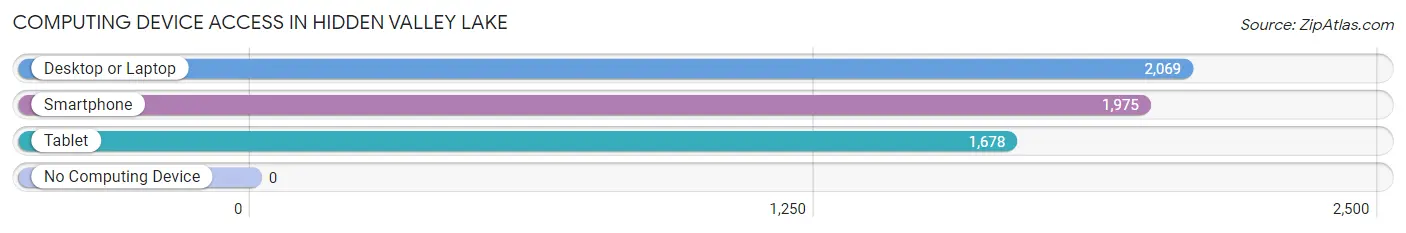
| Device Type | # Households | % Households |
| Desktop or Laptop | 2,069 | 93.7% |
| Smartphone | 1,975 | 89.4% |
| Tablet | 1,678 | 76.0% |
| No Computing Device | 0 | 0.0% |
| Total | 2,209 | 100.0% |
Internet Access in Hidden Valley Lake
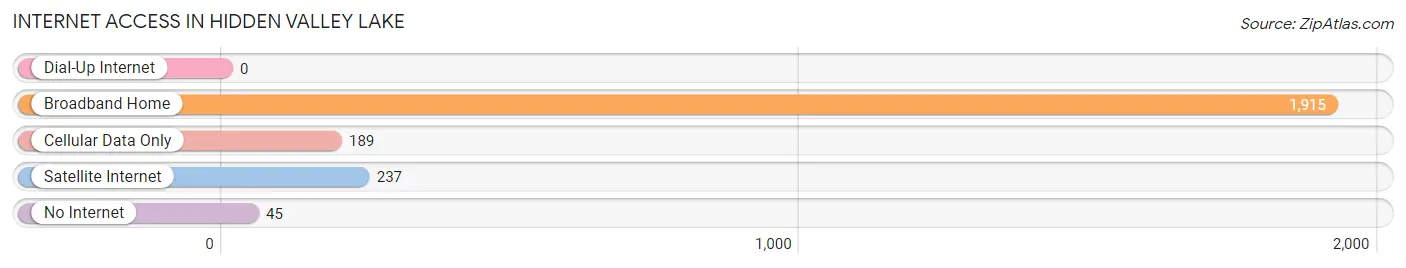
| Internet Type | # Households | % Households |
| Dial-Up Internet | 0 | 0.0% |
| Broadband Home | 1,915 | 86.7% |
| Cellular Data Only | 189 | 8.6% |
| Satellite Internet | 237 | 10.7% |
| No Internet | 45 | 2.0% |
| Total | 2,209 | 100.0% |
Hidden Valley Lake Summary
Valley Lake, California is a small, unincorporated community located in Lake County, California. It is situated in the foothills of the Mayacamas Mountains, approximately two miles east of the town of Middletown. The community is surrounded by the Clear Lake State Park and the Clear Lake National Wildlife Refuge. The population of the community was estimated to be 1,845 in 2020.
History
Valley Lake was originally inhabited by the Pomo Native Americans. The first settlers to the area were miners who arrived in the late 1800s. The area was known as “Hidden Valley” due to its remote location and the fact that it was hidden from view by the surrounding hills. The first post office was established in the area in 1891.
In the early 1900s, the area began to be developed as a resort community. The first resort was built in 1912 and was called the Hidden Valley Lake Resort. The resort was a popular destination for tourists and locals alike. The resort was eventually sold to the California State Parks in the 1950s and is now known as the Clear Lake State Park.
Geography
Valley Lake is located in the foothills of the Mayacamas Mountains in Lake County, California. The community is situated at an elevation of 1,845 feet above sea level. The area is surrounded by the Clear Lake State Park and the Clear Lake National Wildlife Refuge. The climate in the area is Mediterranean, with hot, dry summers and mild, wet winters.
Economy
The economy of Valley Lake is largely based on tourism. The area is home to several resorts, including the Clear Lake State Park, which is a popular destination for camping, fishing, and other outdoor activities. The area also has several wineries, restaurants, and shops.
Demographics
As of 2020, the population of Valley Lake was estimated to be 1,845. The racial makeup of the community was 88.3% White, 0.7% African American, 0.3% Native American, 0.2% Asian, 0.1% Pacific Islander, 8.2% from other races, and 2.4% from two or more races. The median household income in the area was $50,945.
Conclusion
Valley Lake, California is a small, unincorporated community located in Lake County, California. It is situated in the foothills of the Mayacamas Mountains, approximately two miles east of the town of Middletown. The population of the community was estimated to be 1,845 in 2020. The economy of Valley Lake is largely based on tourism, with several resorts, wineries, restaurants, and shops in the area. The racial makeup of the community was 88.3% White, 0.7% African American, 0.3% Native American, 0.2% Asian, 0.1% Pacific Islander, 8.2% from other races, and 2.4% from two or more races. The median household income in the area was $50,945.
Common Questions
What is Per Capita Income in Hidden Valley Lake?
Per Capita income in Hidden Valley Lake is $37,483.
What is the Median Family Income in Hidden Valley Lake?
Median Family Income in Hidden Valley Lake is $102,222.
What is the Median Household income in Hidden Valley Lake?
Median Household Income in Hidden Valley Lake is $82,673.
What is Income or Wage Gap in Hidden Valley Lake?
Income or Wage Gap in Hidden Valley Lake is 28.9%.
Women in Hidden Valley Lake earn 71.1 cents for every dollar earned by a man.
What is Inequality or Gini Index in Hidden Valley Lake?
Inequality or Gini Index in Hidden Valley Lake is 0.43.
What is the Total Population of Hidden Valley Lake?
Total Population of Hidden Valley Lake is 5,852.
What is the Total Male Population of Hidden Valley Lake?
Total Male Population of Hidden Valley Lake is 2,997.
What is the Total Female Population of Hidden Valley Lake?
Total Female Population of Hidden Valley Lake is 2,855.
What is the Ratio of Males per 100 Females in Hidden Valley Lake?
There are 104.97 Males per 100 Females in Hidden Valley Lake.
What is the Ratio of Females per 100 Males in Hidden Valley Lake?
There are 95.26 Females per 100 Males in Hidden Valley Lake.
What is the Median Population Age in Hidden Valley Lake?
Median Population Age in Hidden Valley Lake is 44.4 Years.
What is the Average Family Size in Hidden Valley Lake
Average Family Size in Hidden Valley Lake is 3.1 People.
What is the Average Household Size in Hidden Valley Lake
Average Household Size in Hidden Valley Lake is 2.6 People.
How Large is the Labor Force in Hidden Valley Lake?
There are 2,334 People in the Labor Forcein in Hidden Valley Lake.
What is the Percentage of People in the Labor Force in Hidden Valley Lake?
51.5% of People are in the Labor Force in Hidden Valley Lake.
What is the Unemployment Rate in Hidden Valley Lake?
Unemployment Rate in Hidden Valley Lake is 11.3%.