Fillmore, CA Map & Demographics
Fillmore Map
Fillmore Overview
$32,110
PER CAPITA INCOME
$88,608
AVG FAMILY INCOME
$85,255
AVG HOUSEHOLD INCOME
23.5%
WAGE / INCOME GAP [ % ]
76.5¢/ $1
WAGE / INCOME GAP [ $ ]
0.39
INEQUALITY / GINI INDEX
16,455
TOTAL POPULATION
8,042
MALE POPULATION
8,413
FEMALE POPULATION
95.59
MALES / 100 FEMALES
104.61
FEMALES / 100 MALES
35.0
MEDIAN AGE
3.7
AVG FAMILY SIZE
3.3
AVG HOUSEHOLD SIZE
8,366
LABOR FORCE [ PEOPLE ]
65.6%
PERCENT IN LABOR FORCE
3.8%
UNEMPLOYMENT RATE
Fillmore Zip Codes
Fillmore Area Codes
Income in Fillmore
Income Overview in Fillmore
Per Capita Income in Fillmore is $32,110, while median incomes of families and households are $88,608 and $85,255 respectively.
| Characteristic | Number | Measure |
| Per Capita Income | 16,455 | $32,110 |
| Median Family Income | 3,845 | $88,608 |
| Mean Family Income | 3,845 | $106,367 |
| Median Household Income | 4,982 | $85,255 |
| Mean Household Income | 4,982 | $99,659 |
| Income Deficit | 3,845 | $0 |
| Wage / Income Gap (%) | 16,455 | 23.50% |
| Wage / Income Gap ($) | 16,455 | 76.50¢ per $1 |
| Gini / Inequality Index | 16,455 | 0.39 |
Earnings by Sex in Fillmore
Average Earnings in Fillmore are $39,268, $46,798 for men and $35,802 for women, a difference of 23.5%.
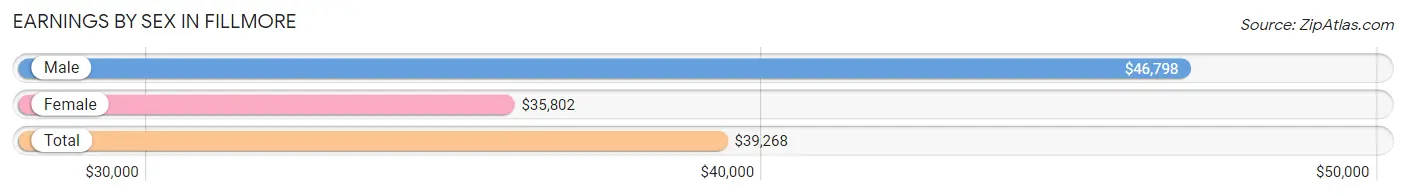
| Sex | Number | Average Earnings |
| Male | 4,458 (52.4%) | $46,798 |
| Female | 4,047 (47.6%) | $35,802 |
| Total | 8,505 (100.0%) | $39,268 |
Earnings by Sex by Income Bracket in Fillmore
The most common earnings brackets in Fillmore are $65,000 to $74,999 for men (517 | 11.6%) and $35,000 to $39,999 for women (387 | 9.6%).
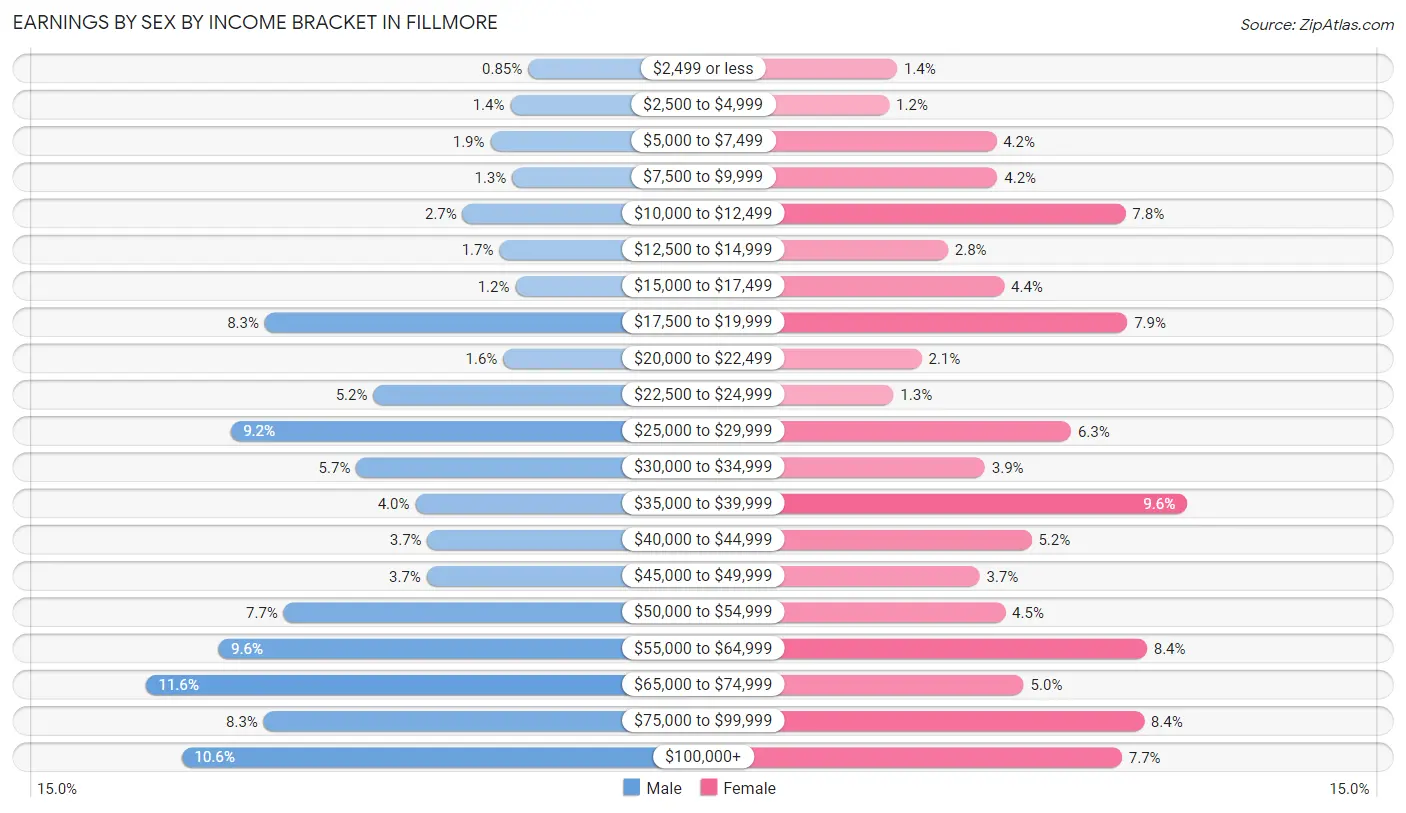
| Income | Male | Female |
| $2,499 or less | 38 (0.9%) | 57 (1.4%) |
| $2,500 to $4,999 | 60 (1.3%) | 48 (1.2%) |
| $5,000 to $7,499 | 85 (1.9%) | 170 (4.2%) |
| $7,500 to $9,999 | 58 (1.3%) | 171 (4.2%) |
| $10,000 to $12,499 | 120 (2.7%) | 317 (7.8%) |
| $12,500 to $14,999 | 74 (1.7%) | 115 (2.8%) |
| $15,000 to $17,499 | 54 (1.2%) | 179 (4.4%) |
| $17,500 to $19,999 | 368 (8.3%) | 319 (7.9%) |
| $20,000 to $22,499 | 69 (1.5%) | 85 (2.1%) |
| $22,500 to $24,999 | 232 (5.2%) | 53 (1.3%) |
| $25,000 to $29,999 | 411 (9.2%) | 255 (6.3%) |
| $30,000 to $34,999 | 253 (5.7%) | 157 (3.9%) |
| $35,000 to $39,999 | 179 (4.0%) | 387 (9.6%) |
| $40,000 to $44,999 | 164 (3.7%) | 210 (5.2%) |
| $45,000 to $49,999 | 165 (3.7%) | 151 (3.7%) |
| $50,000 to $54,999 | 344 (7.7%) | 180 (4.4%) |
| $55,000 to $64,999 | 426 (9.6%) | 341 (8.4%) |
| $65,000 to $74,999 | 517 (11.6%) | 201 (5.0%) |
| $75,000 to $99,999 | 369 (8.3%) | 338 (8.4%) |
| $100,000+ | 472 (10.6%) | 313 (7.7%) |
| Total | 4,458 (100.0%) | 4,047 (100.0%) |
Earnings by Sex by Educational Attainment in Fillmore
Average earnings in Fillmore are $51,989 for men and $39,202 for women, a difference of 24.6%. Men with an educational attainment of bachelor's degree enjoy the highest average annual earnings of $59,483, while those with less than high school education earn the least with $30,394. Women with an educational attainment of bachelor's degree earn the most with the average annual earnings of $76,512, while those with high school diploma education have the smallest earnings of $16,718.
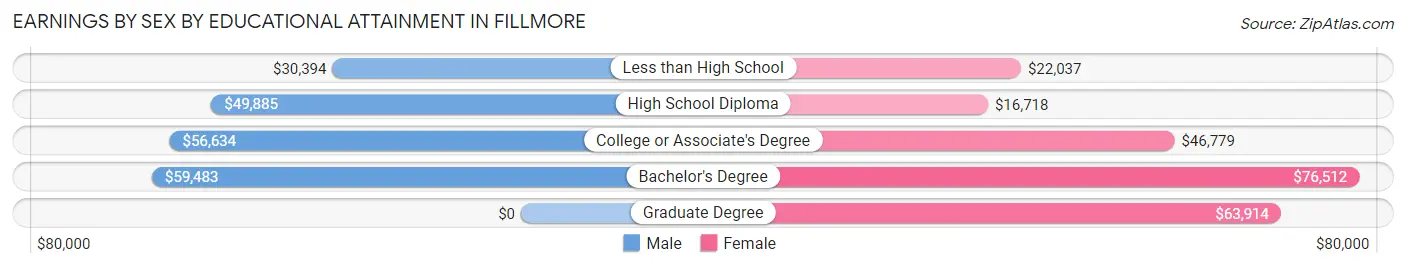
| Educational Attainment | Male Income | Female Income |
| Less than High School | $30,394 | $22,037 |
| High School Diploma | $49,885 | $16,718 |
| College or Associate's Degree | $56,634 | $46,779 |
| Bachelor's Degree | $59,483 | $76,512 |
| Graduate Degree | - | - |
| Total | $51,989 | $39,202 |
Family Income in Fillmore
Family Income Brackets in Fillmore
According to the Fillmore family income data, there are 854 families falling into the $50,000 to $74,999 income range, which is the most common income bracket and makes up 22.2% of all families.
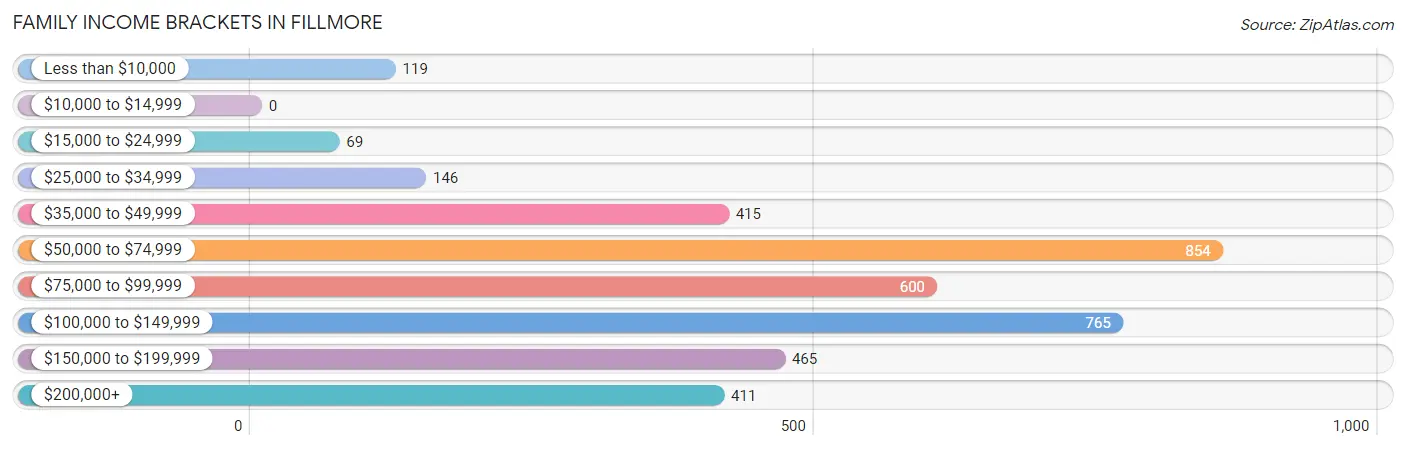
| Income Bracket | # Families | % Families |
| Less than $10,000 | 119 | 3.1% |
| $10,000 to $14,999 | 0 | 0.0% |
| $15,000 to $24,999 | 69 | 1.8% |
| $25,000 to $34,999 | 146 | 3.8% |
| $35,000 to $49,999 | 415 | 10.8% |
| $50,000 to $74,999 | 854 | 22.2% |
| $75,000 to $99,999 | 600 | 15.6% |
| $100,000 to $149,999 | 765 | 19.9% |
| $150,000 to $199,999 | 465 | 12.1% |
| $200,000+ | 411 | 10.7% |
Family Income by Famaliy Size in Fillmore
6-person families (227 | 5.9%) account for the highest median family income in Fillmore with $130,063 per family, while 2-person families (1,464 | 38.1%) have the highest median income of $35,934 per family member.
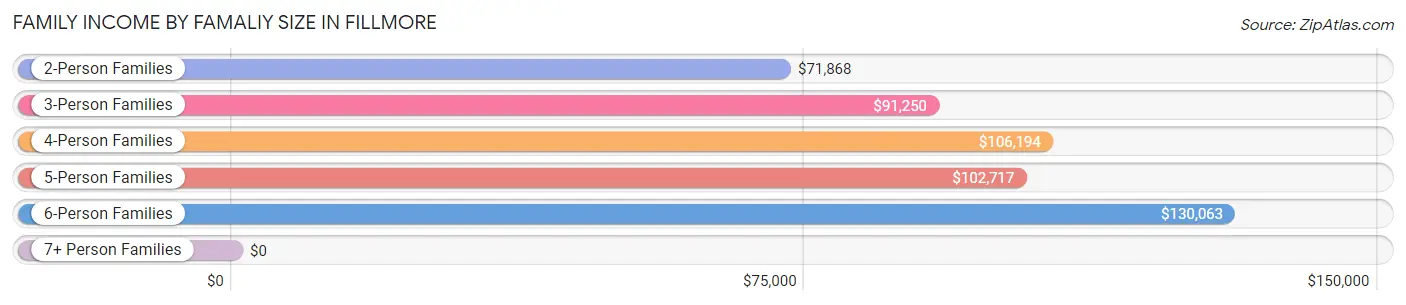
| Income Bracket | # Families | Median Income |
| 2-Person Families | 1,464 (38.1%) | $71,868 |
| 3-Person Families | 690 (17.9%) | $91,250 |
| 4-Person Families | 733 (19.1%) | $106,194 |
| 5-Person Families | 650 (16.9%) | $102,717 |
| 6-Person Families | 227 (5.9%) | $130,063 |
| 7+ Person Families | 81 (2.1%) | $0 |
| Total | 3,845 (100.0%) | $88,608 |
Family Income by Number of Earners in Fillmore
The median family income in Fillmore is $88,608, with families comprising 3+ earners (724) having the highest median family income of $109,440, while families with no earners (212) have the lowest median family income of $51,833, accounting for 18.8% and 5.5% of families, respectively.
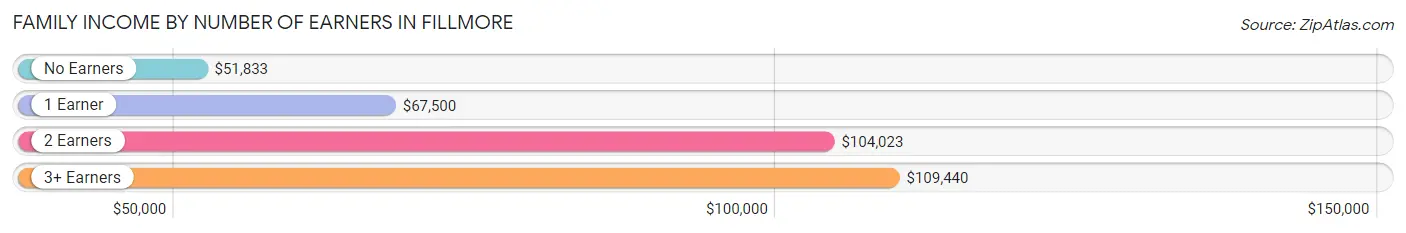
| Number of Earners | # Families | Median Income |
| No Earners | 212 (5.5%) | $51,833 |
| 1 Earner | 1,176 (30.6%) | $67,500 |
| 2 Earners | 1,733 (45.1%) | $104,023 |
| 3+ Earners | 724 (18.8%) | $109,440 |
| Total | 3,845 (100.0%) | $88,608 |
Household Income in Fillmore
Household Income Brackets in Fillmore
With 957 households falling in the category, the $50,000 to $74,999 income range is the most frequent in Fillmore, accounting for 19.2% of all households. In contrast, only 100 households (2.0%) fall into the less than $10,000 income bracket, making it the least populous group.
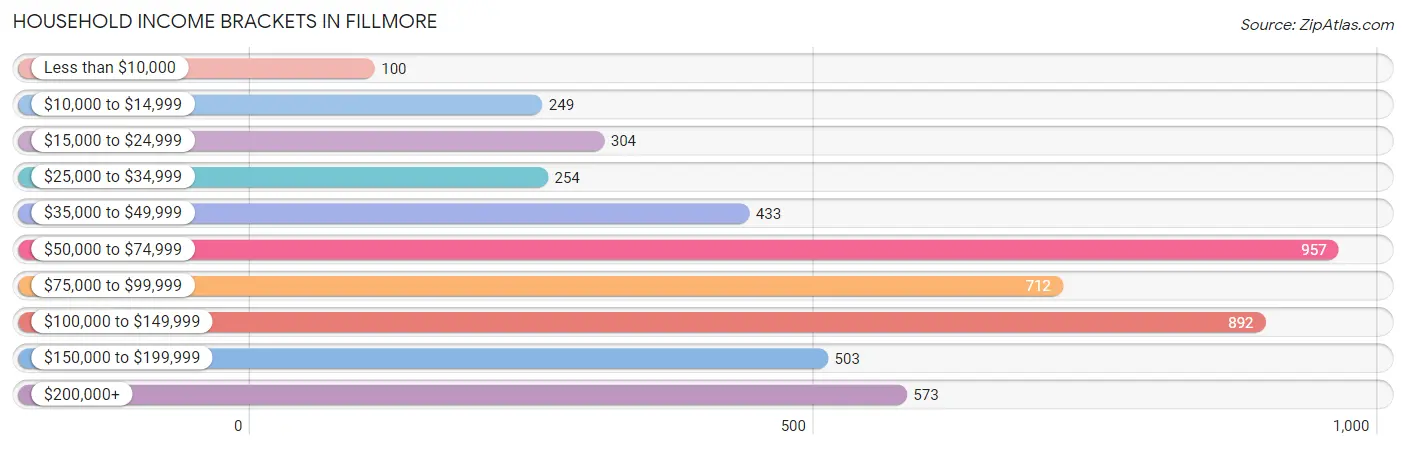
| Income Bracket | # Households | % Households |
| Less than $10,000 | 100 | 2.0% |
| $10,000 to $14,999 | 249 | 5.0% |
| $15,000 to $24,999 | 304 | 6.1% |
| $25,000 to $34,999 | 254 | 5.1% |
| $35,000 to $49,999 | 433 | 8.7% |
| $50,000 to $74,999 | 957 | 19.2% |
| $75,000 to $99,999 | 712 | 14.3% |
| $100,000 to $149,999 | 892 | 17.9% |
| $150,000 to $199,999 | 503 | 10.1% |
| $200,000+ | 573 | 11.5% |
Household Income by Householder Age in Fillmore
The median household income in Fillmore is $85,255, with the highest median household income of $87,952 found in the 25 to 44 years age bracket for the primary householder. A total of 1,920 households (38.5%) fall into this category. Meanwhile, the 15 to 24 years age bracket for the primary householder has the lowest median household income of $0, with 31 households (0.6%) in this group.
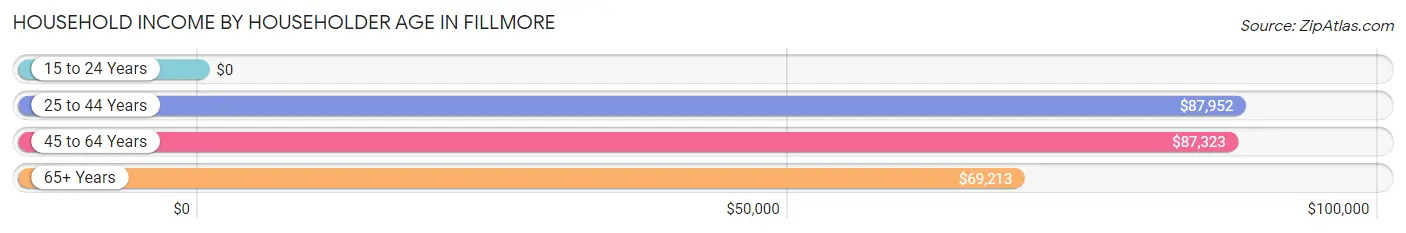
| Income Bracket | # Households | Median Income |
| 15 to 24 Years | 31 (0.6%) | $0 |
| 25 to 44 Years | 1,920 (38.5%) | $87,952 |
| 45 to 64 Years | 1,877 (37.7%) | $87,323 |
| 65+ Years | 1,154 (23.2%) | $69,213 |
| Total | 4,982 (100.0%) | $85,255 |
Poverty in Fillmore
Income Below Poverty by Sex and Age in Fillmore
With 5.3% poverty level for males and 8.1% for females among the residents of Fillmore, 16 and 17 year old males and 6 to 11 year old females are the most vulnerable to poverty, with 35 males (22.0%) and 148 females (19.2%) in their respective age groups living below the poverty level.
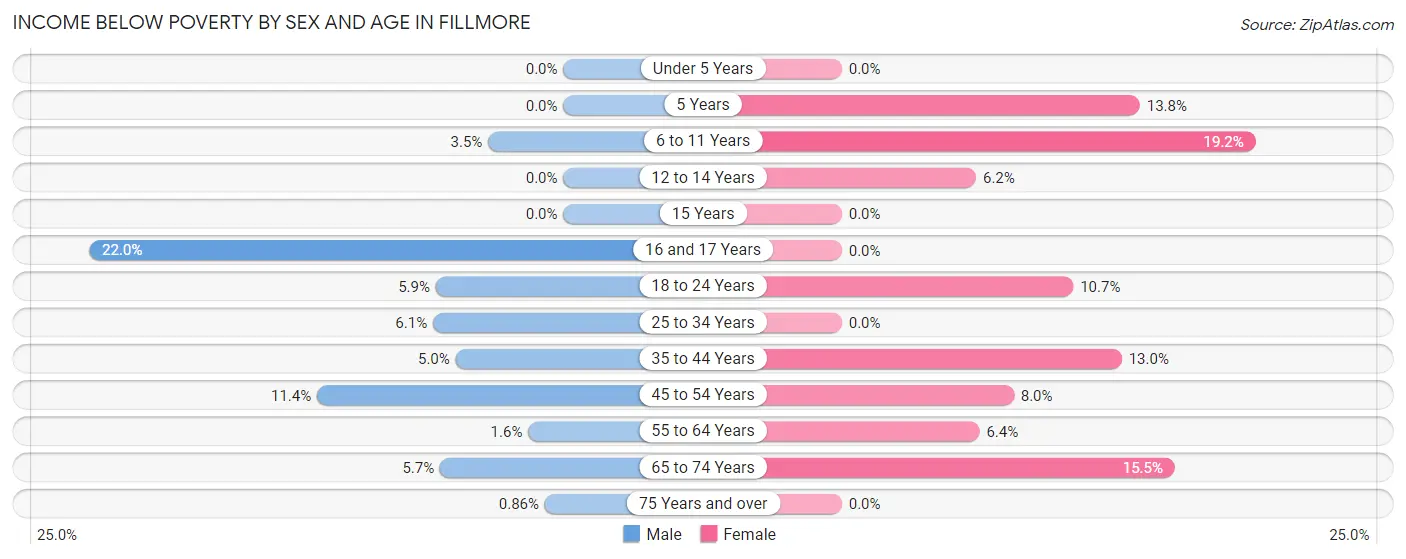
| Age Bracket | Male | Female |
| Under 5 Years | 0 (0.0%) | 0 (0.0%) |
| 5 Years | 0 (0.0%) | 13 (13.8%) |
| 6 to 11 Years | 22 (3.5%) | 148 (19.2%) |
| 12 to 14 Years | 0 (0.0%) | 39 (6.2%) |
| 15 Years | 0 (0.0%) | 0 (0.0%) |
| 16 and 17 Years | 35 (22.0%) | 0 (0.0%) |
| 18 to 24 Years | 56 (5.9%) | 89 (10.7%) |
| 25 to 34 Years | 71 (6.0%) | 0 (0.0%) |
| 35 to 44 Years | 58 (5.0%) | 182 (13.0%) |
| 45 to 54 Years | 139 (11.4%) | 82 (8.0%) |
| 55 to 64 Years | 10 (1.6%) | 47 (6.4%) |
| 65 to 74 Years | 33 (5.7%) | 76 (15.4%) |
| 75 Years and over | 4 (0.9%) | 0 (0.0%) |
| Total | 428 (5.3%) | 676 (8.1%) |
Income Above Poverty by Sex and Age in Fillmore
According to the poverty statistics in Fillmore, males aged under 5 years and females aged under 5 years are the age groups that are most secure financially, with 100.0% of males and 100.0% of females in these age groups living above the poverty line.
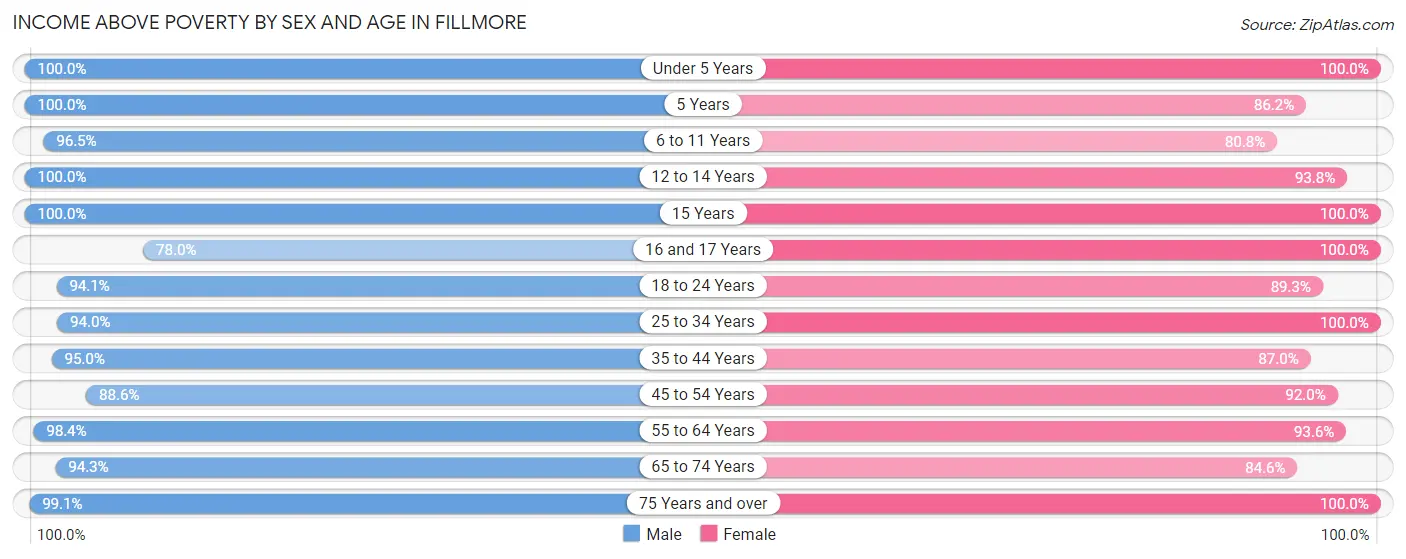
| Age Bracket | Male | Female |
| Under 5 Years | 280 (100.0%) | 333 (100.0%) |
| 5 Years | 180 (100.0%) | 81 (86.2%) |
| 6 to 11 Years | 608 (96.5%) | 623 (80.8%) |
| 12 to 14 Years | 458 (100.0%) | 587 (93.8%) |
| 15 Years | 132 (100.0%) | 144 (100.0%) |
| 16 and 17 Years | 124 (78.0%) | 253 (100.0%) |
| 18 to 24 Years | 890 (94.1%) | 740 (89.3%) |
| 25 to 34 Years | 1,103 (94.0%) | 1,179 (100.0%) |
| 35 to 44 Years | 1,101 (95.0%) | 1,219 (87.0%) |
| 45 to 54 Years | 1,077 (88.6%) | 945 (92.0%) |
| 55 to 64 Years | 605 (98.4%) | 688 (93.6%) |
| 65 to 74 Years | 544 (94.3%) | 416 (84.6%) |
| 75 Years and over | 463 (99.1%) | 438 (100.0%) |
| Total | 7,565 (94.7%) | 7,646 (91.9%) |
Income Below Poverty Among Married-Couple Families in Fillmore
The poverty statistics for married-couple families in Fillmore show that 4.0% or 105 of the total 2,647 families live below the poverty line. Families with 3 or 4 children have the highest poverty rate of 14.3%, comprising of 44 families. On the other hand, families with 5 or more children have the lowest poverty rate of 0.0%, which includes 0 families.
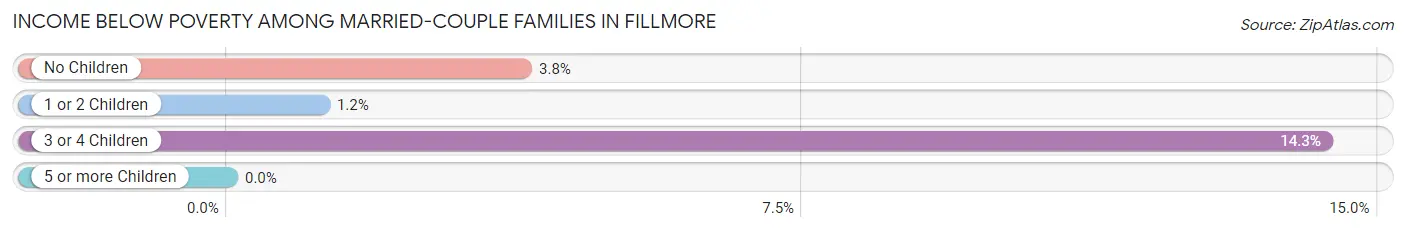
| Children | Above Poverty | Below Poverty |
| No Children | 1,201 (96.2%) | 48 (3.8%) |
| 1 or 2 Children | 1,068 (98.8%) | 13 (1.2%) |
| 3 or 4 Children | 264 (85.7%) | 44 (14.3%) |
| 5 or more Children | 9 (100.0%) | 0 (0.0%) |
| Total | 2,542 (96.0%) | 105 (4.0%) |
Income Below Poverty Among Single-Parent Households in Fillmore
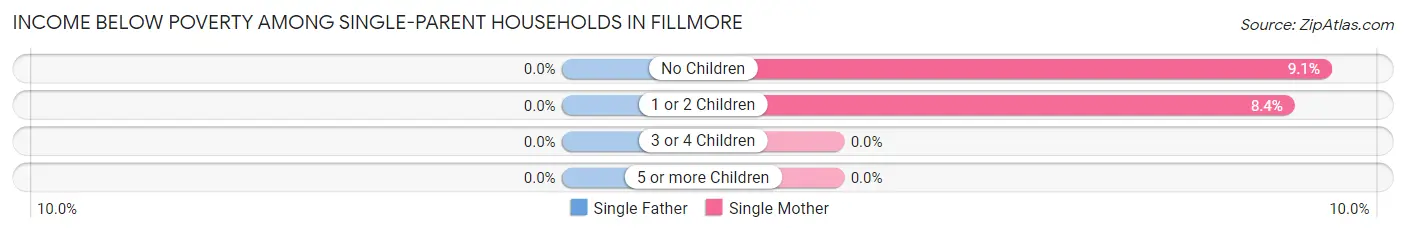
| Children | Single Father | Single Mother |
| No Children | 0 (0.0%) | 27 (9.1%) |
| 1 or 2 Children | 0 (0.0%) | 34 (8.4%) |
| 3 or 4 Children | 0 (0.0%) | 0 (0.0%) |
| 5 or more Children | 0 (0.0%) | 0 (0.0%) |
| Total | 0 (0.0%) | 61 (7.6%) |
Income Below Poverty Among Married-Couple vs Single-Parent Households in Fillmore
The poverty data for Fillmore shows that 105 of the married-couple family households (4.0%) and 61 of the single-parent households (5.1%) are living below the poverty level. Within the married-couple family households, those with 3 or 4 children have the highest poverty rate, with 44 households (14.3%) falling below the poverty line. Among the single-parent households, those with 1 or 2 children have the highest poverty rate, with 34 household (6.7%) living below poverty.
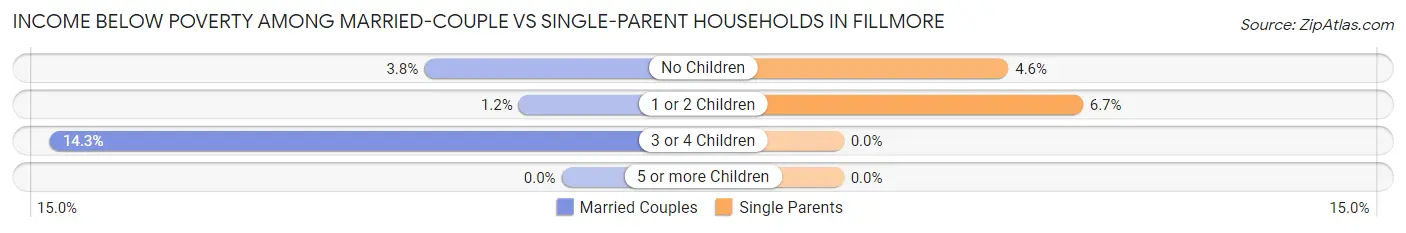
| Children | Married-Couple Families | Single-Parent Households |
| No Children | 48 (3.8%) | 27 (4.6%) |
| 1 or 2 Children | 13 (1.2%) | 34 (6.7%) |
| 3 or 4 Children | 44 (14.3%) | 0 (0.0%) |
| 5 or more Children | 0 (0.0%) | 0 (0.0%) |
| Total | 105 (4.0%) | 61 (5.1%) |
Race in Fillmore
The most populous races in Fillmore are Hispanic or Latino (11,734 | 71.3%), White / Caucasian (10,440 | 63.4%), and Two or more Races (3,264 | 19.8%).
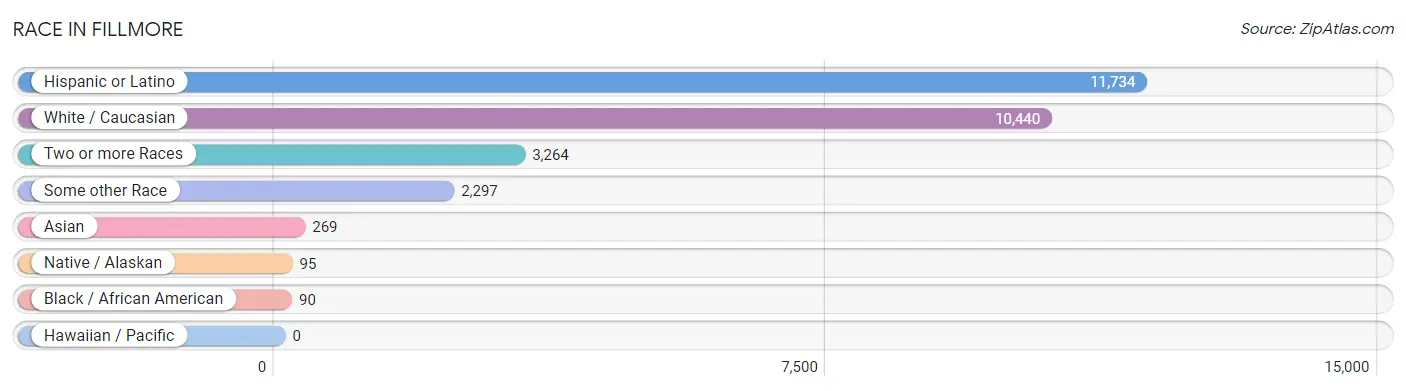
| Race | # Population | % Population |
| Asian | 269 | 1.6% |
| Black / African American | 90 | 0.5% |
| Hawaiian / Pacific | 0 | 0.0% |
| Hispanic or Latino | 11,734 | 71.3% |
| Native / Alaskan | 95 | 0.6% |
| White / Caucasian | 10,440 | 63.4% |
| Two or more Races | 3,264 | 19.8% |
| Some other Race | 2,297 | 14.0% |
| Total | 16,455 | 100.0% |
Ancestry in Fillmore
The most populous ancestries reported in Fillmore are Mexican (10,993 | 66.8%), English (1,150 | 7.0%), Irish (829 | 5.0%), American (798 | 4.9%), and German (510 | 3.1%), together accounting for 86.8% of all Fillmore residents.
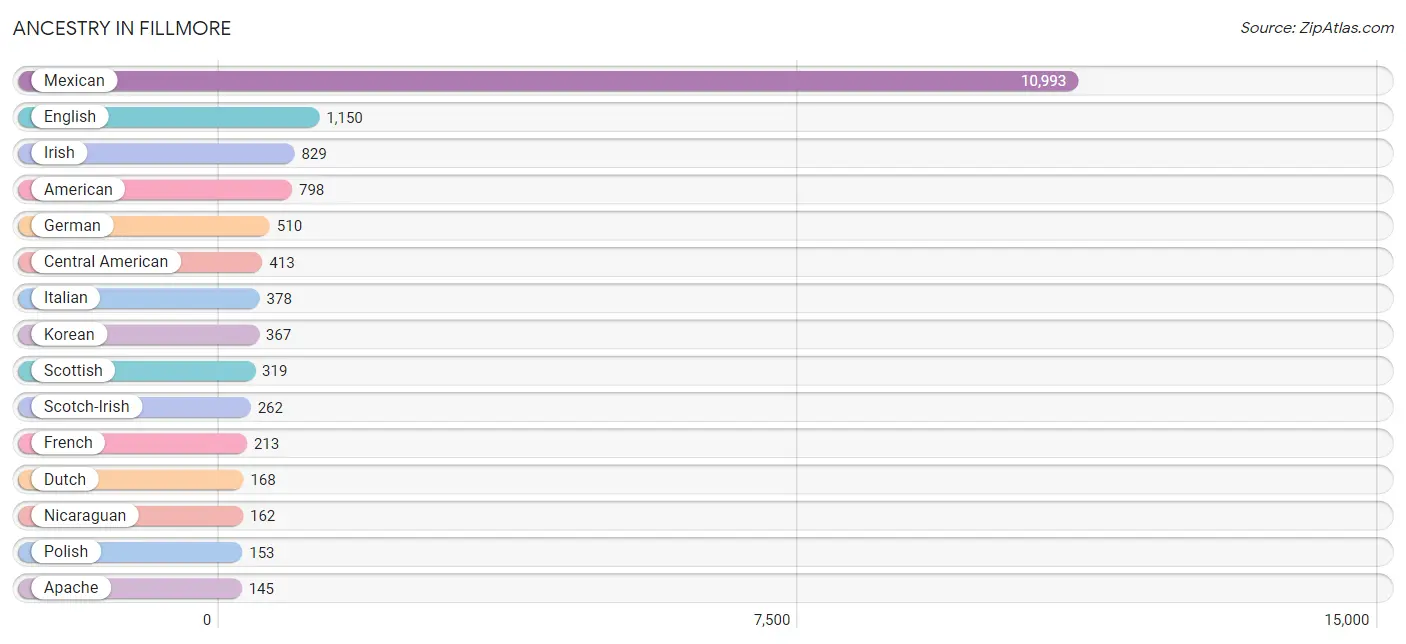
| Ancestry | # Population | % Population |
| African | 28 | 0.2% |
| American | 798 | 4.9% |
| Apache | 145 | 0.9% |
| Arab | 42 | 0.3% |
| Armenian | 14 | 0.1% |
| Australian | 11 | 0.1% |
| Bhutanese | 101 | 0.6% |
| British | 129 | 0.8% |
| Burmese | 56 | 0.3% |
| Central American | 413 | 2.5% |
| Central American Indian | 38 | 0.2% |
| Cherokee | 122 | 0.7% |
| Chilean | 32 | 0.2% |
| Choctaw | 5 | 0.0% |
| Costa Rican | 12 | 0.1% |
| Cuban | 53 | 0.3% |
| Czech | 65 | 0.4% |
| Danish | 126 | 0.8% |
| Dutch | 168 | 1.0% |
| Eastern European | 13 | 0.1% |
| Ecuadorian | 24 | 0.2% |
| English | 1,150 | 7.0% |
| European | 129 | 0.8% |
| French | 213 | 1.3% |
| German | 510 | 3.1% |
| Greek | 5 | 0.0% |
| Guatemalan | 102 | 0.6% |
| Hungarian | 9 | 0.1% |
| Indian (Asian) | 34 | 0.2% |
| Irish | 829 | 5.0% |
| Italian | 378 | 2.3% |
| Japanese | 36 | 0.2% |
| Korean | 367 | 2.2% |
| Laotian | 126 | 0.8% |
| Mexican | 10,993 | 66.8% |
| Mexican American Indian | 37 | 0.2% |
| Moroccan | 28 | 0.2% |
| Native Hawaiian | 24 | 0.2% |
| Navajo | 36 | 0.2% |
| Nicaraguan | 162 | 1.0% |
| Northern European | 106 | 0.6% |
| Norwegian | 30 | 0.2% |
| Polish | 153 | 0.9% |
| Portuguese | 42 | 0.3% |
| Romanian | 9 | 0.1% |
| Salvadoran | 137 | 0.8% |
| Samoan | 34 | 0.2% |
| Scandinavian | 78 | 0.5% |
| Scotch-Irish | 262 | 1.6% |
| Scottish | 319 | 1.9% |
| South American | 72 | 0.4% |
| South American Indian | 38 | 0.2% |
| Spaniard | 71 | 0.4% |
| Spanish | 22 | 0.1% |
| Sri Lankan | 51 | 0.3% |
| Subsaharan African | 28 | 0.2% |
| Swedish | 61 | 0.4% |
| Ukrainian | 100 | 0.6% |
| Venezuelan | 16 | 0.1% |
| Welsh | 34 | 0.2% | View All 60 Rows |
Immigrants in Fillmore
The most numerous immigrant groups reported in Fillmore came from Latin America (2,946 | 17.9%), Central America (2,845 | 17.3%), Mexico (2,636 | 16.0%), Asia (146 | 0.9%), and Nicaragua (104 | 0.6%), together accounting for 52.7% of all Fillmore residents.
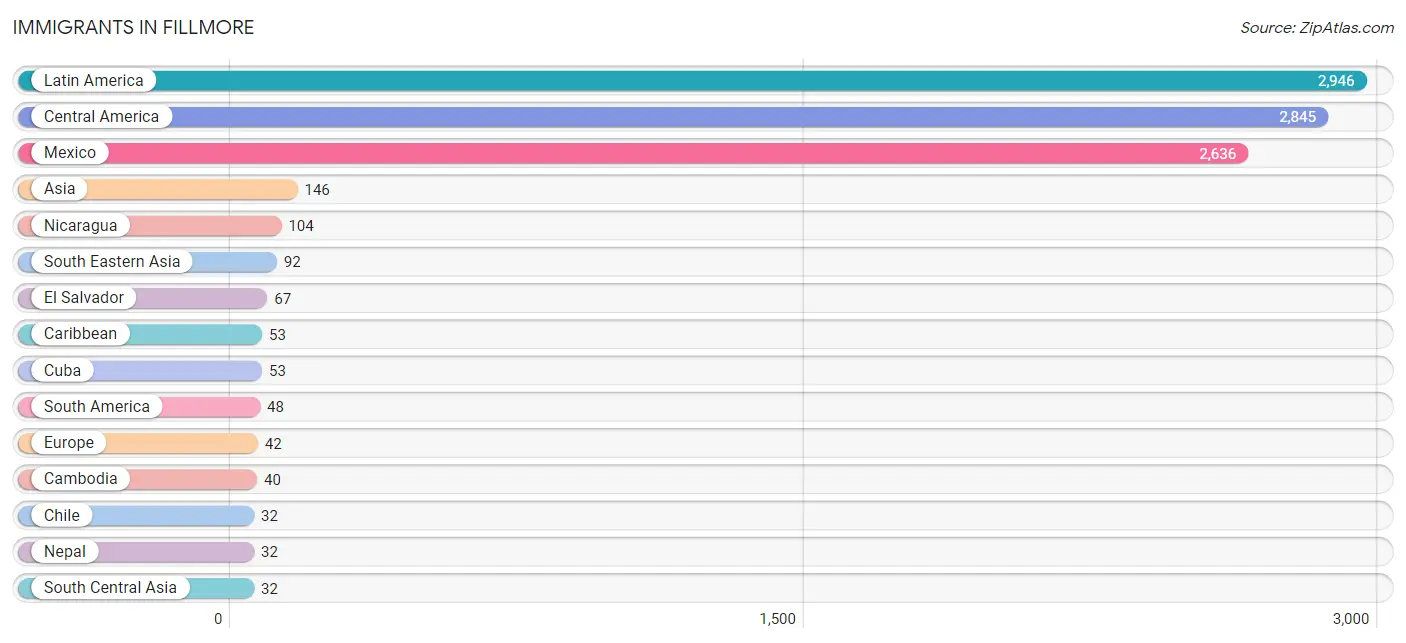
| Immigration Origin | # Population | % Population |
| Africa | 28 | 0.2% |
| Asia | 146 | 0.9% |
| Cambodia | 40 | 0.2% |
| Caribbean | 53 | 0.3% |
| Central America | 2,845 | 17.3% |
| Chile | 32 | 0.2% |
| Costa Rica | 12 | 0.1% |
| Cuba | 53 | 0.3% |
| Eastern Asia | 22 | 0.1% |
| El Salvador | 67 | 0.4% |
| England | 12 | 0.1% |
| Europe | 42 | 0.3% |
| Guatemala | 26 | 0.2% |
| Korea | 22 | 0.1% |
| Laos | 17 | 0.1% |
| Latin America | 2,946 | 17.9% |
| Mexico | 2,636 | 16.0% |
| Morocco | 28 | 0.2% |
| Nepal | 32 | 0.2% |
| Netherlands | 18 | 0.1% |
| Nicaragua | 104 | 0.6% |
| Northern Africa | 28 | 0.2% |
| Northern Europe | 24 | 0.2% |
| Philippines | 24 | 0.2% |
| Scotland | 12 | 0.1% |
| South America | 48 | 0.3% |
| South Central Asia | 32 | 0.2% |
| South Eastern Asia | 92 | 0.6% |
| Venezuela | 16 | 0.1% |
| Vietnam | 11 | 0.1% |
| Western Europe | 18 | 0.1% | View All 31 Rows |
Sex and Age in Fillmore
Sex and Age in Fillmore
The most populous age groups in Fillmore are 20 to 24 Years (778 | 9.7%) for men and 10 to 14 Years (1,030 | 12.2%) for women.
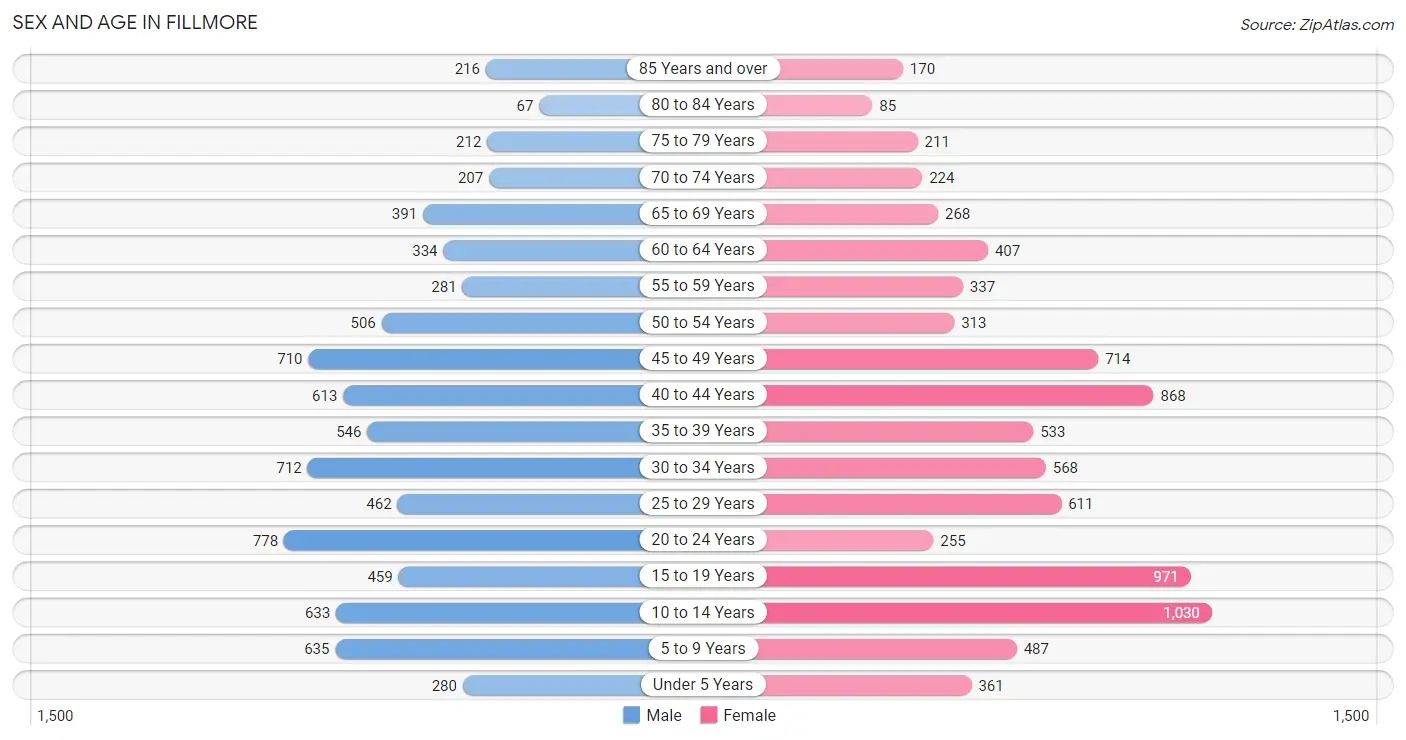
| Age Bracket | Male | Female |
| Under 5 Years | 280 (3.5%) | 361 (4.3%) |
| 5 to 9 Years | 635 (7.9%) | 487 (5.8%) |
| 10 to 14 Years | 633 (7.9%) | 1,030 (12.2%) |
| 15 to 19 Years | 459 (5.7%) | 971 (11.5%) |
| 20 to 24 Years | 778 (9.7%) | 255 (3.0%) |
| 25 to 29 Years | 462 (5.7%) | 611 (7.3%) |
| 30 to 34 Years | 712 (8.8%) | 568 (6.8%) |
| 35 to 39 Years | 546 (6.8%) | 533 (6.3%) |
| 40 to 44 Years | 613 (7.6%) | 868 (10.3%) |
| 45 to 49 Years | 710 (8.8%) | 714 (8.5%) |
| 50 to 54 Years | 506 (6.3%) | 313 (3.7%) |
| 55 to 59 Years | 281 (3.5%) | 337 (4.0%) |
| 60 to 64 Years | 334 (4.2%) | 407 (4.8%) |
| 65 to 69 Years | 391 (4.9%) | 268 (3.2%) |
| 70 to 74 Years | 207 (2.6%) | 224 (2.7%) |
| 75 to 79 Years | 212 (2.6%) | 211 (2.5%) |
| 80 to 84 Years | 67 (0.8%) | 85 (1.0%) |
| 85 Years and over | 216 (2.7%) | 170 (2.0%) |
| Total | 8,042 (100.0%) | 8,413 (100.0%) |
Families and Households in Fillmore
Median Family Size in Fillmore
The median family size in Fillmore is 3.73 persons per family, with single female/mother families (804 | 20.9%) accounting for the largest median family size of 4.17 persons per family. On the other hand, single male/father families (394 | 10.2%) represent the smallest median family size with 3.20 persons per family.
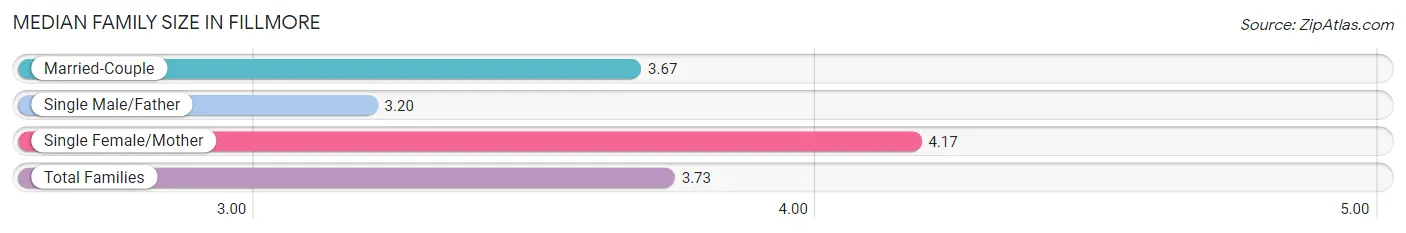
| Family Type | # Families | Family Size |
| Married-Couple | 2,647 (68.8%) | 3.67 |
| Single Male/Father | 394 (10.2%) | 3.20 |
| Single Female/Mother | 804 (20.9%) | 4.17 |
| Total Families | 3,845 (100.0%) | 3.73 |
Median Household Size in Fillmore
The median household size in Fillmore is 3.26 persons per household, with single female/mother households (804 | 16.1%) accounting for the largest median household size of 4.43 persons per household. non-family households (1,137 | 22.8%) represent the smallest median household size with 1.32 persons per household.
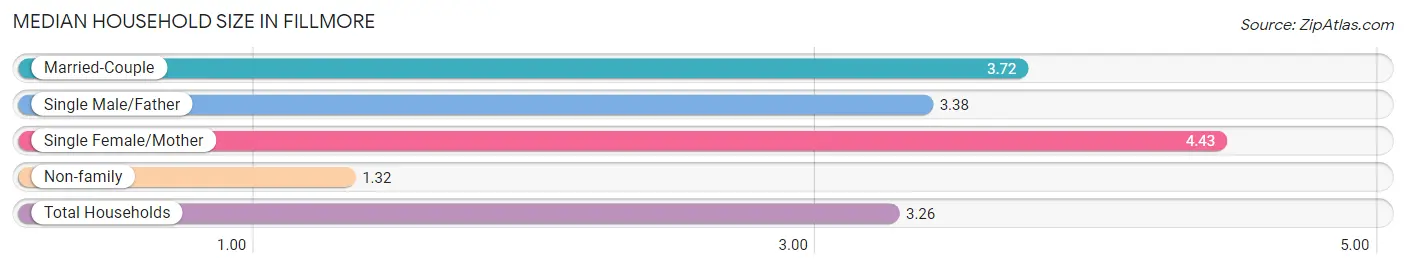
| Household Type | # Households | Household Size |
| Married-Couple | 2,647 (53.1%) | 3.72 |
| Single Male/Father | 394 (7.9%) | 3.38 |
| Single Female/Mother | 804 (16.1%) | 4.43 |
| Non-family | 1,137 (22.8%) | 1.32 |
| Total Households | 4,982 (100.0%) | 3.26 |
Household Size by Marriage Status in Fillmore
Out of a total of 4,982 households in Fillmore, 3,845 (77.2%) are family households, while 1,137 (22.8%) are nonfamily households. The most numerous type of family households are 2-person households, comprising 1,394, and the most common type of nonfamily households are 1-person households, comprising 849.
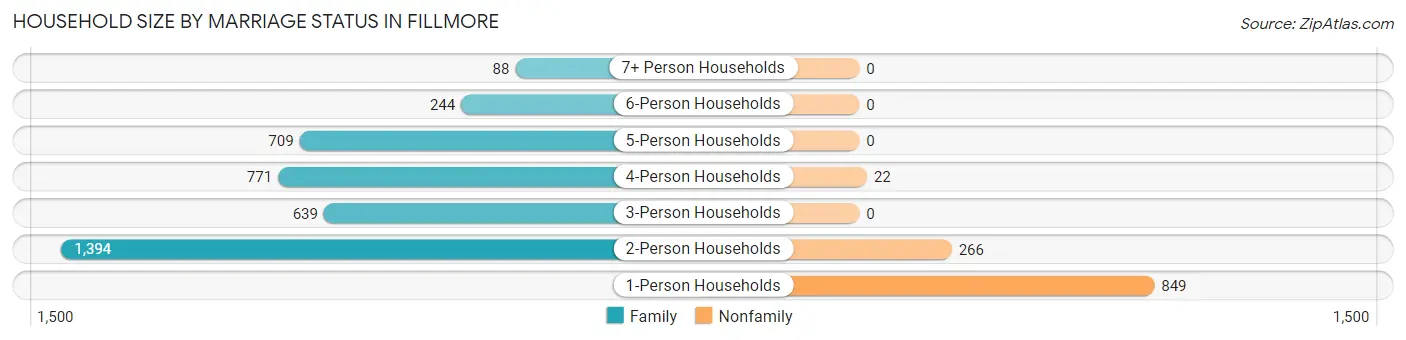
| Household Size | Family Households | Nonfamily Households |
| 1-Person Households | - | 849 (17.0%) |
| 2-Person Households | 1,394 (28.0%) | 266 (5.3%) |
| 3-Person Households | 639 (12.8%) | 0 (0.0%) |
| 4-Person Households | 771 (15.5%) | 22 (0.4%) |
| 5-Person Households | 709 (14.2%) | 0 (0.0%) |
| 6-Person Households | 244 (4.9%) | 0 (0.0%) |
| 7+ Person Households | 88 (1.8%) | 0 (0.0%) |
| Total | 3,845 (77.2%) | 1,137 (22.8%) |
Female Fertility in Fillmore
Fertility by Age in Fillmore
Average fertility rate in Fillmore is 62.0 births per 1,000 women. Women in the age bracket of 35 to 50 years have the highest fertility rate with 90.0 births per 1,000 women. Women in the age bracket of 35 to 50 years acount for 68.8% of all women with births.
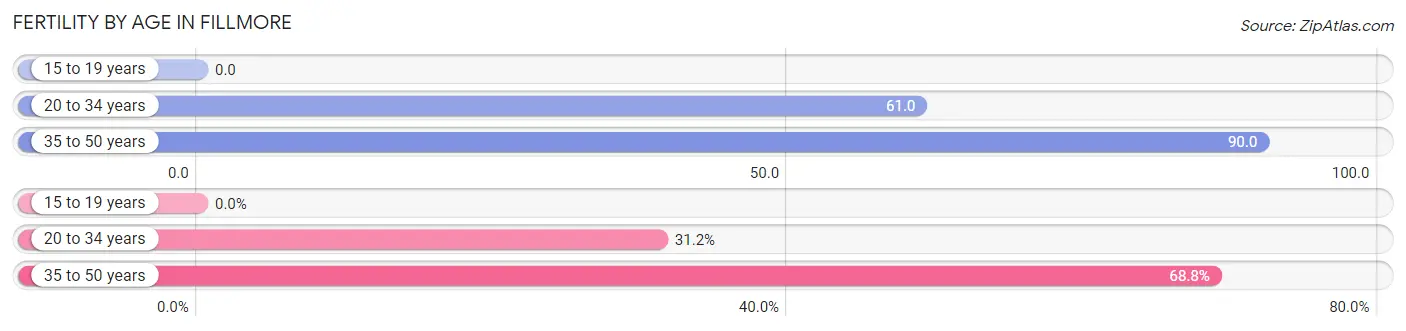
| Age Bracket | Women with Births | Births / 1,000 Women |
| 15 to 19 years | 0 (0.0%) | 0.0 |
| 20 to 34 years | 88 (31.2%) | 61.0 |
| 35 to 50 years | 194 (68.8%) | 90.0 |
| Total | 282 (100.0%) | 62.0 |
Fertility by Age by Marriage Status in Fillmore
98.2% of women with births (282) in Fillmore are married. The highest percentage of unmarried women with births falls into 20 to 34 years age bracket with 5.7% of them unmarried at the time of birth, while the lowest percentage of unmarried women with births belong to 35 to 50 years age bracket with 0.0% of them unmarried.
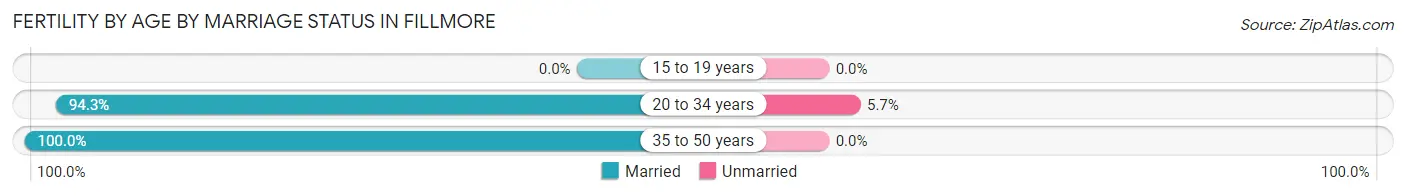
| Age Bracket | Married | Unmarried |
| 15 to 19 years | 0 (0.0%) | 0 (0.0%) |
| 20 to 34 years | 83 (94.3%) | 5 (5.7%) |
| 35 to 50 years | 194 (100.0%) | 0 (0.0%) |
| Total | 277 (98.2%) | 5 (1.8%) |
Fertility by Education in Fillmore
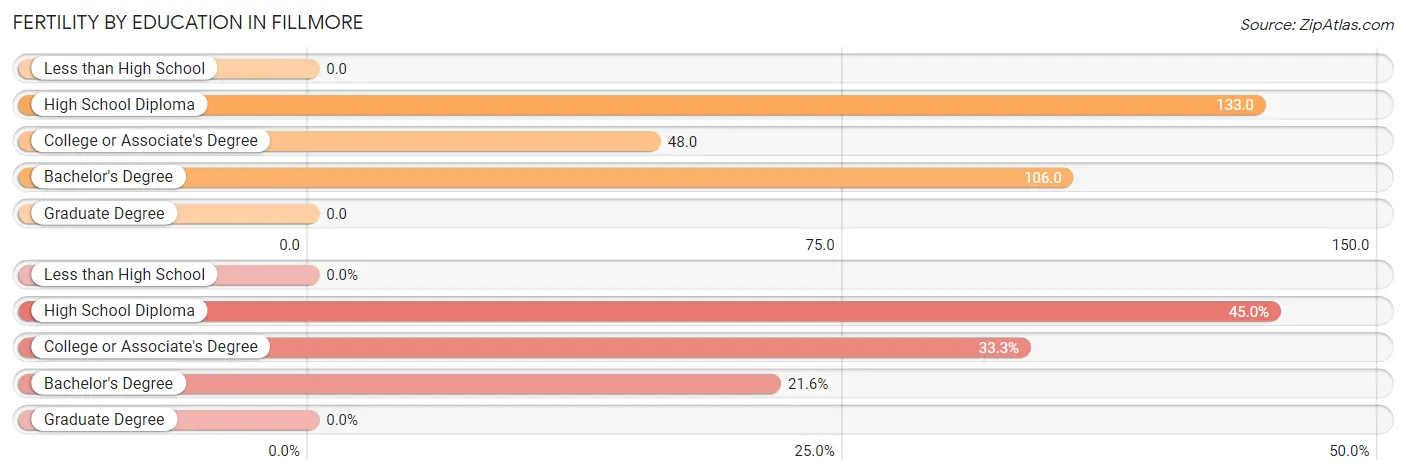
| Educational Attainment | Women with Births | Births / 1,000 Women |
| Less than High School | 0 (0.0%) | 0.0 |
| High School Diploma | 127 (45.0%) | 133.0 |
| College or Associate's Degree | 94 (33.3%) | 48.0 |
| Bachelor's Degree | 61 (21.6%) | 106.0 |
| Graduate Degree | 0 (0.0%) | 0.0 |
| Total | 282 (100.0%) | 62.0 |
Fertility by Education by Marriage Status in Fillmore
1.8% of women with births in Fillmore are unmarried. Women with the educational attainment of college or associate's degree are most likely to be married with 100.0% of them married at childbirth, while women with the educational attainment of high school diploma are least likely to be married with 3.9% of them unmarried at childbirth.
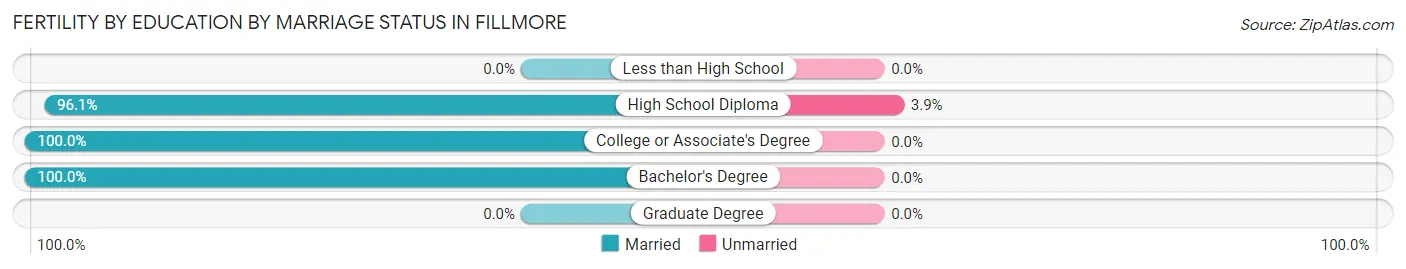
| Educational Attainment | Married | Unmarried |
| Less than High School | 0 (0.0%) | 0 (0.0%) |
| High School Diploma | 122 (96.1%) | 5 (3.9%) |
| College or Associate's Degree | 94 (100.0%) | 0 (0.0%) |
| Bachelor's Degree | 61 (100.0%) | 0 (0.0%) |
| Graduate Degree | 0 (0.0%) | 0 (0.0%) |
| Total | 277 (98.2%) | 5 (1.8%) |
Employment Characteristics in Fillmore
Employment by Class of Employer in Fillmore
Among the 7,979 employed individuals in Fillmore, private company employees (5,548 | 69.5%), local government employees (888 | 11.1%), and self-employed (not incorporated) (545 | 6.8%) make up the most common classes of employment.
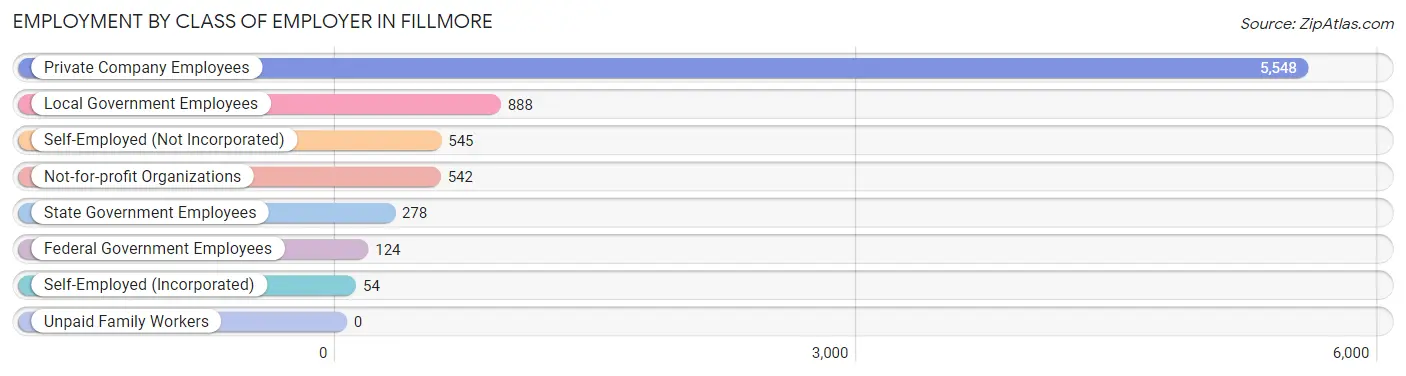
| Employer Class | # Employees | % Employees |
| Private Company Employees | 5,548 | 69.5% |
| Self-Employed (Incorporated) | 54 | 0.7% |
| Self-Employed (Not Incorporated) | 545 | 6.8% |
| Not-for-profit Organizations | 542 | 6.8% |
| Local Government Employees | 888 | 11.1% |
| State Government Employees | 278 | 3.5% |
| Federal Government Employees | 124 | 1.5% |
| Unpaid Family Workers | 0 | 0.0% |
| Total | 7,979 | 100.0% |
Employment Status by Age in Fillmore
According to the labor force statistics for Fillmore, out of the total population over 16 years of age (12,753), 65.6% or 8,366 individuals are in the labor force, with 3.8% or 318 of them unemployed. The age group with the highest labor force participation rate is 30 to 34 years, with 92.0% or 1,178 individuals in the labor force. Within the labor force, the 20 to 24 years age range has the highest percentage of unemployed individuals, with 11.5% or 93 of them being unemployed.
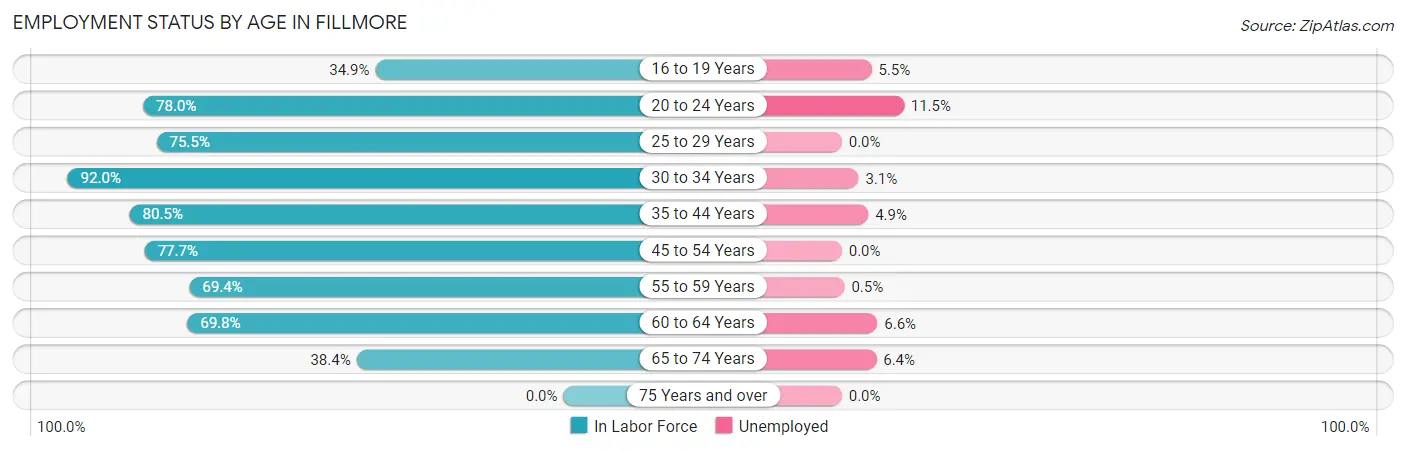
| Age Bracket | In Labor Force | Unemployed |
| 16 to 19 Years | 403 (34.9%) | 22 (5.5%) |
| 20 to 24 Years | 806 (78.0%) | 93 (11.5%) |
| 25 to 29 Years | 810 (75.5%) | 0 (0.0%) |
| 30 to 34 Years | 1,178 (92.0%) | 37 (3.1%) |
| 35 to 44 Years | 2,061 (80.5%) | 101 (4.9%) |
| 45 to 54 Years | 1,743 (77.7%) | 0 (0.0%) |
| 55 to 59 Years | 429 (69.4%) | 2 (0.5%) |
| 60 to 64 Years | 517 (69.8%) | 34 (6.6%) |
| 65 to 74 Years | 419 (38.4%) | 27 (6.4%) |
| 75 Years and over | 0 (0.0%) | 0 (0.0%) |
| Total | 8,366 (65.6%) | 318 (3.8%) |
Employment Status by Educational Attainment in Fillmore
According to labor force statistics for Fillmore, 79.1% of individuals (6,735) out of the total population between 25 and 64 years of age (8,515) are in the labor force, with 2.6% or 175 of them being unemployed. The group with the highest labor force participation rate are those with the educational attainment of bachelor's degree or higher, with 91.7% or 1,448 individuals in the labor force. Within the labor force, individuals with less than high school education have the highest percentage of unemployment, with 7.7% or 99 of them being unemployed.
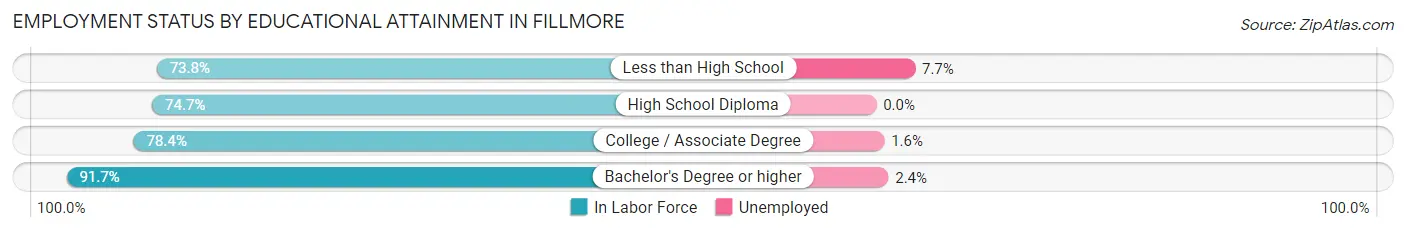
| Educational Attainment | In Labor Force | Unemployed |
| Less than High School | 1,285 (73.8%) | 134 (7.7%) |
| High School Diploma | 1,431 (74.7%) | 0 (0.0%) |
| College / Associate Degree | 2,572 (78.4%) | 52 (1.6%) |
| Bachelor's Degree or higher | 1,448 (91.7%) | 38 (2.4%) |
| Total | 6,735 (79.1%) | 221 (2.6%) |
Employment Occupations by Sex in Fillmore
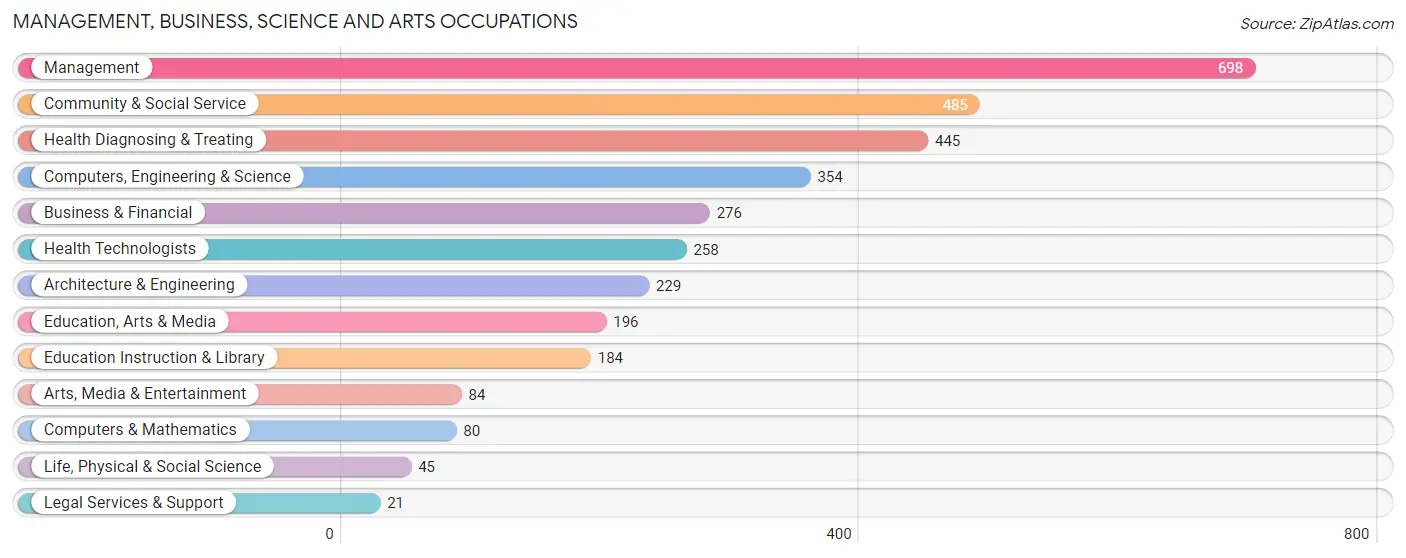
Management, Business, Science and Arts Occupations
The most common Management, Business, Science and Arts occupations in Fillmore are Management (698 | 8.7%), Community & Social Service (485 | 6.0%), Health Diagnosing & Treating (445 | 5.5%), Computers, Engineering & Science (354 | 4.4%), and Business & Financial (276 | 3.4%).
Management, Business, Science and Arts Occupations by Sex
Within the Management, Business, Science and Arts occupations in Fillmore, the most male-oriented occupations are Computers & Mathematics (100.0%), Legal Services & Support (100.0%), and Management (63.3%), while the most female-oriented occupations are Life, Physical & Social Science (100.0%), Health Technologists (100.0%), and Health Diagnosing & Treating (98.4%).
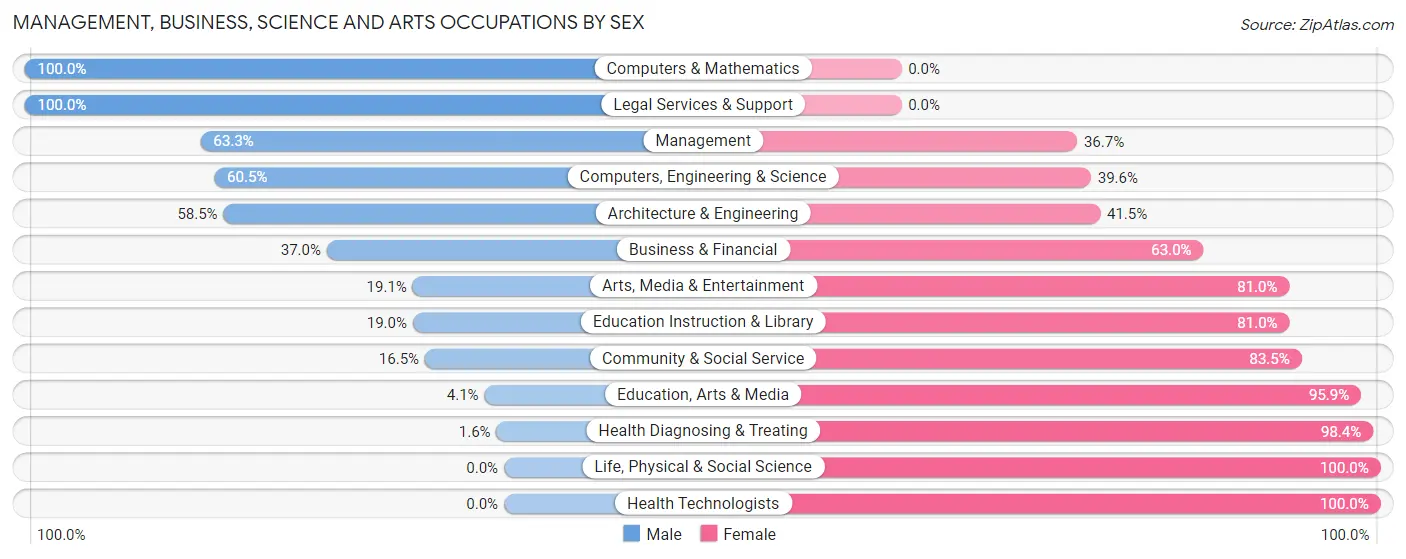
| Occupation | Male | Female |
| Management | 442 (63.3%) | 256 (36.7%) |
| Business & Financial | 102 (37.0%) | 174 (63.0%) |
| Computers, Engineering & Science | 214 (60.5%) | 140 (39.6%) |
| Computers & Mathematics | 80 (100.0%) | 0 (0.0%) |
| Architecture & Engineering | 134 (58.5%) | 95 (41.5%) |
| Life, Physical & Social Science | 0 (0.0%) | 45 (100.0%) |
| Community & Social Service | 80 (16.5%) | 405 (83.5%) |
| Education, Arts & Media | 8 (4.1%) | 188 (95.9%) |
| Legal Services & Support | 21 (100.0%) | 0 (0.0%) |
| Education Instruction & Library | 35 (19.0%) | 149 (81.0%) |
| Arts, Media & Entertainment | 16 (19.1%) | 68 (80.9%) |
| Health Diagnosing & Treating | 7 (1.6%) | 438 (98.4%) |
| Health Technologists | 0 (0.0%) | 258 (100.0%) |
| Total (Category) | 845 (37.4%) | 1,413 (62.6%) |
| Total (Overall) | 4,253 (53.0%) | 3,773 (47.0%) |
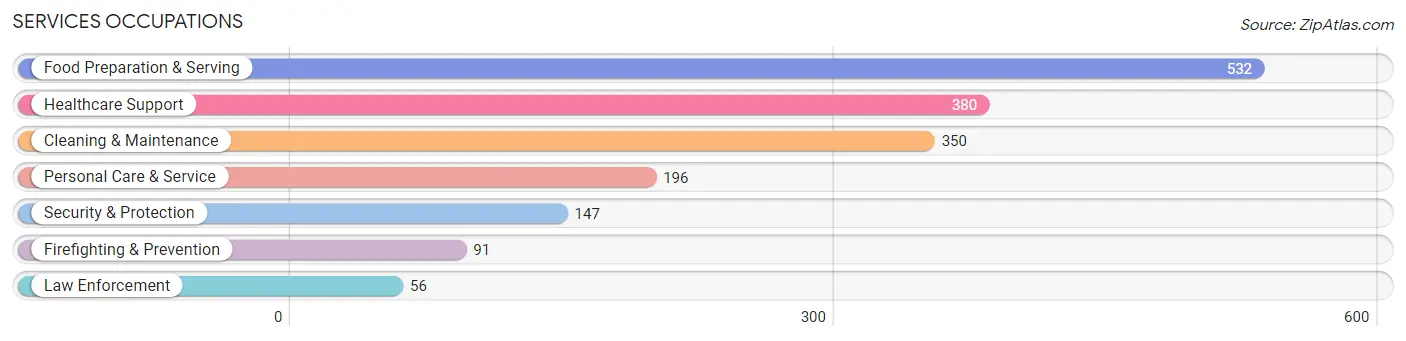
Services Occupations
The most common Services occupations in Fillmore are Food Preparation & Serving (532 | 6.6%), Healthcare Support (380 | 4.7%), Cleaning & Maintenance (350 | 4.4%), Personal Care & Service (196 | 2.4%), and Security & Protection (147 | 1.8%).
Services Occupations by Sex
Within the Services occupations in Fillmore, the most male-oriented occupations are Security & Protection (100.0%), Firefighting & Prevention (100.0%), and Law Enforcement (100.0%), while the most female-oriented occupations are Healthcare Support (88.9%), Personal Care & Service (71.4%), and Food Preparation & Serving (50.9%).
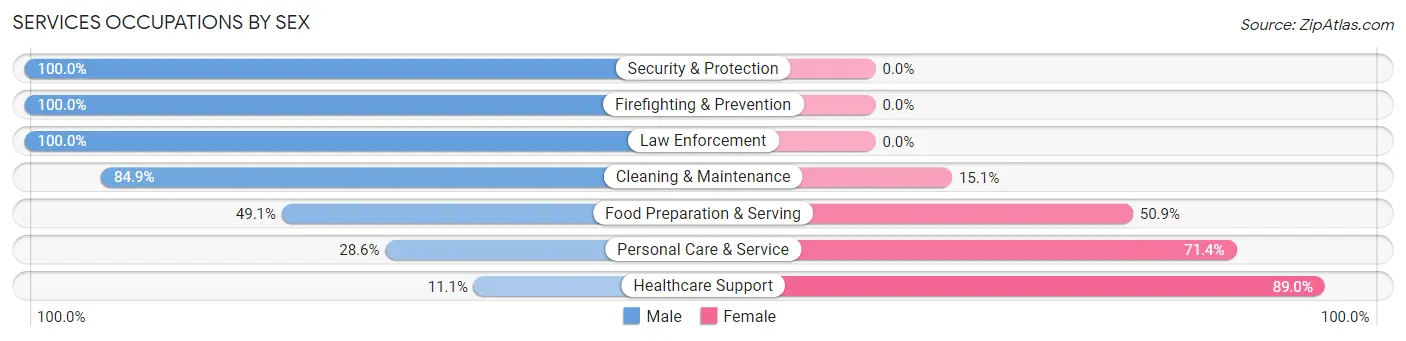
| Occupation | Male | Female |
| Healthcare Support | 42 (11.1%) | 338 (88.9%) |
| Security & Protection | 147 (100.0%) | 0 (0.0%) |
| Firefighting & Prevention | 91 (100.0%) | 0 (0.0%) |
| Law Enforcement | 56 (100.0%) | 0 (0.0%) |
| Food Preparation & Serving | 261 (49.1%) | 271 (50.9%) |
| Cleaning & Maintenance | 297 (84.9%) | 53 (15.1%) |
| Personal Care & Service | 56 (28.6%) | 140 (71.4%) |
| Total (Category) | 803 (50.0%) | 802 (50.0%) |
| Total (Overall) | 4,253 (53.0%) | 3,773 (47.0%) |
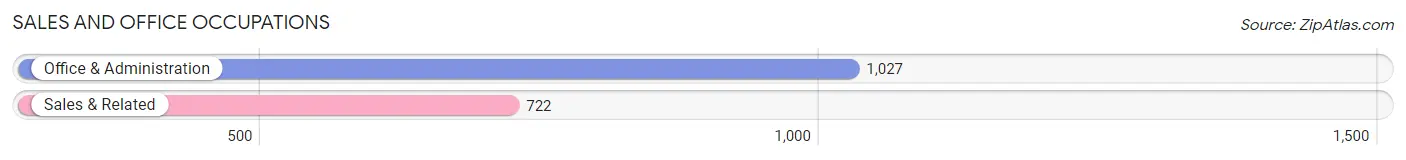
Sales and Office Occupations
The most common Sales and Office occupations in Fillmore are Office & Administration (1,027 | 12.8%), and Sales & Related (722 | 9.0%).
Sales and Office Occupations by Sex
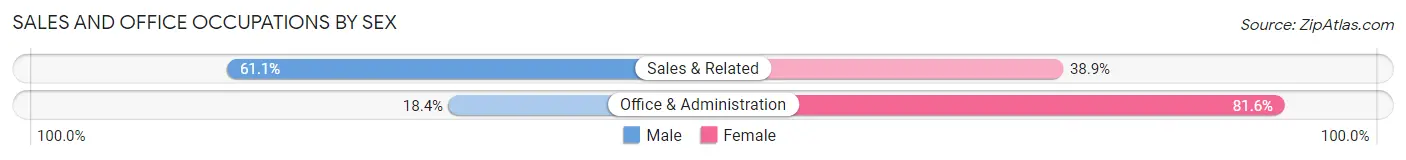
| Occupation | Male | Female |
| Sales & Related | 441 (61.1%) | 281 (38.9%) |
| Office & Administration | 189 (18.4%) | 838 (81.6%) |
| Total (Category) | 630 (36.0%) | 1,119 (64.0%) |
| Total (Overall) | 4,253 (53.0%) | 3,773 (47.0%) |
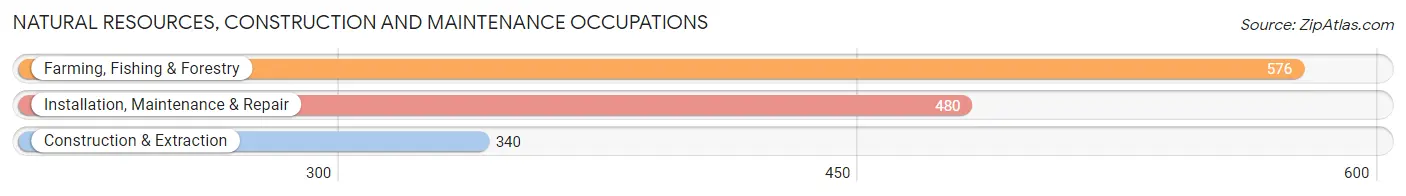
Natural Resources, Construction and Maintenance Occupations
The most common Natural Resources, Construction and Maintenance occupations in Fillmore are Farming, Fishing & Forestry (576 | 7.2%), Installation, Maintenance & Repair (480 | 6.0%), and Construction & Extraction (340 | 4.2%).
Natural Resources, Construction and Maintenance Occupations by Sex
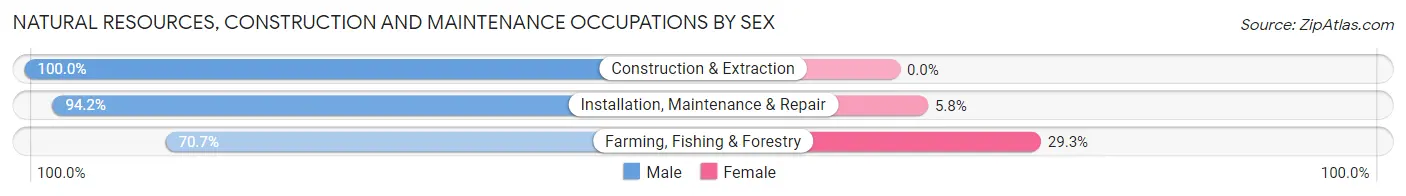
| Occupation | Male | Female |
| Farming, Fishing & Forestry | 407 (70.7%) | 169 (29.3%) |
| Construction & Extraction | 340 (100.0%) | 0 (0.0%) |
| Installation, Maintenance & Repair | 452 (94.2%) | 28 (5.8%) |
| Total (Category) | 1,199 (85.9%) | 197 (14.1%) |
| Total (Overall) | 4,253 (53.0%) | 3,773 (47.0%) |
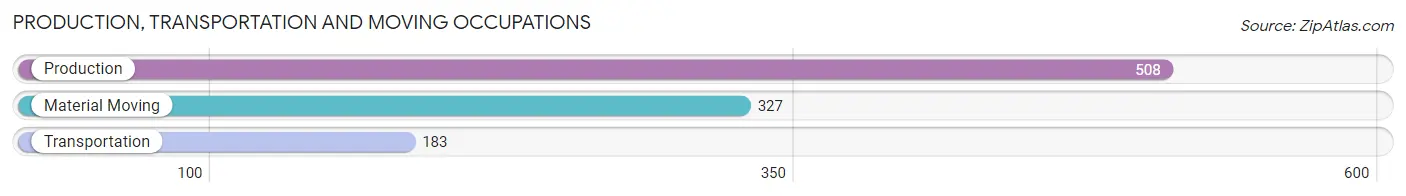
Production, Transportation and Moving Occupations
The most common Production, Transportation and Moving occupations in Fillmore are Production (508 | 6.3%), Material Moving (327 | 4.1%), and Transportation (183 | 2.3%).
Production, Transportation and Moving Occupations by Sex
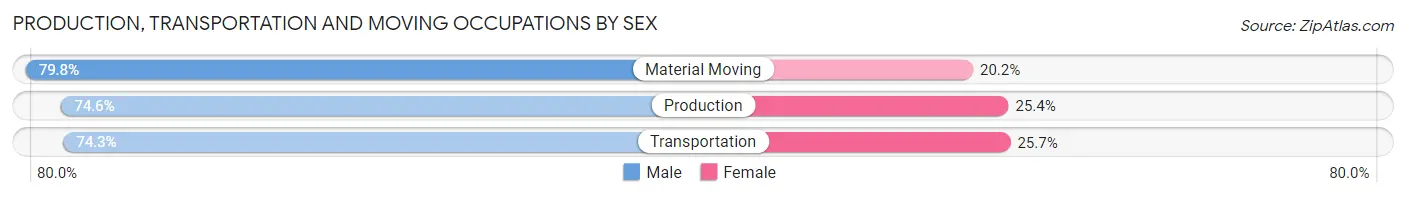
| Occupation | Male | Female |
| Production | 379 (74.6%) | 129 (25.4%) |
| Transportation | 136 (74.3%) | 47 (25.7%) |
| Material Moving | 261 (79.8%) | 66 (20.2%) |
| Total (Category) | 776 (76.2%) | 242 (23.8%) |
| Total (Overall) | 4,253 (53.0%) | 3,773 (47.0%) |
Employment Industries by Sex in Fillmore
Employment Industries in Fillmore
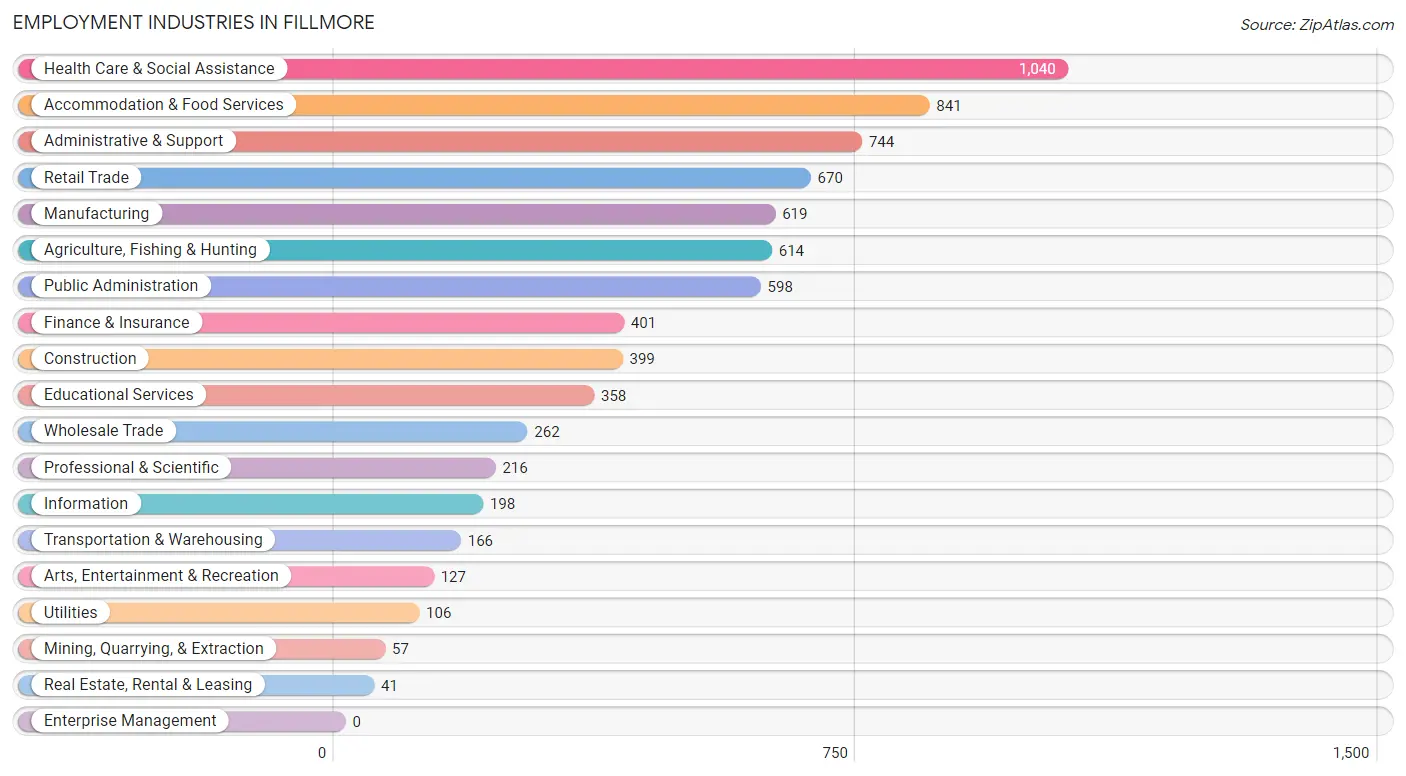
The major employment industries in Fillmore include Health Care & Social Assistance (1,040 | 13.0%), Accommodation & Food Services (841 | 10.5%), Administrative & Support (744 | 9.3%), Retail Trade (670 | 8.4%), and Manufacturing (619 | 7.7%).
Employment Industries by Sex in Fillmore
The Fillmore industries that see more men than women are Mining, Quarrying, & Extraction (100.0%), Construction (100.0%), and Real Estate, Rental & Leasing (100.0%), whereas the industries that tend to have a higher number of women are Health Care & Social Assistance (88.6%), Finance & Insurance (74.1%), and Educational Services (72.1%).
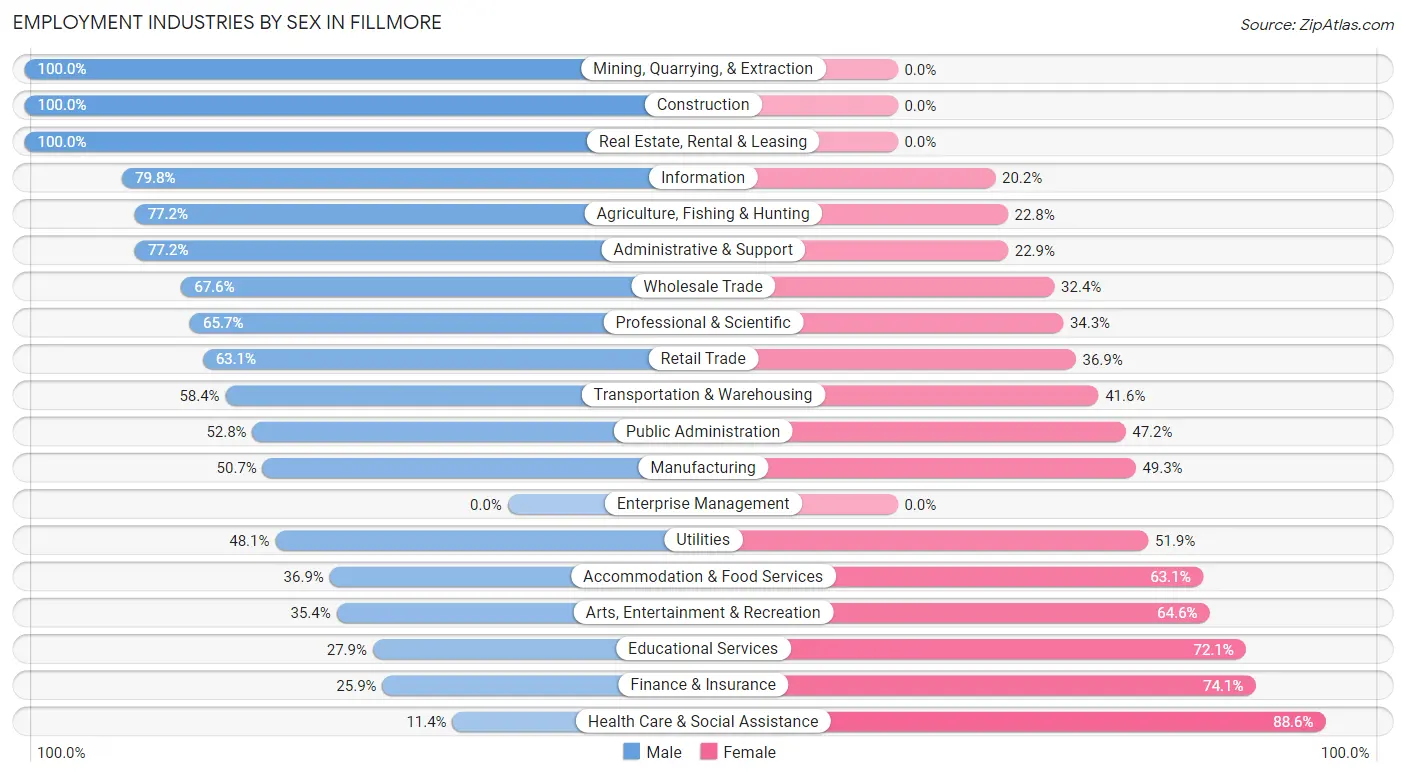
| Industry | Male | Female |
| Agriculture, Fishing & Hunting | 474 (77.2%) | 140 (22.8%) |
| Mining, Quarrying, & Extraction | 57 (100.0%) | 0 (0.0%) |
| Construction | 399 (100.0%) | 0 (0.0%) |
| Manufacturing | 314 (50.7%) | 305 (49.3%) |
| Wholesale Trade | 177 (67.6%) | 85 (32.4%) |
| Retail Trade | 423 (63.1%) | 247 (36.9%) |
| Transportation & Warehousing | 97 (58.4%) | 69 (41.6%) |
| Utilities | 51 (48.1%) | 55 (51.9%) |
| Information | 158 (79.8%) | 40 (20.2%) |
| Finance & Insurance | 104 (25.9%) | 297 (74.1%) |
| Real Estate, Rental & Leasing | 41 (100.0%) | 0 (0.0%) |
| Professional & Scientific | 142 (65.7%) | 74 (34.3%) |
| Enterprise Management | 0 (0.0%) | 0 (0.0%) |
| Administrative & Support | 574 (77.1%) | 170 (22.9%) |
| Educational Services | 100 (27.9%) | 258 (72.1%) |
| Health Care & Social Assistance | 119 (11.4%) | 921 (88.6%) |
| Arts, Entertainment & Recreation | 45 (35.4%) | 82 (64.6%) |
| Accommodation & Food Services | 310 (36.9%) | 531 (63.1%) |
| Public Administration | 316 (52.8%) | 282 (47.2%) |
| Total | 4,253 (53.0%) | 3,773 (47.0%) |
Education in Fillmore
School Enrollment in Fillmore
The most common levels of schooling among the 4,945 students in Fillmore are middle school (1,353 | 27.4%), college / undergraduate (1,290 | 26.1%), and high school (1,026 | 20.7%).
| School Level | # Students | % Students |
| Nursery / Preschool | 300 | 6.1% |
| Kindergarten | 215 | 4.3% |
| Elementary School | 761 | 15.4% |
| Middle School | 1,353 | 27.4% |
| High School | 1,026 | 20.7% |
| College / Undergraduate | 1,290 | 26.1% |
| Graduate / Professional | 0 | 0.0% |
| Total | 4,945 | 100.0% |
School Enrollment by Age by Funding Source in Fillmore
Out of a total of 4,945 students who are enrolled in schools in Fillmore, 628 (12.7%) attend a private institution, while the remaining 4,317 (87.3%) are enrolled in public schools. The age group of 3 to 4 year olds has the highest likelihood of being enrolled in private schools, with 107 (68.1% in the age bracket) enrolled. Conversely, the age group of 15 to 17 year olds has the lowest likelihood of being enrolled in a private school, with 688 (100.0% in the age bracket) attending a public institution.
| Age Bracket | Public School | Private School |
| 3 to 4 Year Olds | 50 (31.9%) | 107 (68.1%) |
| 5 to 9 Year Old | 807 (76.8%) | 244 (23.2%) |
| 10 to 14 Year Olds | 1,538 (92.5%) | 125 (7.5%) |
| 15 to 17 Year Olds | 688 (100.0%) | 0 (0.0%) |
| 18 to 19 Year Olds | 530 (93.6%) | 36 (6.4%) |
| 20 to 24 Year Olds | 339 (81.7%) | 76 (18.3%) |
| 25 to 34 Year Olds | 186 (81.6%) | 42 (18.4%) |
| 35 Years and over | 177 (100.0%) | 0 (0.0%) |
| Total | 4,317 (87.3%) | 628 (12.7%) |
Educational Attainment by Field of Study in Fillmore
Business (399 | 21.3%), science & technology (265 | 14.2%), psychology (175 | 9.4%), arts & humanities (156 | 8.4%), and social sciences (153 | 8.2%) are the most common fields of study among 1,869 individuals in Fillmore who have obtained a bachelor's degree or higher.
| Field of Study | # Graduates | % Graduates |
| Computers & Mathematics | 85 | 4.5% |
| Bio, Nature & Agricultural | 93 | 5.0% |
| Physical & Health Sciences | 0 | 0.0% |
| Psychology | 175 | 9.4% |
| Social Sciences | 153 | 8.2% |
| Engineering | 53 | 2.8% |
| Multidisciplinary Studies | 14 | 0.7% |
| Science & Technology | 265 | 14.2% |
| Business | 399 | 21.3% |
| Education | 88 | 4.7% |
| Literature & Languages | 110 | 5.9% |
| Liberal Arts & History | 91 | 4.9% |
| Visual & Performing Arts | 138 | 7.4% |
| Communications | 49 | 2.6% |
| Arts & Humanities | 156 | 8.4% |
| Total | 1,869 | 100.0% |
Transportation & Commute in Fillmore
Vehicle Availability by Sex in Fillmore
The most prevalent vehicle ownership categories in Fillmore are males with 2 vehicles (1,771, accounting for 41.9%) and females with 2 vehicles (1,657, making up 47.7%).
| Vehicles Available | Male | Female |
| No Vehicle | 103 (2.4%) | 83 (2.2%) |
| 1 Vehicle | 216 (5.1%) | 313 (8.4%) |
| 2 Vehicles | 1,771 (41.9%) | 1,657 (44.6%) |
| 3 Vehicles | 1,002 (23.7%) | 663 (17.8%) |
| 4 Vehicles | 492 (11.7%) | 647 (17.4%) |
| 5 or more Vehicles | 638 (15.1%) | 351 (9.5%) |
| Total | 4,222 (100.0%) | 3,714 (100.0%) |
Commute Time in Fillmore
The most frequently occuring commute durations in Fillmore are 30 to 34 minutes (1,521 commuters, 20.5%), 45 to 59 minutes (911 commuters, 12.3%), and 20 to 24 minutes (722 commuters, 9.8%).
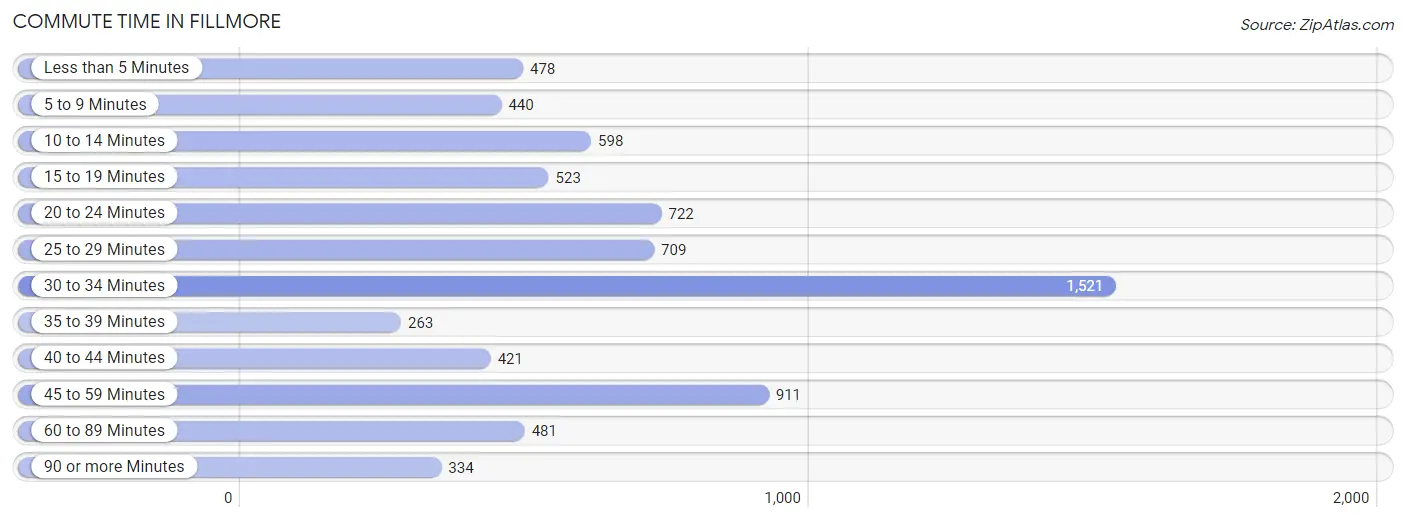
| Commute Time | # Commuters | % Commuters |
| Less than 5 Minutes | 478 | 6.5% |
| 5 to 9 Minutes | 440 | 5.9% |
| 10 to 14 Minutes | 598 | 8.1% |
| 15 to 19 Minutes | 523 | 7.1% |
| 20 to 24 Minutes | 722 | 9.8% |
| 25 to 29 Minutes | 709 | 9.6% |
| 30 to 34 Minutes | 1,521 | 20.5% |
| 35 to 39 Minutes | 263 | 3.5% |
| 40 to 44 Minutes | 421 | 5.7% |
| 45 to 59 Minutes | 911 | 12.3% |
| 60 to 89 Minutes | 481 | 6.5% |
| 90 or more Minutes | 334 | 4.5% |
Commute Time by Sex in Fillmore
The most common commute times in Fillmore are 30 to 34 minutes (729 commuters, 18.1%) for males and 30 to 34 minutes (792 commuters, 23.5%) for females.
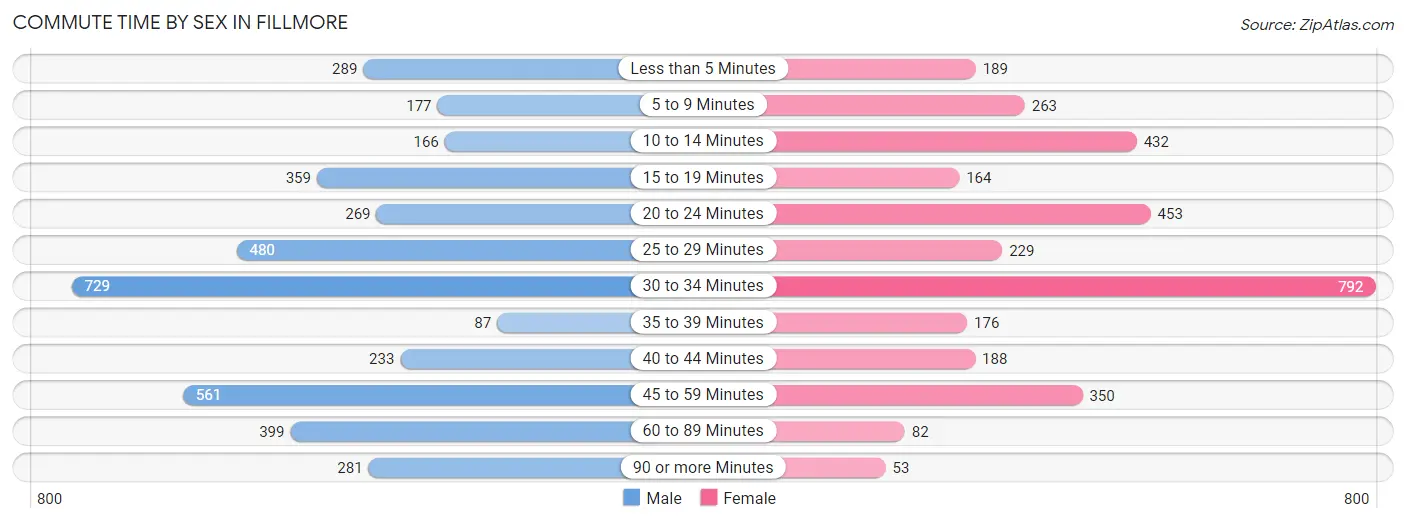
| Commute Time | Male | Female |
| Less than 5 Minutes | 289 (7.2%) | 189 (5.6%) |
| 5 to 9 Minutes | 177 (4.4%) | 263 (7.8%) |
| 10 to 14 Minutes | 166 (4.1%) | 432 (12.8%) |
| 15 to 19 Minutes | 359 (8.9%) | 164 (4.9%) |
| 20 to 24 Minutes | 269 (6.7%) | 453 (13.4%) |
| 25 to 29 Minutes | 480 (11.9%) | 229 (6.8%) |
| 30 to 34 Minutes | 729 (18.1%) | 792 (23.5%) |
| 35 to 39 Minutes | 87 (2.2%) | 176 (5.2%) |
| 40 to 44 Minutes | 233 (5.8%) | 188 (5.6%) |
| 45 to 59 Minutes | 561 (13.9%) | 350 (10.4%) |
| 60 to 89 Minutes | 399 (9.9%) | 82 (2.4%) |
| 90 or more Minutes | 281 (7.0%) | 53 (1.6%) |
Time of Departure to Work by Sex in Fillmore
The most frequent times of departure to work in Fillmore are 7:00 AM to 7:29 AM (652, 16.2%) for males and 7:00 AM to 7:29 AM (489, 14.5%) for females.
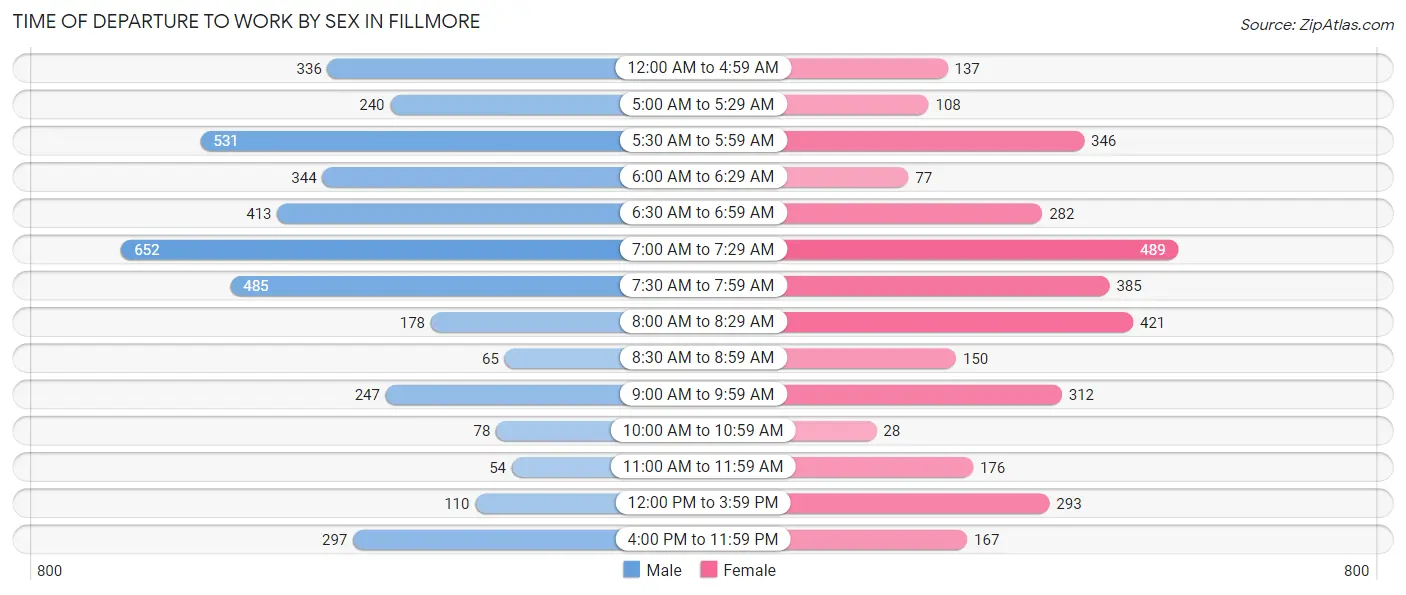
| Time of Departure | Male | Female |
| 12:00 AM to 4:59 AM | 336 (8.3%) | 137 (4.1%) |
| 5:00 AM to 5:29 AM | 240 (6.0%) | 108 (3.2%) |
| 5:30 AM to 5:59 AM | 531 (13.2%) | 346 (10.3%) |
| 6:00 AM to 6:29 AM | 344 (8.5%) | 77 (2.3%) |
| 6:30 AM to 6:59 AM | 413 (10.2%) | 282 (8.4%) |
| 7:00 AM to 7:29 AM | 652 (16.2%) | 489 (14.5%) |
| 7:30 AM to 7:59 AM | 485 (12.0%) | 385 (11.4%) |
| 8:00 AM to 8:29 AM | 178 (4.4%) | 421 (12.5%) |
| 8:30 AM to 8:59 AM | 65 (1.6%) | 150 (4.4%) |
| 9:00 AM to 9:59 AM | 247 (6.1%) | 312 (9.3%) |
| 10:00 AM to 10:59 AM | 78 (1.9%) | 28 (0.8%) |
| 11:00 AM to 11:59 AM | 54 (1.3%) | 176 (5.2%) |
| 12:00 PM to 3:59 PM | 110 (2.7%) | 293 (8.7%) |
| 4:00 PM to 11:59 PM | 297 (7.4%) | 167 (5.0%) |
| Total | 4,030 (100.0%) | 3,371 (100.0%) |
Housing Occupancy in Fillmore
Occupancy by Ownership in Fillmore
Of the total 4,982 dwellings in Fillmore, owner-occupied units account for 3,104 (62.3%), while renter-occupied units make up 1,878 (37.7%).
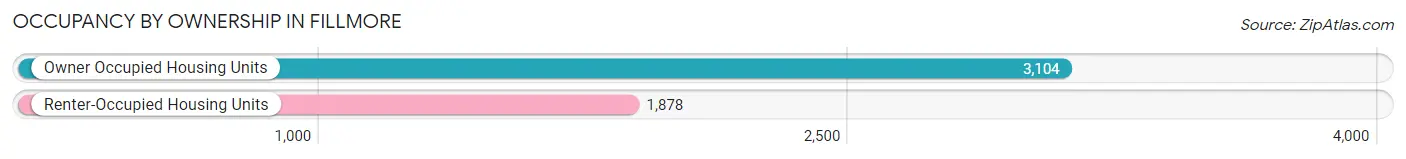
| Occupancy | # Housing Units | % Housing Units |
| Owner Occupied Housing Units | 3,104 | 62.3% |
| Renter-Occupied Housing Units | 1,878 | 37.7% |
| Total Occupied Housing Units | 4,982 | 100.0% |
Occupancy by Household Size in Fillmore
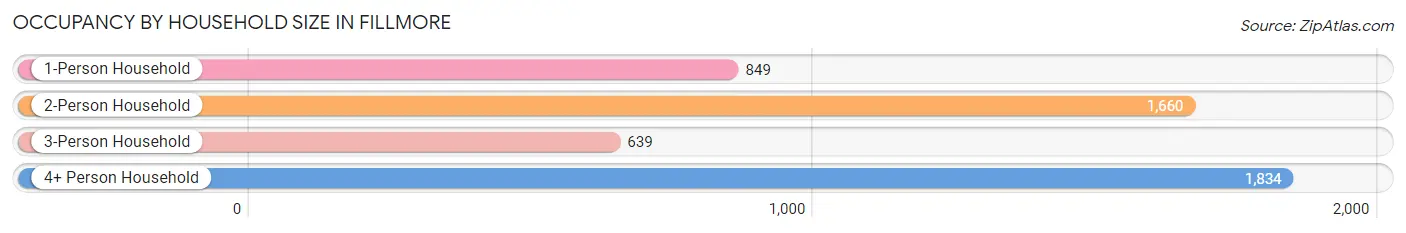
| Household Size | # Housing Units | % Housing Units |
| 1-Person Household | 849 | 17.0% |
| 2-Person Household | 1,660 | 33.3% |
| 3-Person Household | 639 | 12.8% |
| 4+ Person Household | 1,834 | 36.8% |
| Total Housing Units | 4,982 | 100.0% |
Occupancy by Ownership by Household Size in Fillmore
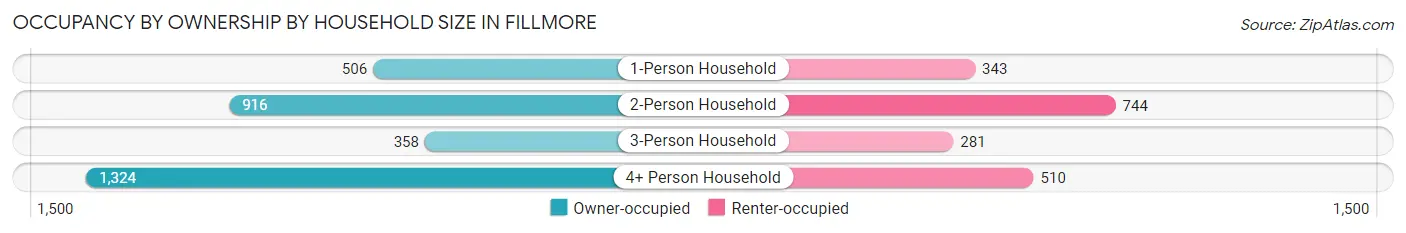
| Household Size | Owner-occupied | Renter-occupied |
| 1-Person Household | 506 (59.6%) | 343 (40.4%) |
| 2-Person Household | 916 (55.2%) | 744 (44.8%) |
| 3-Person Household | 358 (56.0%) | 281 (44.0%) |
| 4+ Person Household | 1,324 (72.2%) | 510 (27.8%) |
| Total Housing Units | 3,104 (62.3%) | 1,878 (37.7%) |
Occupancy by Educational Attainment in Fillmore
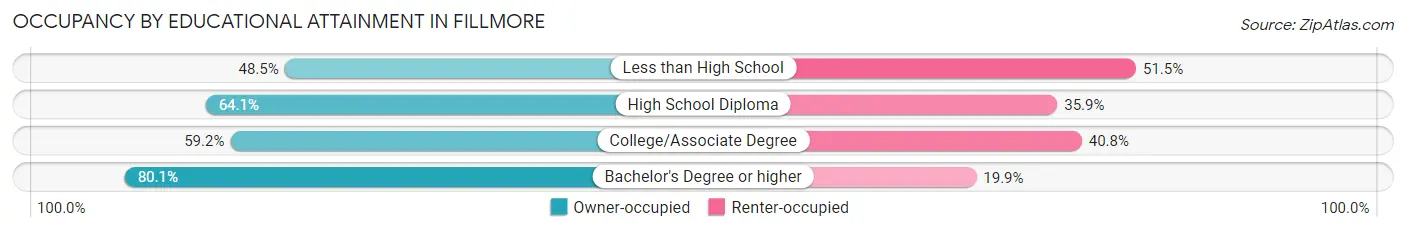
| Household Size | Owner-occupied | Renter-occupied |
| Less than High School | 429 (48.5%) | 456 (51.5%) |
| High School Diploma | 887 (64.1%) | 497 (35.9%) |
| College/Associate Degree | 1,094 (59.2%) | 753 (40.8%) |
| Bachelor's Degree or higher | 694 (80.1%) | 172 (19.9%) |
Occupancy by Age of Householder in Fillmore
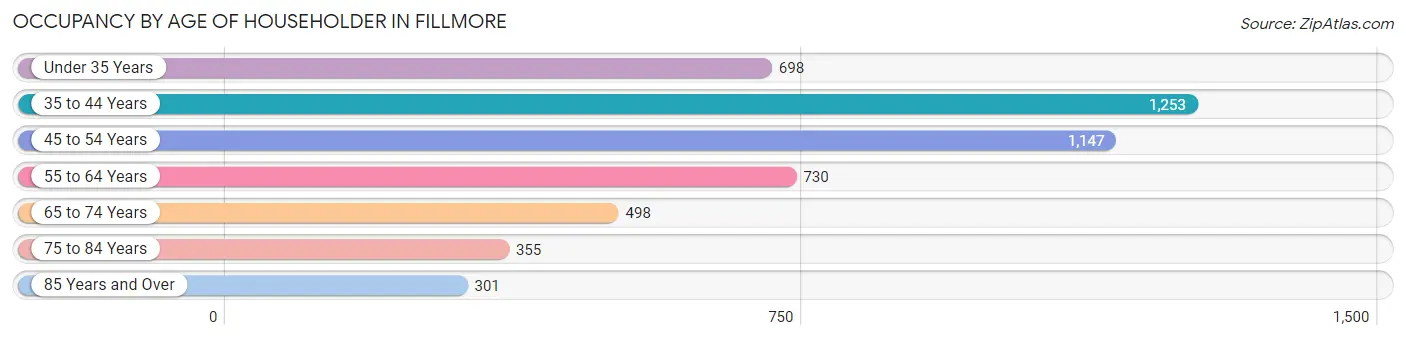
| Age Bracket | # Households | % Households |
| Under 35 Years | 698 | 14.0% |
| 35 to 44 Years | 1,253 | 25.2% |
| 45 to 54 Years | 1,147 | 23.0% |
| 55 to 64 Years | 730 | 14.6% |
| 65 to 74 Years | 498 | 10.0% |
| 75 to 84 Years | 355 | 7.1% |
| 85 Years and Over | 301 | 6.0% |
| Total | 4,982 | 100.0% |
Housing Finances in Fillmore
Median Income by Occupancy in Fillmore
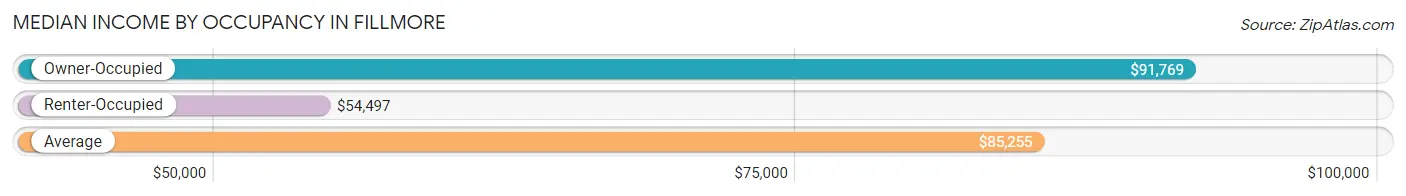
| Occupancy Type | # Households | Median Income |
| Owner-Occupied | 3,104 (62.3%) | $91,769 |
| Renter-Occupied | 1,878 (37.7%) | $54,497 |
| Average | 4,982 (100.0%) | $85,255 |
Occupancy by Householder Income Bracket in Fillmore
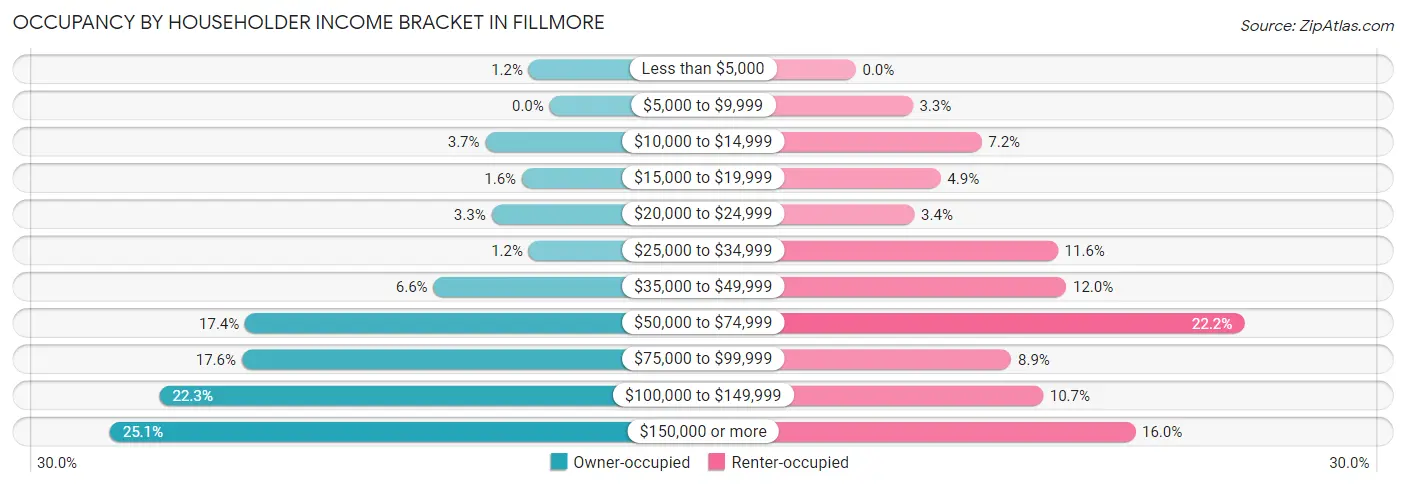
| Income Bracket | Owner-occupied | Renter-occupied |
| Less than $5,000 | 37 (1.2%) | 0 (0.0%) |
| $5,000 to $9,999 | 0 (0.0%) | 61 (3.3%) |
| $10,000 to $14,999 | 114 (3.7%) | 135 (7.2%) |
| $15,000 to $19,999 | 49 (1.6%) | 91 (4.9%) |
| $20,000 to $24,999 | 103 (3.3%) | 63 (3.4%) |
| $25,000 to $34,999 | 37 (1.2%) | 217 (11.6%) |
| $35,000 to $49,999 | 206 (6.6%) | 226 (12.0%) |
| $50,000 to $74,999 | 540 (17.4%) | 417 (22.2%) |
| $75,000 to $99,999 | 546 (17.6%) | 167 (8.9%) |
| $100,000 to $149,999 | 692 (22.3%) | 201 (10.7%) |
| $150,000 or more | 780 (25.1%) | 300 (16.0%) |
| Total | 3,104 (100.0%) | 1,878 (100.0%) |
Monthly Housing Cost Tiers in Fillmore
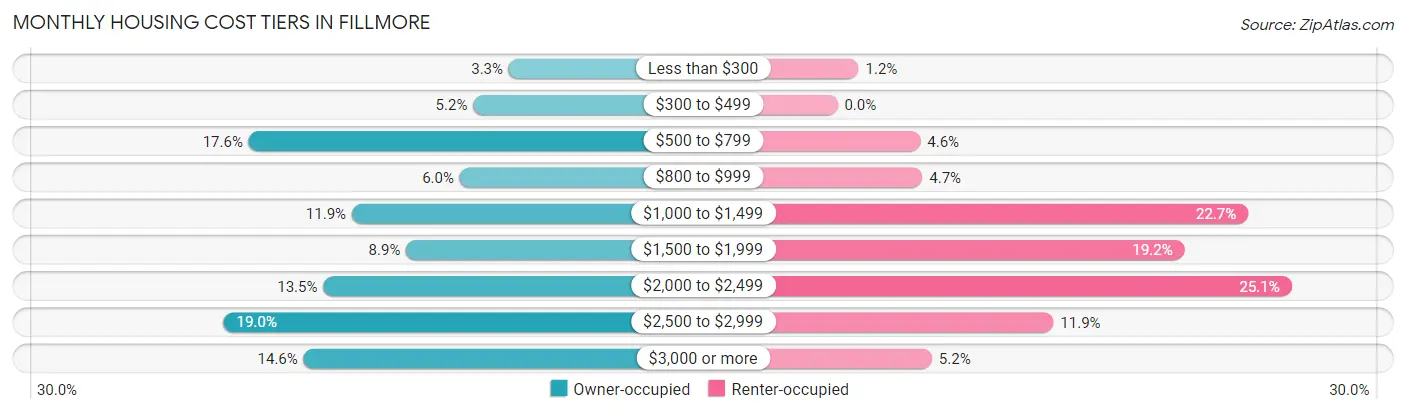
| Monthly Cost | Owner-occupied | Renter-occupied |
| Less than $300 | 101 (3.3%) | 22 (1.2%) |
| $300 to $499 | 162 (5.2%) | 0 (0.0%) |
| $500 to $799 | 547 (17.6%) | 86 (4.6%) |
| $800 to $999 | 185 (6.0%) | 88 (4.7%) |
| $1,000 to $1,499 | 370 (11.9%) | 426 (22.7%) |
| $1,500 to $1,999 | 277 (8.9%) | 360 (19.2%) |
| $2,000 to $2,499 | 419 (13.5%) | 471 (25.1%) |
| $2,500 to $2,999 | 590 (19.0%) | 224 (11.9%) |
| $3,000 or more | 453 (14.6%) | 98 (5.2%) |
| Total | 3,104 (100.0%) | 1,878 (100.0%) |
Physical Housing Characteristics in Fillmore
Housing Structures in Fillmore
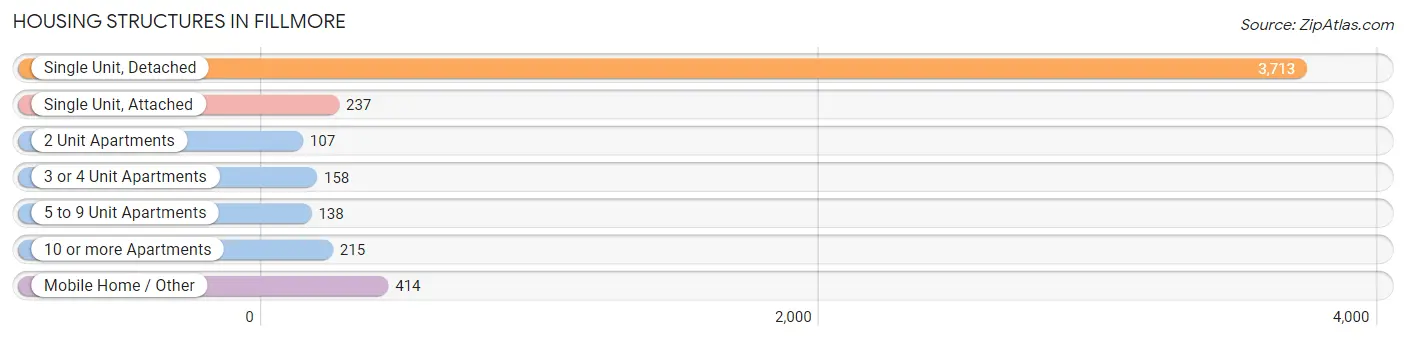
| Structure Type | # Housing Units | % Housing Units |
| Single Unit, Detached | 3,713 | 74.5% |
| Single Unit, Attached | 237 | 4.8% |
| 2 Unit Apartments | 107 | 2.1% |
| 3 or 4 Unit Apartments | 158 | 3.2% |
| 5 to 9 Unit Apartments | 138 | 2.8% |
| 10 or more Apartments | 215 | 4.3% |
| Mobile Home / Other | 414 | 8.3% |
| Total | 4,982 | 100.0% |
Housing Structures by Occupancy in Fillmore
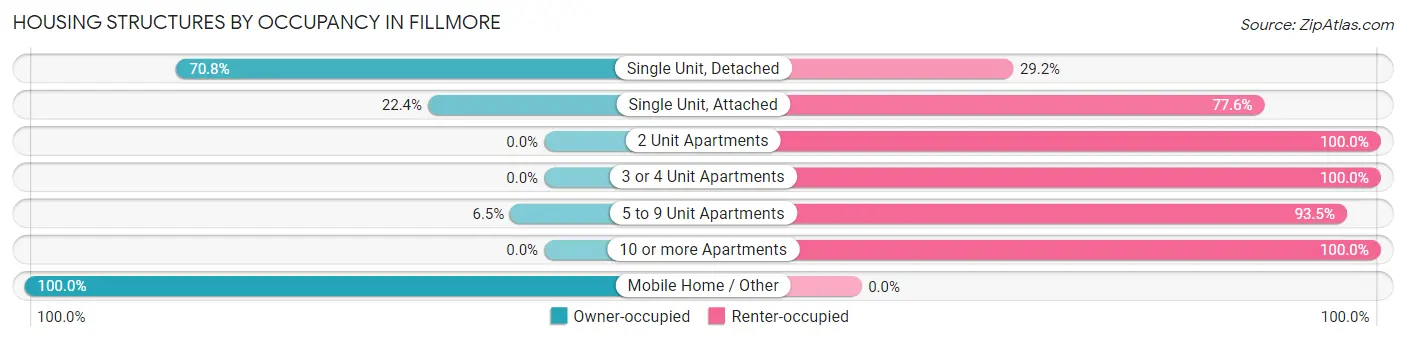
| Structure Type | Owner-occupied | Renter-occupied |
| Single Unit, Detached | 2,628 (70.8%) | 1,085 (29.2%) |
| Single Unit, Attached | 53 (22.4%) | 184 (77.6%) |
| 2 Unit Apartments | 0 (0.0%) | 107 (100.0%) |
| 3 or 4 Unit Apartments | 0 (0.0%) | 158 (100.0%) |
| 5 to 9 Unit Apartments | 9 (6.5%) | 129 (93.5%) |
| 10 or more Apartments | 0 (0.0%) | 215 (100.0%) |
| Mobile Home / Other | 414 (100.0%) | 0 (0.0%) |
| Total | 3,104 (62.3%) | 1,878 (37.7%) |
Housing Structures by Number of Rooms in Fillmore
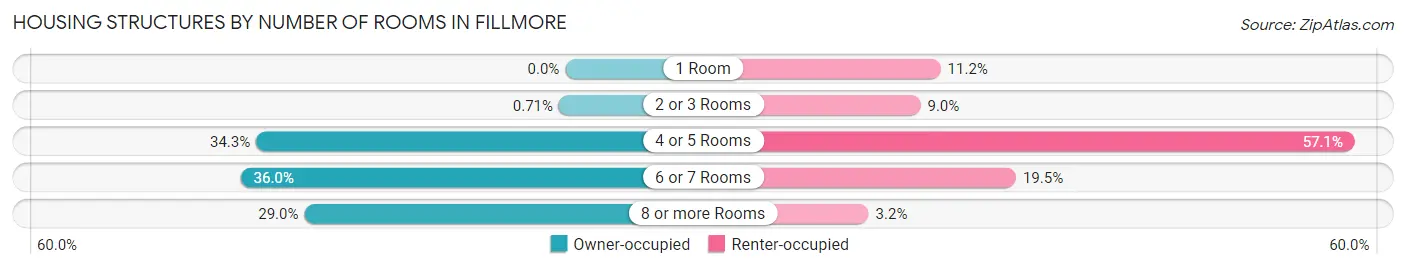
| Number of Rooms | Owner-occupied | Renter-occupied |
| 1 Room | 0 (0.0%) | 210 (11.2%) |
| 2 or 3 Rooms | 22 (0.7%) | 168 (8.9%) |
| 4 or 5 Rooms | 1,065 (34.3%) | 1,073 (57.1%) |
| 6 or 7 Rooms | 1,118 (36.0%) | 367 (19.5%) |
| 8 or more Rooms | 899 (29.0%) | 60 (3.2%) |
| Total | 3,104 (100.0%) | 1,878 (100.0%) |
Housing Structure by Heating Type in Fillmore
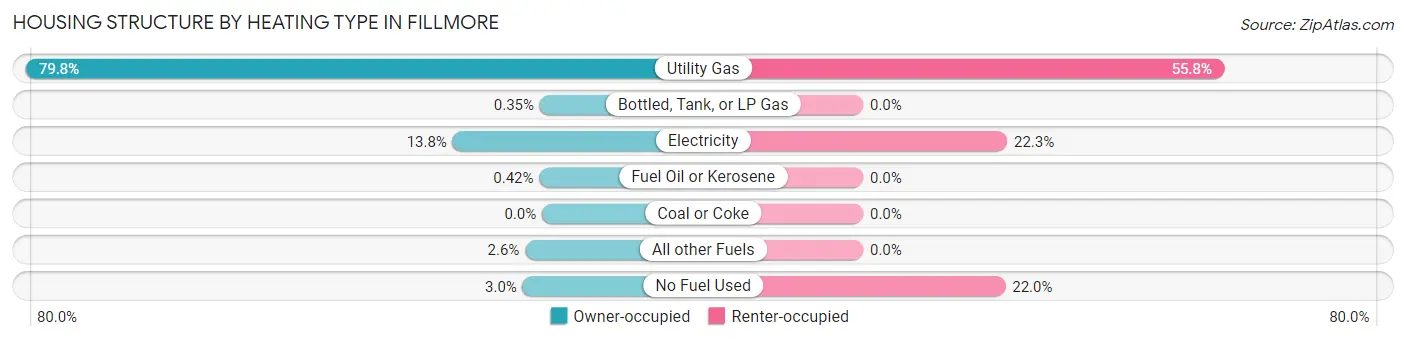
| Heating Type | Owner-occupied | Renter-occupied |
| Utility Gas | 2,477 (79.8%) | 1,047 (55.7%) |
| Bottled, Tank, or LP Gas | 11 (0.4%) | 0 (0.0%) |
| Electricity | 429 (13.8%) | 418 (22.3%) |
| Fuel Oil or Kerosene | 13 (0.4%) | 0 (0.0%) |
| Coal or Coke | 0 (0.0%) | 0 (0.0%) |
| All other Fuels | 81 (2.6%) | 0 (0.0%) |
| No Fuel Used | 93 (3.0%) | 413 (22.0%) |
| Total | 3,104 (100.0%) | 1,878 (100.0%) |
Household Vehicle Usage in Fillmore
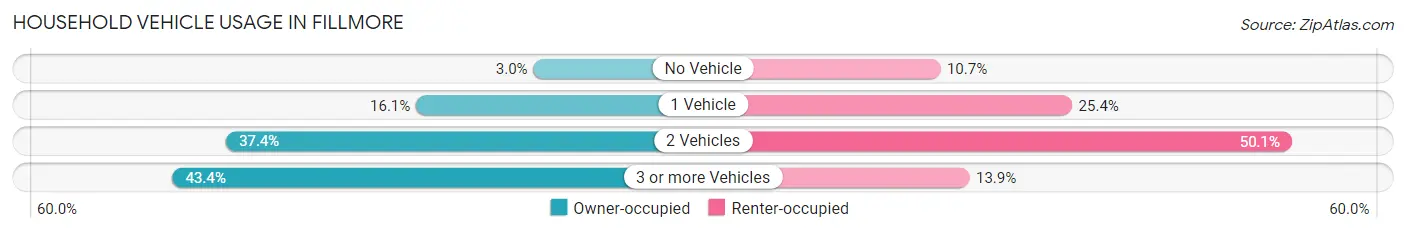
| Vehicles per Household | Owner-occupied | Renter-occupied |
| No Vehicle | 93 (3.0%) | 200 (10.6%) |
| 1 Vehicle | 501 (16.1%) | 477 (25.4%) |
| 2 Vehicles | 1,162 (37.4%) | 940 (50.0%) |
| 3 or more Vehicles | 1,348 (43.4%) | 261 (13.9%) |
| Total | 3,104 (100.0%) | 1,878 (100.0%) |
Real Estate & Mortgages in Fillmore
Real Estate and Mortgage Overview in Fillmore
| Characteristic | Without Mortgage | With Mortgage |
| Housing Units | 1,117 | 1,987 |
| Median Property Value | $528,000 | $497,300 |
| Median Household Income | $68,743 | $641 |
| Monthly Housing Costs | $662 | $453 |
| Real Estate Taxes | $1,820 | $143 |
Property Value by Mortgage Status in Fillmore
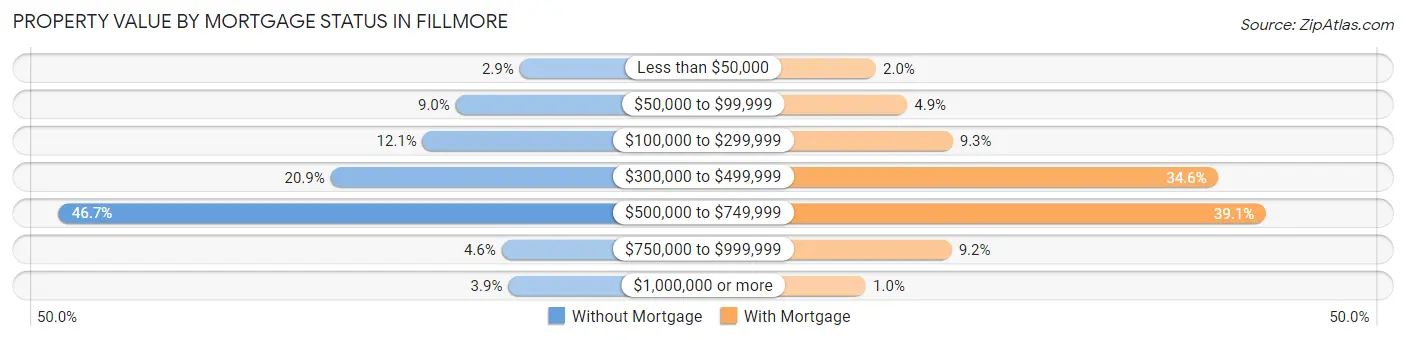
| Property Value | Without Mortgage | With Mortgage |
| Less than $50,000 | 32 (2.9%) | 39 (2.0%) |
| $50,000 to $99,999 | 100 (8.9%) | 98 (4.9%) |
| $100,000 to $299,999 | 135 (12.1%) | 184 (9.3%) |
| $300,000 to $499,999 | 233 (20.9%) | 687 (34.6%) |
| $500,000 to $749,999 | 522 (46.7%) | 777 (39.1%) |
| $750,000 to $999,999 | 51 (4.6%) | 182 (9.2%) |
| $1,000,000 or more | 44 (3.9%) | 20 (1.0%) |
| Total | 1,117 (100.0%) | 1,987 (100.0%) |
Household Income by Mortgage Status in Fillmore
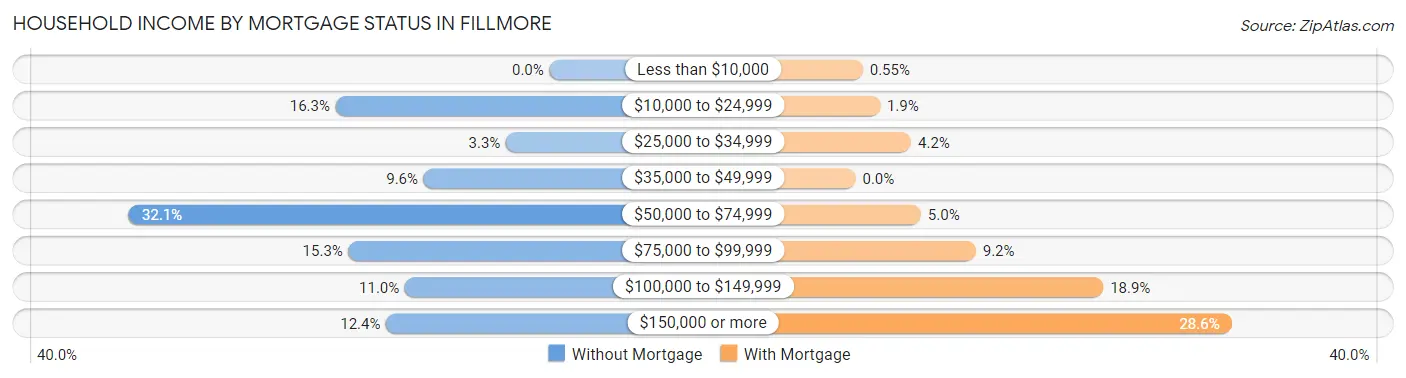
| Household Income | Without Mortgage | With Mortgage |
| Less than $10,000 | 0 (0.0%) | 11 (0.5%) |
| $10,000 to $24,999 | 182 (16.3%) | 37 (1.9%) |
| $25,000 to $34,999 | 37 (3.3%) | 84 (4.2%) |
| $35,000 to $49,999 | 107 (9.6%) | 0 (0.0%) |
| $50,000 to $74,999 | 358 (32.1%) | 99 (5.0%) |
| $75,000 to $99,999 | 171 (15.3%) | 182 (9.2%) |
| $100,000 to $149,999 | 123 (11.0%) | 375 (18.9%) |
| $150,000 or more | 139 (12.4%) | 569 (28.6%) |
| Total | 1,117 (100.0%) | 1,987 (100.0%) |
Property Value to Household Income Ratio in Fillmore
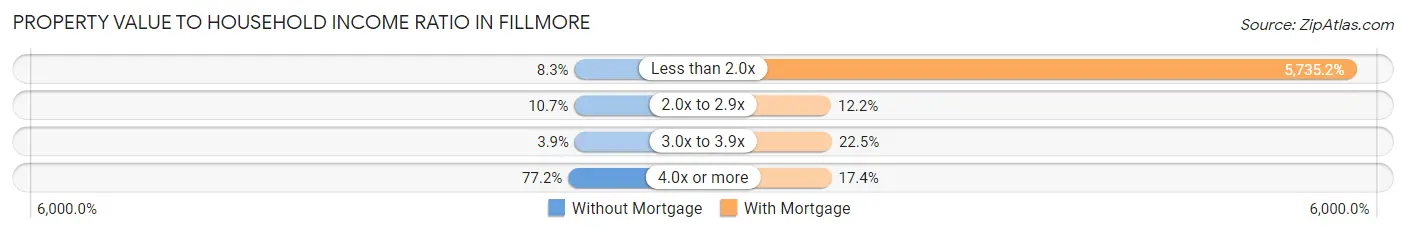
| Value-to-Income Ratio | Without Mortgage | With Mortgage |
| Less than 2.0x | 93 (8.3%) | 113,958 (5,735.2%) |
| 2.0x to 2.9x | 119 (10.6%) | 242 (12.2%) |
| 3.0x to 3.9x | 43 (3.8%) | 446 (22.5%) |
| 4.0x or more | 862 (77.2%) | 346 (17.4%) |
| Total | 1,117 (100.0%) | 1,987 (100.0%) |
Real Estate Taxes by Mortgage Status in Fillmore
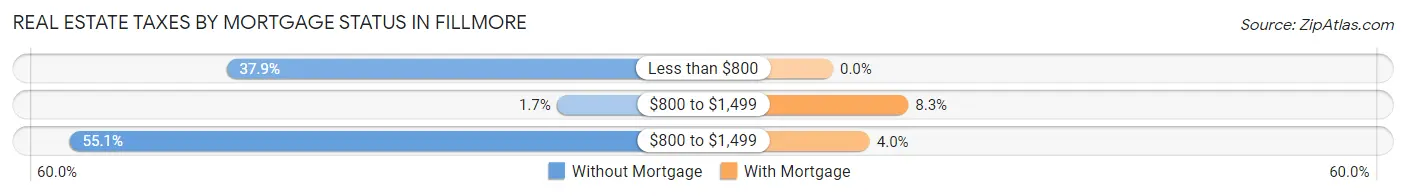
| Property Taxes | Without Mortgage | With Mortgage |
| Less than $800 | 423 (37.9%) | 0 (0.0%) |
| $800 to $1,499 | 19 (1.7%) | 164 (8.3%) |
| $800 to $1,499 | 615 (55.1%) | 80 (4.0%) |
| Total | 1,117 (100.0%) | 1,987 (100.0%) |
Health & Disability in Fillmore
Health Insurance Coverage by Age in Fillmore
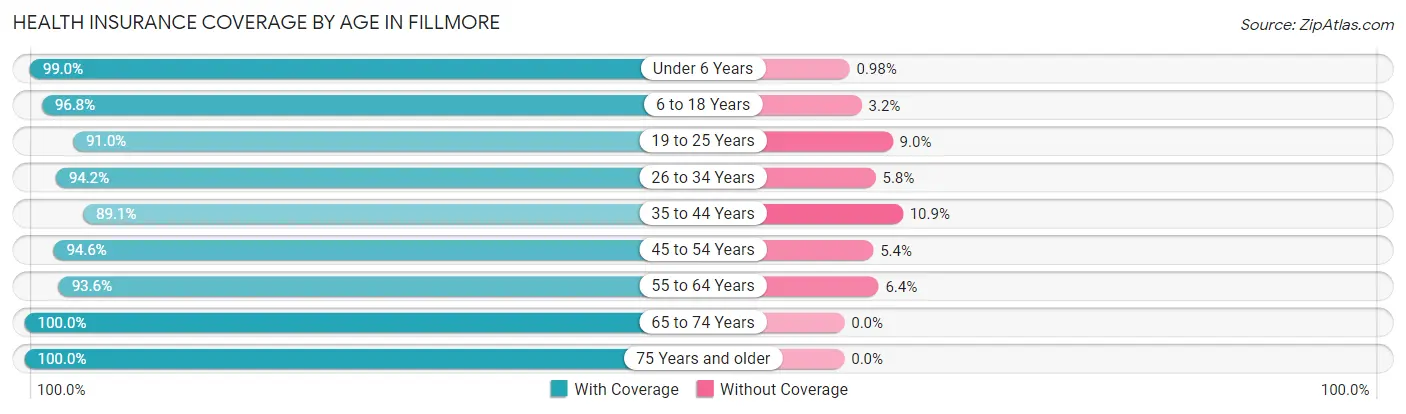
| Age Bracket | With Coverage | Without Coverage |
| Under 6 Years | 906 (99.0%) | 9 (1.0%) |
| 6 to 18 Years | 3,451 (96.8%) | 115 (3.2%) |
| 19 to 25 Years | 1,432 (91.0%) | 142 (9.0%) |
| 26 to 34 Years | 2,037 (94.2%) | 126 (5.8%) |
| 35 to 44 Years | 2,281 (89.1%) | 279 (10.9%) |
| 45 to 54 Years | 2,122 (94.6%) | 121 (5.4%) |
| 55 to 64 Years | 1,264 (93.6%) | 86 (6.4%) |
| 65 to 74 Years | 1,069 (100.0%) | 0 (0.0%) |
| 75 Years and older | 905 (100.0%) | 0 (0.0%) |
| Total | 15,467 (94.6%) | 878 (5.4%) |
Health Insurance Coverage by Citizenship Status in Fillmore
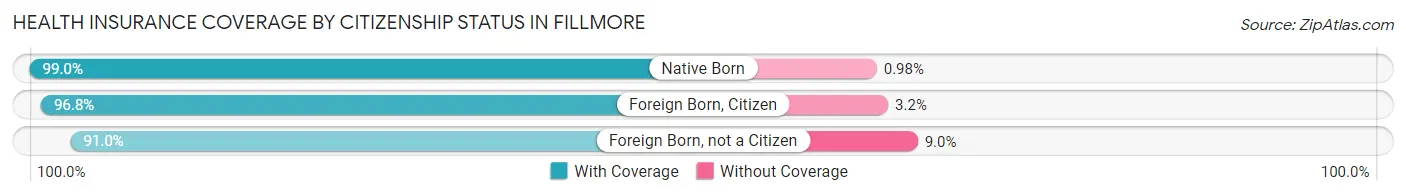
| Citizenship Status | With Coverage | Without Coverage |
| Native Born | 906 (99.0%) | 9 (1.0%) |
| Foreign Born, Citizen | 3,451 (96.8%) | 115 (3.2%) |
| Foreign Born, not a Citizen | 1,432 (91.0%) | 142 (9.0%) |
Health Insurance Coverage by Household Income in Fillmore
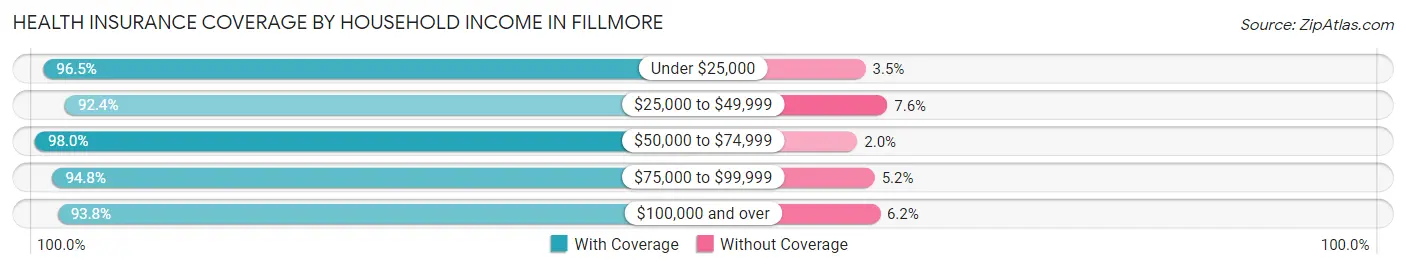
| Household Income | With Coverage | Without Coverage |
| Under $25,000 | 930 (96.5%) | 34 (3.5%) |
| $25,000 to $49,999 | 2,154 (92.4%) | 177 (7.6%) |
| $50,000 to $74,999 | 2,585 (98.0%) | 52 (2.0%) |
| $75,000 to $99,999 | 2,331 (94.8%) | 129 (5.2%) |
| $100,000 and over | 7,345 (93.8%) | 486 (6.2%) |
Public vs Private Health Insurance Coverage by Age in Fillmore
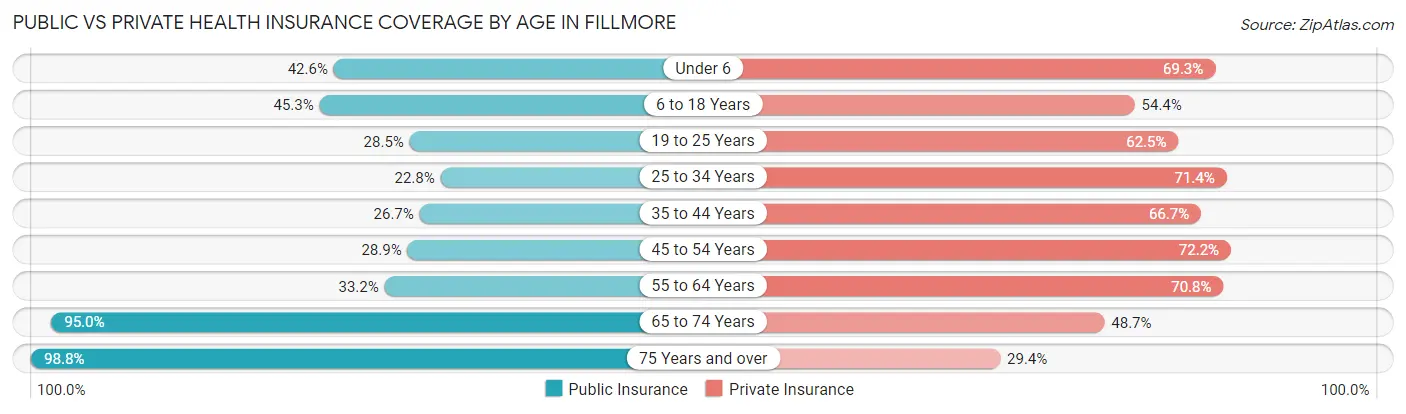
| Age Bracket | Public Insurance | Private Insurance |
| Under 6 | 390 (42.6%) | 634 (69.3%) |
| 6 to 18 Years | 1,614 (45.3%) | 1,938 (54.3%) |
| 19 to 25 Years | 449 (28.5%) | 983 (62.5%) |
| 25 to 34 Years | 493 (22.8%) | 1,545 (71.4%) |
| 35 to 44 Years | 683 (26.7%) | 1,707 (66.7%) |
| 45 to 54 Years | 649 (28.9%) | 1,620 (72.2%) |
| 55 to 64 Years | 448 (33.2%) | 956 (70.8%) |
| 65 to 74 Years | 1,016 (95.0%) | 521 (48.7%) |
| 75 Years and over | 894 (98.8%) | 266 (29.4%) |
| Total | 6,636 (40.6%) | 10,170 (62.2%) |
Disability Status by Sex by Age in Fillmore
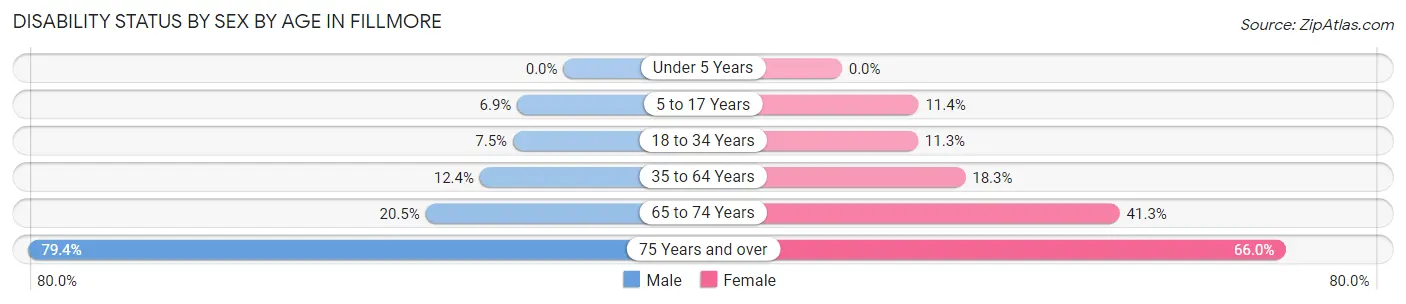
| Age Bracket | Male | Female |
| Under 5 Years | 0 (0.0%) | 0 (0.0%) |
| 5 to 17 Years | 107 (6.9%) | 218 (11.4%) |
| 18 to 34 Years | 157 (7.5%) | 227 (11.3%) |
| 35 to 64 Years | 371 (12.4%) | 580 (18.3%) |
| 65 to 74 Years | 118 (20.4%) | 203 (41.3%) |
| 75 Years and over | 371 (79.4%) | 289 (66.0%) |
Disability Class by Sex by Age in Fillmore
Disability Class: Hearing Difficulty
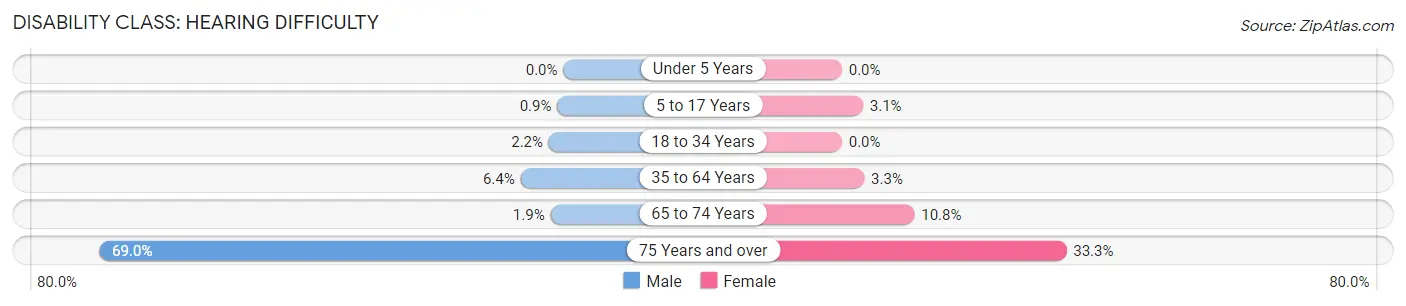
| Age Bracket | Male | Female |
| Under 5 Years | 0 (0.0%) | 0 (0.0%) |
| 5 to 17 Years | 14 (0.9%) | 60 (3.1%) |
| 18 to 34 Years | 45 (2.1%) | 0 (0.0%) |
| 35 to 64 Years | 190 (6.4%) | 105 (3.3%) |
| 65 to 74 Years | 11 (1.9%) | 53 (10.8%) |
| 75 Years and over | 322 (69.0%) | 146 (33.3%) |
Disability Class: Vision Difficulty
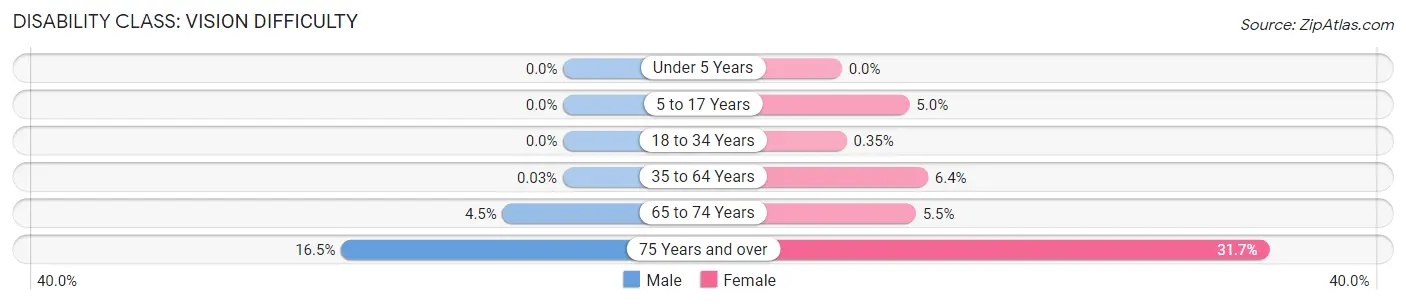
| Age Bracket | Male | Female |
| Under 5 Years | 0 (0.0%) | 0 (0.0%) |
| 5 to 17 Years | 0 (0.0%) | 96 (5.0%) |
| 18 to 34 Years | 0 (0.0%) | 7 (0.4%) |
| 35 to 64 Years | 1 (0.0%) | 202 (6.4%) |
| 65 to 74 Years | 26 (4.5%) | 27 (5.5%) |
| 75 Years and over | 77 (16.5%) | 139 (31.7%) |
Disability Class: Cognitive Difficulty
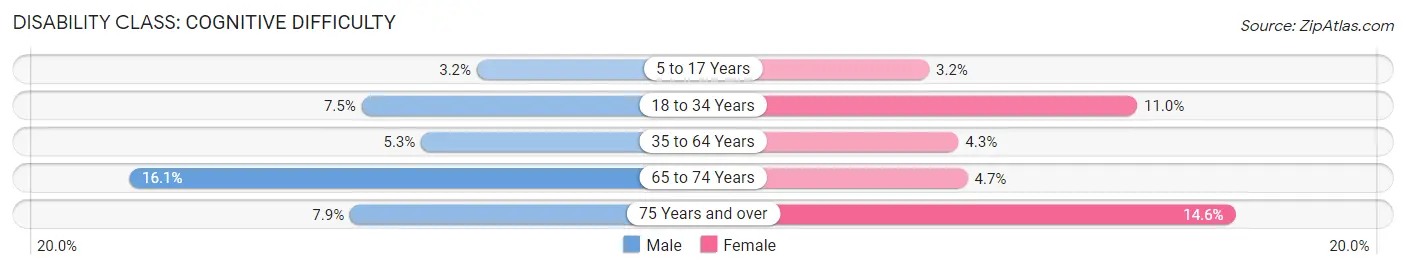
| Age Bracket | Male | Female |
| 5 to 17 Years | 50 (3.2%) | 62 (3.2%) |
| 18 to 34 Years | 157 (7.5%) | 220 (11.0%) |
| 35 to 64 Years | 158 (5.3%) | 137 (4.3%) |
| 65 to 74 Years | 93 (16.1%) | 23 (4.7%) |
| 75 Years and over | 37 (7.9%) | 64 (14.6%) |
Disability Class: Ambulatory Difficulty
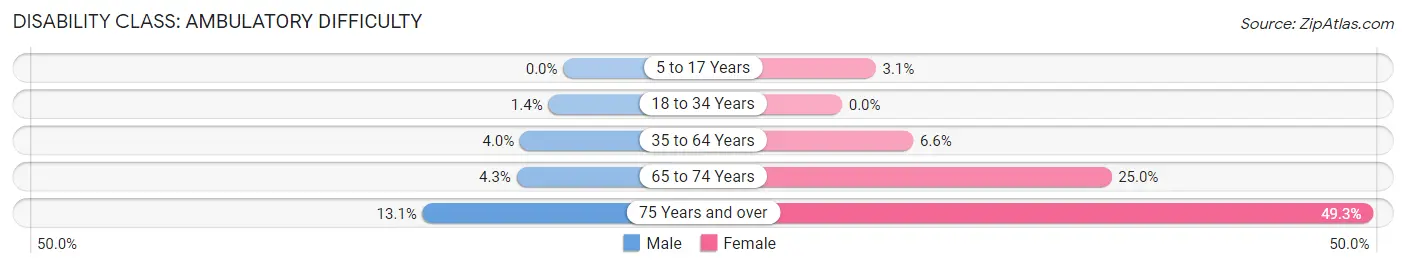
| Age Bracket | Male | Female |
| 5 to 17 Years | 0 (0.0%) | 60 (3.1%) |
| 18 to 34 Years | 29 (1.4%) | 0 (0.0%) |
| 35 to 64 Years | 120 (4.0%) | 209 (6.6%) |
| 65 to 74 Years | 25 (4.3%) | 123 (25.0%) |
| 75 Years and over | 61 (13.1%) | 216 (49.3%) |
Disability Class: Self-Care Difficulty
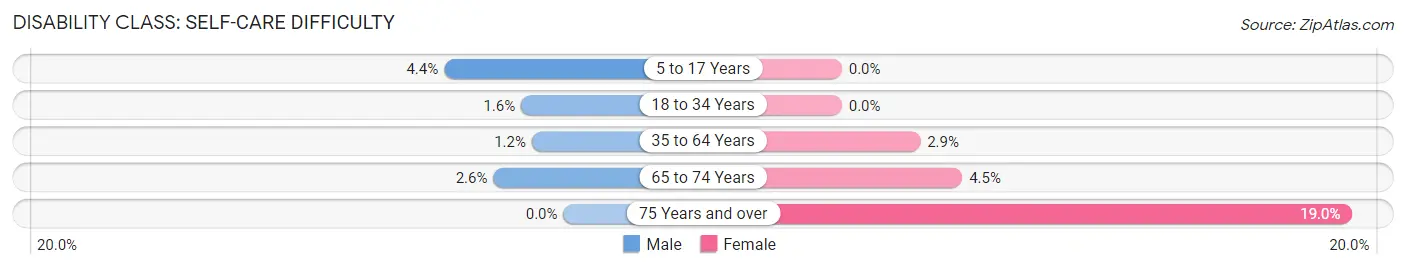
| Age Bracket | Male | Female |
| 5 to 17 Years | 69 (4.4%) | 0 (0.0%) |
| 18 to 34 Years | 33 (1.6%) | 0 (0.0%) |
| 35 to 64 Years | 35 (1.2%) | 92 (2.9%) |
| 65 to 74 Years | 15 (2.6%) | 22 (4.5%) |
| 75 Years and over | 0 (0.0%) | 83 (19.0%) |
Technology Access in Fillmore
Computing Device Access in Fillmore
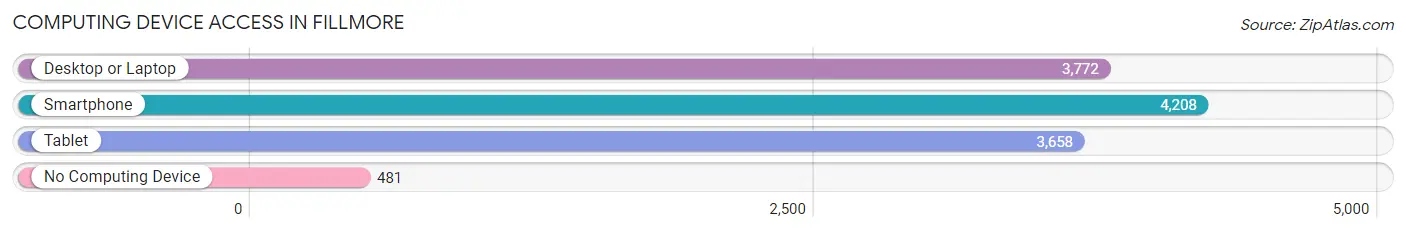
| Device Type | # Households | % Households |
| Desktop or Laptop | 3,772 | 75.7% |
| Smartphone | 4,208 | 84.5% |
| Tablet | 3,658 | 73.4% |
| No Computing Device | 481 | 9.7% |
| Total | 4,982 | 100.0% |
Internet Access in Fillmore
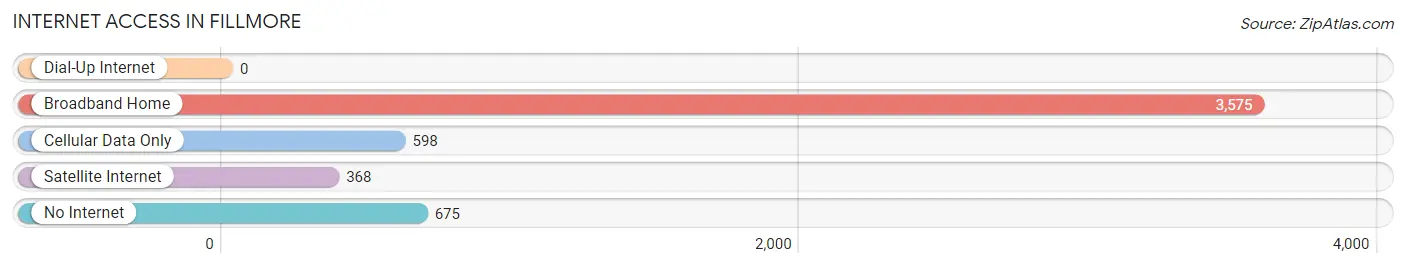
| Internet Type | # Households | % Households |
| Dial-Up Internet | 0 | 0.0% |
| Broadband Home | 3,575 | 71.8% |
| Cellular Data Only | 598 | 12.0% |
| Satellite Internet | 368 | 7.4% |
| No Internet | 675 | 13.6% |
| Total | 4,982 | 100.0% |
Fillmore Summary
Fillmore, California is a small city located in Ventura County, California. It is situated in the Santa Clara River Valley, approximately 10 miles east of the city of Santa Paula. The city has a population of approximately 15,000 people and covers an area of 4.3 square miles.
History
Fillmore was founded in 1888 by Jerome A. Fillmore, a rancher from nearby Santa Paula. He purchased the land from the Southern Pacific Railroad and named the town after himself. The town was incorporated in 1914 and has since grown to become a thriving community.
Geography
Fillmore is located in the Santa Clara River Valley, approximately 10 miles east of the city of Santa Paula. The city is situated at an elevation of 830 feet above sea level and is surrounded by rolling hills and mountains. The climate is semi-arid, with hot summers and mild winters.
Economy
Fillmore’s economy is largely based on agriculture, with the main crops being citrus, avocados, and walnuts. The city is also home to several manufacturing and industrial businesses, including a cement plant, a steel mill, and a paper mill. The city also has a vibrant tourism industry, with many visitors coming to explore the city’s historic downtown area.
Demographics
As of the 2010 census, Fillmore had a population of 15,002 people. The racial makeup of the city was 68.3% White, 0.7% African American, 0.9% Native American, 1.2% Asian, 0.1% Pacific Islander, 25.2% from other races, and 3.6% from two or more races. Hispanic or Latino of any race were 51.2% of the population.
The median income for a household in the city was $45,837, and the median income for a family was $50,919. The per capita income for the city was $20,845. About 17.2% of families and 20.7% of the population were below the poverty line, including 28.2% of those under age 18 and 8.2% of those age 65 or over.
Fillmore is a small city with a rich history and a vibrant economy. It is home to a diverse population and offers a variety of attractions and activities for visitors and residents alike. With its beautiful scenery and friendly atmosphere, Fillmore is a great place to live, work, and play.
Common Questions
What is Per Capita Income in Fillmore?
Per Capita income in Fillmore is $32,110.
What is the Median Family Income in Fillmore?
Median Family Income in Fillmore is $88,608.
What is the Median Household income in Fillmore?
Median Household Income in Fillmore is $85,255.
What is Income or Wage Gap in Fillmore?
Income or Wage Gap in Fillmore is 23.5%.
Women in Fillmore earn 76.5 cents for every dollar earned by a man.
What is Inequality or Gini Index in Fillmore?
Inequality or Gini Index in Fillmore is 0.39.
What is the Total Population of Fillmore?
Total Population of Fillmore is 16,455.
What is the Total Male Population of Fillmore?
Total Male Population of Fillmore is 8,042.
What is the Total Female Population of Fillmore?
Total Female Population of Fillmore is 8,413.
What is the Ratio of Males per 100 Females in Fillmore?
There are 95.59 Males per 100 Females in Fillmore.
What is the Ratio of Females per 100 Males in Fillmore?
There are 104.61 Females per 100 Males in Fillmore.
What is the Median Population Age in Fillmore?
Median Population Age in Fillmore is 35.0 Years.
What is the Average Family Size in Fillmore
Average Family Size in Fillmore is 3.7 People.
What is the Average Household Size in Fillmore
Average Household Size in Fillmore is 3.3 People.
How Large is the Labor Force in Fillmore?
There are 8,366 People in the Labor Forcein in Fillmore.
What is the Percentage of People in the Labor Force in Fillmore?
65.6% of People are in the Labor Force in Fillmore.
What is the Unemployment Rate in Fillmore?
Unemployment Rate in Fillmore is 3.8%.