Ahwahnee, CA Map & Demographics
Ahwahnee Map
Ahwahnee Overview
$41,727
PER CAPITA INCOME
$86,875
AVG FAMILY INCOME
$79,250
AVG HOUSEHOLD INCOME
74.0%
WAGE / INCOME GAP [ % ]
26.0¢/ $1
WAGE / INCOME GAP [ $ ]
0.43
INEQUALITY / GINI INDEX
1,896
TOTAL POPULATION
1,037
MALE POPULATION
859
FEMALE POPULATION
120.72
MALES / 100 FEMALES
82.84
FEMALES / 100 MALES
58.4
MEDIAN AGE
2.6
AVG FAMILY SIZE
2.4
AVG HOUSEHOLD SIZE
851
LABOR FORCE [ PEOPLE ]
49.0%
PERCENT IN LABOR FORCE
6.9%
UNEMPLOYMENT RATE
Ahwahnee Zip Codes
Income in Ahwahnee
Income Overview in Ahwahnee
Per Capita Income in Ahwahnee is $41,727, while median incomes of families and households are $86,875 and $79,250 respectively.
| Characteristic | Number | Measure |
| Per Capita Income | 1,896 | $41,727 |
| Median Family Income | 493 | $86,875 |
| Mean Family Income | 493 | $113,571 |
| Median Household Income | 785 | $79,250 |
| Mean Household Income | 785 | $97,728 |
| Income Deficit | 493 | $0 |
| Wage / Income Gap (%) | 1,896 | 74.00% |
| Wage / Income Gap ($) | 1,896 | 26.00¢ per $1 |
| Gini / Inequality Index | 1,896 | 0.43 |
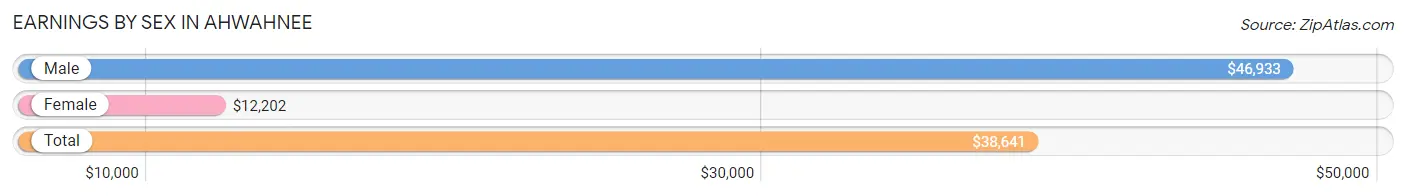
Earnings by Sex in Ahwahnee
Average Earnings in Ahwahnee are $38,641, $46,933 for men and $12,202 for women, a difference of 74.0%.
| Sex | Number | Average Earnings |
| Male | 482 (55.2%) | $46,933 |
| Female | 391 (44.8%) | $12,202 |
| Total | 873 (100.0%) | $38,641 |
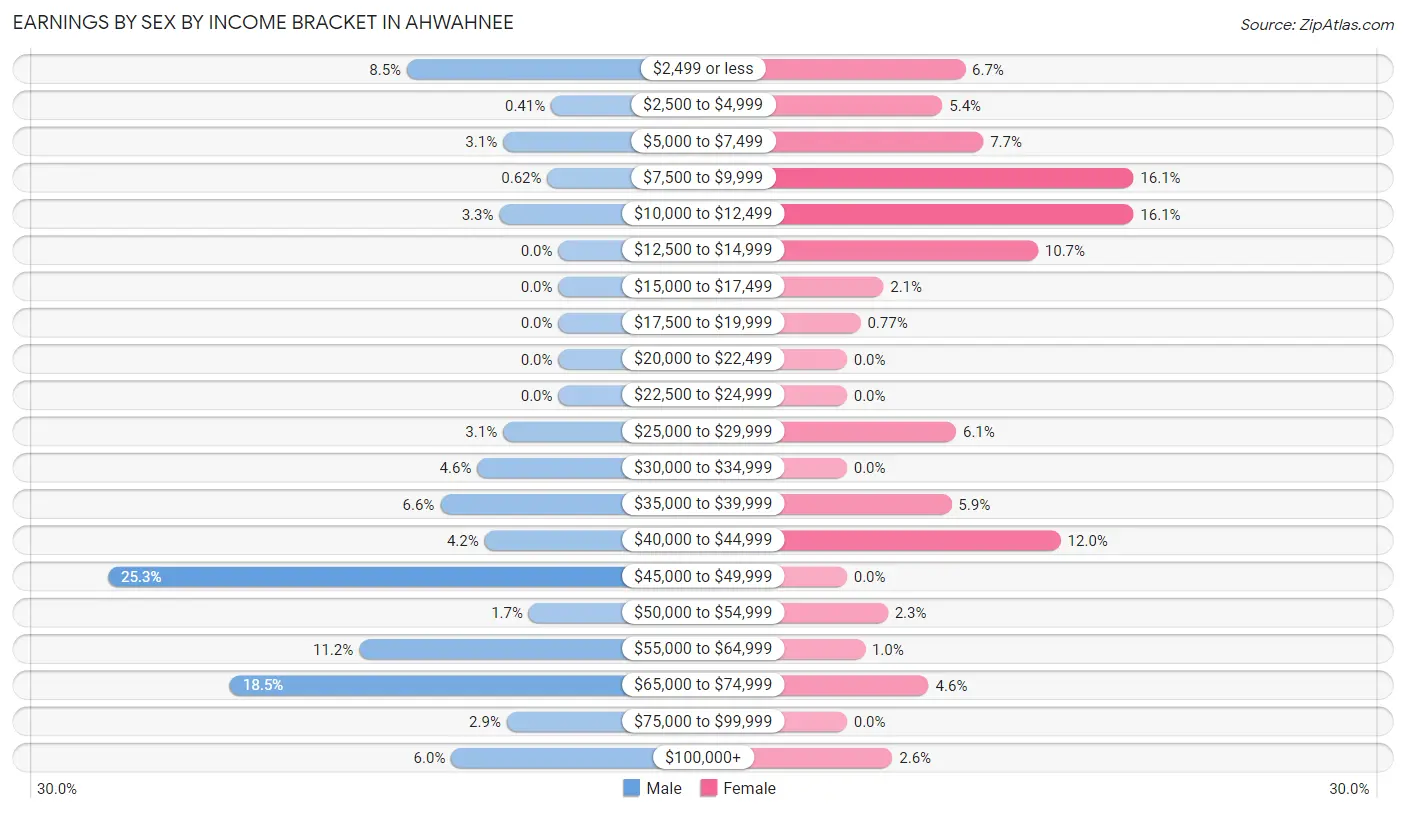
Earnings by Sex by Income Bracket in Ahwahnee
The most common earnings brackets in Ahwahnee are $45,000 to $49,999 for men (122 | 25.3%) and $7,500 to $9,999 for women (63 | 16.1%).
| Income | Male | Female |
| $2,499 or less | 41 (8.5%) | 26 (6.7%) |
| $2,500 to $4,999 | 2 (0.4%) | 21 (5.4%) |
| $5,000 to $7,499 | 15 (3.1%) | 30 (7.7%) |
| $7,500 to $9,999 | 3 (0.6%) | 63 (16.1%) |
| $10,000 to $12,499 | 16 (3.3%) | 63 (16.1%) |
| $12,500 to $14,999 | 0 (0.0%) | 42 (10.7%) |
| $15,000 to $17,499 | 0 (0.0%) | 8 (2.1%) |
| $17,500 to $19,999 | 0 (0.0%) | 3 (0.8%) |
| $20,000 to $22,499 | 0 (0.0%) | 0 (0.0%) |
| $22,500 to $24,999 | 0 (0.0%) | 0 (0.0%) |
| $25,000 to $29,999 | 15 (3.1%) | 24 (6.1%) |
| $30,000 to $34,999 | 22 (4.6%) | 0 (0.0%) |
| $35,000 to $39,999 | 32 (6.6%) | 23 (5.9%) |
| $40,000 to $44,999 | 20 (4.2%) | 47 (12.0%) |
| $45,000 to $49,999 | 122 (25.3%) | 0 (0.0%) |
| $50,000 to $54,999 | 8 (1.7%) | 9 (2.3%) |
| $55,000 to $64,999 | 54 (11.2%) | 4 (1.0%) |
| $65,000 to $74,999 | 89 (18.5%) | 18 (4.6%) |
| $75,000 to $99,999 | 14 (2.9%) | 0 (0.0%) |
| $100,000+ | 29 (6.0%) | 10 (2.6%) |
| Total | 482 (100.0%) | 391 (100.0%) |
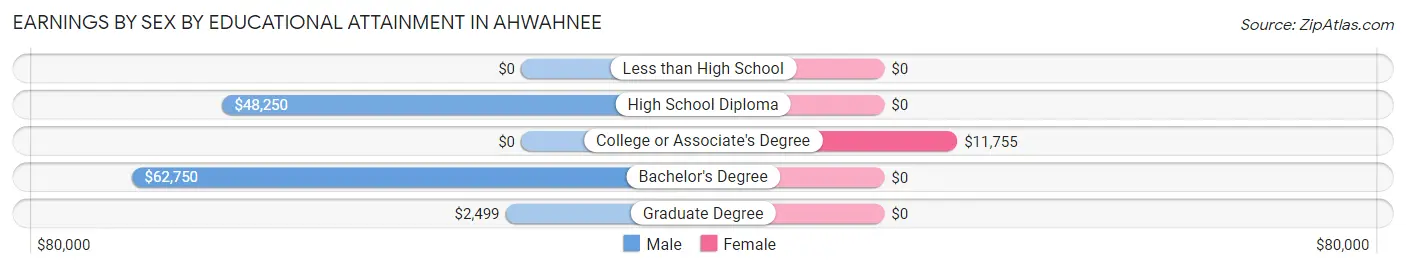
Earnings by Sex by Educational Attainment in Ahwahnee
| Educational Attainment | Male Income | Female Income |
| Less than High School | - | - |
| High School Diploma | $48,250 | $0 |
| College or Associate's Degree | - | - |
| Bachelor's Degree | $62,750 | $0 |
| Graduate Degree | $2,499 | $0 |
| Total | $47,345 | $0 |
Family Income in Ahwahnee
Family Income Brackets in Ahwahnee
According to the Ahwahnee family income data, there are 134 families falling into the $75,000 to $99,999 income range, which is the most common income bracket and makes up 27.2% of all families.
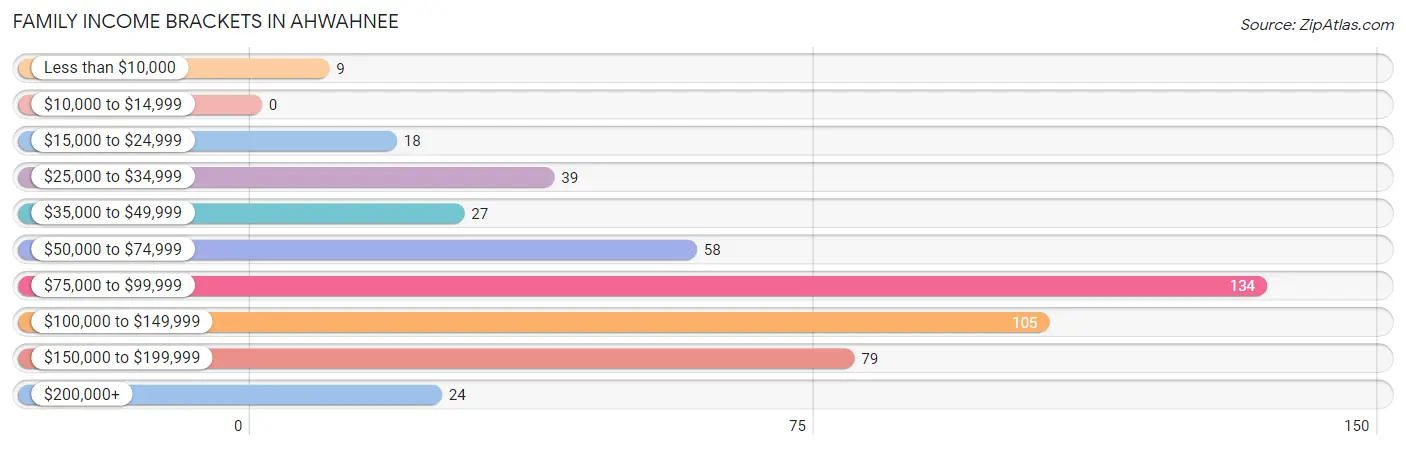
| Income Bracket | # Families | % Families |
| Less than $10,000 | 9 | 1.8% |
| $10,000 to $14,999 | 0 | 0.0% |
| $15,000 to $24,999 | 18 | 3.7% |
| $25,000 to $34,999 | 39 | 7.9% |
| $35,000 to $49,999 | 27 | 5.5% |
| $50,000 to $74,999 | 58 | 11.8% |
| $75,000 to $99,999 | 134 | 27.2% |
| $100,000 to $149,999 | 105 | 21.3% |
| $150,000 to $199,999 | 79 | 16.0% |
| $200,000+ | 24 | 4.9% |
Family Income by Famaliy Size in Ahwahnee
2-person families (334 | 67.7%) account for the highest median family income in Ahwahnee with $99,231 per family, while 2-person families (334 | 67.7%) have the highest median income of $49,616 per family member.
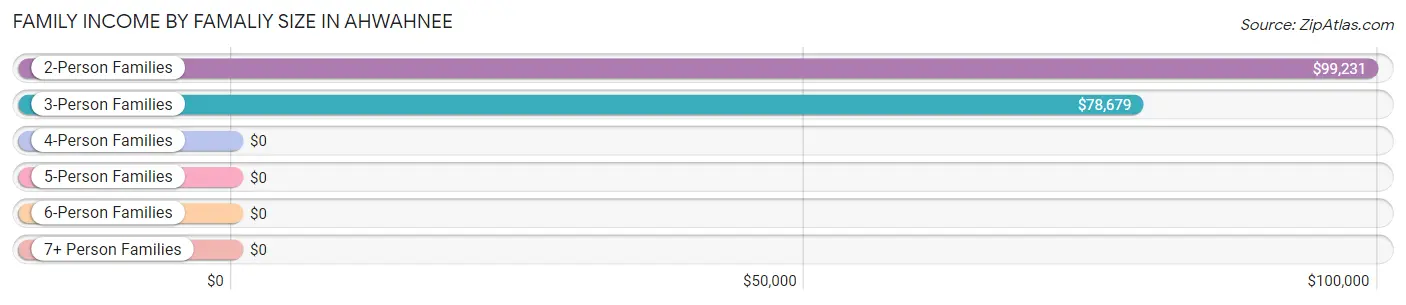
| Income Bracket | # Families | Median Income |
| 2-Person Families | 334 (67.7%) | $99,231 |
| 3-Person Families | 53 (10.7%) | $78,679 |
| 4-Person Families | 80 (16.2%) | $0 |
| 5-Person Families | 26 (5.3%) | $0 |
| 6-Person Families | 0 (0.0%) | $0 |
| 7+ Person Families | 0 (0.0%) | $0 |
| Total | 493 (100.0%) | $86,875 |
Family Income by Number of Earners in Ahwahnee
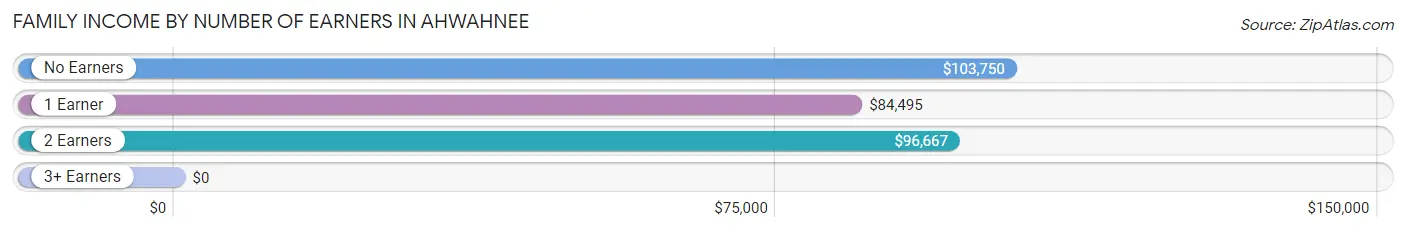
| Number of Earners | # Families | Median Income |
| No Earners | 131 (26.6%) | $103,750 |
| 1 Earner | 199 (40.4%) | $84,495 |
| 2 Earners | 116 (23.5%) | $96,667 |
| 3+ Earners | 47 (9.5%) | $0 |
| Total | 493 (100.0%) | $86,875 |
Household Income in Ahwahnee
Household Income Brackets in Ahwahnee
With 166 households falling in the category, the $50,000 to $74,999 income range is the most frequent in Ahwahnee, accounting for 21.1% of all households.
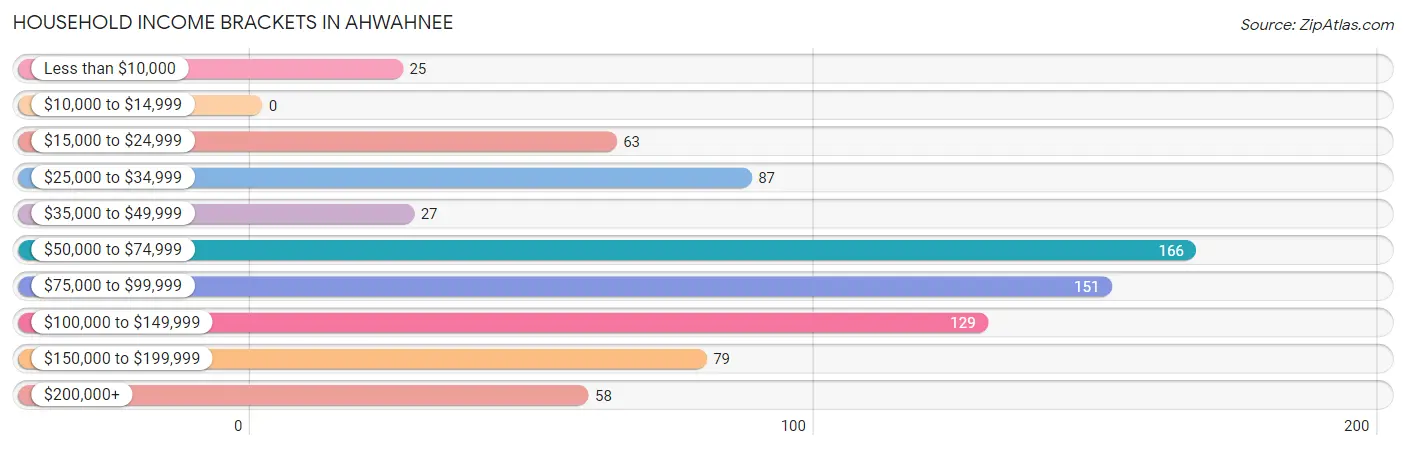
| Income Bracket | # Households | % Households |
| Less than $10,000 | 25 | 3.2% |
| $10,000 to $14,999 | 0 | 0.0% |
| $15,000 to $24,999 | 63 | 8.0% |
| $25,000 to $34,999 | 87 | 11.1% |
| $35,000 to $49,999 | 27 | 3.4% |
| $50,000 to $74,999 | 166 | 21.1% |
| $75,000 to $99,999 | 151 | 19.2% |
| $100,000 to $149,999 | 129 | 16.4% |
| $150,000 to $199,999 | 79 | 10.1% |
| $200,000+ | 58 | 7.4% |
Household Income by Householder Age in Ahwahnee
The median household income in Ahwahnee is $79,250, with the highest median household income of $82,926 found in the 65+ years age bracket for the primary householder. A total of 460 households (58.6%) fall into this category.
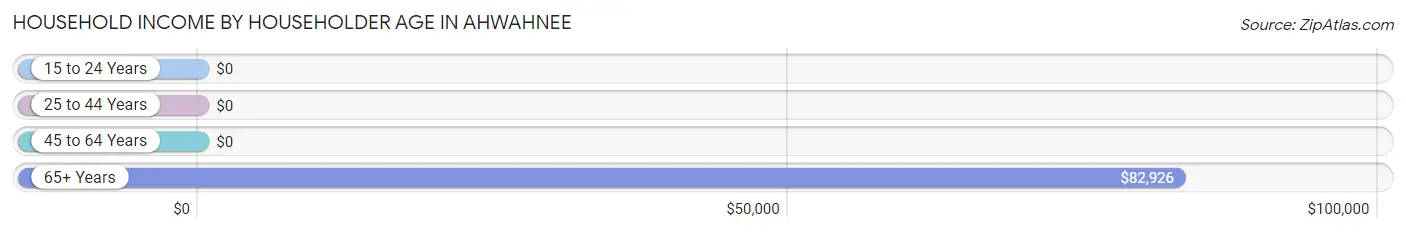
| Income Bracket | # Households | Median Income |
| 15 to 24 Years | 0 (0.0%) | $0 |
| 25 to 44 Years | 125 (15.9%) | $0 |
| 45 to 64 Years | 200 (25.5%) | $0 |
| 65+ Years | 460 (58.6%) | $82,926 |
| Total | 785 (100.0%) | $79,250 |
Poverty in Ahwahnee
Income Below Poverty by Sex and Age in Ahwahnee
With 4.8% poverty level for males and 12.0% for females among the residents of Ahwahnee, 16 and 17 year old males and 35 to 44 year old females are the most vulnerable to poverty, with 8 males (100.0%) and 47 females (71.2%) in their respective age groups living below the poverty level.
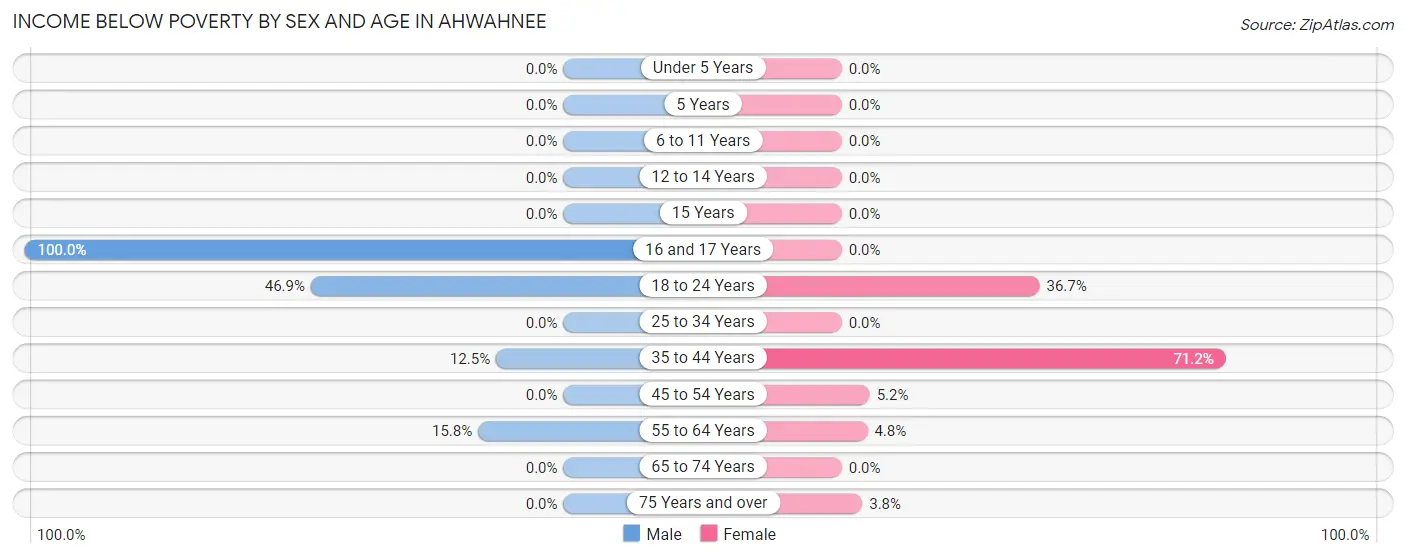
| Age Bracket | Male | Female |
| Under 5 Years | 0 (0.0%) | 0 (0.0%) |
| 5 Years | 0 (0.0%) | 0 (0.0%) |
| 6 to 11 Years | 0 (0.0%) | 0 (0.0%) |
| 12 to 14 Years | 0 (0.0%) | 0 (0.0%) |
| 15 Years | 0 (0.0%) | 0 (0.0%) |
| 16 and 17 Years | 8 (100.0%) | 0 (0.0%) |
| 18 to 24 Years | 15 (46.9%) | 40 (36.7%) |
| 25 to 34 Years | 0 (0.0%) | 0 (0.0%) |
| 35 to 44 Years | 8 (12.5%) | 47 (71.2%) |
| 45 to 54 Years | 0 (0.0%) | 4 (5.2%) |
| 55 to 64 Years | 19 (15.8%) | 5 (4.8%) |
| 65 to 74 Years | 0 (0.0%) | 0 (0.0%) |
| 75 Years and over | 0 (0.0%) | 6 (3.8%) |
| Total | 50 (4.8%) | 102 (12.0%) |
Income Above Poverty by Sex and Age in Ahwahnee
According to the poverty statistics in Ahwahnee, males aged under 5 years and females aged under 5 years are the age groups that are most secure financially, with 100.0% of males and 100.0% of females in these age groups living above the poverty line.
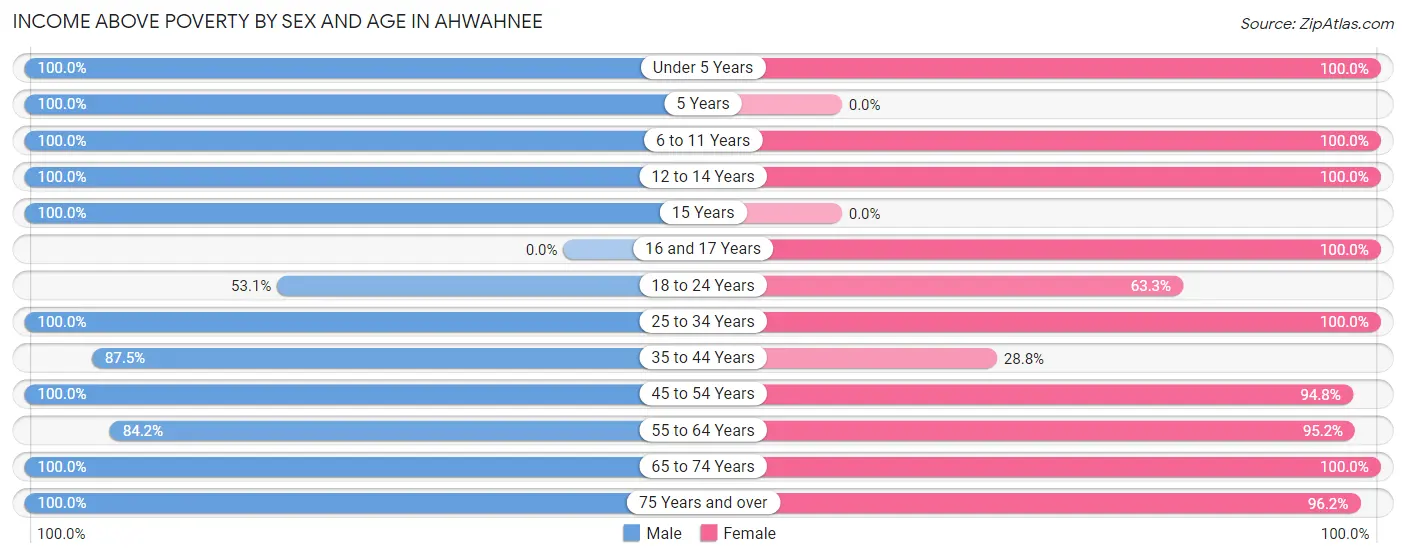
| Age Bracket | Male | Female |
| Under 5 Years | 31 (100.0%) | 39 (100.0%) |
| 5 Years | 20 (100.0%) | 0 (0.0%) |
| 6 to 11 Years | 20 (100.0%) | 11 (100.0%) |
| 12 to 14 Years | 14 (100.0%) | 18 (100.0%) |
| 15 Years | 7 (100.0%) | 0 (0.0%) |
| 16 and 17 Years | 0 (0.0%) | 34 (100.0%) |
| 18 to 24 Years | 17 (53.1%) | 69 (63.3%) |
| 25 to 34 Years | 250 (100.0%) | 29 (100.0%) |
| 35 to 44 Years | 56 (87.5%) | 19 (28.8%) |
| 45 to 54 Years | 35 (100.0%) | 73 (94.8%) |
| 55 to 64 Years | 101 (84.2%) | 100 (95.2%) |
| 65 to 74 Years | 301 (100.0%) | 206 (100.0%) |
| 75 Years and over | 132 (100.0%) | 152 (96.2%) |
| Total | 984 (95.2%) | 750 (88.0%) |
Income Below Poverty Among Married-Couple Families in Ahwahnee
The poverty statistics for married-couple families in Ahwahnee show that 2.6% or 12 of the total 458 families live below the poverty line. Families with 1 or 2 children have the highest poverty rate of 7.3%, comprising of 9 families. On the other hand, families with 3 or 4 children have the lowest poverty rate of 0.0%, which includes 0 families.
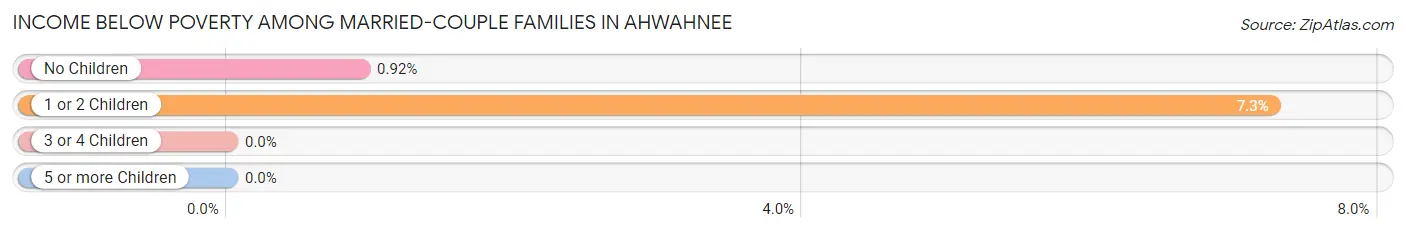
| Children | Above Poverty | Below Poverty |
| No Children | 323 (99.1%) | 3 (0.9%) |
| 1 or 2 Children | 115 (92.7%) | 9 (7.3%) |
| 3 or 4 Children | 8 (100.0%) | 0 (0.0%) |
| 5 or more Children | 0 (0.0%) | 0 (0.0%) |
| Total | 446 (97.4%) | 12 (2.6%) |
Income Below Poverty Among Single-Parent Households in Ahwahnee
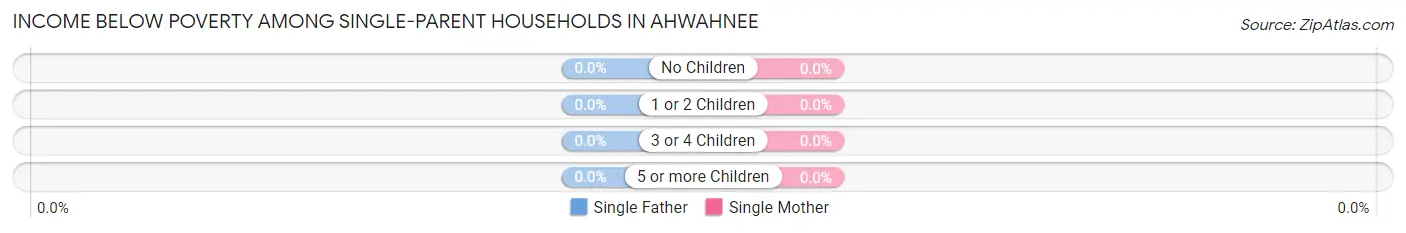
| Children | Single Father | Single Mother |
| No Children | 0 (0.0%) | 0 (0.0%) |
| 1 or 2 Children | 0 (0.0%) | 0 (0.0%) |
| 3 or 4 Children | 0 (0.0%) | 0 (0.0%) |
| 5 or more Children | 0 (0.0%) | 0 (0.0%) |
| Total | 0 (0.0%) | 0 (0.0%) |
Income Below Poverty Among Married-Couple vs Single-Parent Households in Ahwahnee
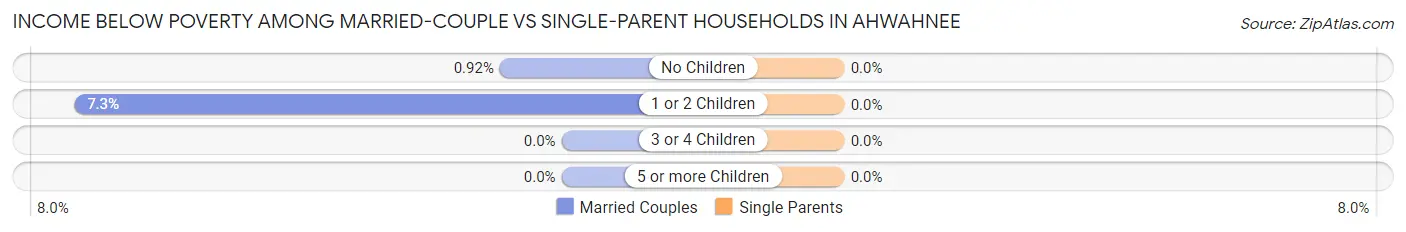
| Children | Married-Couple Families | Single-Parent Households |
| No Children | 3 (0.9%) | 0 (0.0%) |
| 1 or 2 Children | 9 (7.3%) | 0 (0.0%) |
| 3 or 4 Children | 0 (0.0%) | 0 (0.0%) |
| 5 or more Children | 0 (0.0%) | 0 (0.0%) |
| Total | 12 (2.6%) | 0 (0.0%) |
Race in Ahwahnee
The most populous races in Ahwahnee are White / Caucasian (1,610 | 84.9%), Hispanic or Latino (228 | 12.0%), and Two or more Races (126 | 6.7%).
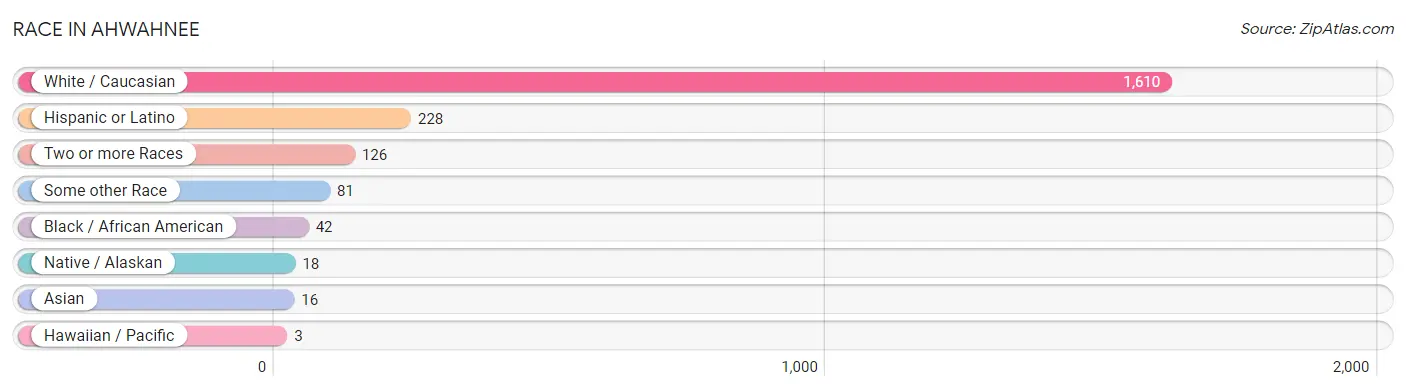
| Race | # Population | % Population |
| Asian | 16 | 0.8% |
| Black / African American | 42 | 2.2% |
| Hawaiian / Pacific | 3 | 0.2% |
| Hispanic or Latino | 228 | 12.0% |
| Native / Alaskan | 18 | 0.9% |
| White / Caucasian | 1,610 | 84.9% |
| Two or more Races | 126 | 6.7% |
| Some other Race | 81 | 4.3% |
| Total | 1,896 | 100.0% |
Ancestry in Ahwahnee
The most populous ancestries reported in Ahwahnee are English (241 | 12.7%), German (223 | 11.8%), Irish (222 | 11.7%), Italian (151 | 8.0%), and European (147 | 7.7%), together accounting for 51.9% of all Ahwahnee residents.
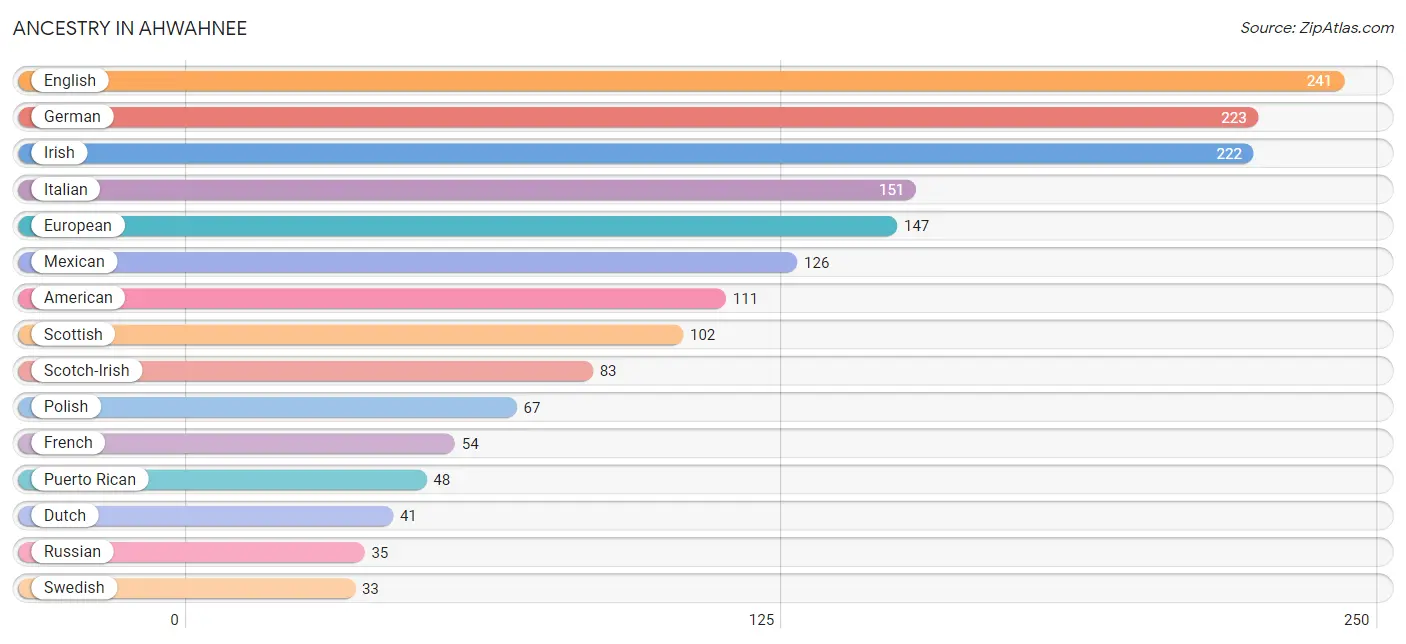
| Ancestry | # Population | % Population |
| American | 111 | 5.9% |
| Cherokee | 11 | 0.6% |
| Czech | 10 | 0.5% |
| Danish | 3 | 0.2% |
| Dominican | 20 | 1.1% |
| Dutch | 41 | 2.2% |
| English | 241 | 12.7% |
| European | 147 | 7.7% |
| French | 54 | 2.9% |
| French Canadian | 29 | 1.5% |
| German | 223 | 11.8% |
| Icelander | 23 | 1.2% |
| Irish | 222 | 11.7% |
| Italian | 151 | 8.0% |
| Korean | 16 | 0.8% |
| Mexican | 126 | 6.7% |
| Mexican American Indian | 6 | 0.3% |
| Native Hawaiian | 3 | 0.2% |
| Polish | 67 | 3.5% |
| Portuguese | 30 | 1.6% |
| Puerto Rican | 48 | 2.5% |
| Russian | 35 | 1.8% |
| Scandinavian | 20 | 1.1% |
| Scotch-Irish | 83 | 4.4% |
| Scottish | 102 | 5.4% |
| South American | 6 | 0.3% |
| Spaniard | 28 | 1.5% |
| Swedish | 33 | 1.7% |
| Swiss | 16 | 0.8% |
| Venezuelan | 6 | 0.3% |
| Welsh | 12 | 0.6% |
| Yugoslavian | 16 | 0.8% | View All 32 Rows |
Immigrants in Ahwahnee
The most numerous immigrant groups reported in Ahwahnee came from Central America (20 | 1.1%), Latin America (20 | 1.1%), Mexico (20 | 1.1%), Asia (16 | 0.8%), and Philippines (16 | 0.8%), together accounting for 4.8% of all Ahwahnee residents.
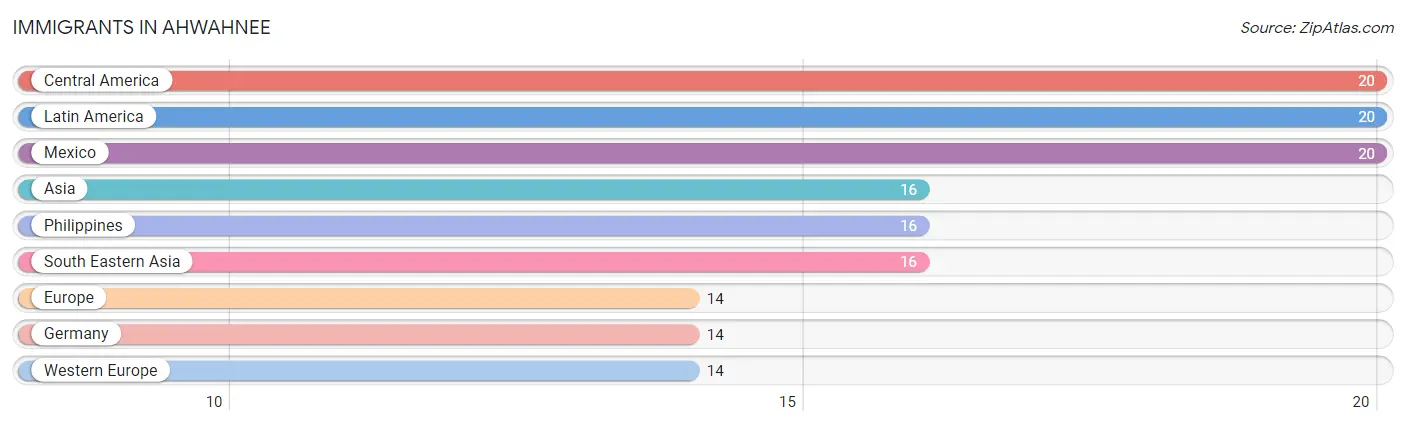
| Immigration Origin | # Population | % Population |
| Asia | 16 | 0.8% |
| Central America | 20 | 1.1% |
| Europe | 14 | 0.7% |
| Germany | 14 | 0.7% |
| Latin America | 20 | 1.1% |
| Mexico | 20 | 1.1% |
| Philippines | 16 | 0.8% |
| South Eastern Asia | 16 | 0.8% |
| Western Europe | 14 | 0.7% | View All 9 Rows |
Sex and Age in Ahwahnee
Sex and Age in Ahwahnee
The most populous age groups in Ahwahnee are 25 to 29 Years (231 | 22.3%) for men and 70 to 74 Years (122 | 14.2%) for women.
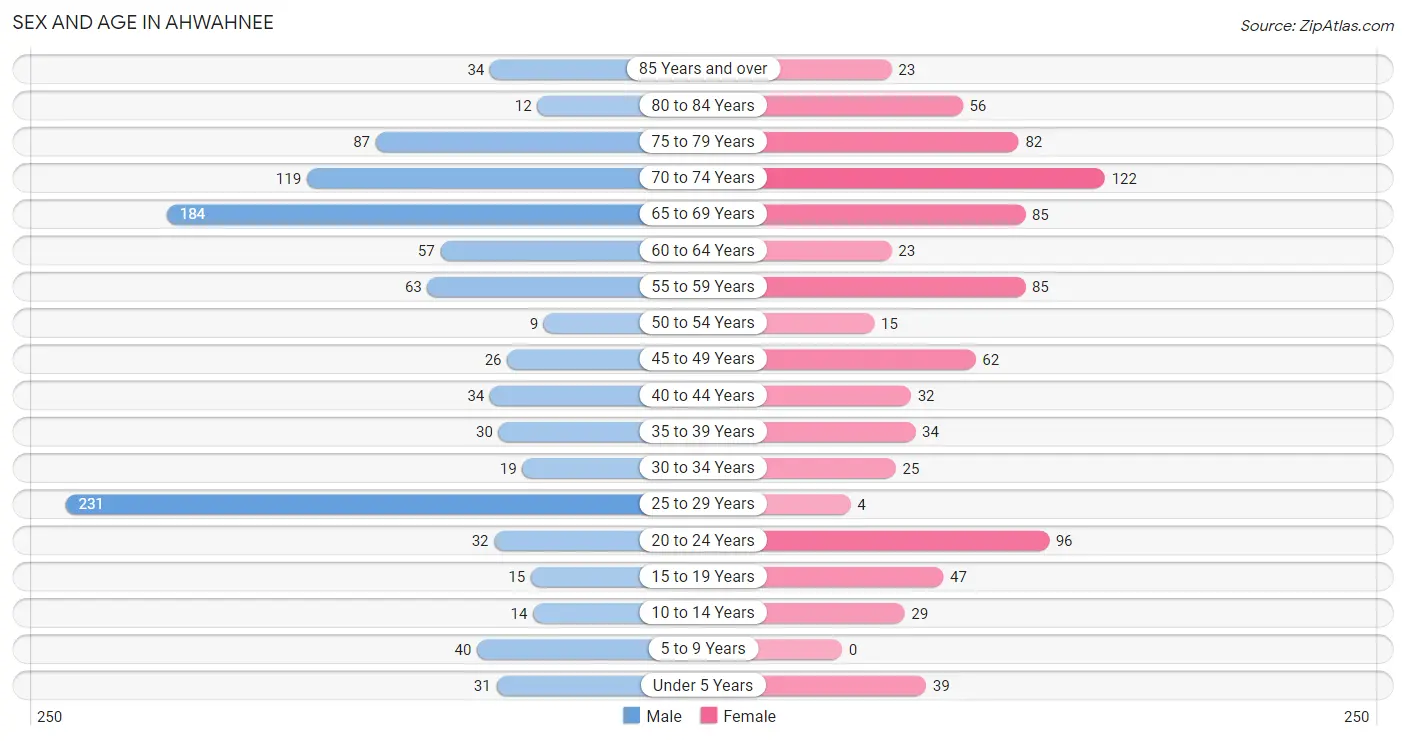
| Age Bracket | Male | Female |
| Under 5 Years | 31 (3.0%) | 39 (4.5%) |
| 5 to 9 Years | 40 (3.9%) | 0 (0.0%) |
| 10 to 14 Years | 14 (1.3%) | 29 (3.4%) |
| 15 to 19 Years | 15 (1.5%) | 47 (5.5%) |
| 20 to 24 Years | 32 (3.1%) | 96 (11.2%) |
| 25 to 29 Years | 231 (22.3%) | 4 (0.5%) |
| 30 to 34 Years | 19 (1.8%) | 25 (2.9%) |
| 35 to 39 Years | 30 (2.9%) | 34 (4.0%) |
| 40 to 44 Years | 34 (3.3%) | 32 (3.7%) |
| 45 to 49 Years | 26 (2.5%) | 62 (7.2%) |
| 50 to 54 Years | 9 (0.9%) | 15 (1.8%) |
| 55 to 59 Years | 63 (6.1%) | 85 (9.9%) |
| 60 to 64 Years | 57 (5.5%) | 23 (2.7%) |
| 65 to 69 Years | 184 (17.7%) | 85 (9.9%) |
| 70 to 74 Years | 119 (11.5%) | 122 (14.2%) |
| 75 to 79 Years | 87 (8.4%) | 82 (9.6%) |
| 80 to 84 Years | 12 (1.2%) | 56 (6.5%) |
| 85 Years and over | 34 (3.3%) | 23 (2.7%) |
| Total | 1,037 (100.0%) | 859 (100.0%) |
Families and Households in Ahwahnee
Median Family Size in Ahwahnee
The median family size in Ahwahnee is 2.63 persons per family, with single male/father families (9 | 1.8%) accounting for the largest median family size of 8 persons per family. On the other hand, married-couple families (458 | 92.9%) represent the smallest median family size with 2.51 persons per family.
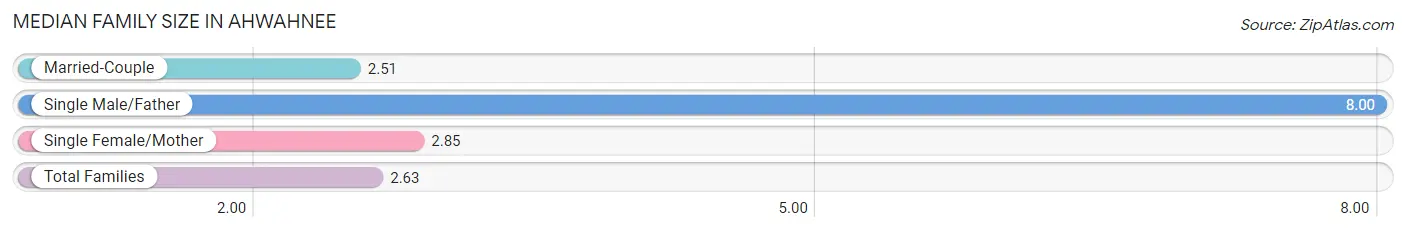
| Family Type | # Families | Family Size |
| Married-Couple | 458 (92.9%) | 2.51 |
| Single Male/Father | 9 (1.8%) | 8.00 |
| Single Female/Mother | 26 (5.3%) | 2.85 |
| Total Families | 493 (100.0%) | 2.63 |
Median Household Size in Ahwahnee
The median household size in Ahwahnee is 2.38 persons per household, with single male/father households (9 | 1.1%) accounting for the largest median household size of 15.67 persons per household. non-family households (292 | 37.2%) represent the smallest median household size with 1.66 persons per household.
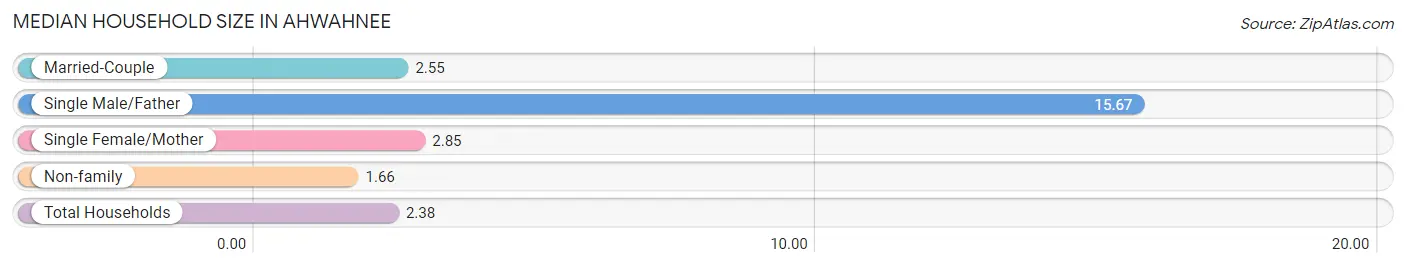
| Household Type | # Households | Household Size |
| Married-Couple | 458 (58.3%) | 2.55 |
| Single Male/Father | 9 (1.1%) | 15.67 |
| Single Female/Mother | 26 (3.3%) | 2.85 |
| Non-family | 292 (37.2%) | 1.66 |
| Total Households | 785 (100.0%) | 2.38 |
Household Size by Marriage Status in Ahwahnee
Out of a total of 785 households in Ahwahnee, 493 (62.8%) are family households, while 292 (37.2%) are nonfamily households. The most numerous type of family households are 2-person households, comprising 334, and the most common type of nonfamily households are 1-person households, comprising 207.
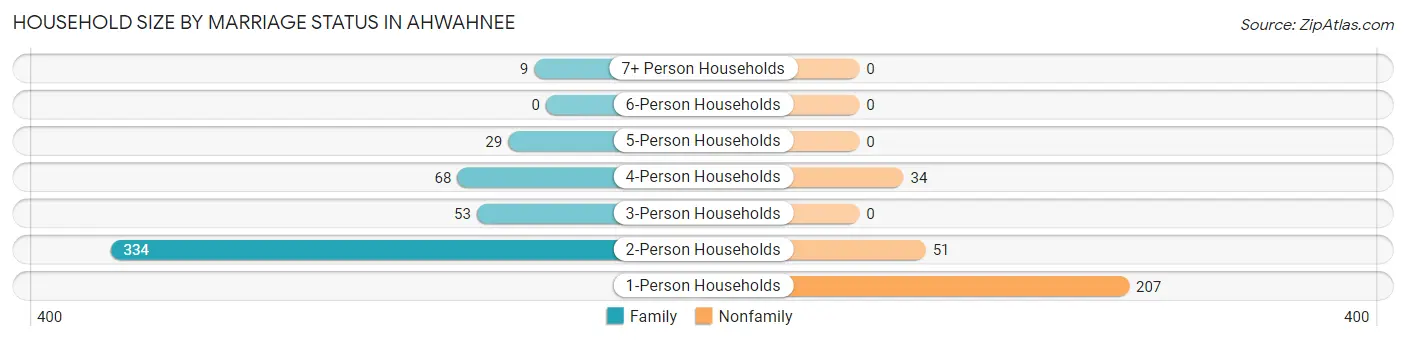
| Household Size | Family Households | Nonfamily Households |
| 1-Person Households | - | 207 (26.4%) |
| 2-Person Households | 334 (42.5%) | 51 (6.5%) |
| 3-Person Households | 53 (6.8%) | 0 (0.0%) |
| 4-Person Households | 68 (8.7%) | 34 (4.3%) |
| 5-Person Households | 29 (3.7%) | 0 (0.0%) |
| 6-Person Households | 0 (0.0%) | 0 (0.0%) |
| 7+ Person Households | 9 (1.1%) | 0 (0.0%) |
| Total | 493 (62.8%) | 292 (37.2%) |
Female Fertility in Ahwahnee
Fertility by Age in Ahwahnee
Average fertility rate in Ahwahnee is 121.0 births per 1,000 women. Women in the age bracket of 20 to 34 years have the highest fertility rate with 296.0 births per 1,000 women. Women in the age bracket of 20 to 34 years acount for 100.0% of all women with births.
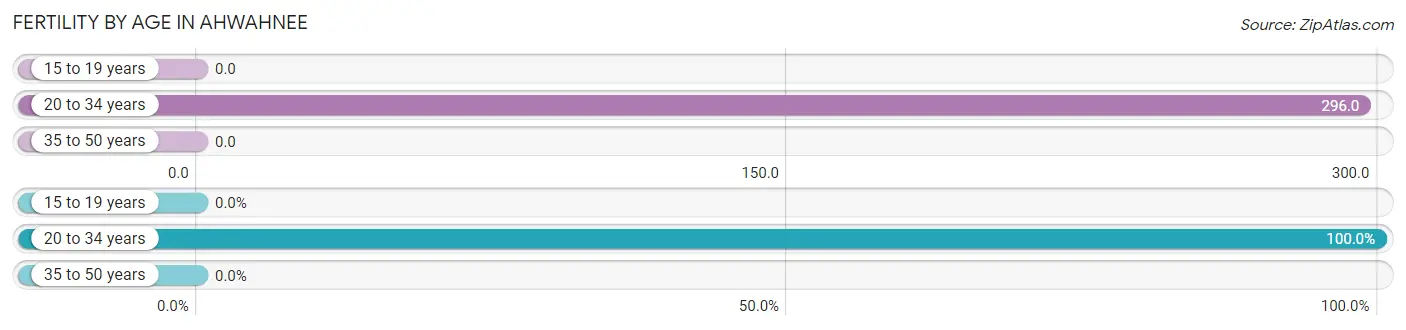
| Age Bracket | Women with Births | Births / 1,000 Women |
| 15 to 19 years | 0 (0.0%) | 0.0 |
| 20 to 34 years | 37 (100.0%) | 296.0 |
| 35 to 50 years | 0 (0.0%) | 0.0 |
| Total | 37 (100.0%) | 121.0 |
Fertility by Age by Marriage Status in Ahwahnee
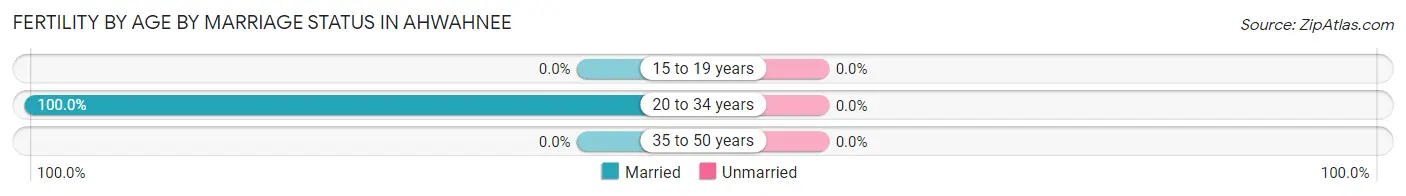
| Age Bracket | Married | Unmarried |
| 15 to 19 years | 0 (0.0%) | 0 (0.0%) |
| 20 to 34 years | 37 (100.0%) | 0 (0.0%) |
| 35 to 50 years | 0 (0.0%) | 0 (0.0%) |
| Total | 37 (100.0%) | 0 (0.0%) |
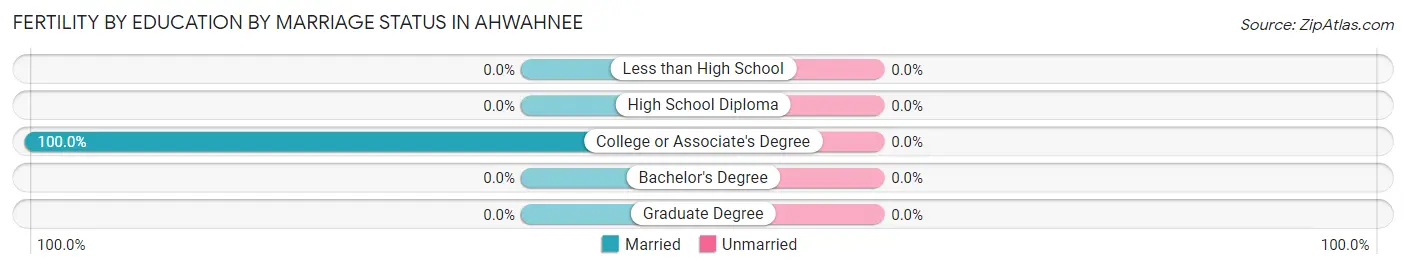
Fertility by Education in Ahwahnee
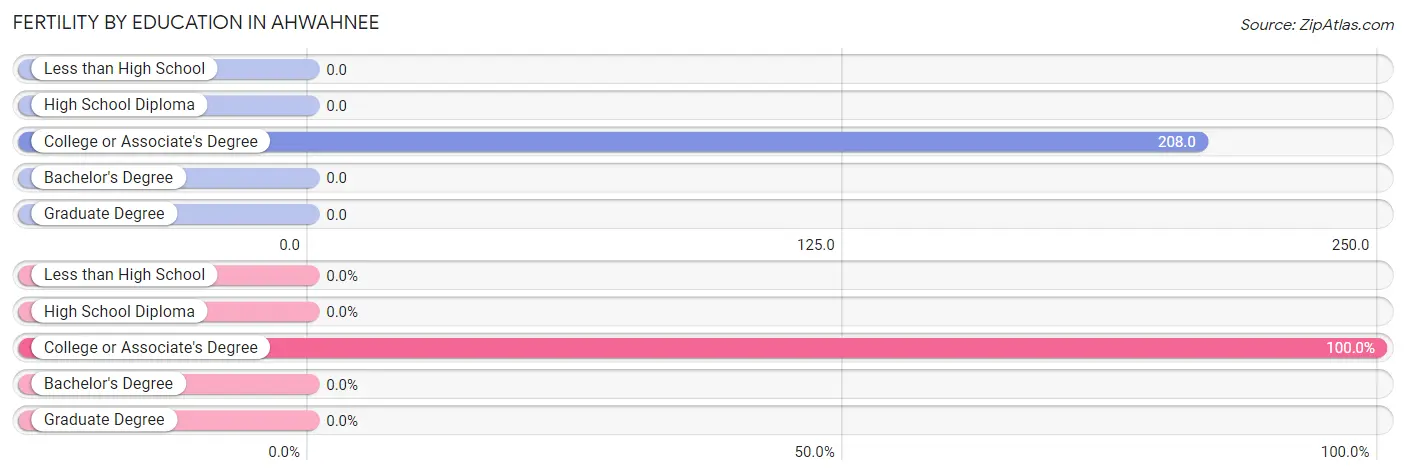
| Educational Attainment | Women with Births | Births / 1,000 Women |
| Less than High School | 0 (0.0%) | 0.0 |
| High School Diploma | 0 (0.0%) | 0.0 |
| College or Associate's Degree | 37 (100.0%) | 208.0 |
| Bachelor's Degree | 0 (0.0%) | 0.0 |
| Graduate Degree | 0 (0.0%) | 0.0 |
| Total | 37 (100.0%) | 121.0 |
Fertility by Education by Marriage Status in Ahwahnee
| Educational Attainment | Married | Unmarried |
| Less than High School | 0 (0.0%) | 0 (0.0%) |
| High School Diploma | 0 (0.0%) | 0 (0.0%) |
| College or Associate's Degree | 37 (100.0%) | 0 (0.0%) |
| Bachelor's Degree | 0 (0.0%) | 0 (0.0%) |
| Graduate Degree | 0 (0.0%) | 0 (0.0%) |
| Total | 37 (100.0%) | 0 (0.0%) |
Employment Characteristics in Ahwahnee
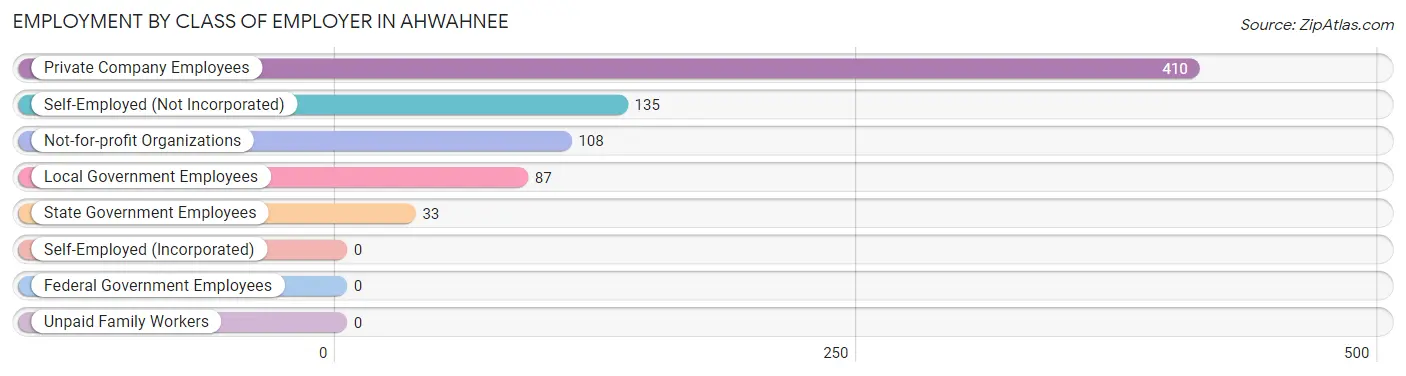
Employment by Class of Employer in Ahwahnee
Among the 773 employed individuals in Ahwahnee, private company employees (410 | 53.0%), self-employed (not incorporated) (135 | 17.5%), and not-for-profit organizations (108 | 14.0%) make up the most common classes of employment.
| Employer Class | # Employees | % Employees |
| Private Company Employees | 410 | 53.0% |
| Self-Employed (Incorporated) | 0 | 0.0% |
| Self-Employed (Not Incorporated) | 135 | 17.5% |
| Not-for-profit Organizations | 108 | 14.0% |
| Local Government Employees | 87 | 11.3% |
| State Government Employees | 33 | 4.3% |
| Federal Government Employees | 0 | 0.0% |
| Unpaid Family Workers | 0 | 0.0% |
| Total | 773 | 100.0% |
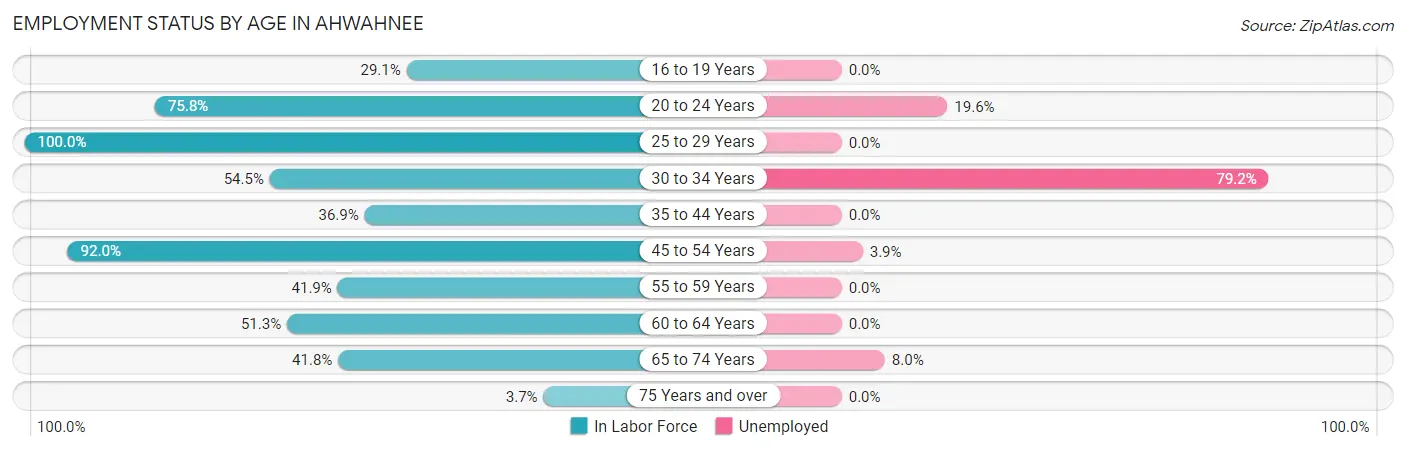
Employment Status by Age in Ahwahnee
According to the labor force statistics for Ahwahnee, out of the total population over 16 years of age (1,736), 49.0% or 851 individuals are in the labor force, with 6.9% or 59 of them unemployed. The age group with the highest labor force participation rate is 25 to 29 years, with 100.0% or 235 individuals in the labor force. Within the labor force, the 30 to 34 years age range has the highest percentage of unemployed individuals, with 79.2% or 19 of them being unemployed.
| Age Bracket | In Labor Force | Unemployed |
| 16 to 19 Years | 16 (29.1%) | 0 (0.0%) |
| 20 to 24 Years | 97 (75.8%) | 19 (19.6%) |
| 25 to 29 Years | 235 (100.0%) | 0 (0.0%) |
| 30 to 34 Years | 24 (54.5%) | 19 (79.2%) |
| 35 to 44 Years | 48 (36.9%) | 0 (0.0%) |
| 45 to 54 Years | 103 (92.0%) | 4 (3.9%) |
| 55 to 59 Years | 62 (41.9%) | 0 (0.0%) |
| 60 to 64 Years | 41 (51.3%) | 0 (0.0%) |
| 65 to 74 Years | 213 (41.8%) | 17 (8.0%) |
| 75 Years and over | 11 (3.7%) | 0 (0.0%) |
| Total | 851 (49.0%) | 59 (6.9%) |
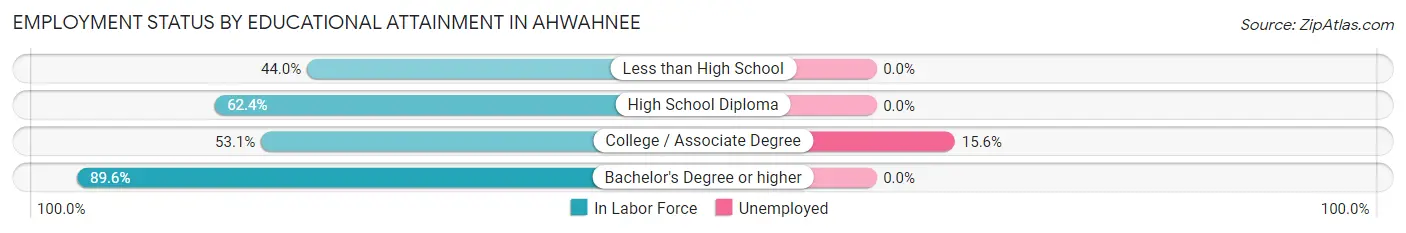
Employment Status by Educational Attainment in Ahwahnee
According to labor force statistics for Ahwahnee, 68.5% of individuals (513) out of the total population between 25 and 64 years of age (749) are in the labor force, with 4.5% or 23 of them being unemployed. The group with the highest labor force participation rate are those with the educational attainment of bachelor's degree or higher, with 89.6% or 266 individuals in the labor force. Within the labor force, individuals with college / associate degree education have the highest percentage of unemployment, with 15.6% or 23 of them being unemployed.
| Educational Attainment | In Labor Force | Unemployed |
| Less than High School | 22 (44.0%) | 0 (0.0%) |
| High School Diploma | 78 (62.4%) | 0 (0.0%) |
| College / Associate Degree | 147 (53.1%) | 43 (15.6%) |
| Bachelor's Degree or higher | 266 (89.6%) | 0 (0.0%) |
| Total | 513 (68.5%) | 34 (4.5%) |
Employment Occupations by Sex in Ahwahnee
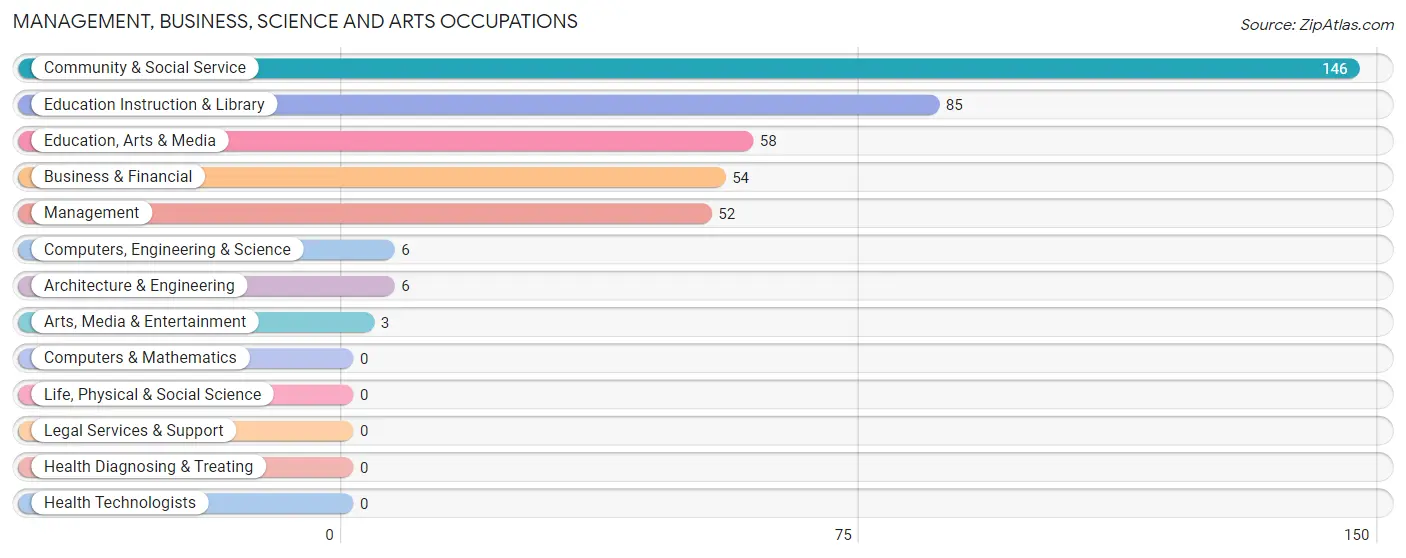
Management, Business, Science and Arts Occupations
The most common Management, Business, Science and Arts occupations in Ahwahnee are Community & Social Service (146 | 18.5%), Education Instruction & Library (85 | 10.7%), Education, Arts & Media (58 | 7.3%), Business & Financial (54 | 6.8%), and Management (52 | 6.6%).
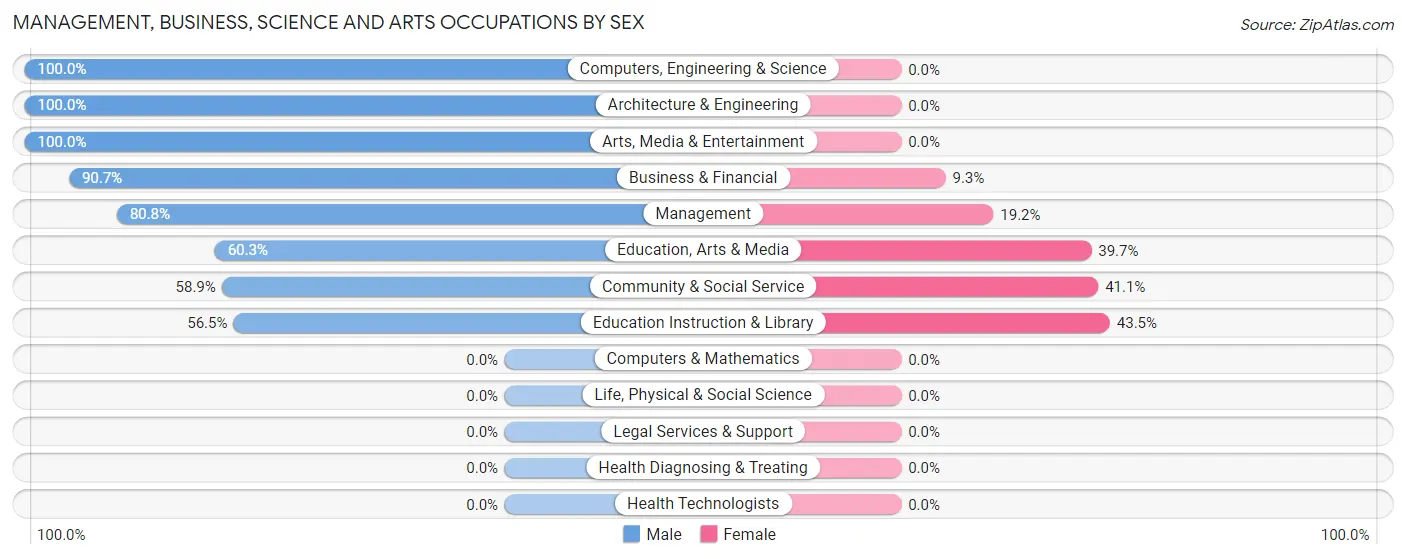
Management, Business, Science and Arts Occupations by Sex
Within the Management, Business, Science and Arts occupations in Ahwahnee, the most male-oriented occupations are Computers, Engineering & Science (100.0%), Architecture & Engineering (100.0%), and Arts, Media & Entertainment (100.0%), while the most female-oriented occupations are Education Instruction & Library (43.5%), Community & Social Service (41.1%), and Education, Arts & Media (39.7%).
| Occupation | Male | Female |
| Management | 42 (80.8%) | 10 (19.2%) |
| Business & Financial | 49 (90.7%) | 5 (9.3%) |
| Computers, Engineering & Science | 6 (100.0%) | 0 (0.0%) |
| Computers & Mathematics | 0 (0.0%) | 0 (0.0%) |
| Architecture & Engineering | 6 (100.0%) | 0 (0.0%) |
| Life, Physical & Social Science | 0 (0.0%) | 0 (0.0%) |
| Community & Social Service | 86 (58.9%) | 60 (41.1%) |
| Education, Arts & Media | 35 (60.3%) | 23 (39.7%) |
| Legal Services & Support | 0 (0.0%) | 0 (0.0%) |
| Education Instruction & Library | 48 (56.5%) | 37 (43.5%) |
| Arts, Media & Entertainment | 3 (100.0%) | 0 (0.0%) |
| Health Diagnosing & Treating | 0 (0.0%) | 0 (0.0%) |
| Health Technologists | 0 (0.0%) | 0 (0.0%) |
| Total (Category) | 183 (70.9%) | 75 (29.1%) |
| Total (Overall) | 422 (53.3%) | 369 (46.7%) |
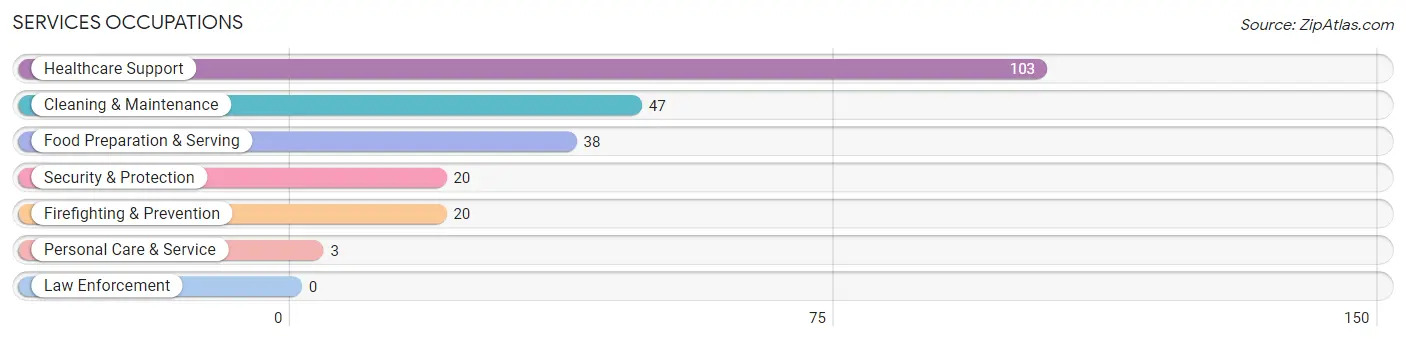
Services Occupations
The most common Services occupations in Ahwahnee are Healthcare Support (103 | 13.0%), Cleaning & Maintenance (47 | 5.9%), Food Preparation & Serving (38 | 4.8%), Security & Protection (20 | 2.5%), and Firefighting & Prevention (20 | 2.5%).
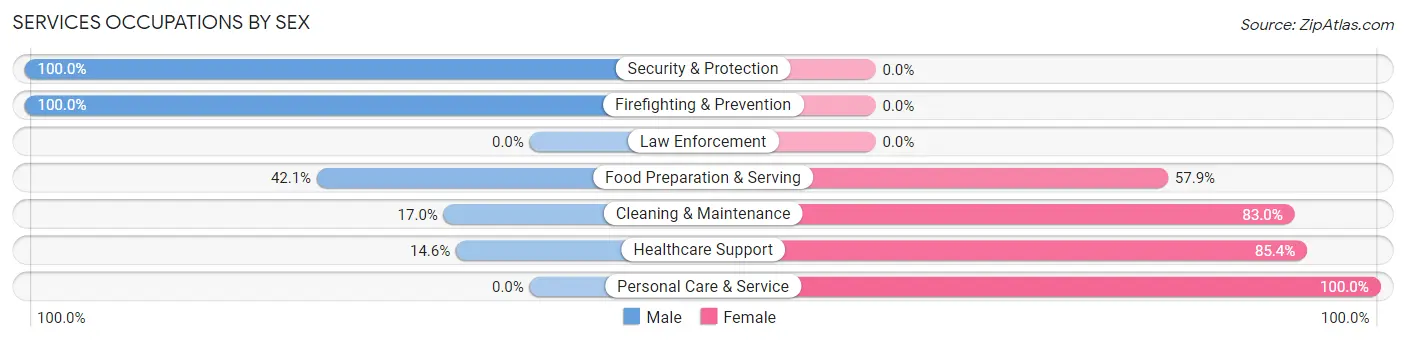
Services Occupations by Sex
Within the Services occupations in Ahwahnee, the most male-oriented occupations are Security & Protection (100.0%), Firefighting & Prevention (100.0%), and Food Preparation & Serving (42.1%), while the most female-oriented occupations are Personal Care & Service (100.0%), Healthcare Support (85.4%), and Cleaning & Maintenance (83.0%).
| Occupation | Male | Female |
| Healthcare Support | 15 (14.6%) | 88 (85.4%) |
| Security & Protection | 20 (100.0%) | 0 (0.0%) |
| Firefighting & Prevention | 20 (100.0%) | 0 (0.0%) |
| Law Enforcement | 0 (0.0%) | 0 (0.0%) |
| Food Preparation & Serving | 16 (42.1%) | 22 (57.9%) |
| Cleaning & Maintenance | 8 (17.0%) | 39 (83.0%) |
| Personal Care & Service | 0 (0.0%) | 3 (100.0%) |
| Total (Category) | 59 (28.0%) | 152 (72.0%) |
| Total (Overall) | 422 (53.3%) | 369 (46.7%) |
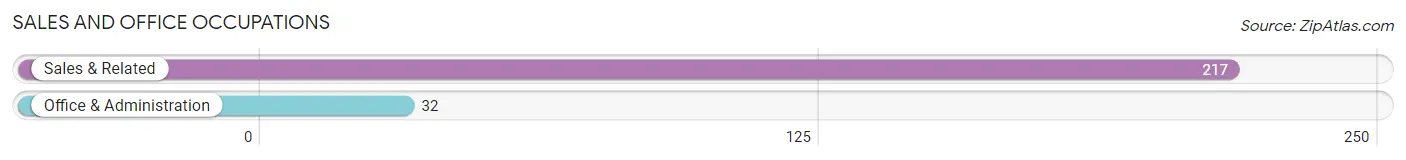
Sales and Office Occupations
The most common Sales and Office occupations in Ahwahnee are Sales & Related (217 | 27.4%), and Office & Administration (32 | 4.1%).
Sales and Office Occupations by Sex
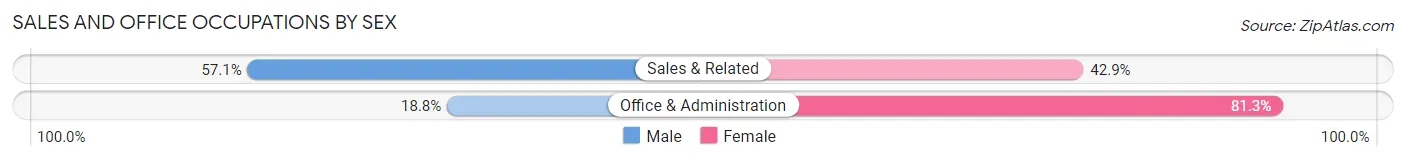
| Occupation | Male | Female |
| Sales & Related | 124 (57.1%) | 93 (42.9%) |
| Office & Administration | 6 (18.8%) | 26 (81.2%) |
| Total (Category) | 130 (52.2%) | 119 (47.8%) |
| Total (Overall) | 422 (53.3%) | 369 (46.7%) |
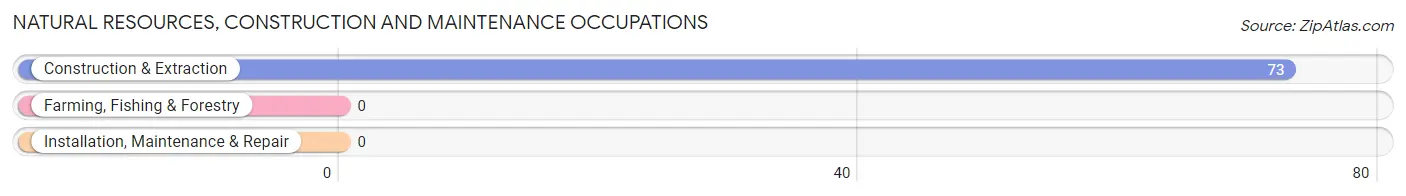
Natural Resources, Construction and Maintenance Occupations
The most common Natural Resources, Construction and Maintenance occupations in Ahwahnee are , and Construction & Extraction (73 | 9.2%).
Natural Resources, Construction and Maintenance Occupations by Sex
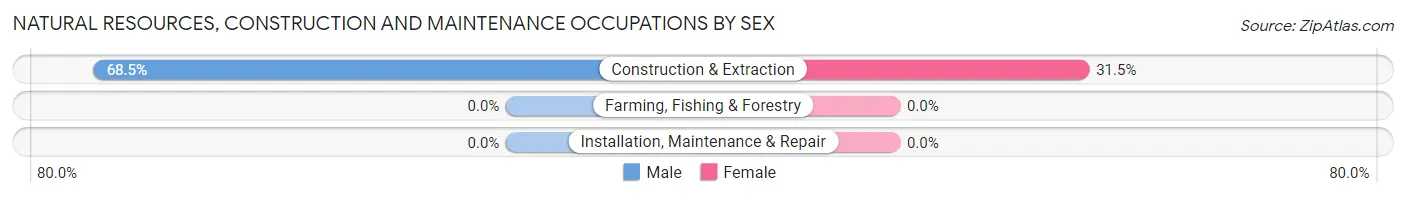
| Occupation | Male | Female |
| Farming, Fishing & Forestry | 0 (0.0%) | 0 (0.0%) |
| Construction & Extraction | 50 (68.5%) | 23 (31.5%) |
| Installation, Maintenance & Repair | 0 (0.0%) | 0 (0.0%) |
| Total (Category) | 50 (68.5%) | 23 (31.5%) |
| Total (Overall) | 422 (53.3%) | 369 (46.7%) |
Production, Transportation and Moving Occupations
Production, Transportation and Moving Occupations by Sex
| Occupation | Male | Female |
| Production | 0 (0.0%) | 0 (0.0%) |
| Transportation | 0 (0.0%) | 0 (0.0%) |
| Material Moving | 0 (0.0%) | 0 (0.0%) |
| Total (Category) | 0 (0.0%) | 0 (0.0%) |
| Total (Overall) | 422 (53.3%) | 369 (46.7%) |
Employment Industries by Sex in Ahwahnee
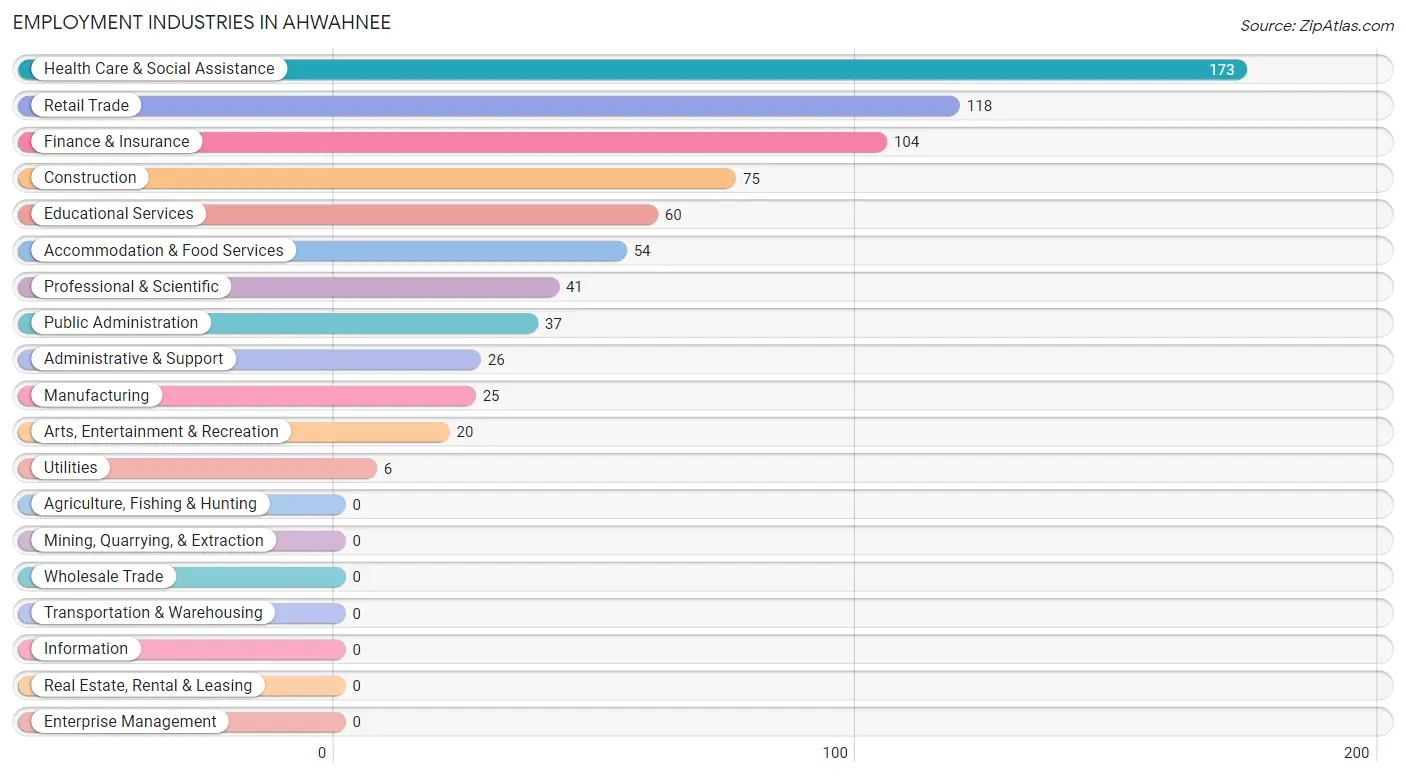
Employment Industries in Ahwahnee
The major employment industries in Ahwahnee include Health Care & Social Assistance (173 | 21.9%), Retail Trade (118 | 14.9%), Finance & Insurance (104 | 13.2%), Construction (75 | 9.5%), and Educational Services (60 | 7.6%).
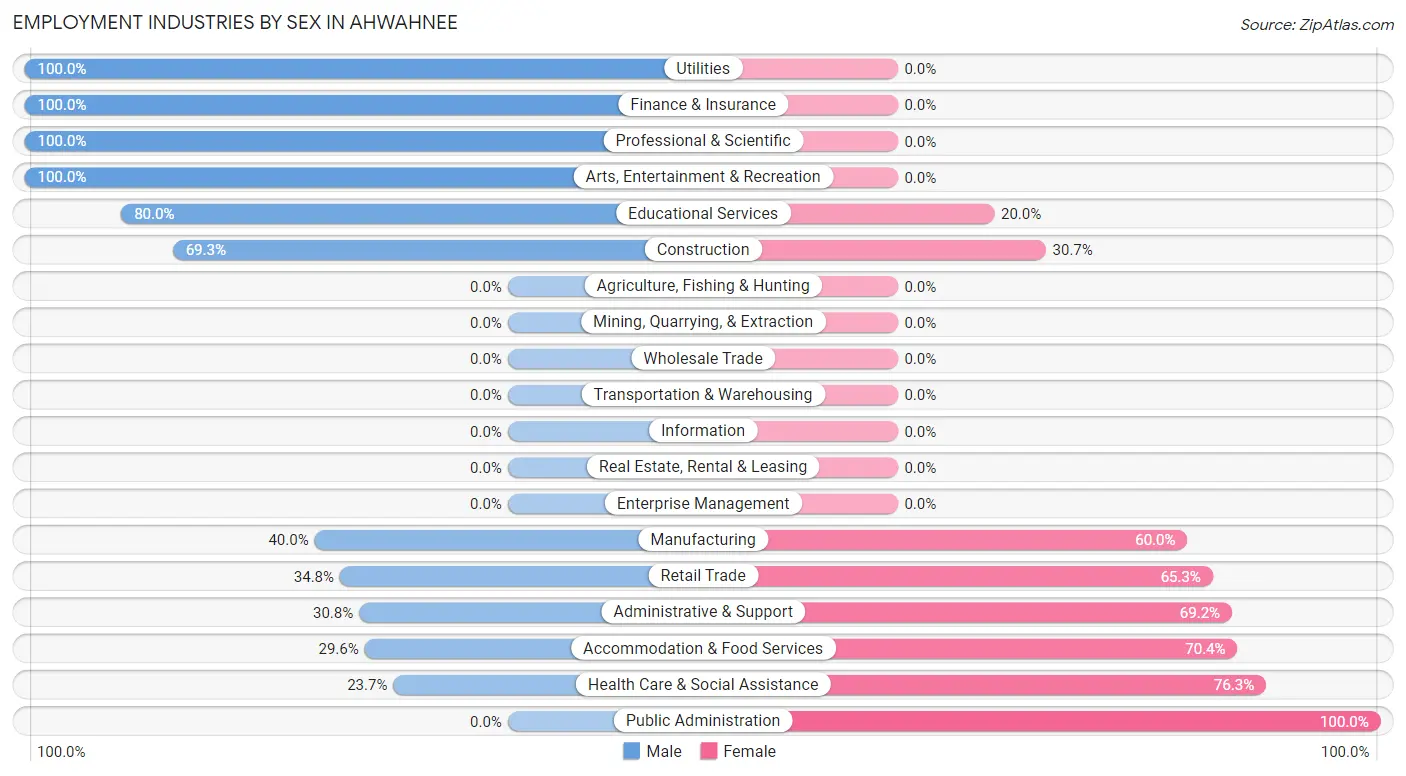
Employment Industries by Sex in Ahwahnee
The Ahwahnee industries that see more men than women are Utilities (100.0%), Finance & Insurance (100.0%), and Professional & Scientific (100.0%), whereas the industries that tend to have a higher number of women are Public Administration (100.0%), Health Care & Social Assistance (76.3%), and Accommodation & Food Services (70.4%).
| Industry | Male | Female |
| Agriculture, Fishing & Hunting | 0 (0.0%) | 0 (0.0%) |
| Mining, Quarrying, & Extraction | 0 (0.0%) | 0 (0.0%) |
| Construction | 52 (69.3%) | 23 (30.7%) |
| Manufacturing | 10 (40.0%) | 15 (60.0%) |
| Wholesale Trade | 0 (0.0%) | 0 (0.0%) |
| Retail Trade | 41 (34.7%) | 77 (65.2%) |
| Transportation & Warehousing | 0 (0.0%) | 0 (0.0%) |
| Utilities | 6 (100.0%) | 0 (0.0%) |
| Information | 0 (0.0%) | 0 (0.0%) |
| Finance & Insurance | 104 (100.0%) | 0 (0.0%) |
| Real Estate, Rental & Leasing | 0 (0.0%) | 0 (0.0%) |
| Professional & Scientific | 41 (100.0%) | 0 (0.0%) |
| Enterprise Management | 0 (0.0%) | 0 (0.0%) |
| Administrative & Support | 8 (30.8%) | 18 (69.2%) |
| Educational Services | 48 (80.0%) | 12 (20.0%) |
| Health Care & Social Assistance | 41 (23.7%) | 132 (76.3%) |
| Arts, Entertainment & Recreation | 20 (100.0%) | 0 (0.0%) |
| Accommodation & Food Services | 16 (29.6%) | 38 (70.4%) |
| Public Administration | 0 (0.0%) | 37 (100.0%) |
| Total | 422 (53.3%) | 369 (46.7%) |
Education in Ahwahnee
School Enrollment in Ahwahnee
The most common levels of schooling among the 255 students in Ahwahnee are college / undergraduate (98 | 38.4%), high school (74 | 29.0%), and middle school (43 | 16.9%).
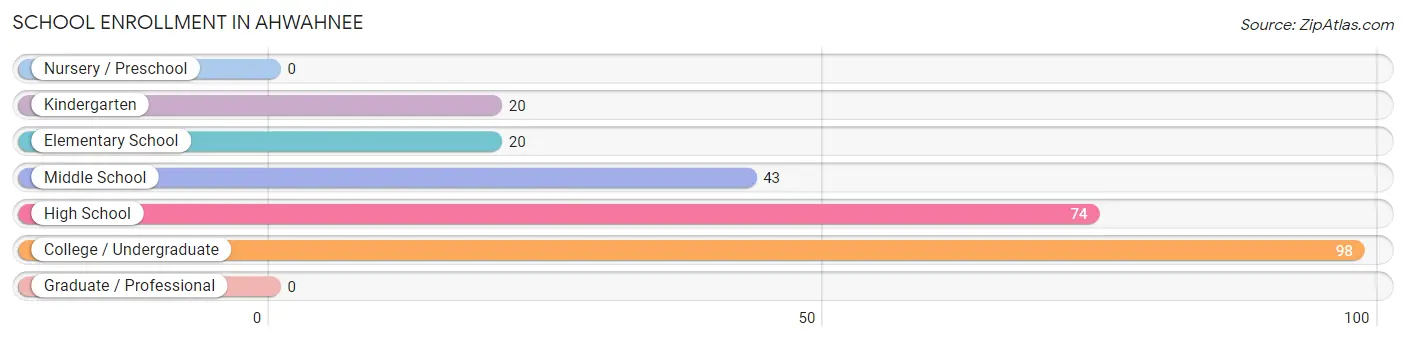
| School Level | # Students | % Students |
| Nursery / Preschool | 0 | 0.0% |
| Kindergarten | 20 | 7.8% |
| Elementary School | 20 | 7.8% |
| Middle School | 43 | 16.9% |
| High School | 74 | 29.0% |
| College / Undergraduate | 98 | 38.4% |
| Graduate / Professional | 0 | 0.0% |
| Total | 255 | 100.0% |
School Enrollment by Age by Funding Source in Ahwahnee
Out of a total of 255 students who are enrolled in schools in Ahwahnee, 9 (3.5%) attend a private institution, while the remaining 246 (96.5%) are enrolled in public schools. The age group of 15 to 17 year olds has the highest likelihood of being enrolled in private schools, with 7 (14.3% in the age bracket) enrolled. Conversely, the age group of 5 to 9 year old has the lowest likelihood of being enrolled in a private school, with 40 (100.0% in the age bracket) attending a public institution.
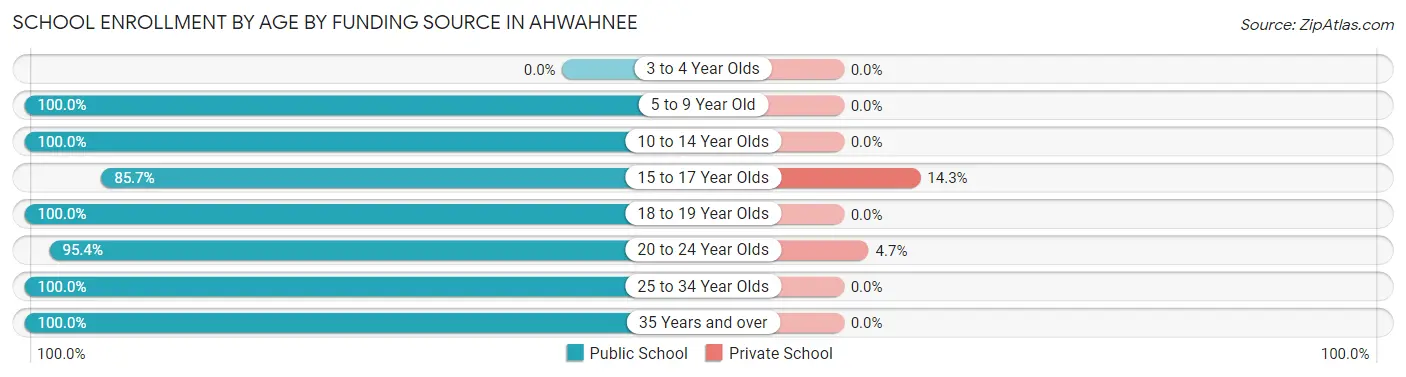
| Age Bracket | Public School | Private School |
| 3 to 4 Year Olds | 0 (0.0%) | 0 (0.0%) |
| 5 to 9 Year Old | 40 (100.0%) | 0 (0.0%) |
| 10 to 14 Year Olds | 43 (100.0%) | 0 (0.0%) |
| 15 to 17 Year Olds | 42 (85.7%) | 7 (14.3%) |
| 18 to 19 Year Olds | 13 (100.0%) | 0 (0.0%) |
| 20 to 24 Year Olds | 41 (95.4%) | 2 (4.6%) |
| 25 to 34 Year Olds | 20 (100.0%) | 0 (0.0%) |
| 35 Years and over | 47 (100.0%) | 0 (0.0%) |
| Total | 246 (96.5%) | 9 (3.5%) |
Educational Attainment by Field of Study in Ahwahnee
Business (176 | 37.4%), communications (92 | 19.5%), physical & health sciences (49 | 10.4%), science & technology (40 | 8.5%), and liberal arts & history (36 | 7.6%) are the most common fields of study among 471 individuals in Ahwahnee who have obtained a bachelor's degree or higher.
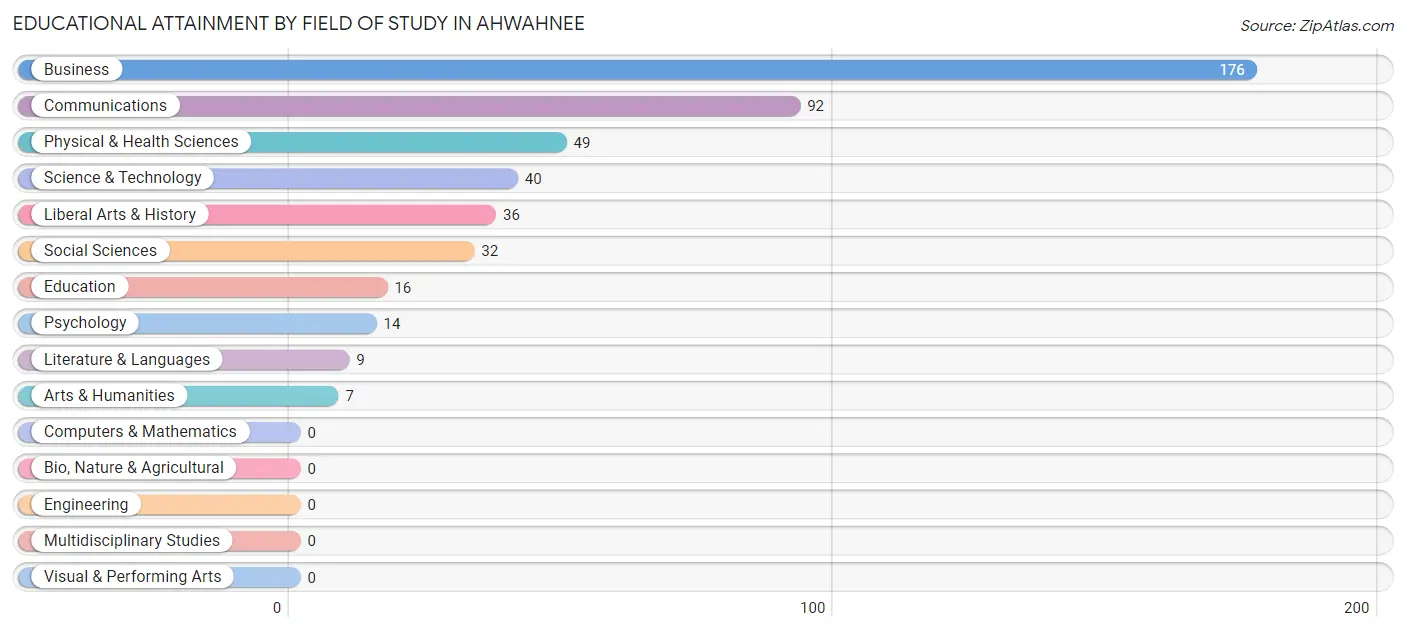
| Field of Study | # Graduates | % Graduates |
| Computers & Mathematics | 0 | 0.0% |
| Bio, Nature & Agricultural | 0 | 0.0% |
| Physical & Health Sciences | 49 | 10.4% |
| Psychology | 14 | 3.0% |
| Social Sciences | 32 | 6.8% |
| Engineering | 0 | 0.0% |
| Multidisciplinary Studies | 0 | 0.0% |
| Science & Technology | 40 | 8.5% |
| Business | 176 | 37.4% |
| Education | 16 | 3.4% |
| Literature & Languages | 9 | 1.9% |
| Liberal Arts & History | 36 | 7.6% |
| Visual & Performing Arts | 0 | 0.0% |
| Communications | 92 | 19.5% |
| Arts & Humanities | 7 | 1.5% |
| Total | 471 | 100.0% |
Transportation & Commute in Ahwahnee
Vehicle Availability by Sex in Ahwahnee
The most prevalent vehicle ownership categories in Ahwahnee are males with 5 or more vehicles (180, accounting for 44.0%) and females with 5 or more vehicles (18, making up 49.4%).
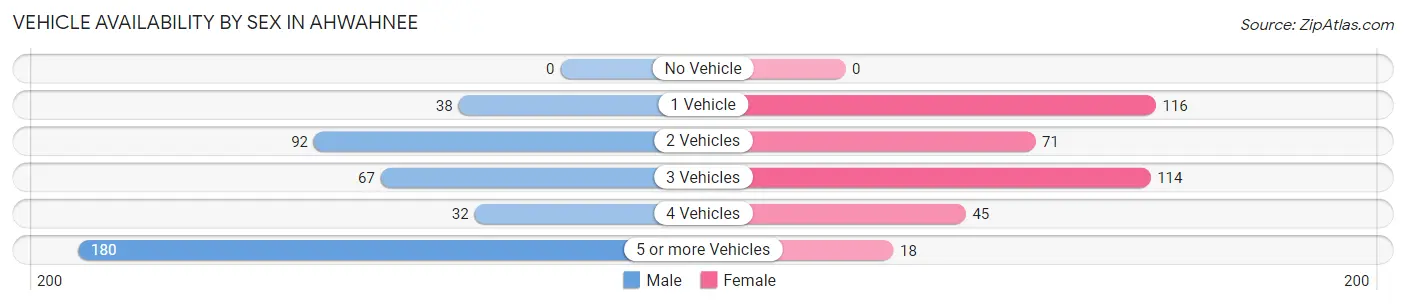
| Vehicles Available | Male | Female |
| No Vehicle | 0 (0.0%) | 0 (0.0%) |
| 1 Vehicle | 38 (9.3%) | 116 (31.9%) |
| 2 Vehicles | 92 (22.5%) | 71 (19.5%) |
| 3 Vehicles | 67 (16.4%) | 114 (31.3%) |
| 4 Vehicles | 32 (7.8%) | 45 (12.4%) |
| 5 or more Vehicles | 180 (44.0%) | 18 (5.0%) |
| Total | 409 (100.0%) | 364 (100.0%) |
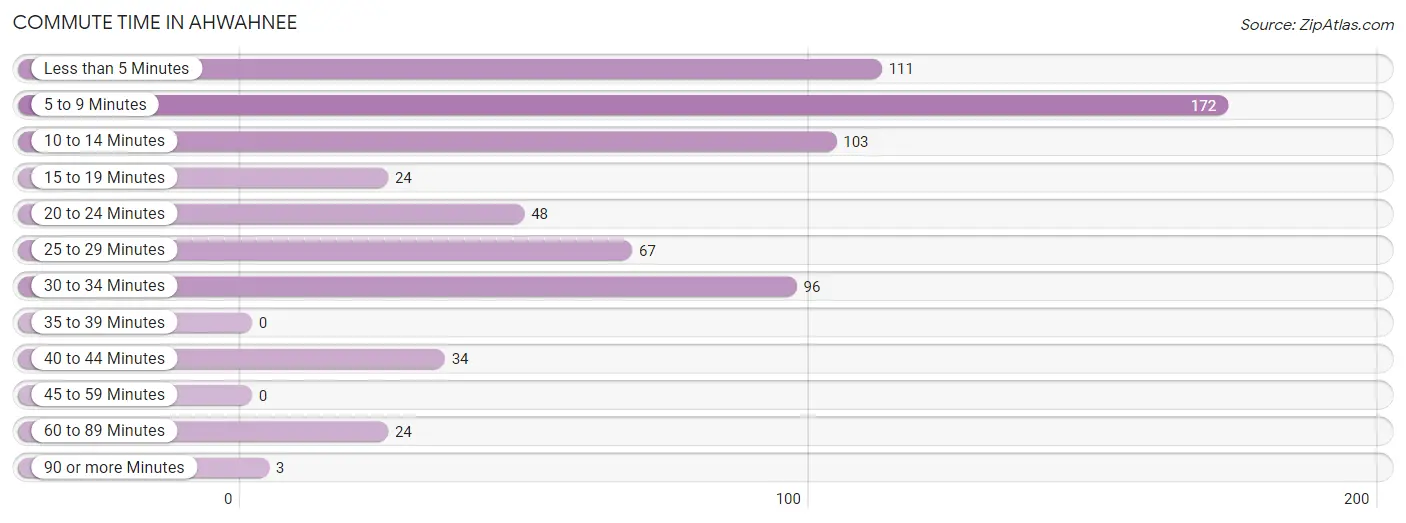
Commute Time in Ahwahnee
The most frequently occuring commute durations in Ahwahnee are 5 to 9 minutes (172 commuters, 25.2%), less than 5 minutes (111 commuters, 16.3%), and 10 to 14 minutes (103 commuters, 15.1%).
| Commute Time | # Commuters | % Commuters |
| Less than 5 Minutes | 111 | 16.3% |
| 5 to 9 Minutes | 172 | 25.2% |
| 10 to 14 Minutes | 103 | 15.1% |
| 15 to 19 Minutes | 24 | 3.5% |
| 20 to 24 Minutes | 48 | 7.0% |
| 25 to 29 Minutes | 67 | 9.8% |
| 30 to 34 Minutes | 96 | 14.1% |
| 35 to 39 Minutes | 0 | 0.0% |
| 40 to 44 Minutes | 34 | 5.0% |
| 45 to 59 Minutes | 0 | 0.0% |
| 60 to 89 Minutes | 24 | 3.5% |
| 90 or more Minutes | 3 | 0.4% |
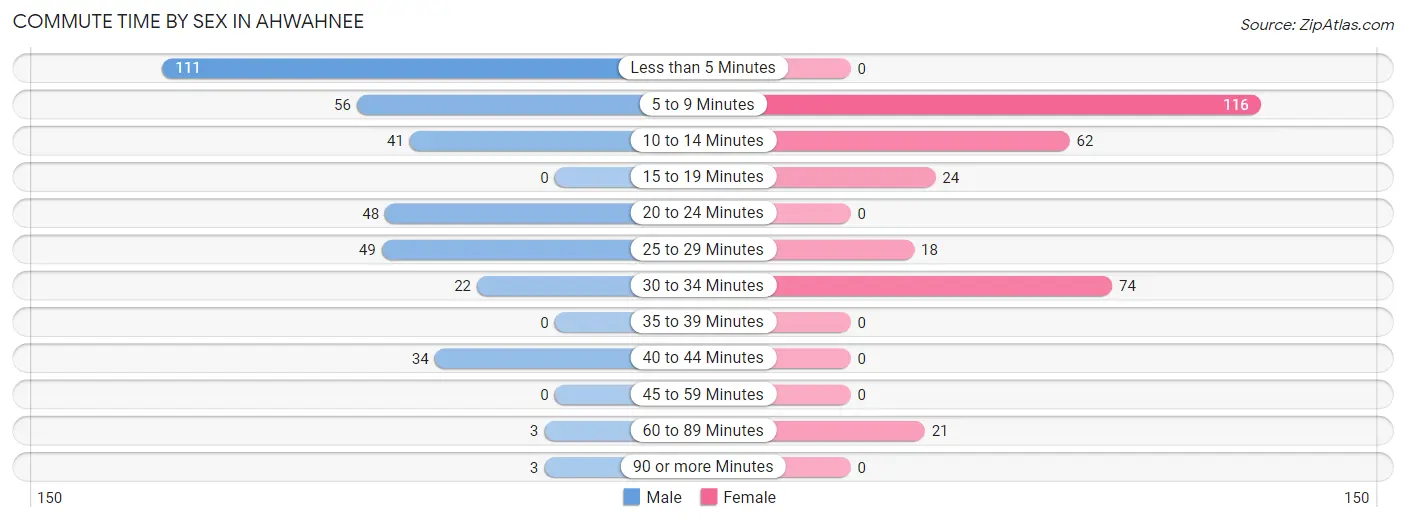
Commute Time by Sex in Ahwahnee
The most common commute times in Ahwahnee are less than 5 minutes (111 commuters, 30.2%) for males and 5 to 9 minutes (116 commuters, 36.8%) for females.
| Commute Time | Male | Female |
| Less than 5 Minutes | 111 (30.2%) | 0 (0.0%) |
| 5 to 9 Minutes | 56 (15.3%) | 116 (36.8%) |
| 10 to 14 Minutes | 41 (11.2%) | 62 (19.7%) |
| 15 to 19 Minutes | 0 (0.0%) | 24 (7.6%) |
| 20 to 24 Minutes | 48 (13.1%) | 0 (0.0%) |
| 25 to 29 Minutes | 49 (13.4%) | 18 (5.7%) |
| 30 to 34 Minutes | 22 (6.0%) | 74 (23.5%) |
| 35 to 39 Minutes | 0 (0.0%) | 0 (0.0%) |
| 40 to 44 Minutes | 34 (9.3%) | 0 (0.0%) |
| 45 to 59 Minutes | 0 (0.0%) | 0 (0.0%) |
| 60 to 89 Minutes | 3 (0.8%) | 21 (6.7%) |
| 90 or more Minutes | 3 (0.8%) | 0 (0.0%) |
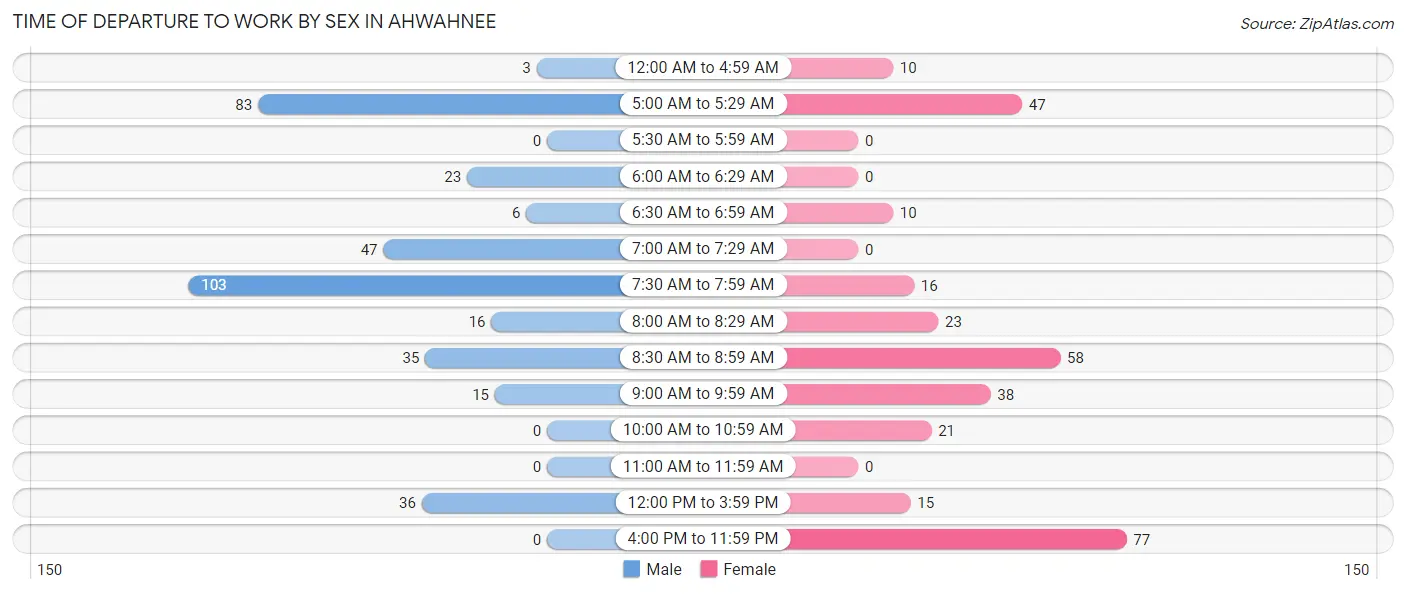
Time of Departure to Work by Sex in Ahwahnee
The most frequent times of departure to work in Ahwahnee are 7:30 AM to 7:59 AM (103, 28.1%) for males and 4:00 PM to 11:59 PM (77, 24.4%) for females.
| Time of Departure | Male | Female |
| 12:00 AM to 4:59 AM | 3 (0.8%) | 10 (3.2%) |
| 5:00 AM to 5:29 AM | 83 (22.6%) | 47 (14.9%) |
| 5:30 AM to 5:59 AM | 0 (0.0%) | 0 (0.0%) |
| 6:00 AM to 6:29 AM | 23 (6.3%) | 0 (0.0%) |
| 6:30 AM to 6:59 AM | 6 (1.6%) | 10 (3.2%) |
| 7:00 AM to 7:29 AM | 47 (12.8%) | 0 (0.0%) |
| 7:30 AM to 7:59 AM | 103 (28.1%) | 16 (5.1%) |
| 8:00 AM to 8:29 AM | 16 (4.4%) | 23 (7.3%) |
| 8:30 AM to 8:59 AM | 35 (9.5%) | 58 (18.4%) |
| 9:00 AM to 9:59 AM | 15 (4.1%) | 38 (12.1%) |
| 10:00 AM to 10:59 AM | 0 (0.0%) | 21 (6.7%) |
| 11:00 AM to 11:59 AM | 0 (0.0%) | 0 (0.0%) |
| 12:00 PM to 3:59 PM | 36 (9.8%) | 15 (4.8%) |
| 4:00 PM to 11:59 PM | 0 (0.0%) | 77 (24.4%) |
| Total | 367 (100.0%) | 315 (100.0%) |
Housing Occupancy in Ahwahnee
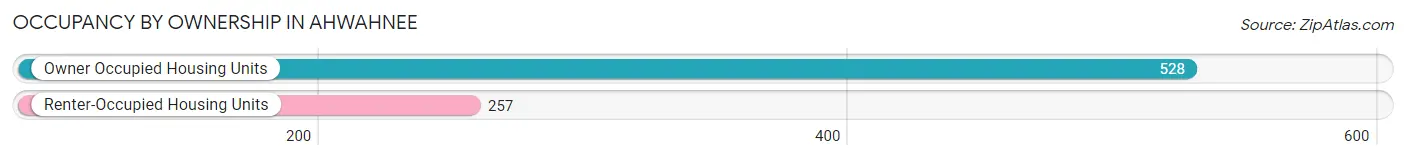
Occupancy by Ownership in Ahwahnee
Of the total 785 dwellings in Ahwahnee, owner-occupied units account for 528 (67.3%), while renter-occupied units make up 257 (32.7%).
| Occupancy | # Housing Units | % Housing Units |
| Owner Occupied Housing Units | 528 | 67.3% |
| Renter-Occupied Housing Units | 257 | 32.7% |
| Total Occupied Housing Units | 785 | 100.0% |
Occupancy by Household Size in Ahwahnee
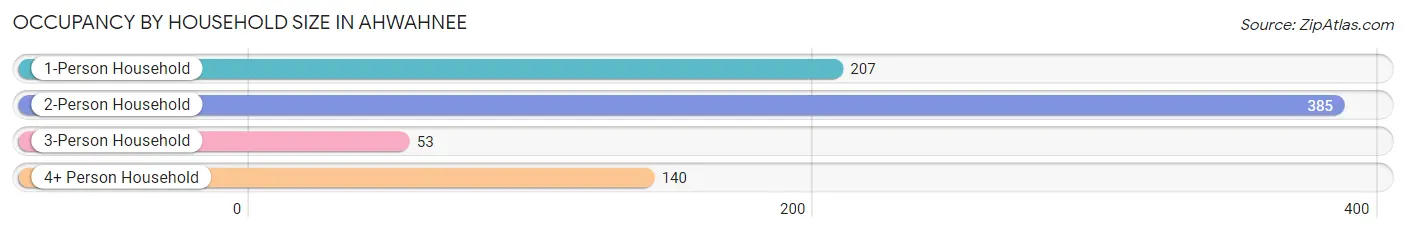
| Household Size | # Housing Units | % Housing Units |
| 1-Person Household | 207 | 26.4% |
| 2-Person Household | 385 | 49.0% |
| 3-Person Household | 53 | 6.8% |
| 4+ Person Household | 140 | 17.8% |
| Total Housing Units | 785 | 100.0% |
Occupancy by Ownership by Household Size in Ahwahnee
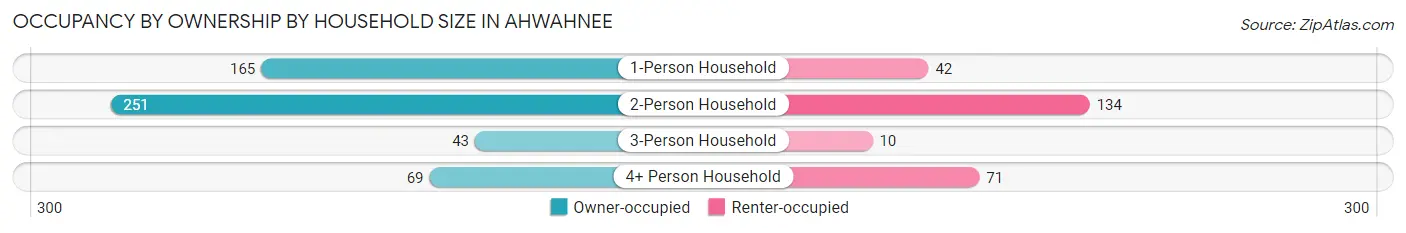
| Household Size | Owner-occupied | Renter-occupied |
| 1-Person Household | 165 (79.7%) | 42 (20.3%) |
| 2-Person Household | 251 (65.2%) | 134 (34.8%) |
| 3-Person Household | 43 (81.1%) | 10 (18.9%) |
| 4+ Person Household | 69 (49.3%) | 71 (50.7%) |
| Total Housing Units | 528 (67.3%) | 257 (32.7%) |
Occupancy by Educational Attainment in Ahwahnee
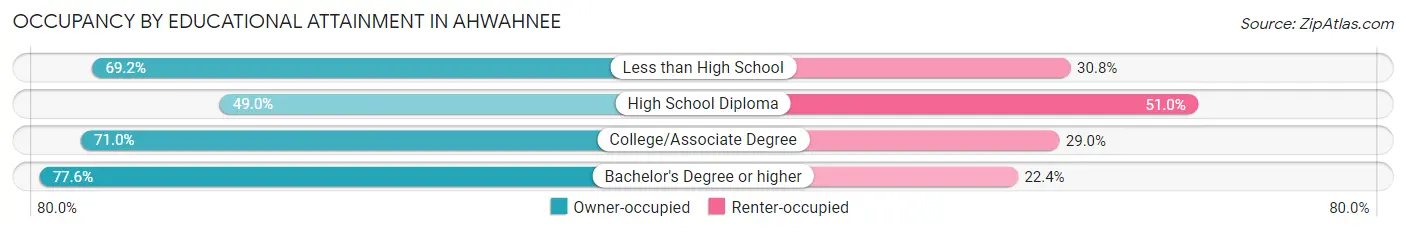
| Household Size | Owner-occupied | Renter-occupied |
| Less than High School | 18 (69.2%) | 8 (30.8%) |
| High School Diploma | 100 (49.0%) | 104 (51.0%) |
| College/Associate Degree | 223 (71.0%) | 91 (29.0%) |
| Bachelor's Degree or higher | 187 (77.6%) | 54 (22.4%) |
Occupancy by Age of Householder in Ahwahnee
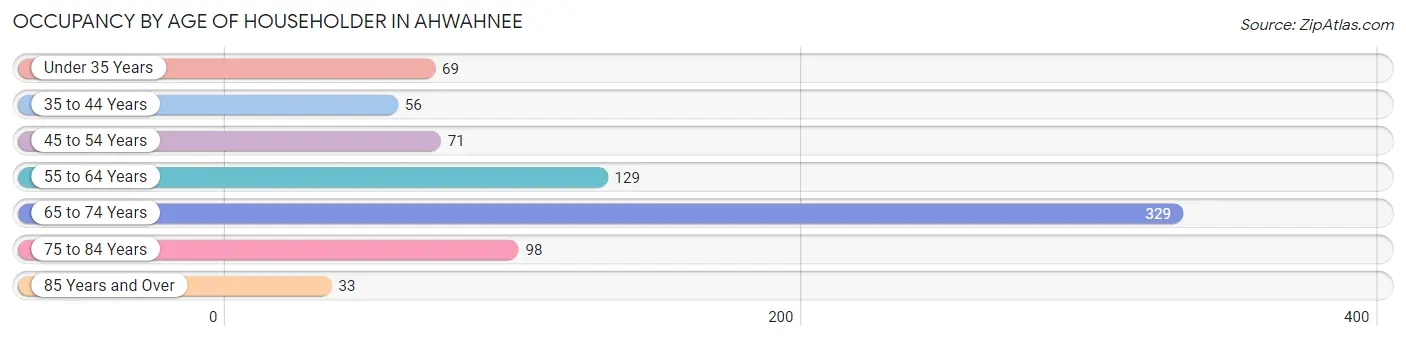
| Age Bracket | # Households | % Households |
| Under 35 Years | 69 | 8.8% |
| 35 to 44 Years | 56 | 7.1% |
| 45 to 54 Years | 71 | 9.0% |
| 55 to 64 Years | 129 | 16.4% |
| 65 to 74 Years | 329 | 41.9% |
| 75 to 84 Years | 98 | 12.5% |
| 85 Years and Over | 33 | 4.2% |
| Total | 785 | 100.0% |
Housing Finances in Ahwahnee
Median Income by Occupancy in Ahwahnee
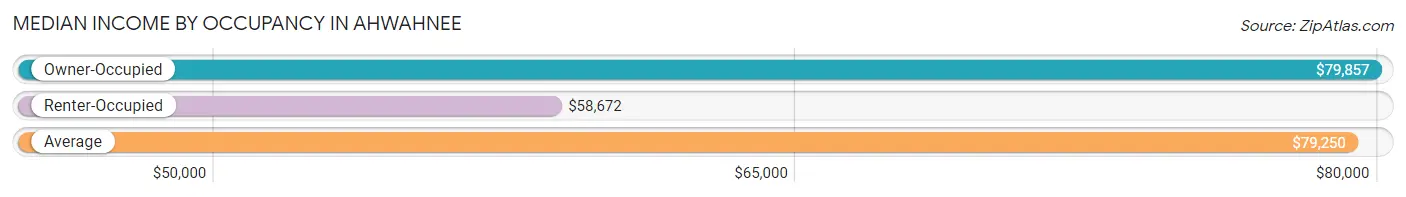
| Occupancy Type | # Households | Median Income |
| Owner-Occupied | 528 (67.3%) | $79,857 |
| Renter-Occupied | 257 (32.7%) | $58,672 |
| Average | 785 (100.0%) | $79,250 |
Occupancy by Householder Income Bracket in Ahwahnee
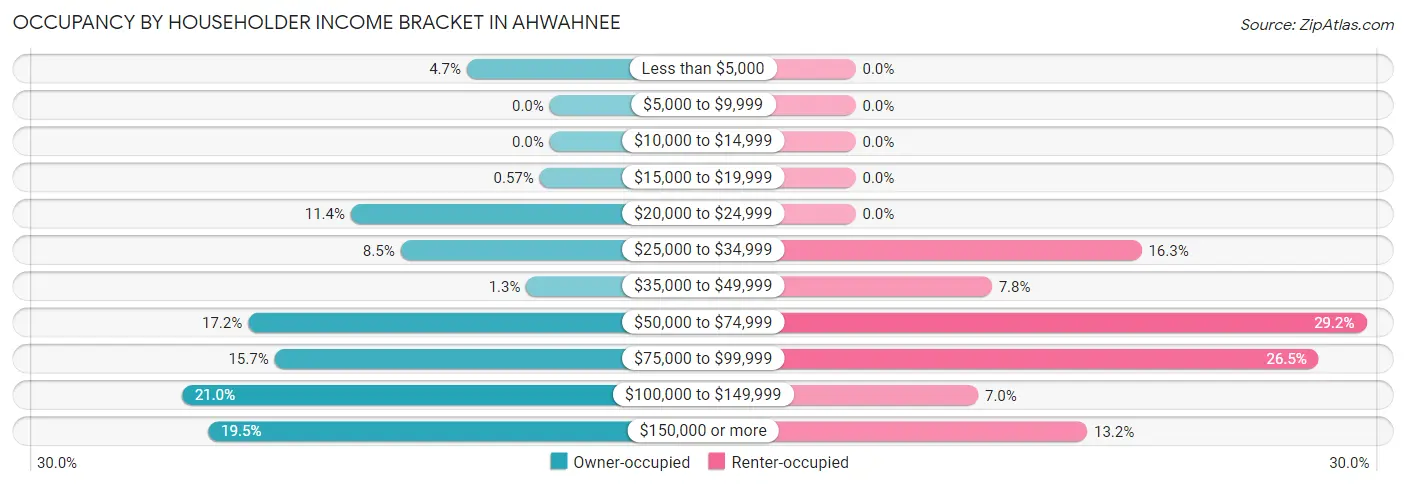
| Income Bracket | Owner-occupied | Renter-occupied |
| Less than $5,000 | 25 (4.7%) | 0 (0.0%) |
| $5,000 to $9,999 | 0 (0.0%) | 0 (0.0%) |
| $10,000 to $14,999 | 0 (0.0%) | 0 (0.0%) |
| $15,000 to $19,999 | 3 (0.6%) | 0 (0.0%) |
| $20,000 to $24,999 | 60 (11.4%) | 0 (0.0%) |
| $25,000 to $34,999 | 45 (8.5%) | 42 (16.3%) |
| $35,000 to $49,999 | 7 (1.3%) | 20 (7.8%) |
| $50,000 to $74,999 | 91 (17.2%) | 75 (29.2%) |
| $75,000 to $99,999 | 83 (15.7%) | 68 (26.5%) |
| $100,000 to $149,999 | 111 (21.0%) | 18 (7.0%) |
| $150,000 or more | 103 (19.5%) | 34 (13.2%) |
| Total | 528 (100.0%) | 257 (100.0%) |
Monthly Housing Cost Tiers in Ahwahnee
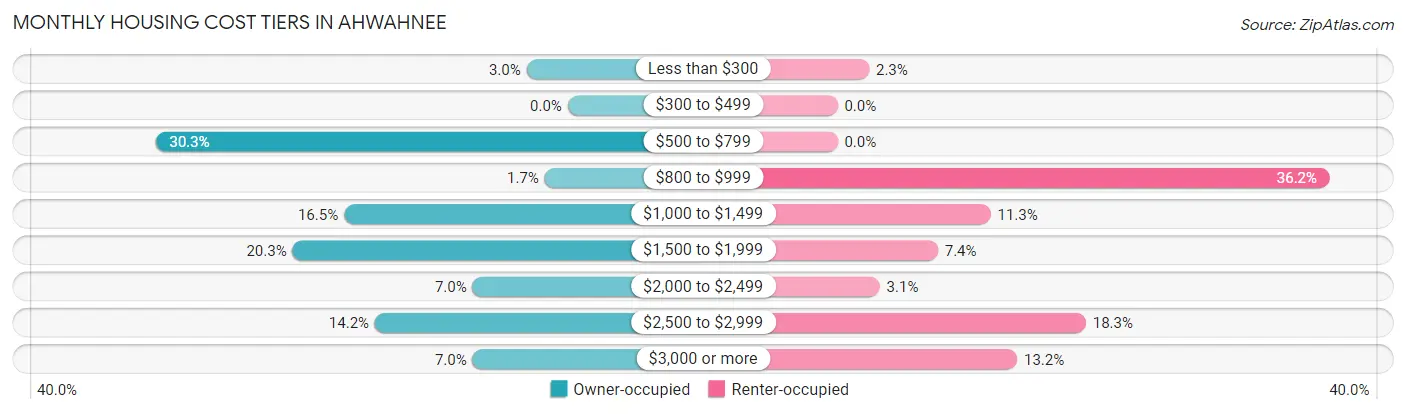
| Monthly Cost | Owner-occupied | Renter-occupied |
| Less than $300 | 16 (3.0%) | 6 (2.3%) |
| $300 to $499 | 0 (0.0%) | 0 (0.0%) |
| $500 to $799 | 160 (30.3%) | 0 (0.0%) |
| $800 to $999 | 9 (1.7%) | 93 (36.2%) |
| $1,000 to $1,499 | 87 (16.5%) | 29 (11.3%) |
| $1,500 to $1,999 | 107 (20.3%) | 19 (7.4%) |
| $2,000 to $2,499 | 37 (7.0%) | 8 (3.1%) |
| $2,500 to $2,999 | 75 (14.2%) | 47 (18.3%) |
| $3,000 or more | 37 (7.0%) | 34 (13.2%) |
| Total | 528 (100.0%) | 257 (100.0%) |
Physical Housing Characteristics in Ahwahnee
Housing Structures in Ahwahnee
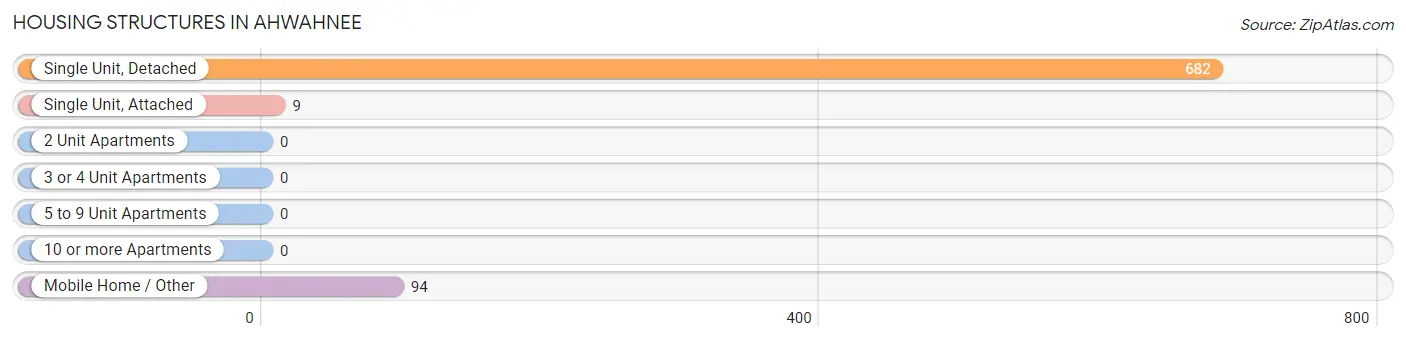
| Structure Type | # Housing Units | % Housing Units |
| Single Unit, Detached | 682 | 86.9% |
| Single Unit, Attached | 9 | 1.1% |
| 2 Unit Apartments | 0 | 0.0% |
| 3 or 4 Unit Apartments | 0 | 0.0% |
| 5 to 9 Unit Apartments | 0 | 0.0% |
| 10 or more Apartments | 0 | 0.0% |
| Mobile Home / Other | 94 | 12.0% |
| Total | 785 | 100.0% |
Housing Structures by Occupancy in Ahwahnee
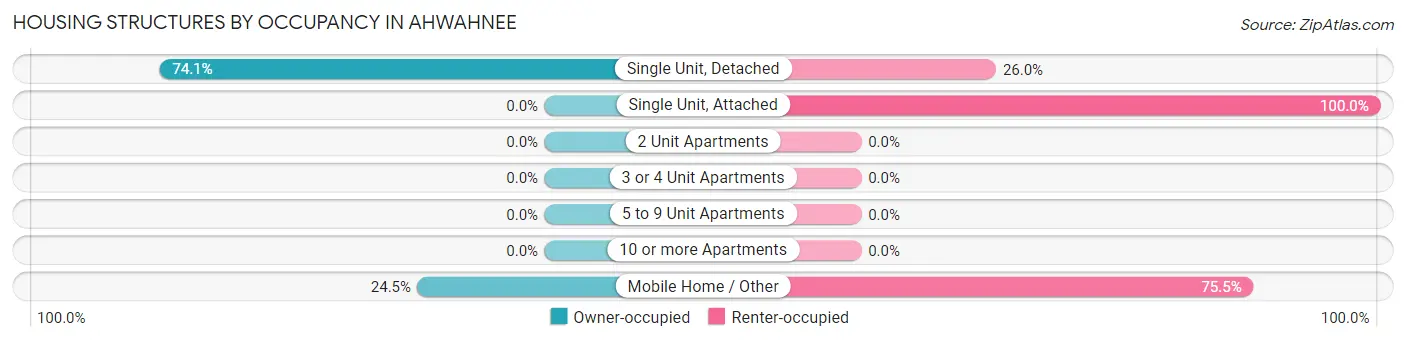
| Structure Type | Owner-occupied | Renter-occupied |
| Single Unit, Detached | 505 (74.1%) | 177 (26.0%) |
| Single Unit, Attached | 0 (0.0%) | 9 (100.0%) |
| 2 Unit Apartments | 0 (0.0%) | 0 (0.0%) |
| 3 or 4 Unit Apartments | 0 (0.0%) | 0 (0.0%) |
| 5 to 9 Unit Apartments | 0 (0.0%) | 0 (0.0%) |
| 10 or more Apartments | 0 (0.0%) | 0 (0.0%) |
| Mobile Home / Other | 23 (24.5%) | 71 (75.5%) |
| Total | 528 (67.3%) | 257 (32.7%) |
Housing Structures by Number of Rooms in Ahwahnee
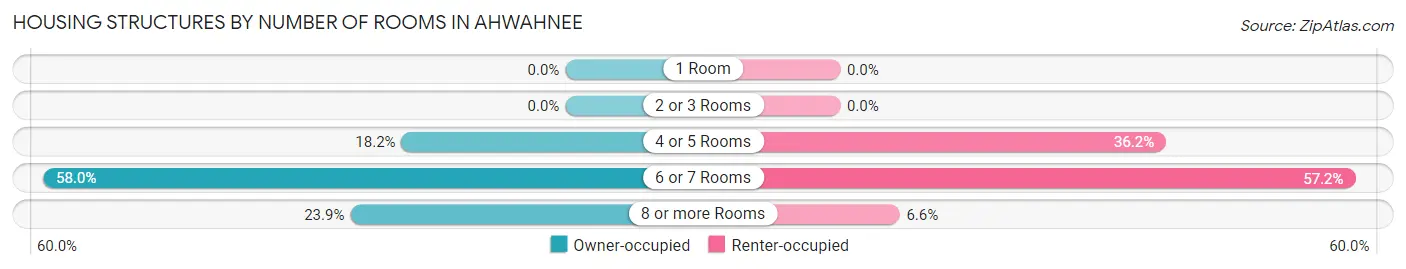
| Number of Rooms | Owner-occupied | Renter-occupied |
| 1 Room | 0 (0.0%) | 0 (0.0%) |
| 2 or 3 Rooms | 0 (0.0%) | 0 (0.0%) |
| 4 or 5 Rooms | 96 (18.2%) | 93 (36.2%) |
| 6 or 7 Rooms | 306 (58.0%) | 147 (57.2%) |
| 8 or more Rooms | 126 (23.9%) | 17 (6.6%) |
| Total | 528 (100.0%) | 257 (100.0%) |
Housing Structure by Heating Type in Ahwahnee
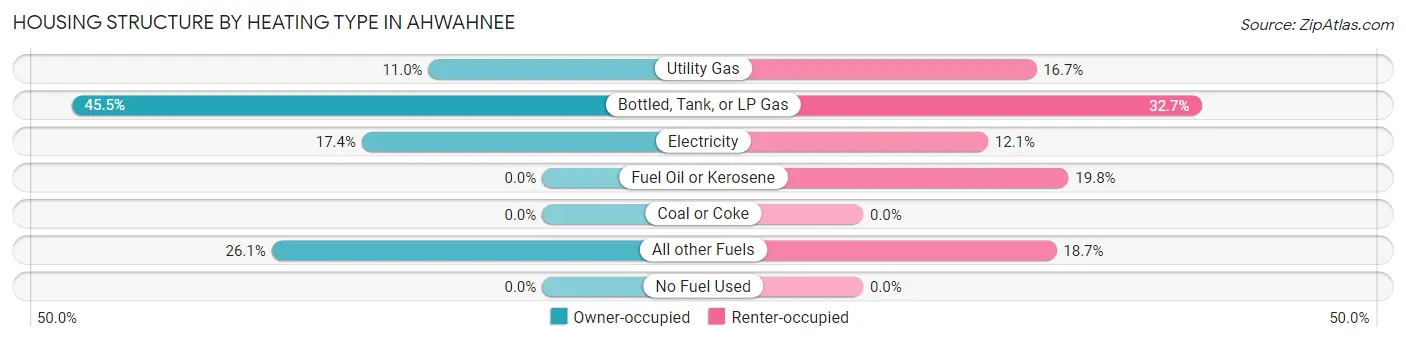
| Heating Type | Owner-occupied | Renter-occupied |
| Utility Gas | 58 (11.0%) | 43 (16.7%) |
| Bottled, Tank, or LP Gas | 240 (45.5%) | 84 (32.7%) |
| Electricity | 92 (17.4%) | 31 (12.1%) |
| Fuel Oil or Kerosene | 0 (0.0%) | 51 (19.8%) |
| Coal or Coke | 0 (0.0%) | 0 (0.0%) |
| All other Fuels | 138 (26.1%) | 48 (18.7%) |
| No Fuel Used | 0 (0.0%) | 0 (0.0%) |
| Total | 528 (100.0%) | 257 (100.0%) |
Household Vehicle Usage in Ahwahnee
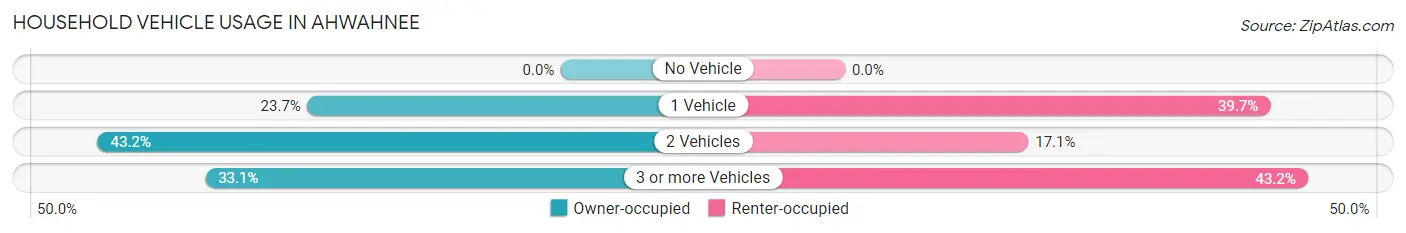
| Vehicles per Household | Owner-occupied | Renter-occupied |
| No Vehicle | 0 (0.0%) | 0 (0.0%) |
| 1 Vehicle | 125 (23.7%) | 102 (39.7%) |
| 2 Vehicles | 228 (43.2%) | 44 (17.1%) |
| 3 or more Vehicles | 175 (33.1%) | 111 (43.2%) |
| Total | 528 (100.0%) | 257 (100.0%) |
Real Estate & Mortgages in Ahwahnee
Real Estate and Mortgage Overview in Ahwahnee
| Characteristic | Without Mortgage | With Mortgage |
| Housing Units | 194 | 334 |
| Median Property Value | $393,000 | $392,600 |
| Median Household Income | $60,000 | $94 |
| Monthly Housing Costs | $588 | $37 |
| Real Estate Taxes | $2,788 | $19 |
Property Value by Mortgage Status in Ahwahnee
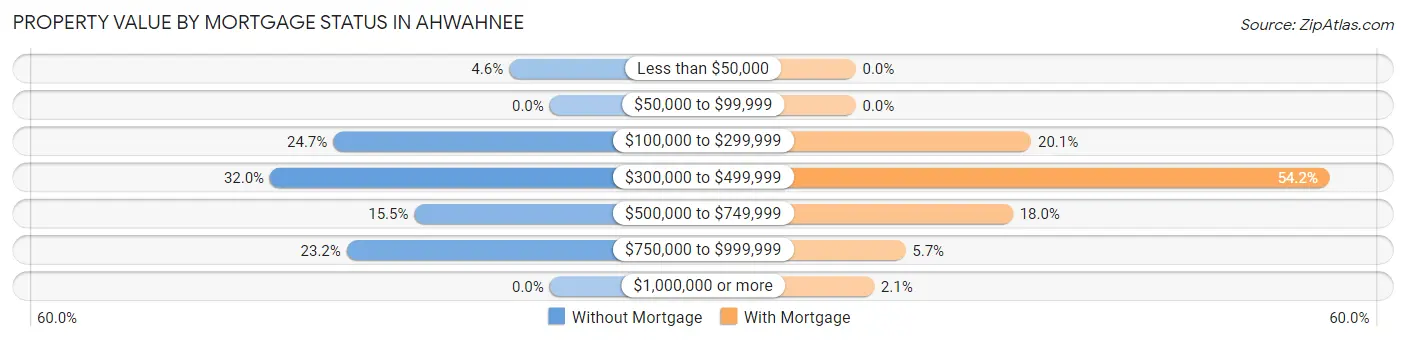
| Property Value | Without Mortgage | With Mortgage |
| Less than $50,000 | 9 (4.6%) | 0 (0.0%) |
| $50,000 to $99,999 | 0 (0.0%) | 0 (0.0%) |
| $100,000 to $299,999 | 48 (24.7%) | 67 (20.1%) |
| $300,000 to $499,999 | 62 (32.0%) | 181 (54.2%) |
| $500,000 to $749,999 | 30 (15.5%) | 60 (18.0%) |
| $750,000 to $999,999 | 45 (23.2%) | 19 (5.7%) |
| $1,000,000 or more | 0 (0.0%) | 7 (2.1%) |
| Total | 194 (100.0%) | 334 (100.0%) |
Household Income by Mortgage Status in Ahwahnee
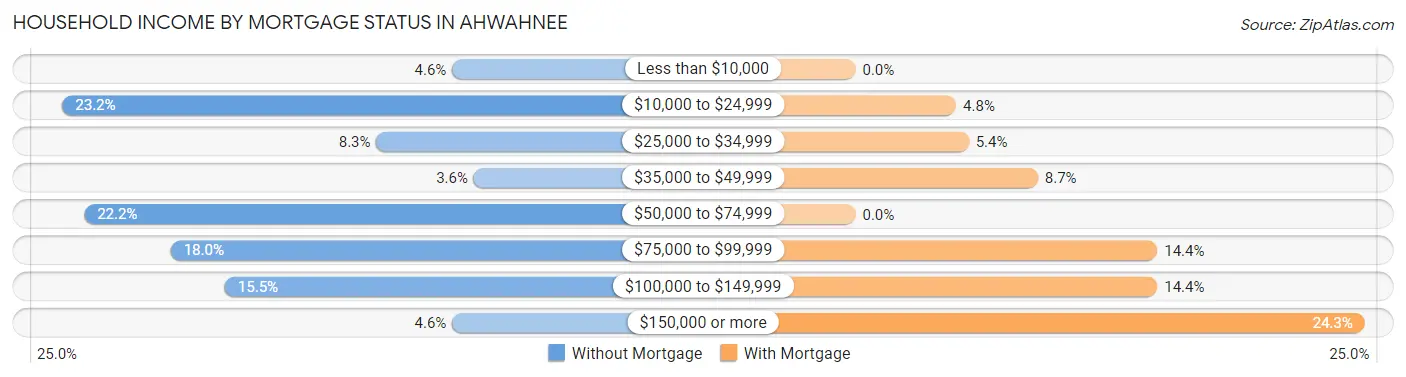
| Household Income | Without Mortgage | With Mortgage |
| Less than $10,000 | 9 (4.6%) | 0 (0.0%) |
| $10,000 to $24,999 | 45 (23.2%) | 16 (4.8%) |
| $25,000 to $34,999 | 16 (8.3%) | 18 (5.4%) |
| $35,000 to $49,999 | 7 (3.6%) | 29 (8.7%) |
| $50,000 to $74,999 | 43 (22.2%) | 0 (0.0%) |
| $75,000 to $99,999 | 35 (18.0%) | 48 (14.4%) |
| $100,000 to $149,999 | 30 (15.5%) | 48 (14.4%) |
| $150,000 or more | 9 (4.6%) | 81 (24.2%) |
| Total | 194 (100.0%) | 334 (100.0%) |
Property Value to Household Income Ratio in Ahwahnee
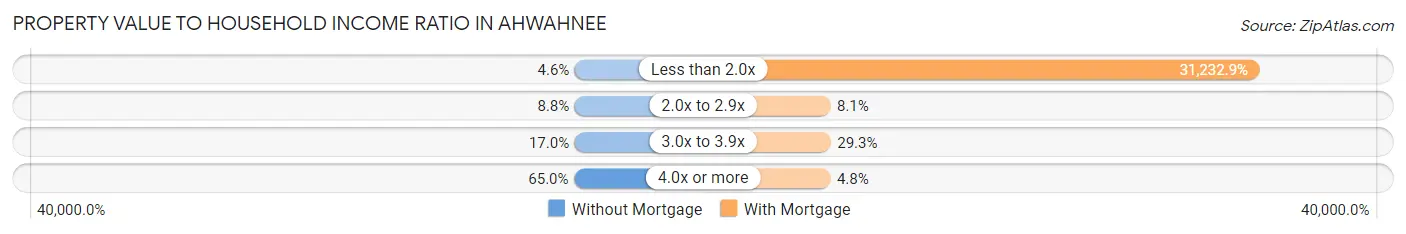
| Value-to-Income Ratio | Without Mortgage | With Mortgage |
| Less than 2.0x | 9 (4.6%) | 104,318 (31,232.9%) |
| 2.0x to 2.9x | 17 (8.8%) | 27 (8.1%) |
| 3.0x to 3.9x | 33 (17.0%) | 98 (29.3%) |
| 4.0x or more | 126 (64.9%) | 16 (4.8%) |
| Total | 194 (100.0%) | 334 (100.0%) |
Real Estate Taxes by Mortgage Status in Ahwahnee
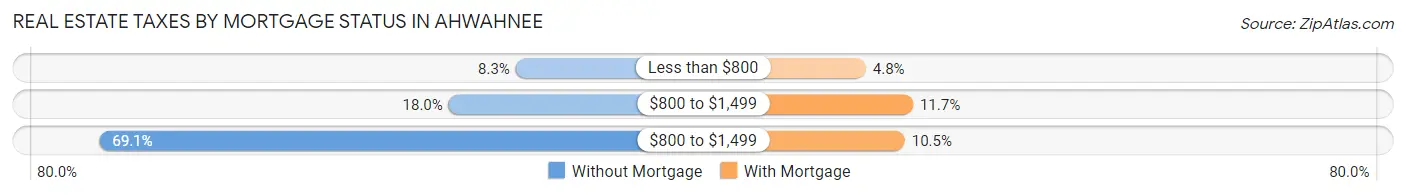
| Property Taxes | Without Mortgage | With Mortgage |
| Less than $800 | 16 (8.3%) | 16 (4.8%) |
| $800 to $1,499 | 35 (18.0%) | 39 (11.7%) |
| $800 to $1,499 | 134 (69.1%) | 35 (10.5%) |
| Total | 194 (100.0%) | 334 (100.0%) |
Health & Disability in Ahwahnee
Health Insurance Coverage by Age in Ahwahnee
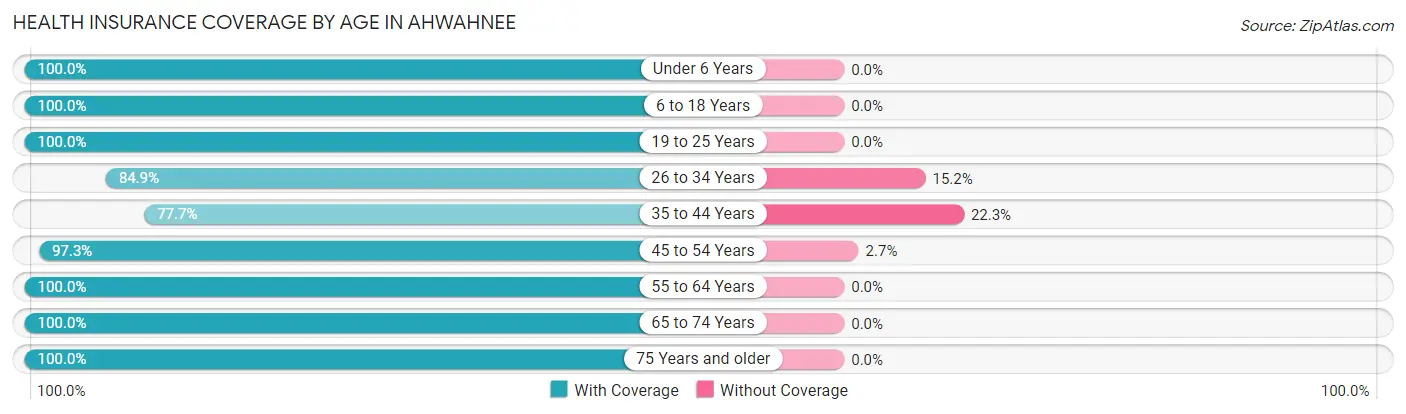
| Age Bracket | With Coverage | Without Coverage |
| Under 6 Years | 90 (100.0%) | 0 (0.0%) |
| 6 to 18 Years | 117 (100.0%) | 0 (0.0%) |
| 19 to 25 Years | 283 (100.0%) | 0 (0.0%) |
| 26 to 34 Years | 112 (84.9%) | 20 (15.1%) |
| 35 to 44 Years | 101 (77.7%) | 29 (22.3%) |
| 45 to 54 Years | 109 (97.3%) | 3 (2.7%) |
| 55 to 64 Years | 225 (100.0%) | 0 (0.0%) |
| 65 to 74 Years | 507 (100.0%) | 0 (0.0%) |
| 75 Years and older | 290 (100.0%) | 0 (0.0%) |
| Total | 1,834 (97.2%) | 52 (2.8%) |
Health Insurance Coverage by Citizenship Status in Ahwahnee
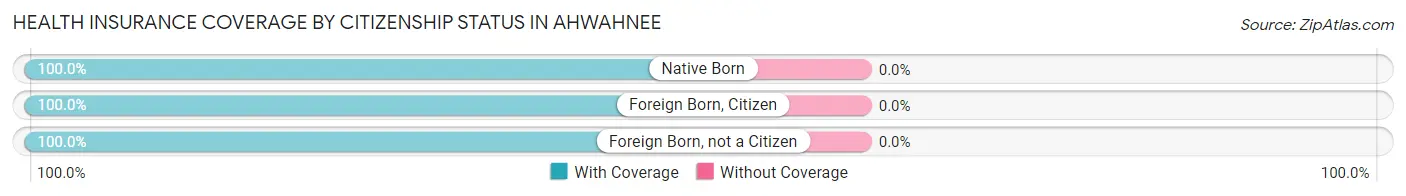
| Citizenship Status | With Coverage | Without Coverage |
| Native Born | 90 (100.0%) | 0 (0.0%) |
| Foreign Born, Citizen | 117 (100.0%) | 0 (0.0%) |
| Foreign Born, not a Citizen | 283 (100.0%) | 0 (0.0%) |
Health Insurance Coverage by Household Income in Ahwahnee
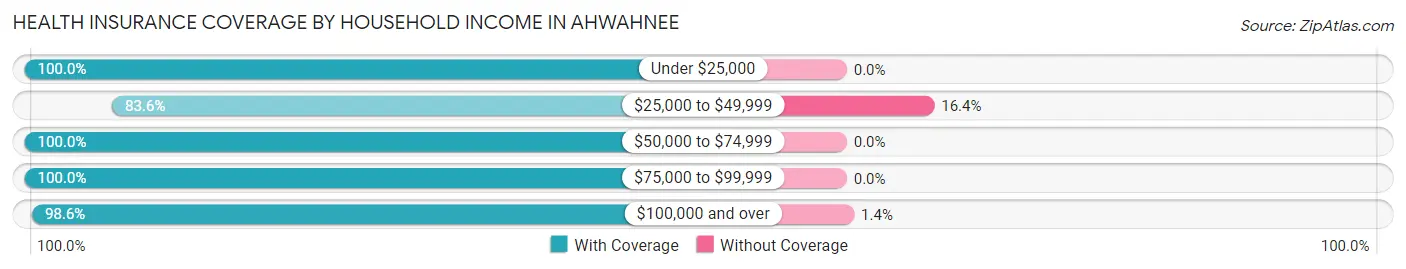
| Household Income | With Coverage | Without Coverage |
| Under $25,000 | 134 (100.0%) | 0 (0.0%) |
| $25,000 to $49,999 | 204 (83.6%) | 40 (16.4%) |
| $50,000 to $74,999 | 301 (100.0%) | 0 (0.0%) |
| $75,000 to $99,999 | 318 (100.0%) | 0 (0.0%) |
| $100,000 and over | 860 (98.6%) | 12 (1.4%) |
Public vs Private Health Insurance Coverage by Age in Ahwahnee
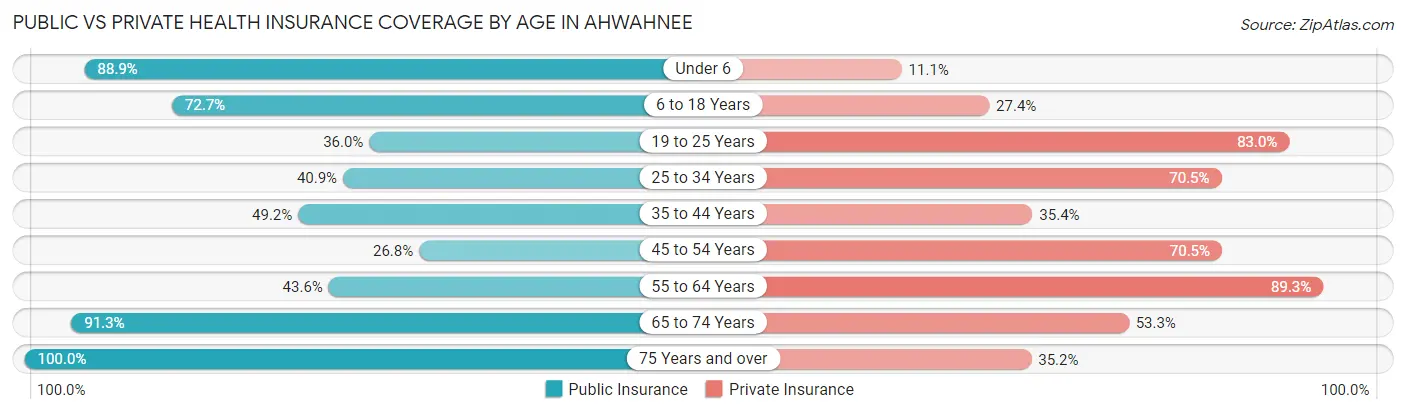
| Age Bracket | Public Insurance | Private Insurance |
| Under 6 | 80 (88.9%) | 10 (11.1%) |
| 6 to 18 Years | 85 (72.7%) | 32 (27.4%) |
| 19 to 25 Years | 102 (36.0%) | 235 (83.0%) |
| 25 to 34 Years | 54 (40.9%) | 93 (70.5%) |
| 35 to 44 Years | 64 (49.2%) | 46 (35.4%) |
| 45 to 54 Years | 30 (26.8%) | 79 (70.5%) |
| 55 to 64 Years | 98 (43.6%) | 201 (89.3%) |
| 65 to 74 Years | 463 (91.3%) | 270 (53.2%) |
| 75 Years and over | 290 (100.0%) | 102 (35.2%) |
| Total | 1,266 (67.1%) | 1,068 (56.6%) |
Disability Status by Sex by Age in Ahwahnee
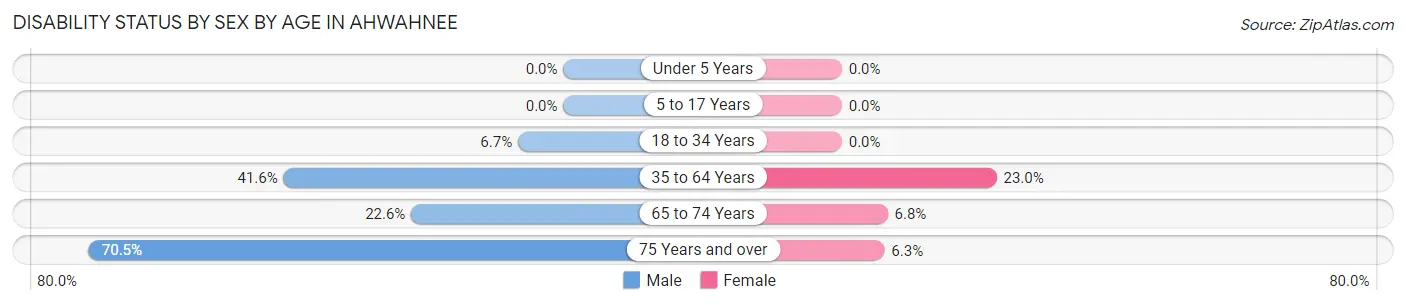
| Age Bracket | Male | Female |
| Under 5 Years | 0 (0.0%) | 0 (0.0%) |
| 5 to 17 Years | 0 (0.0%) | 0 (0.0%) |
| 18 to 34 Years | 19 (6.7%) | 0 (0.0%) |
| 35 to 64 Years | 91 (41.5%) | 57 (23.0%) |
| 65 to 74 Years | 68 (22.6%) | 14 (6.8%) |
| 75 Years and over | 93 (70.5%) | 10 (6.3%) |
Disability Class by Sex by Age in Ahwahnee
Disability Class: Hearing Difficulty
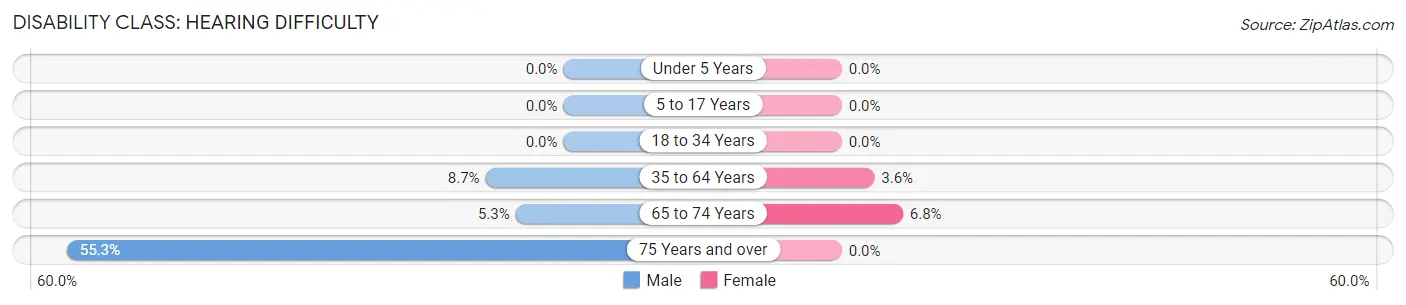
| Age Bracket | Male | Female |
| Under 5 Years | 0 (0.0%) | 0 (0.0%) |
| 5 to 17 Years | 0 (0.0%) | 0 (0.0%) |
| 18 to 34 Years | 0 (0.0%) | 0 (0.0%) |
| 35 to 64 Years | 19 (8.7%) | 9 (3.6%) |
| 65 to 74 Years | 16 (5.3%) | 14 (6.8%) |
| 75 Years and over | 73 (55.3%) | 0 (0.0%) |
Disability Class: Vision Difficulty
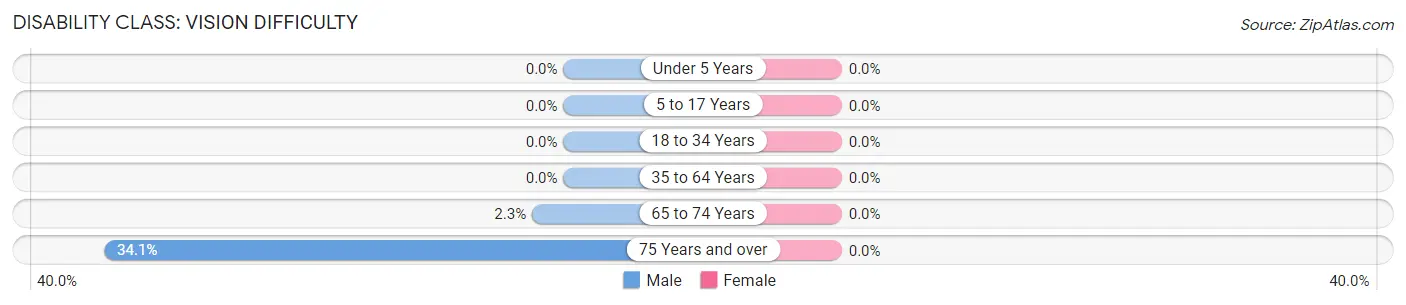
| Age Bracket | Male | Female |
| Under 5 Years | 0 (0.0%) | 0 (0.0%) |
| 5 to 17 Years | 0 (0.0%) | 0 (0.0%) |
| 18 to 34 Years | 0 (0.0%) | 0 (0.0%) |
| 35 to 64 Years | 0 (0.0%) | 0 (0.0%) |
| 65 to 74 Years | 7 (2.3%) | 0 (0.0%) |
| 75 Years and over | 45 (34.1%) | 0 (0.0%) |
Disability Class: Cognitive Difficulty
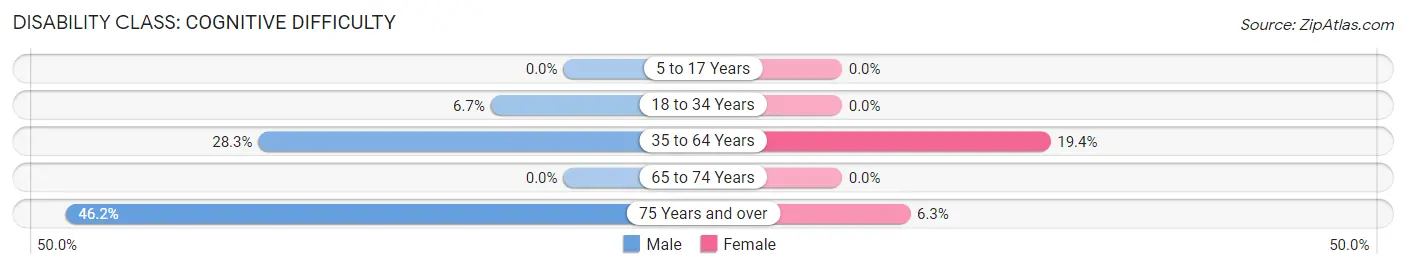
| Age Bracket | Male | Female |
| 5 to 17 Years | 0 (0.0%) | 0 (0.0%) |
| 18 to 34 Years | 19 (6.7%) | 0 (0.0%) |
| 35 to 64 Years | 62 (28.3%) | 48 (19.4%) |
| 65 to 74 Years | 0 (0.0%) | 0 (0.0%) |
| 75 Years and over | 61 (46.2%) | 10 (6.3%) |
Disability Class: Ambulatory Difficulty
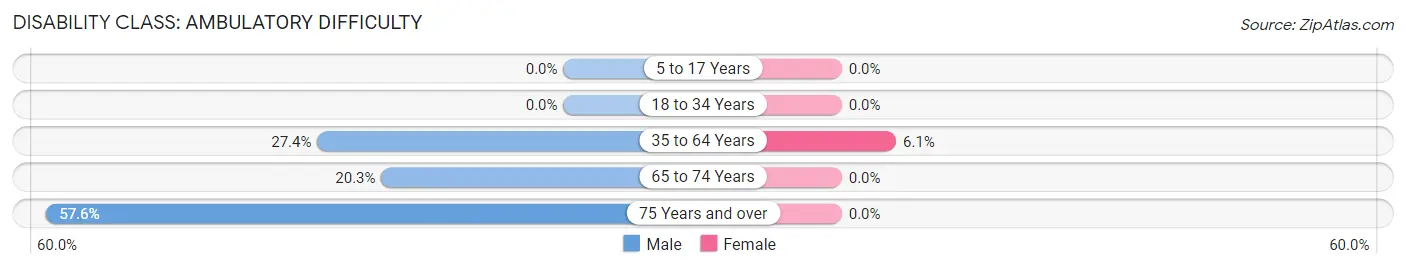
| Age Bracket | Male | Female |
| 5 to 17 Years | 0 (0.0%) | 0 (0.0%) |
| 18 to 34 Years | 0 (0.0%) | 0 (0.0%) |
| 35 to 64 Years | 60 (27.4%) | 15 (6.0%) |
| 65 to 74 Years | 61 (20.3%) | 0 (0.0%) |
| 75 Years and over | 76 (57.6%) | 0 (0.0%) |
Disability Class: Self-Care Difficulty
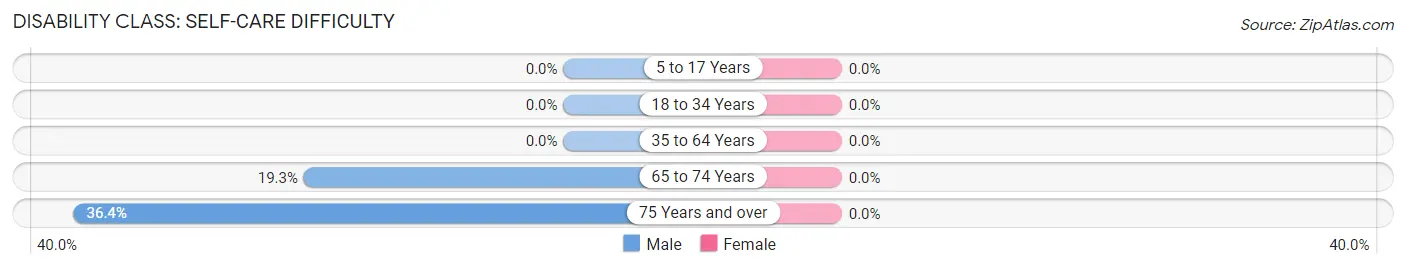
| Age Bracket | Male | Female |
| 5 to 17 Years | 0 (0.0%) | 0 (0.0%) |
| 18 to 34 Years | 0 (0.0%) | 0 (0.0%) |
| 35 to 64 Years | 0 (0.0%) | 0 (0.0%) |
| 65 to 74 Years | 58 (19.3%) | 0 (0.0%) |
| 75 Years and over | 48 (36.4%) | 0 (0.0%) |
Technology Access in Ahwahnee
Computing Device Access in Ahwahnee
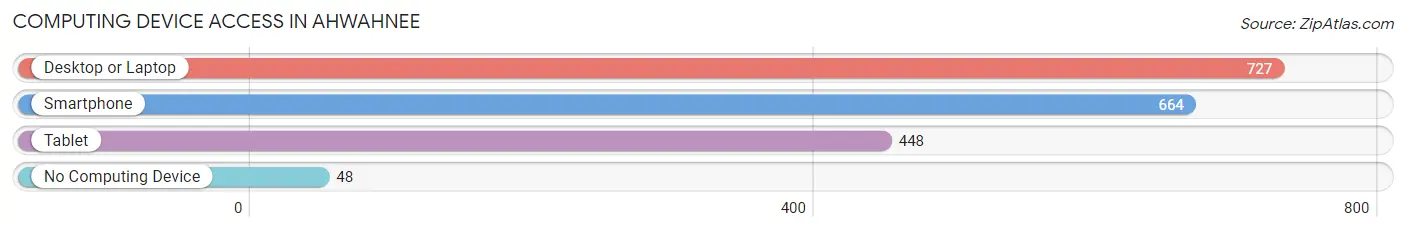
| Device Type | # Households | % Households |
| Desktop or Laptop | 727 | 92.6% |
| Smartphone | 664 | 84.6% |
| Tablet | 448 | 57.1% |
| No Computing Device | 48 | 6.1% |
| Total | 785 | 100.0% |
Internet Access in Ahwahnee
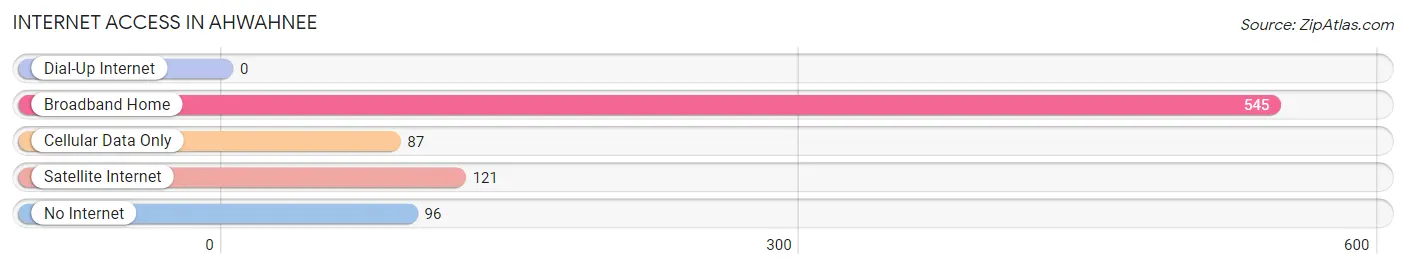
| Internet Type | # Households | % Households |
| Dial-Up Internet | 0 | 0.0% |
| Broadband Home | 545 | 69.4% |
| Cellular Data Only | 87 | 11.1% |
| Satellite Internet | 121 | 15.4% |
| No Internet | 96 | 12.2% |
| Total | 785 | 100.0% |
Ahwahnee Summary
Ahwahnee, California is a small unincorporated community located in Madera County, California. It is situated in the foothills of the Sierra Nevada Mountains, approximately 25 miles northeast of Fresno. The population of Ahwahnee was estimated to be 1,845 in the 2010 census.
History
Ahwahnee was originally inhabited by the Mono Indians, who were the first inhabitants of the area. The Mono Indians were a peaceful tribe who lived in the area for centuries before the arrival of the Europeans. The first Europeans to settle in the area were miners who arrived in the late 1800s. The miners were attracted to the area due to the abundance of gold in the nearby hills. The town was officially founded in 1891 and was named after the Mono Indian word for “big mouth”.
Geography
Ahwahnee is located in the foothills of the Sierra Nevada Mountains, approximately 25 miles northeast of Fresno. The town is situated at an elevation of 1,845 feet above sea level. The town is surrounded by rolling hills and is located in a valley between two mountain ranges. The town is located in a temperate climate zone, with hot summers and mild winters.
Economy
Ahwahnee’s economy is largely based on agriculture and tourism. The town is home to several wineries, as well as a number of small businesses. The town is also home to a number of bed and breakfasts, as well as a few restaurants. The town is also home to a number of small farms, which produce a variety of fruits and vegetables.
Demographics
According to the 2010 census, the population of Ahwahnee was estimated to be 1,845. The population is largely composed of White (83.3%), Hispanic (9.2%), and Native American (2.2%) individuals. The median household income in Ahwahnee is $45,000, and the median age is 44. The town is largely rural, with only a few small businesses and no major industries.
Conclusion
Ahwahnee, California is a small unincorporated community located in Madera County, California. It is situated in the foothills of the Sierra Nevada Mountains, approximately 25 miles northeast of Fresno. The population of Ahwahnee was estimated to be 1,845 in the 2010 census. The town is largely rural, with a largely White, Hispanic, and Native American population. The economy of Ahwahnee is largely based on agriculture and tourism, with a number of wineries, bed and breakfasts, and small businesses.
Common Questions
What is Per Capita Income in Ahwahnee?
Per Capita income in Ahwahnee is $41,727.
What is the Median Family Income in Ahwahnee?
Median Family Income in Ahwahnee is $86,875.
What is the Median Household income in Ahwahnee?
Median Household Income in Ahwahnee is $79,250.
What is Income or Wage Gap in Ahwahnee?
Income or Wage Gap in Ahwahnee is 74.0%.
Women in Ahwahnee earn 26.0 cents for every dollar earned by a man.
What is Inequality or Gini Index in Ahwahnee?
Inequality or Gini Index in Ahwahnee is 0.43.
What is the Total Population of Ahwahnee?
Total Population of Ahwahnee is 1,896.
What is the Total Male Population of Ahwahnee?
Total Male Population of Ahwahnee is 1,037.
What is the Total Female Population of Ahwahnee?
Total Female Population of Ahwahnee is 859.
What is the Ratio of Males per 100 Females in Ahwahnee?
There are 120.72 Males per 100 Females in Ahwahnee.
What is the Ratio of Females per 100 Males in Ahwahnee?
There are 82.84 Females per 100 Males in Ahwahnee.
What is the Median Population Age in Ahwahnee?
Median Population Age in Ahwahnee is 58.4 Years.
What is the Average Family Size in Ahwahnee
Average Family Size in Ahwahnee is 2.6 People.
What is the Average Household Size in Ahwahnee
Average Household Size in Ahwahnee is 2.4 People.
How Large is the Labor Force in Ahwahnee?
There are 851 People in the Labor Forcein in Ahwahnee.
What is the Percentage of People in the Labor Force in Ahwahnee?
49.0% of People are in the Labor Force in Ahwahnee.
What is the Unemployment Rate in Ahwahnee?
Unemployment Rate in Ahwahnee is 6.9%.