Cities with the Lowest Poverty Level Among Seniors Over the Age of 75 in Illinois
RELATED REPORTS & OPTIONS
Lowest Poverty | Seniors 75+
Illinois
Compare Cities
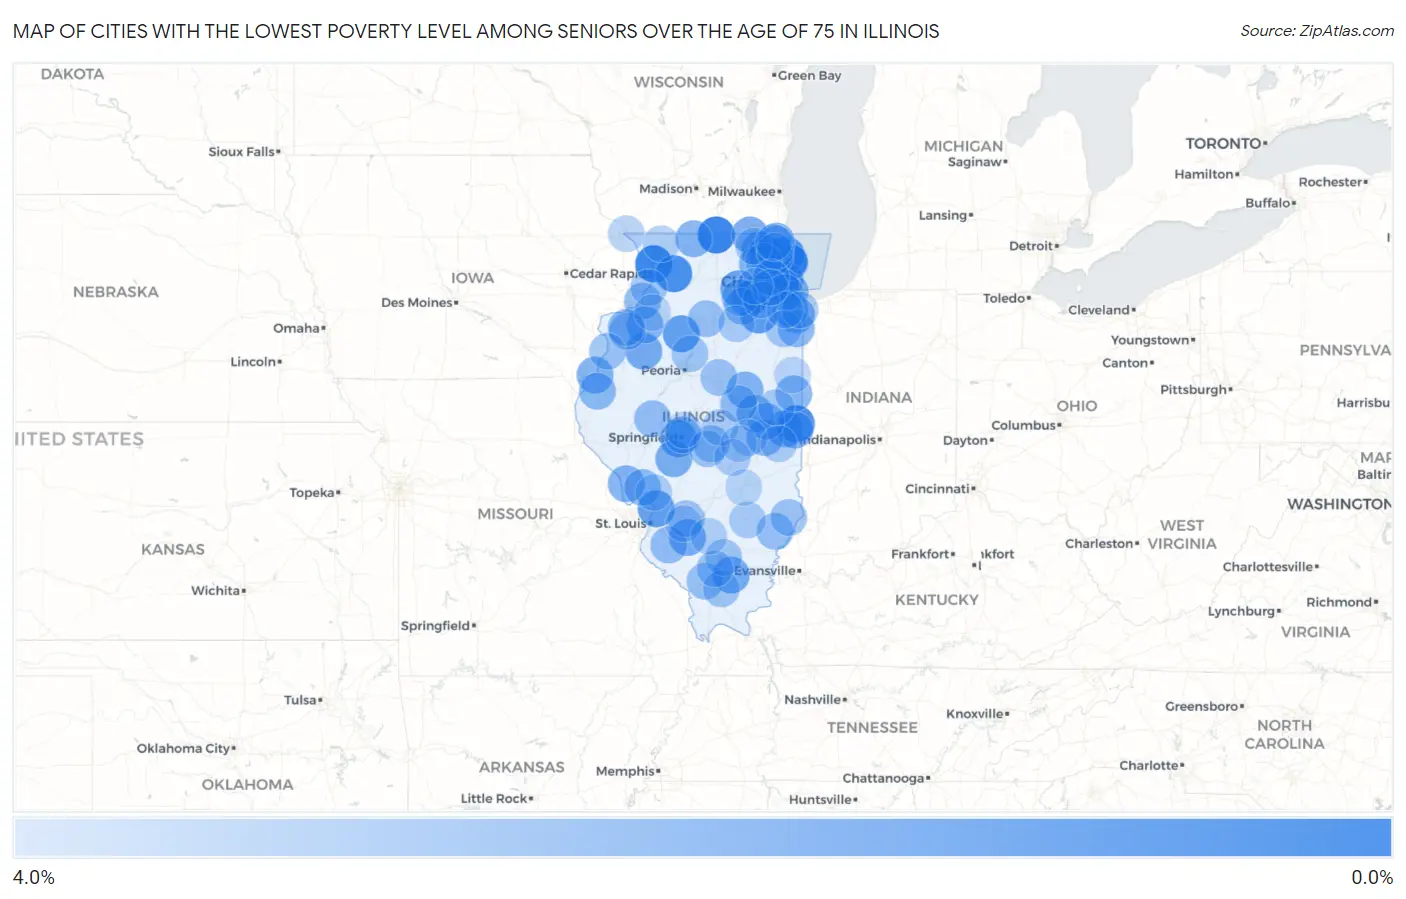
Map of Cities with the Lowest Poverty Level Among Seniors Over the Age of 75 in Illinois
4.0%
0.0%
Cities with the Lowest Poverty Level Among Seniors Over the Age of 75 in Illinois
| City | Senior Poverty | vs State | vs National | |
| 1. | South Beloit | 0.27% | 10.4%(-10.1)#1 | 11.1%(-10.8)#21 |
| 2. | Glencoe | 0.35% | 10.4%(-10.1)#2 | 11.1%(-10.7)#33 |
| 3. | Savanna | 0.37% | 10.4%(-10.0)#3 | 11.1%(-10.7)#37 |
| 4. | Georgetown | 0.64% | 10.4%(-9.77)#4 | 11.1%(-10.4)#73 |
| 5. | Milledgeville | 0.78% | 10.4%(-9.63)#5 | 11.1%(-10.3)#100 |
| 6. | Highwood | 0.93% | 10.4%(-9.48)#6 | 11.1%(-10.1)#128 |
| 7. | Channahon | 1.3% | 10.4%(-9.16)#7 | 11.1%(-9.81)#205 |
| 8. | Berkeley | 1.3% | 10.4%(-9.08)#8 | 11.1%(-9.74)#229 |
| 9. | Bradford | 1.4% | 10.4%(-9.02)#9 | 11.1%(-9.68)#253 |
| 10. | Hartford | 1.4% | 10.4%(-8.99)#10 | 11.1%(-9.65)#264 |
| 11. | Itasca | 1.5% | 10.4%(-8.90)#11 | 11.1%(-9.56)#296 |
| 12. | Leland Grove | 1.6% | 10.4%(-8.85)#12 | 11.1%(-9.50)#323 |
| 13. | Hinckley | 1.6% | 10.4%(-8.80)#13 | 11.1%(-9.45)#342 |
| 14. | River Forest | 1.8% | 10.4%(-8.64)#14 | 11.1%(-9.29)#413 |
| 15. | Prairie Grove | 1.9% | 10.4%(-8.56)#15 | 11.1%(-9.22)#448 |
| 16. | East Galesburg | 1.9% | 10.4%(-8.56)#16 | 11.1%(-9.22)#451 |
| 17. | Grandwood Park | 1.9% | 10.4%(-8.54)#17 | 11.1%(-9.20)#456 |
| 18. | Thompsonville | 1.9% | 10.4%(-8.52)#18 | 11.1%(-9.18)#468 |
| 19. | Oswego | 1.9% | 10.4%(-8.52)#19 | 11.1%(-9.17)#470 |
| 20. | Okawville | 1.9% | 10.4%(-8.51)#20 | 11.1%(-9.17)#472 |
| 21. | Hebron | 2.0% | 10.4%(-8.45)#21 | 11.1%(-9.11)#495 |
| 22. | Virden | 2.0% | 10.4%(-8.40)#22 | 11.1%(-9.05)#528 |
| 23. | Dallas City | 2.1% | 10.4%(-8.35)#23 | 11.1%(-9.01)#565 |
| 24. | Crete | 2.1% | 10.4%(-8.34)#24 | 11.1%(-9.00)#569 |
| 25. | Sidell | 2.1% | 10.4%(-8.33)#25 | 11.1%(-8.98)#579 |
| 26. | Bondville | 2.1% | 10.4%(-8.33)#26 | 11.1%(-8.98)#582 |
| 27. | Oakbrook Terrace | 2.2% | 10.4%(-8.26)#27 | 11.1%(-8.92)#615 |
| 28. | Hardin | 2.2% | 10.4%(-8.24)#28 | 11.1%(-8.89)#639 |
| 29. | Saybrook | 2.2% | 10.4%(-8.24)#29 | 11.1%(-8.89)#640 |
| 30. | Boulder Hill | 2.2% | 10.4%(-8.23)#30 | 11.1%(-8.89)#646 |
| 31. | Hometown | 2.2% | 10.4%(-8.23)#31 | 11.1%(-8.89)#648 |
| 32. | Sleepy Hollow | 2.2% | 10.4%(-8.20)#32 | 11.1%(-8.85)#662 |
| 33. | Davis | 2.2% | 10.4%(-8.19)#33 | 11.1%(-8.84)#671 |
| 34. | Andover | 2.2% | 10.4%(-8.19)#34 | 11.1%(-8.84)#672 |
| 35. | Ridge Farm | 2.3% | 10.4%(-8.14)#35 | 11.1%(-8.79)#704 |
| 36. | Rossville | 2.4% | 10.4%(-8.05)#36 | 11.1%(-8.70)#752 |
| 37. | Grandview | 2.4% | 10.4%(-8.03)#37 | 11.1%(-8.69)#762 |
| 38. | Winnetka | 2.4% | 10.4%(-7.99)#38 | 11.1%(-8.65)#790 |
| 39. | Grant Park | 2.4% | 10.4%(-7.99)#39 | 11.1%(-8.65)#792 |
| 40. | Tower Lakes | 2.4% | 10.4%(-7.99)#40 | 11.1%(-8.65)#795 |
| 41. | Camargo | 2.4% | 10.4%(-7.97)#41 | 11.1%(-8.63)#808 |
| 42. | Yorkville | 2.4% | 10.4%(-7.97)#42 | 11.1%(-8.62)#814 |
| 43. | Western Springs | 2.5% | 10.4%(-7.95)#43 | 11.1%(-8.61)#825 |
| 44. | Carthage | 2.5% | 10.4%(-7.93)#44 | 11.1%(-8.59)#836 |
| 45. | Jerseyville | 2.5% | 10.4%(-7.89)#45 | 11.1%(-8.55)#869 |
| 46. | Port Byron | 2.5% | 10.4%(-7.89)#46 | 11.1%(-8.55)#871 |
| 47. | Philo | 2.5% | 10.4%(-7.89)#47 | 11.1%(-8.55)#872 |
| 48. | Matteson | 2.5% | 10.4%(-7.88)#48 | 11.1%(-8.54)#876 |
| 49. | Long Grove | 2.5% | 10.4%(-7.88)#49 | 11.1%(-8.54)#877 |
| 50. | Viola | 2.6% | 10.4%(-7.81)#50 | 11.1%(-8.47)#925 |
| 51. | Farmer City | 2.6% | 10.4%(-7.80)#51 | 11.1%(-8.45)#938 |
| 52. | Matherville | 2.6% | 10.4%(-7.78)#52 | 11.1%(-8.44)#954 |
| 53. | New Athens | 2.6% | 10.4%(-7.76)#53 | 11.1%(-8.42)#965 |
| 54. | Newark | 2.7% | 10.4%(-7.71)#54 | 11.1%(-8.36)#999 |
| 55. | Chandlerville | 2.7% | 10.4%(-7.71)#55 | 11.1%(-8.36)#1,003 |
| 56. | West Salem | 2.7% | 10.4%(-7.67)#56 | 11.1%(-8.33)#1,040 |
| 57. | De Soto | 2.8% | 10.4%(-7.61)#57 | 11.1%(-8.26)#1,085 |
| 58. | Ladd | 2.8% | 10.4%(-7.61)#58 | 11.1%(-8.26)#1,086 |
| 59. | Blue Mound | 2.8% | 10.4%(-7.61)#59 | 11.1%(-8.26)#1,087 |
| 60. | Gages Lake | 2.8% | 10.4%(-7.59)#60 | 11.1%(-8.25)#1,096 |
| 61. | Sandwich | 2.8% | 10.4%(-7.58)#61 | 11.1%(-8.24)#1,108 |
| 62. | Stonington | 2.9% | 10.4%(-7.51)#62 | 11.1%(-8.17)#1,164 |
| 63. | Bridgeport | 2.9% | 10.4%(-7.50)#63 | 11.1%(-8.15)#1,170 |
| 64. | Oquawka | 2.9% | 10.4%(-7.50)#64 | 11.1%(-8.15)#1,171 |
| 65. | Hudson | 2.9% | 10.4%(-7.47)#65 | 11.1%(-8.13)#1,185 |
| 66. | St Rose | 2.9% | 10.4%(-7.47)#66 | 11.1%(-8.13)#1,195 |
| 67. | Albany | 3.0% | 10.4%(-7.42)#67 | 11.1%(-8.08)#1,229 |
| 68. | Marion | 3.0% | 10.4%(-7.42)#68 | 11.1%(-8.08)#1,235 |
| 69. | Chillicothe | 3.0% | 10.4%(-7.41)#69 | 11.1%(-8.07)#1,240 |
| 70. | Barrington Hills | 3.0% | 10.4%(-7.39)#70 | 11.1%(-8.04)#1,255 |
| 71. | Ina | 3.0% | 10.4%(-7.38)#71 | 11.1%(-8.04)#1,261 |
| 72. | North City | 3.0% | 10.4%(-7.38)#72 | 11.1%(-8.04)#1,267 |
| 73. | Atwood | 3.1% | 10.4%(-7.35)#73 | 11.1%(-8.01)#1,294 |
| 74. | Hickory Hills | 3.1% | 10.4%(-7.33)#74 | 11.1%(-7.99)#1,307 |
| 75. | Manteno | 3.1% | 10.4%(-7.29)#75 | 11.1%(-7.95)#1,337 |
| 76. | Bull Valley | 3.1% | 10.4%(-7.28)#76 | 11.1%(-7.94)#1,342 |
| 77. | Sauk Village | 3.2% | 10.4%(-7.24)#77 | 11.1%(-7.90)#1,380 |
| 78. | Flora | 3.2% | 10.4%(-7.17)#78 | 11.1%(-7.83)#1,449 |
| 79. | Marseilles | 3.3% | 10.4%(-7.13)#79 | 11.1%(-7.79)#1,481 |
| 80. | Aviston | 3.3% | 10.4%(-7.11)#80 | 11.1%(-7.77)#1,492 |
| 81. | Plainfield | 3.3% | 10.4%(-7.09)#81 | 11.1%(-7.75)#1,511 |
| 82. | Forsyth | 3.3% | 10.4%(-7.08)#82 | 11.1%(-7.73)#1,515 |
| 83. | Findlay | 3.3% | 10.4%(-7.08)#83 | 11.1%(-7.73)#1,527 |
| 84. | Royal | 3.3% | 10.4%(-7.08)#84 | 11.1%(-7.73)#1,531 |
| 85. | Brocton | 3.3% | 10.4%(-7.08)#85 | 11.1%(-7.73)#1,535 |
| 86. | Mundelein | 3.3% | 10.4%(-7.06)#86 | 11.1%(-7.72)#1,544 |
| 87. | Brighton | 3.4% | 10.4%(-7.05)#87 | 11.1%(-7.71)#1,555 |
| 88. | East Dubuque | 3.4% | 10.4%(-6.98)#88 | 11.1%(-7.64)#1,616 |
| 89. | Stockton | 3.4% | 10.4%(-6.96)#89 | 11.1%(-7.62)#1,630 |
| 90. | Irvington | 3.4% | 10.4%(-6.96)#90 | 11.1%(-7.62)#1,639 |
| 91. | Glendale Heights | 3.5% | 10.4%(-6.90)#91 | 11.1%(-7.56)#1,679 |
| 92. | Third Lake | 3.5% | 10.4%(-6.88)#92 | 11.1%(-7.54)#1,700 |
| 93. | Lovington | 3.6% | 10.4%(-6.84)#93 | 11.1%(-7.50)#1,742 |
| 94. | Frankfort | 3.6% | 10.4%(-6.80)#94 | 11.1%(-7.46)#1,785 |
| 95. | Effingham | 3.6% | 10.4%(-6.79)#95 | 11.1%(-7.45)#1,788 |
| 96. | Sherman | 3.6% | 10.4%(-6.79)#96 | 11.1%(-7.45)#1,789 |
| 97. | Lisle | 3.6% | 10.4%(-6.77)#97 | 11.1%(-7.43)#1,811 |
| 98. | North Aurora | 3.6% | 10.4%(-6.77)#98 | 11.1%(-7.43)#1,813 |
| 99. | Geneseo | 3.7% | 10.4%(-6.76)#99 | 11.1%(-7.41)#1,820 |
| 100. | Milford | 3.7% | 10.4%(-6.75)#100 | 11.1%(-7.41)#1,826 |
Common Questions
What are the Top 10 Cities with the Lowest Poverty Level Among Seniors Over the Age of 75 in Illinois?
Top 10 Cities with the Lowest Poverty Level Among Seniors Over the Age of 75 in Illinois are:
#1
0.27%
#2
0.35%
#3
0.37%
#4
0.64%
#5
0.78%
#6
0.93%
#7
1.3%
#8
1.3%
#9
1.4%
#10
1.4%
What city has the Lowest Poverty Level Among Seniors Over the Age of 75 in Illinois?
South Beloit has the Lowest Poverty Level Among Seniors Over the Age of 75 in Illinois with 0.27%.
What is the Poverty Level Among Seniors Over the Age of 75 in the State of Illinois?
Poverty Level Among Seniors Over the Age of 75 in Illinois is 10.4%.
What is the Poverty Level Among Seniors Over the Age of 75 in the United States?
Poverty Level Among Seniors Over the Age of 75 in the United States is 11.1%.