Westlake Village, CA Map & Demographics
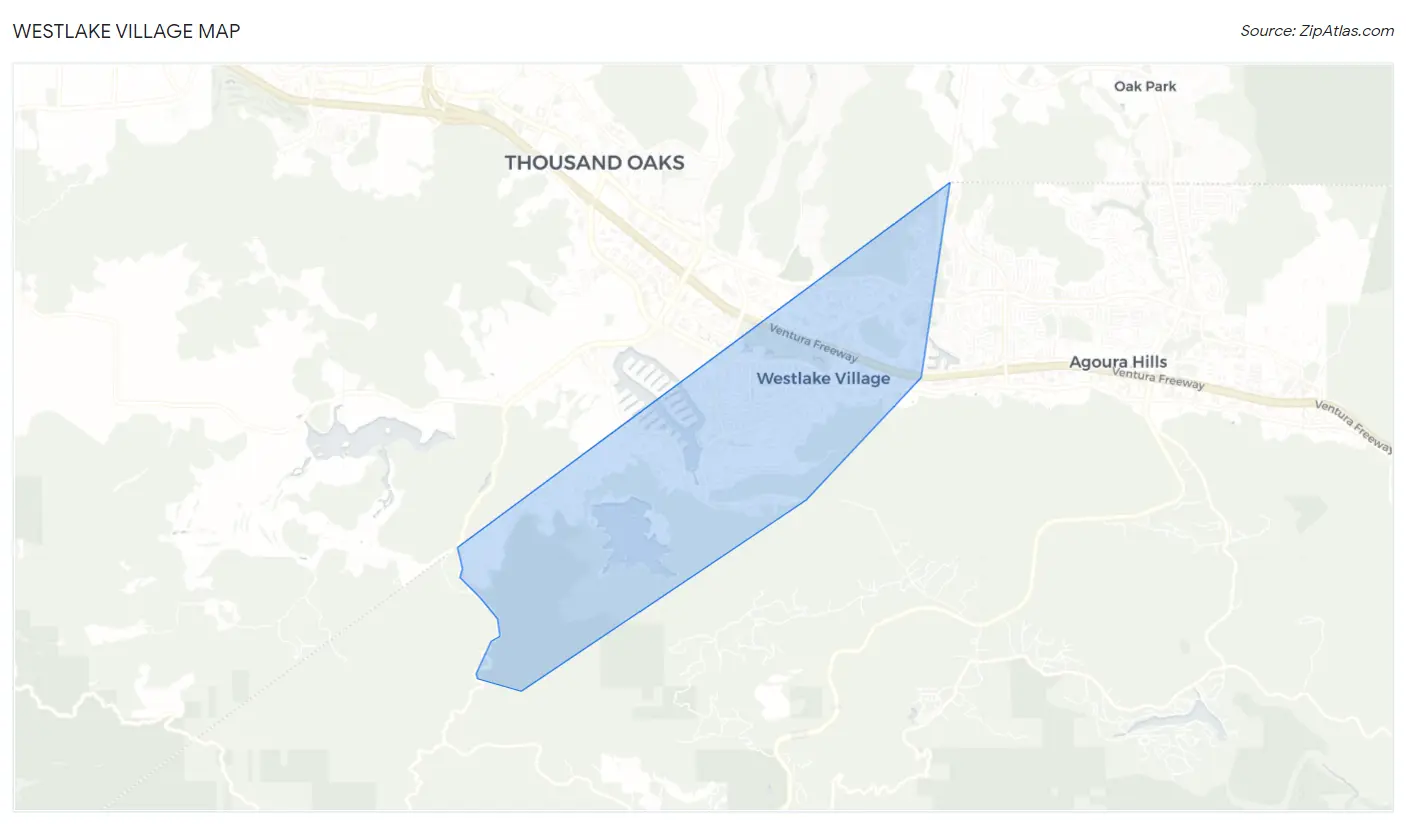
Westlake Village Map
Westlake Village Overview
$99,908
PER CAPITA INCOME
$208,788
AVG FAMILY INCOME
$188,681
AVG HOUSEHOLD INCOME
42.0%
WAGE / INCOME GAP [ % ]
58.0¢/ $1
WAGE / INCOME GAP [ $ ]
0.49
INEQUALITY / GINI INDEX
7,948
TOTAL POPULATION
3,862
MALE POPULATION
4,086
FEMALE POPULATION
94.52
MALES / 100 FEMALES
105.80
FEMALES / 100 MALES
51.2
MEDIAN AGE
3.0
AVG FAMILY SIZE
2.5
AVG HOUSEHOLD SIZE
3,866
LABOR FORCE [ PEOPLE ]
57.1%
PERCENT IN LABOR FORCE
2.9%
UNEMPLOYMENT RATE
Westlake Village Zip Codes
Income in Westlake Village
Income Overview in Westlake Village
Per Capita Income in Westlake Village is $99,908, while median incomes of families and households are $208,788 and $188,681 respectively.
| Characteristic | Number | Measure |
| Per Capita Income | 7,948 | $99,908 |
| Median Family Income | 2,264 | $208,788 |
| Mean Family Income | 2,264 | $296,416 |
| Median Household Income | 3,115 | $188,681 |
| Mean Household Income | 3,115 | $249,526 |
| Income Deficit | 2,264 | $0 |
| Wage / Income Gap (%) | 7,948 | 41.96% |
| Wage / Income Gap ($) | 7,948 | 58.04¢ per $1 |
| Gini / Inequality Index | 7,948 | 0.49 |
Earnings by Sex in Westlake Village
Average Earnings in Westlake Village are $79,435, $103,708 for men and $60,192 for women, a difference of 42.0%.
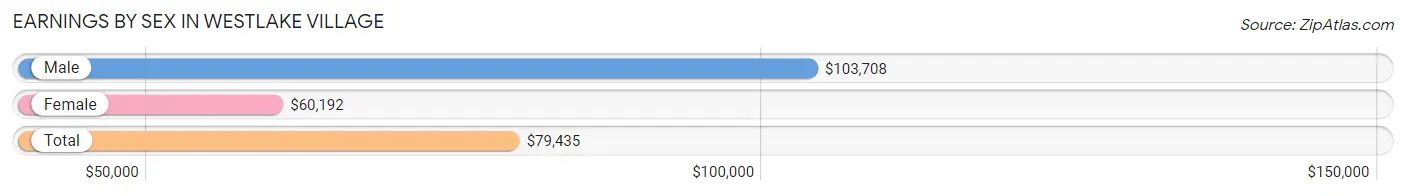
| Sex | Number | Average Earnings |
| Male | 2,255 (55.3%) | $103,708 |
| Female | 1,826 (44.7%) | $60,192 |
| Total | 4,081 (100.0%) | $79,435 |
Earnings by Sex by Income Bracket in Westlake Village
The most common earnings brackets in Westlake Village are $100,000+ for men (1,167 | 51.7%) and $100,000+ for women (565 | 30.9%).
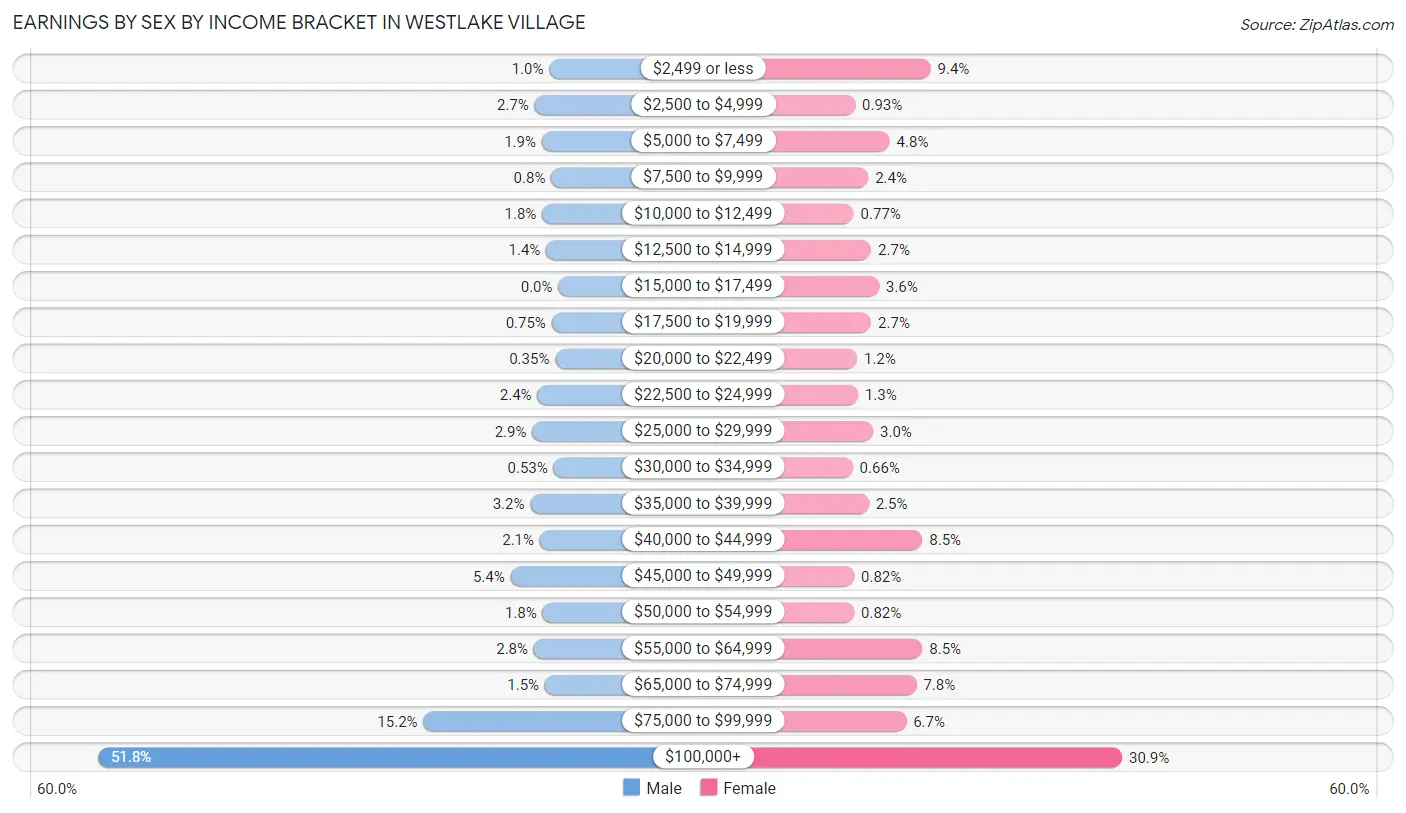
| Income | Male | Female |
| $2,499 or less | 23 (1.0%) | 172 (9.4%) |
| $2,500 to $4,999 | 60 (2.7%) | 17 (0.9%) |
| $5,000 to $7,499 | 42 (1.9%) | 88 (4.8%) |
| $7,500 to $9,999 | 18 (0.8%) | 44 (2.4%) |
| $10,000 to $12,499 | 41 (1.8%) | 14 (0.8%) |
| $12,500 to $14,999 | 31 (1.4%) | 50 (2.7%) |
| $15,000 to $17,499 | 0 (0.0%) | 66 (3.6%) |
| $17,500 to $19,999 | 17 (0.7%) | 50 (2.7%) |
| $20,000 to $22,499 | 8 (0.4%) | 21 (1.1%) |
| $22,500 to $24,999 | 53 (2.4%) | 23 (1.3%) |
| $25,000 to $29,999 | 66 (2.9%) | 54 (3.0%) |
| $30,000 to $34,999 | 12 (0.5%) | 12 (0.7%) |
| $35,000 to $39,999 | 71 (3.2%) | 45 (2.5%) |
| $40,000 to $44,999 | 47 (2.1%) | 155 (8.5%) |
| $45,000 to $49,999 | 121 (5.4%) | 15 (0.8%) |
| $50,000 to $54,999 | 40 (1.8%) | 15 (0.8%) |
| $55,000 to $64,999 | 62 (2.8%) | 155 (8.5%) |
| $65,000 to $74,999 | 34 (1.5%) | 143 (7.8%) |
| $75,000 to $99,999 | 342 (15.2%) | 122 (6.7%) |
| $100,000+ | 1,167 (51.7%) | 565 (30.9%) |
| Total | 2,255 (100.0%) | 1,826 (100.0%) |
Earnings by Sex by Educational Attainment in Westlake Village
Average earnings in Westlake Village are $110,455 for men and $63,390 for women, a difference of 42.6%. Men with an educational attainment of graduate degree enjoy the highest average annual earnings of $178,269, while those with high school diploma education earn the least with $50,833. Women with an educational attainment of bachelor's degree earn the most with the average annual earnings of $90,455, while those with college or associate's degree education have the smallest earnings of $28,750.
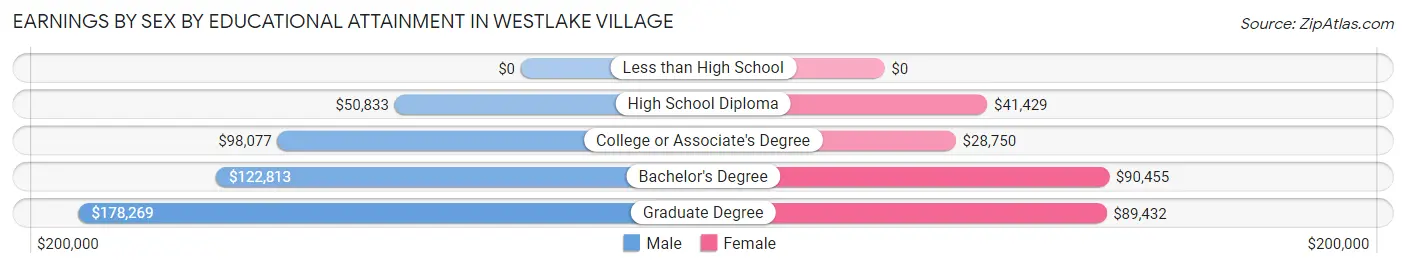
| Educational Attainment | Male Income | Female Income |
| Less than High School | - | - |
| High School Diploma | $50,833 | $41,429 |
| College or Associate's Degree | $98,077 | $28,750 |
| Bachelor's Degree | $122,813 | $90,455 |
| Graduate Degree | $178,269 | $89,432 |
| Total | $110,455 | $63,390 |
Family Income in Westlake Village
Family Income Brackets in Westlake Village
According to the Westlake Village family income data, there are 1,180 families falling into the $200,000+ income range, which is the most common income bracket and makes up 52.1% of all families.
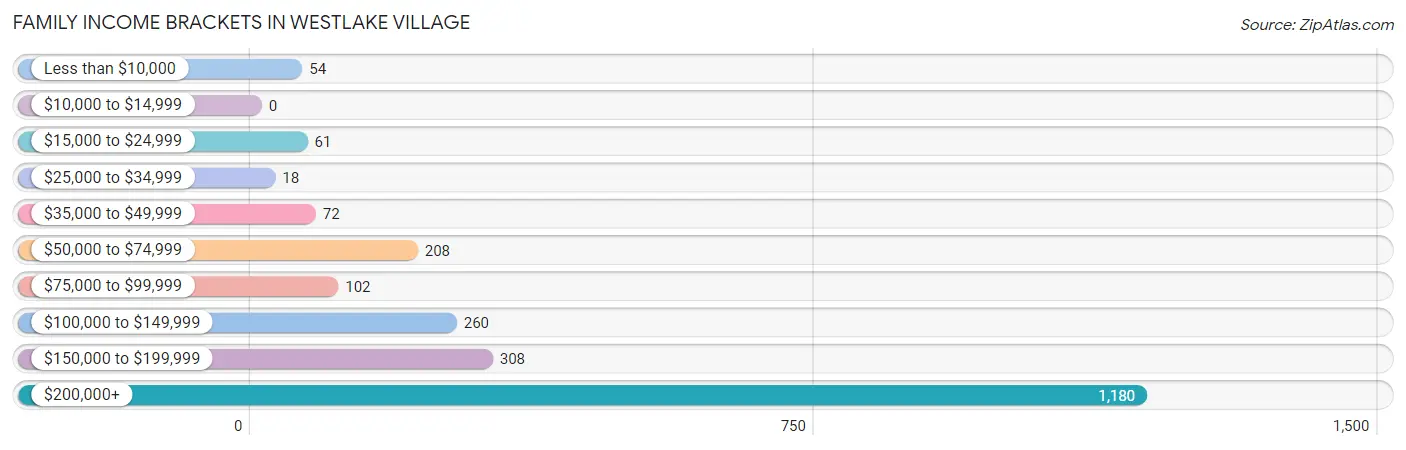
| Income Bracket | # Families | % Families |
| Less than $10,000 | 54 | 2.4% |
| $10,000 to $14,999 | 0 | 0.0% |
| $15,000 to $24,999 | 61 | 2.7% |
| $25,000 to $34,999 | 18 | 0.8% |
| $35,000 to $49,999 | 72 | 3.2% |
| $50,000 to $74,999 | 208 | 9.2% |
| $75,000 to $99,999 | 102 | 4.5% |
| $100,000 to $149,999 | 260 | 11.5% |
| $150,000 to $199,999 | 308 | 13.6% |
| $200,000+ | 1,180 | 52.1% |
Family Income by Famaliy Size in Westlake Village
4-person families (422 | 18.6%) account for the highest median family income in Westlake Village with $250,001 per family, while 2-person families (1,228 | 54.2%) have the highest median income of $95,368 per family member.
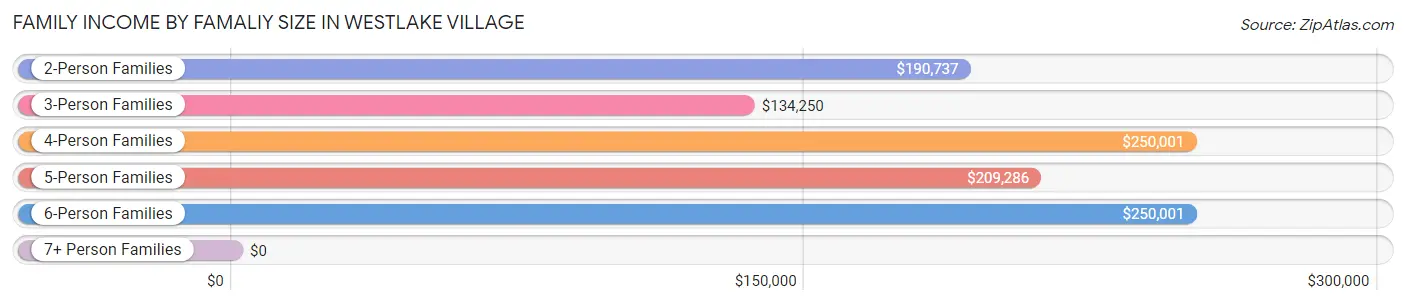
| Income Bracket | # Families | Median Income |
| 2-Person Families | 1,228 (54.2%) | $190,737 |
| 3-Person Families | 444 (19.6%) | $134,250 |
| 4-Person Families | 422 (18.6%) | $250,001 |
| 5-Person Families | 68 (3.0%) | $209,286 |
| 6-Person Families | 86 (3.8%) | $250,001 |
| 7+ Person Families | 16 (0.7%) | $0 |
| Total | 2,264 (100.0%) | $208,788 |
Family Income by Number of Earners in Westlake Village
The median family income in Westlake Village is $208,788, with families comprising 3+ earners (179) having the highest median family income of $250,001, while families with no earners (445) have the lowest median family income of $95,208, accounting for 7.9% and 19.7% of families, respectively.
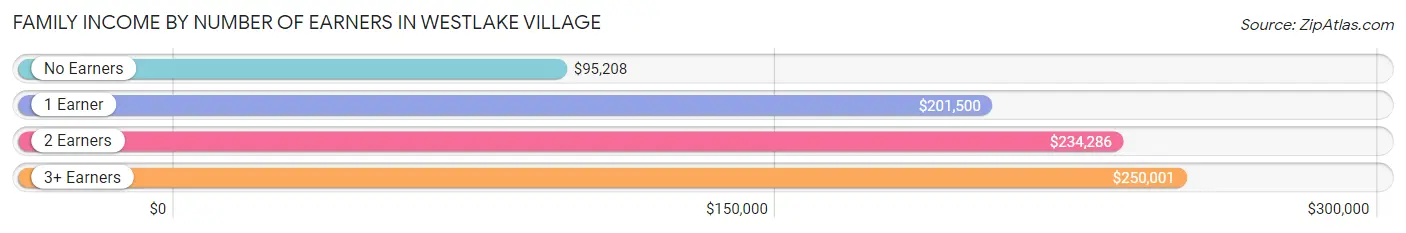
| Number of Earners | # Families | Median Income |
| No Earners | 445 (19.7%) | $95,208 |
| 1 Earner | 626 (27.7%) | $201,500 |
| 2 Earners | 1,014 (44.8%) | $234,286 |
| 3+ Earners | 179 (7.9%) | $250,001 |
| Total | 2,264 (100.0%) | $208,788 |
Household Income in Westlake Village
Household Income Brackets in Westlake Village
With 1,402 households falling in the category, the $200,000+ income range is the most frequent in Westlake Village, accounting for 45.0% of all households. In contrast, only 50 households (1.6%) fall into the $25,000 to $34,999 income bracket, making it the least populous group.
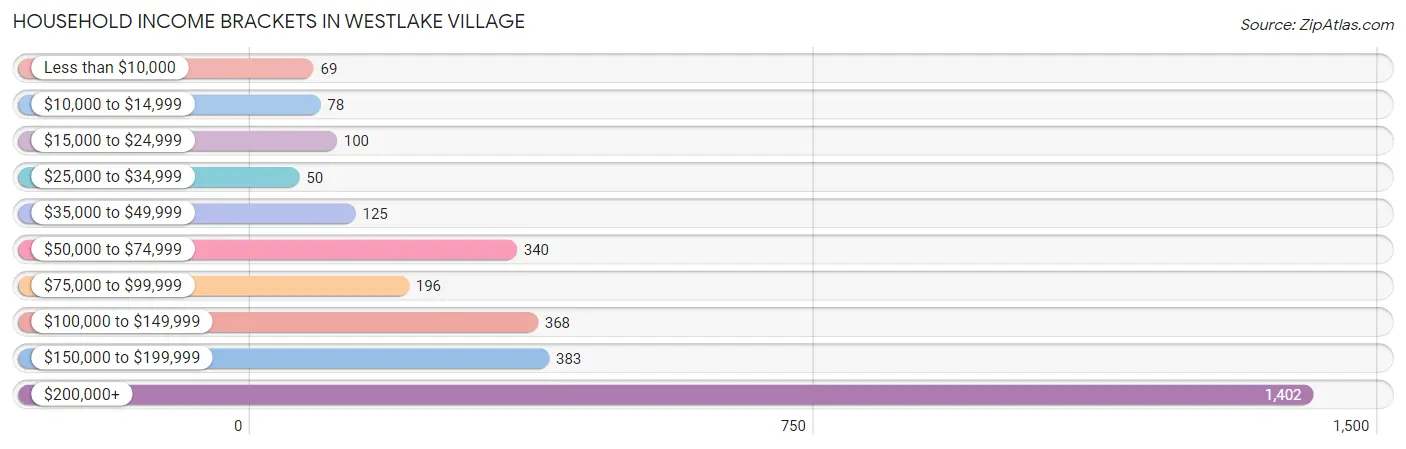
| Income Bracket | # Households | % Households |
| Less than $10,000 | 69 | 2.2% |
| $10,000 to $14,999 | 78 | 2.5% |
| $15,000 to $24,999 | 100 | 3.2% |
| $25,000 to $34,999 | 50 | 1.6% |
| $35,000 to $49,999 | 125 | 4.0% |
| $50,000 to $74,999 | 340 | 10.9% |
| $75,000 to $99,999 | 196 | 6.3% |
| $100,000 to $149,999 | 368 | 11.8% |
| $150,000 to $199,999 | 383 | 12.3% |
| $200,000+ | 1,402 | 45.0% |
Household Income by Householder Age in Westlake Village
The median household income in Westlake Village is $188,681, with the highest median household income of $234,821 found in the 25 to 44 years age bracket for the primary householder. A total of 485 households (15.6%) fall into this category. Meanwhile, the 15 to 24 years age bracket for the primary householder has the lowest median household income of $0, with 25 households (0.8%) in this group.
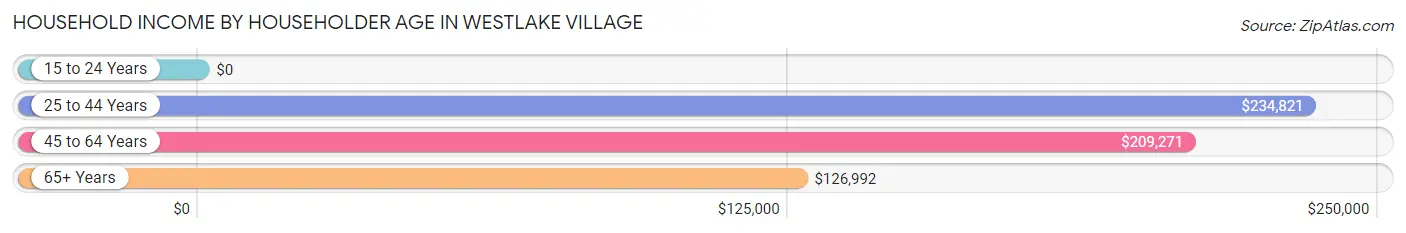
| Income Bracket | # Households | Median Income |
| 15 to 24 Years | 25 (0.8%) | $0 |
| 25 to 44 Years | 485 (15.6%) | $234,821 |
| 45 to 64 Years | 1,280 (41.1%) | $209,271 |
| 65+ Years | 1,325 (42.5%) | $126,992 |
| Total | 3,115 (100.0%) | $188,681 |
Poverty in Westlake Village
Income Below Poverty by Sex and Age in Westlake Village
With 2.9% poverty level for males and 6.9% for females among the residents of Westlake Village, under 5 year old males and 25 to 34 year old females are the most vulnerable to poverty, with 39 males (30.0%) and 53 females (21.4%) in their respective age groups living below the poverty level.
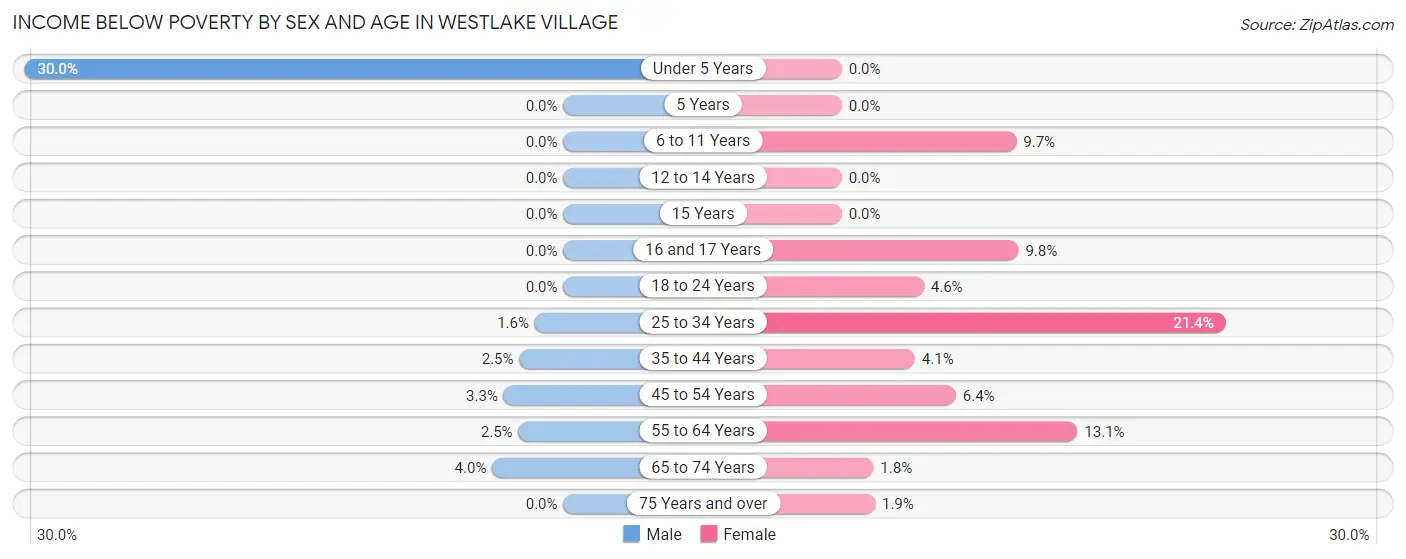
| Age Bracket | Male | Female |
| Under 5 Years | 39 (30.0%) | 0 (0.0%) |
| 5 Years | 0 (0.0%) | 0 (0.0%) |
| 6 to 11 Years | 0 (0.0%) | 35 (9.7%) |
| 12 to 14 Years | 0 (0.0%) | 0 (0.0%) |
| 15 Years | 0 (0.0%) | 0 (0.0%) |
| 16 and 17 Years | 0 (0.0%) | 19 (9.8%) |
| 18 to 24 Years | 0 (0.0%) | 8 (4.6%) |
| 25 to 34 Years | 6 (1.6%) | 53 (21.4%) |
| 35 to 44 Years | 7 (2.5%) | 21 (4.1%) |
| 45 to 54 Years | 22 (3.3%) | 35 (6.4%) |
| 55 to 64 Years | 15 (2.5%) | 92 (13.1%) |
| 65 to 74 Years | 25 (4.0%) | 12 (1.8%) |
| 75 Years and over | 0 (0.0%) | 8 (1.8%) |
| Total | 114 (2.9%) | 283 (6.9%) |
Income Above Poverty by Sex and Age in Westlake Village
According to the poverty statistics in Westlake Village, males aged 5 years and females aged under 5 years are the age groups that are most secure financially, with 100.0% of males and 100.0% of females in these age groups living above the poverty line.
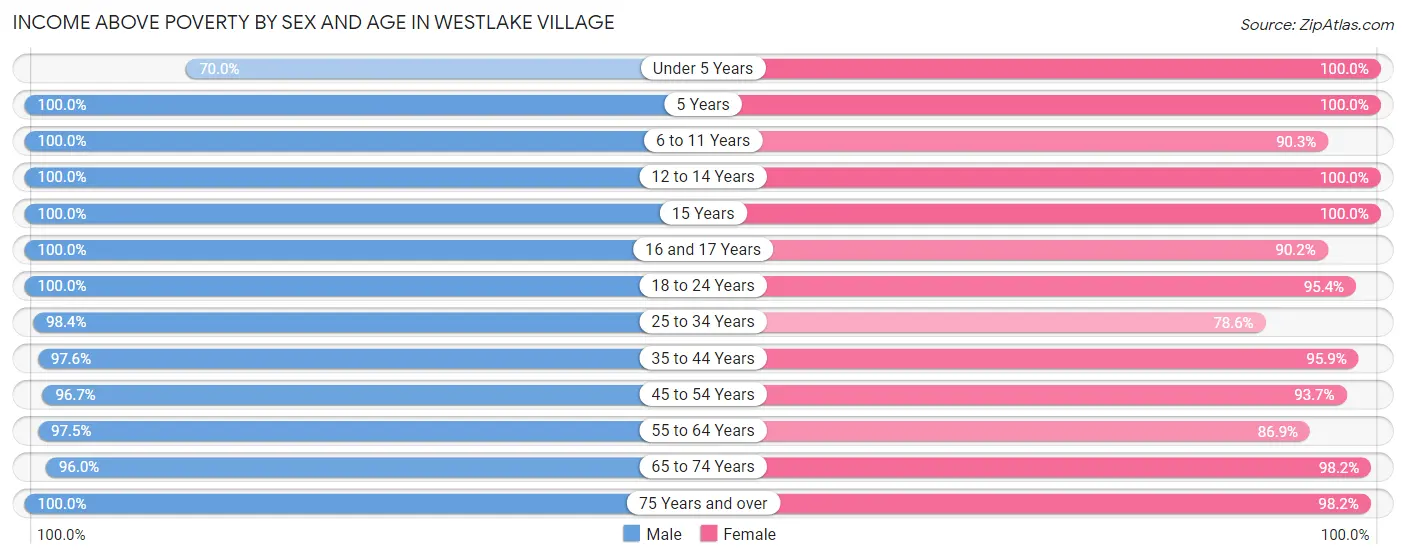
| Age Bracket | Male | Female |
| Under 5 Years | 91 (70.0%) | 73 (100.0%) |
| 5 Years | 9 (100.0%) | 8 (100.0%) |
| 6 to 11 Years | 279 (100.0%) | 325 (90.3%) |
| 12 to 14 Years | 165 (100.0%) | 95 (100.0%) |
| 15 Years | 11 (100.0%) | 48 (100.0%) |
| 16 and 17 Years | 110 (100.0%) | 174 (90.2%) |
| 18 to 24 Years | 133 (100.0%) | 167 (95.4%) |
| 25 to 34 Years | 372 (98.4%) | 195 (78.6%) |
| 35 to 44 Years | 279 (97.6%) | 495 (95.9%) |
| 45 to 54 Years | 641 (96.7%) | 516 (93.6%) |
| 55 to 64 Years | 585 (97.5%) | 609 (86.9%) |
| 65 to 74 Years | 606 (96.0%) | 670 (98.2%) |
| 75 Years and over | 464 (100.0%) | 424 (98.2%) |
| Total | 3,745 (97.1%) | 3,799 (93.1%) |
Income Below Poverty Among Married-Couple Families in Westlake Village
The poverty statistics for married-couple families in Westlake Village show that 1.1% or 20 of the total 1,889 families live below the poverty line. Families with no children have the highest poverty rate of 1.4%, comprising of 18 families. On the other hand, families with 3 or 4 children have the lowest poverty rate of 0.0%, which includes 0 families.
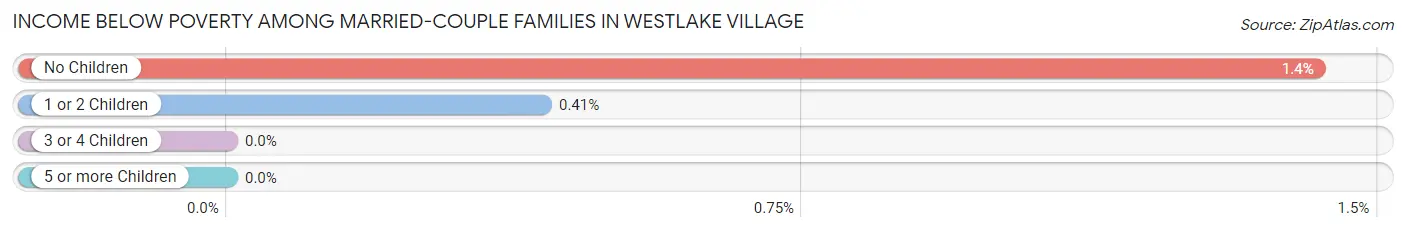
| Children | Above Poverty | Below Poverty |
| No Children | 1,249 (98.6%) | 18 (1.4%) |
| 1 or 2 Children | 483 (99.6%) | 2 (0.4%) |
| 3 or 4 Children | 137 (100.0%) | 0 (0.0%) |
| 5 or more Children | 0 (0.0%) | 0 (0.0%) |
| Total | 1,869 (98.9%) | 20 (1.1%) |
Income Below Poverty Among Single-Parent Households in Westlake Village
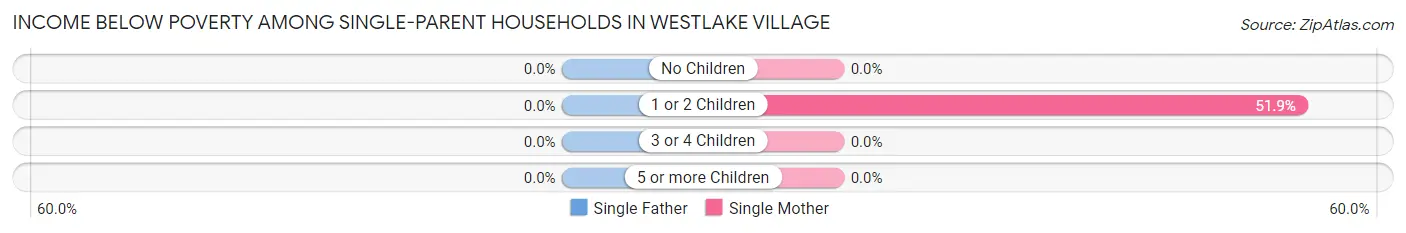
| Children | Single Father | Single Mother |
| No Children | 0 (0.0%) | 0 (0.0%) |
| 1 or 2 Children | 0 (0.0%) | 56 (51.8%) |
| 3 or 4 Children | 0 (0.0%) | 0 (0.0%) |
| 5 or more Children | 0 (0.0%) | 0 (0.0%) |
| Total | 0 (0.0%) | 56 (25.1%) |
Income Below Poverty Among Married-Couple vs Single-Parent Households in Westlake Village
The poverty data for Westlake Village shows that 20 of the married-couple family households (1.1%) and 56 of the single-parent households (14.9%) are living below the poverty level. Within the married-couple family households, those with no children have the highest poverty rate, with 18 households (1.4%) falling below the poverty line. Among the single-parent households, those with 1 or 2 children have the highest poverty rate, with 56 household (44.8%) living below poverty.
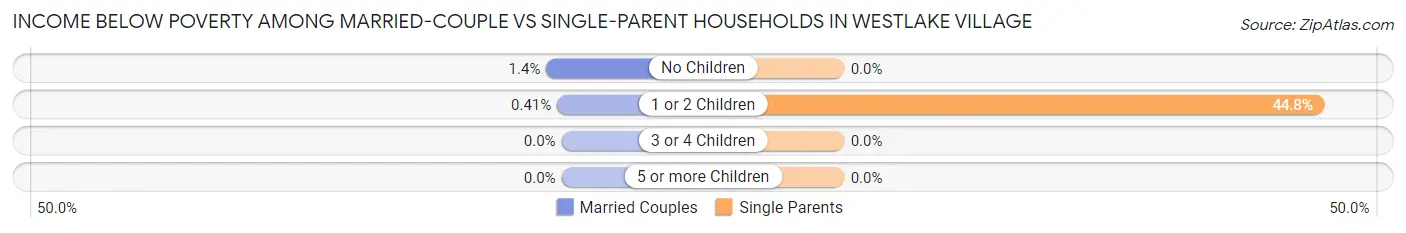
| Children | Married-Couple Families | Single-Parent Households |
| No Children | 18 (1.4%) | 0 (0.0%) |
| 1 or 2 Children | 2 (0.4%) | 56 (44.8%) |
| 3 or 4 Children | 0 (0.0%) | 0 (0.0%) |
| 5 or more Children | 0 (0.0%) | 0 (0.0%) |
| Total | 20 (1.1%) | 56 (14.9%) |
Race in Westlake Village
The most populous races in Westlake Village are White / Caucasian (6,346 | 79.8%), Two or more Races (828 | 10.4%), and Hispanic or Latino (703 | 8.8%).
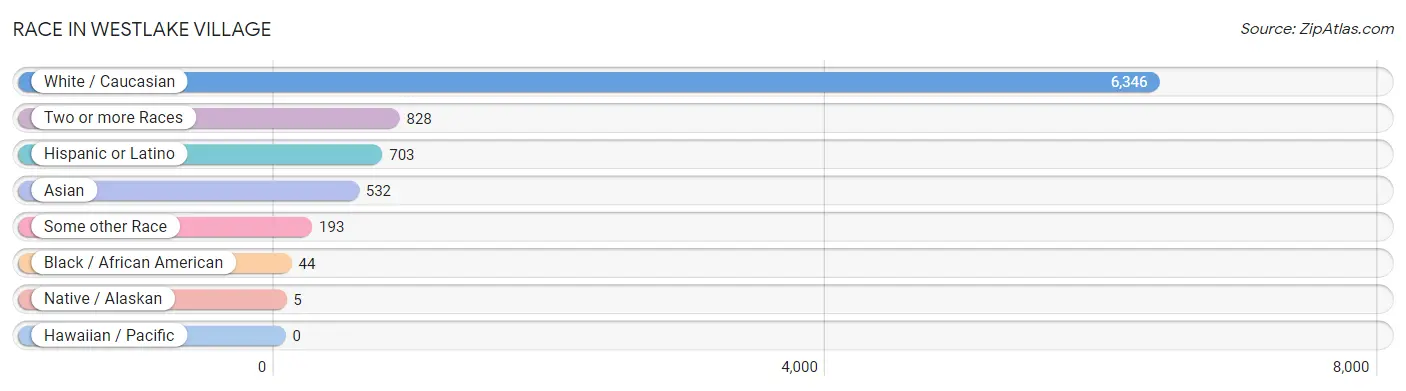
| Race | # Population | % Population |
| Asian | 532 | 6.7% |
| Black / African American | 44 | 0.5% |
| Hawaiian / Pacific | 0 | 0.0% |
| Hispanic or Latino | 703 | 8.8% |
| Native / Alaskan | 5 | 0.1% |
| White / Caucasian | 6,346 | 79.8% |
| Two or more Races | 828 | 10.4% |
| Some other Race | 193 | 2.4% |
| Total | 7,948 | 100.0% |
Ancestry in Westlake Village
The most populous ancestries reported in Westlake Village are Irish (985 | 12.4%), German (964 | 12.1%), English (899 | 11.3%), Italian (493 | 6.2%), and Mexican (435 | 5.5%), together accounting for 47.5% of all Westlake Village residents.
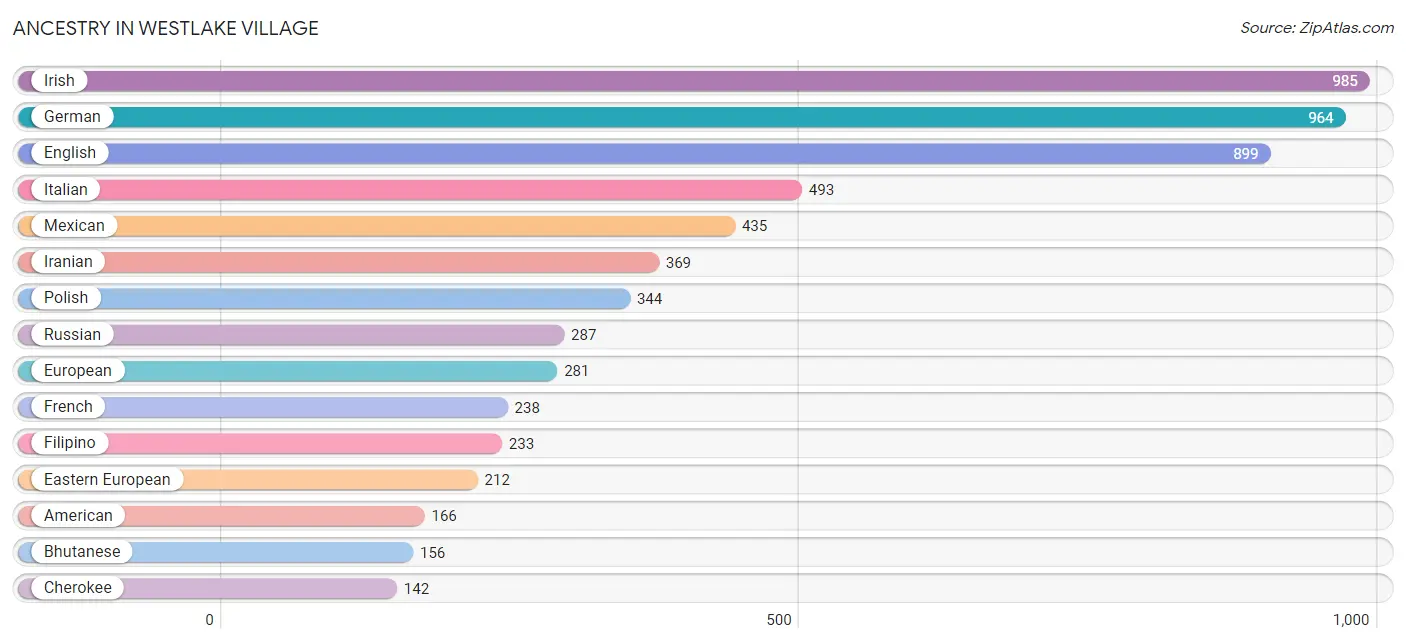
| Ancestry | # Population | % Population |
| American | 166 | 2.1% |
| Arab | 52 | 0.6% |
| Argentinean | 11 | 0.1% |
| Armenian | 10 | 0.1% |
| Austrian | 20 | 0.3% |
| Belgian | 25 | 0.3% |
| Bhutanese | 156 | 2.0% |
| Bolivian | 7 | 0.1% |
| Brazilian | 9 | 0.1% |
| British | 90 | 1.1% |
| Burmese | 84 | 1.1% |
| Canadian | 40 | 0.5% |
| Central American | 98 | 1.2% |
| Cherokee | 142 | 1.8% |
| Colombian | 28 | 0.4% |
| Croatian | 11 | 0.1% |
| Cuban | 38 | 0.5% |
| Czech | 5 | 0.1% |
| Czechoslovakian | 9 | 0.1% |
| Danish | 21 | 0.3% |
| Dominican | 28 | 0.4% |
| Dutch | 42 | 0.5% |
| Eastern European | 212 | 2.7% |
| Egyptian | 26 | 0.3% |
| English | 899 | 11.3% |
| European | 281 | 3.5% |
| Filipino | 233 | 2.9% |
| Finnish | 16 | 0.2% |
| French | 238 | 3.0% |
| German | 964 | 12.1% |
| Greek | 33 | 0.4% |
| Hungarian | 58 | 0.7% |
| Indian (Asian) | 116 | 1.5% |
| Iranian | 369 | 4.6% |
| Irish | 985 | 12.4% |
| Israeli | 49 | 0.6% |
| Italian | 493 | 6.2% |
| Korean | 67 | 0.8% |
| Laotian | 93 | 1.2% |
| Lebanese | 4 | 0.1% |
| Lithuanian | 36 | 0.4% |
| Mexican | 435 | 5.5% |
| Moroccan | 9 | 0.1% |
| Native Hawaiian | 10 | 0.1% |
| Northern European | 21 | 0.3% |
| Norwegian | 79 | 1.0% |
| Pakistani | 4 | 0.1% |
| Paraguayan | 1 | 0.0% |
| Polish | 344 | 4.3% |
| Portuguese | 8 | 0.1% |
| Puerto Rican | 23 | 0.3% |
| Romanian | 39 | 0.5% |
| Russian | 287 | 3.6% |
| Salvadoran | 98 | 1.2% |
| Scandinavian | 19 | 0.2% |
| Scotch-Irish | 84 | 1.1% |
| Scottish | 134 | 1.7% |
| Serbian | 9 | 0.1% |
| Sioux | 12 | 0.2% |
| Slovak | 7 | 0.1% |
| South American | 47 | 0.6% |
| Spaniard | 34 | 0.4% |
| Sri Lankan | 17 | 0.2% |
| Swedish | 42 | 0.5% |
| Swiss | 39 | 0.5% |
| Thai | 80 | 1.0% |
| Ukrainian | 62 | 0.8% |
| Welsh | 45 | 0.6% | View All 68 Rows |
Immigrants in Westlake Village
The most numerous immigrant groups reported in Westlake Village came from Asia (650 | 8.2%), Europe (309 | 3.9%), Eastern Asia (259 | 3.3%), South Central Asia (259 | 3.3%), and Iran (215 | 2.7%), together accounting for 21.3% of all Westlake Village residents.
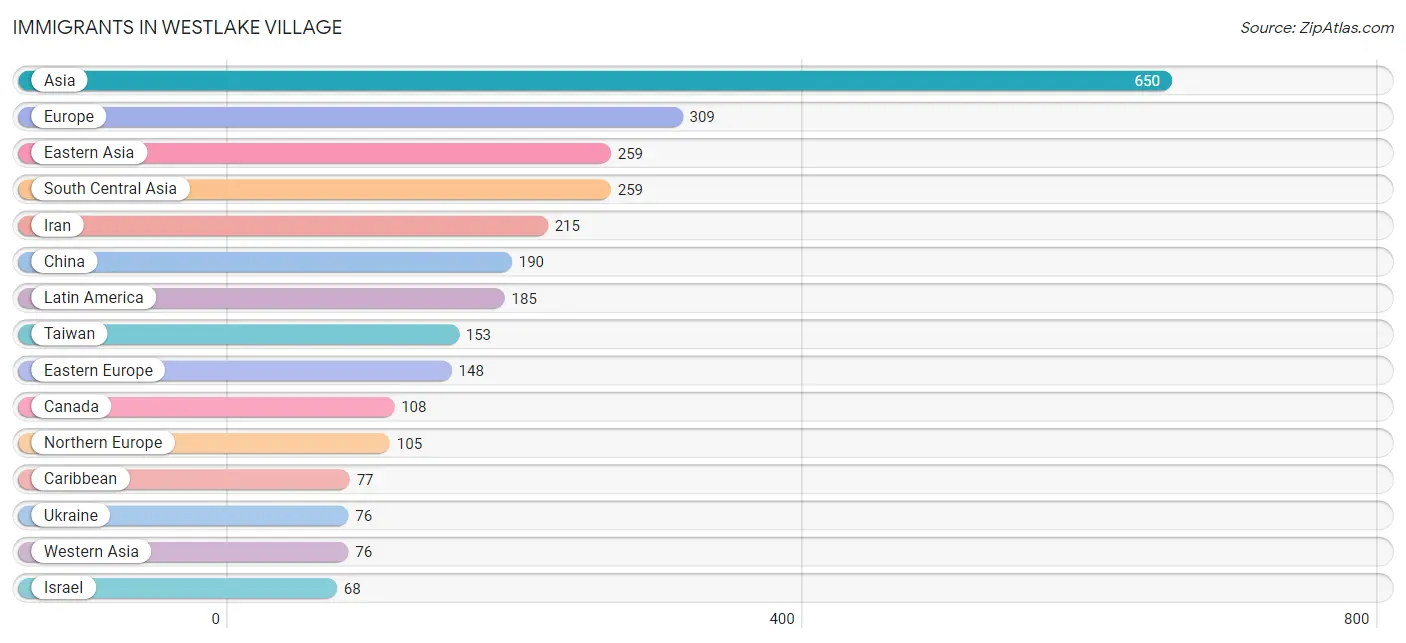
| Immigration Origin | # Population | % Population |
| Africa | 6 | 0.1% |
| Argentina | 19 | 0.2% |
| Asia | 650 | 8.2% |
| Austria | 14 | 0.2% |
| Belarus | 25 | 0.3% |
| Belgium | 7 | 0.1% |
| Brazil | 17 | 0.2% |
| Canada | 108 | 1.4% |
| Caribbean | 77 | 1.0% |
| Central America | 61 | 0.8% |
| China | 190 | 2.4% |
| Colombia | 10 | 0.1% |
| Cuba | 17 | 0.2% |
| Dominican Republic | 60 | 0.7% |
| Eastern Asia | 259 | 3.3% |
| Eastern Europe | 148 | 1.9% |
| England | 21 | 0.3% |
| Europe | 309 | 3.9% |
| Germany | 28 | 0.4% |
| India | 44 | 0.5% |
| Indonesia | 18 | 0.2% |
| Iran | 215 | 2.7% |
| Iraq | 8 | 0.1% |
| Israel | 68 | 0.9% |
| Japan | 21 | 0.3% |
| Korea | 48 | 0.6% |
| Latin America | 185 | 2.3% |
| Lithuania | 17 | 0.2% |
| Mexico | 61 | 0.8% |
| Northern Europe | 105 | 1.3% |
| Oceania | 9 | 0.1% |
| Philippines | 17 | 0.2% |
| Poland | 22 | 0.3% |
| Russia | 8 | 0.1% |
| Scotland | 14 | 0.2% |
| South Africa | 6 | 0.1% |
| South America | 47 | 0.6% |
| South Central Asia | 259 | 3.3% |
| South Eastern Asia | 56 | 0.7% |
| Switzerland | 7 | 0.1% |
| Taiwan | 153 | 1.9% |
| Thailand | 4 | 0.1% |
| Ukraine | 76 | 1.0% |
| Vietnam | 17 | 0.2% |
| Western Asia | 76 | 1.0% |
| Western Europe | 56 | 0.7% | View All 46 Rows |
Sex and Age in Westlake Village
Sex and Age in Westlake Village
The most populous age groups in Westlake Village are 60 to 64 Years (367 | 9.5%) for men and 60 to 64 Years (495 | 12.1%) for women.
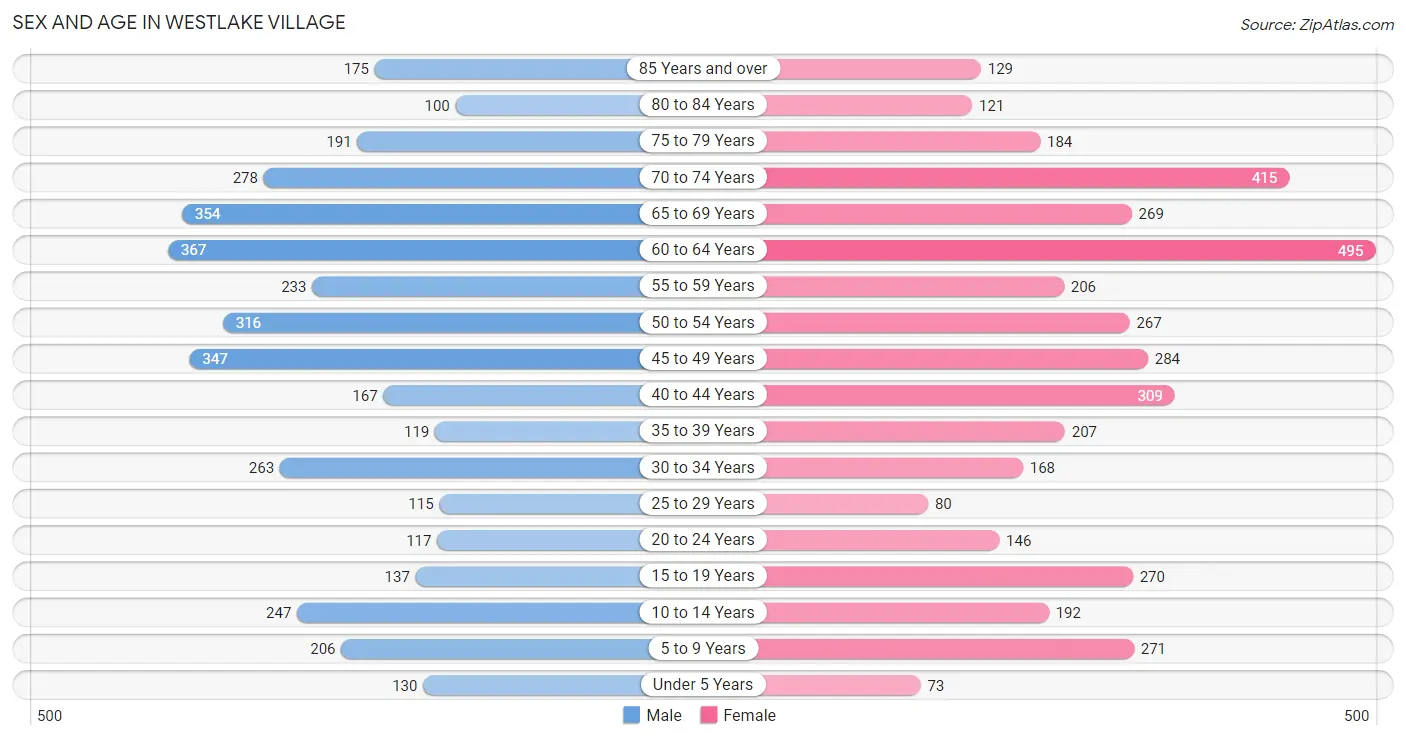
| Age Bracket | Male | Female |
| Under 5 Years | 130 (3.4%) | 73 (1.8%) |
| 5 to 9 Years | 206 (5.3%) | 271 (6.6%) |
| 10 to 14 Years | 247 (6.4%) | 192 (4.7%) |
| 15 to 19 Years | 137 (3.5%) | 270 (6.6%) |
| 20 to 24 Years | 117 (3.0%) | 146 (3.6%) |
| 25 to 29 Years | 115 (3.0%) | 80 (2.0%) |
| 30 to 34 Years | 263 (6.8%) | 168 (4.1%) |
| 35 to 39 Years | 119 (3.1%) | 207 (5.1%) |
| 40 to 44 Years | 167 (4.3%) | 309 (7.6%) |
| 45 to 49 Years | 347 (9.0%) | 284 (7.0%) |
| 50 to 54 Years | 316 (8.2%) | 267 (6.5%) |
| 55 to 59 Years | 233 (6.0%) | 206 (5.0%) |
| 60 to 64 Years | 367 (9.5%) | 495 (12.1%) |
| 65 to 69 Years | 354 (9.2%) | 269 (6.6%) |
| 70 to 74 Years | 278 (7.2%) | 415 (10.2%) |
| 75 to 79 Years | 191 (5.0%) | 184 (4.5%) |
| 80 to 84 Years | 100 (2.6%) | 121 (3.0%) |
| 85 Years and over | 175 (4.5%) | 129 (3.2%) |
| Total | 3,862 (100.0%) | 4,086 (100.0%) |
Families and Households in Westlake Village
Median Family Size in Westlake Village
The median family size in Westlake Village is 3.01 persons per family, with married-couple families (1,889 | 83.4%) accounting for the largest median family size of 3.09 persons per family. On the other hand, single male/father families (152 | 6.7%) represent the smallest median family size with 2.54 persons per family.
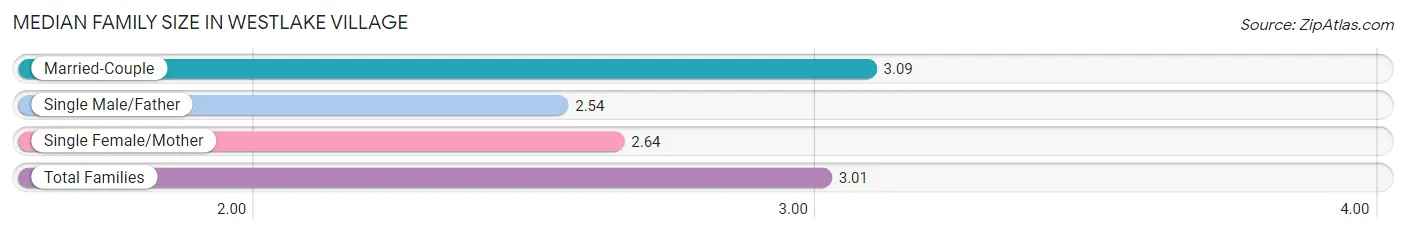
| Family Type | # Families | Family Size |
| Married-Couple | 1,889 (83.4%) | 3.09 |
| Single Male/Father | 152 (6.7%) | 2.54 |
| Single Female/Mother | 223 (9.9%) | 2.64 |
| Total Families | 2,264 (100.0%) | 3.01 |
Median Household Size in Westlake Village
The median household size in Westlake Village is 2.53 persons per household, with married-couple households (1,889 | 60.6%) accounting for the largest median household size of 3.1 persons per household. non-family households (851 | 27.3%) represent the smallest median household size with 1.18 persons per household.
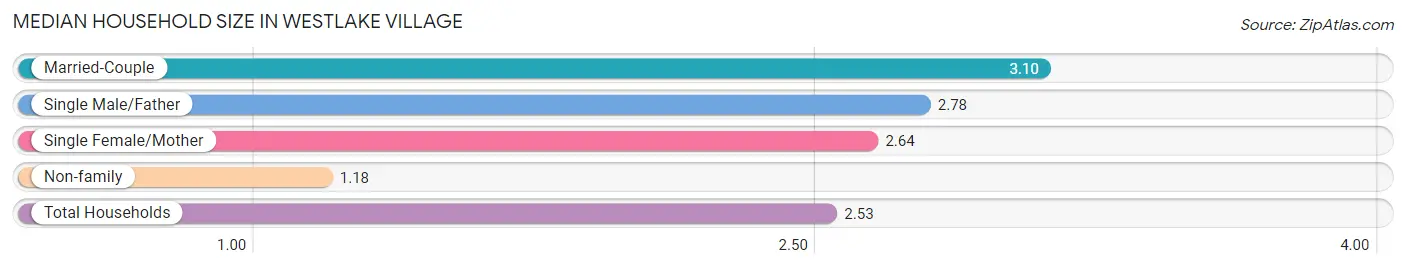
| Household Type | # Households | Household Size |
| Married-Couple | 1,889 (60.6%) | 3.10 |
| Single Male/Father | 152 (4.9%) | 2.78 |
| Single Female/Mother | 223 (7.2%) | 2.64 |
| Non-family | 851 (27.3%) | 1.18 |
| Total Households | 3,115 (100.0%) | 2.53 |
Household Size by Marriage Status in Westlake Village
Out of a total of 3,115 households in Westlake Village, 2,264 (72.7%) are family households, while 851 (27.3%) are nonfamily households. The most numerous type of family households are 2-person households, comprising 1,196, and the most common type of nonfamily households are 1-person households, comprising 706.
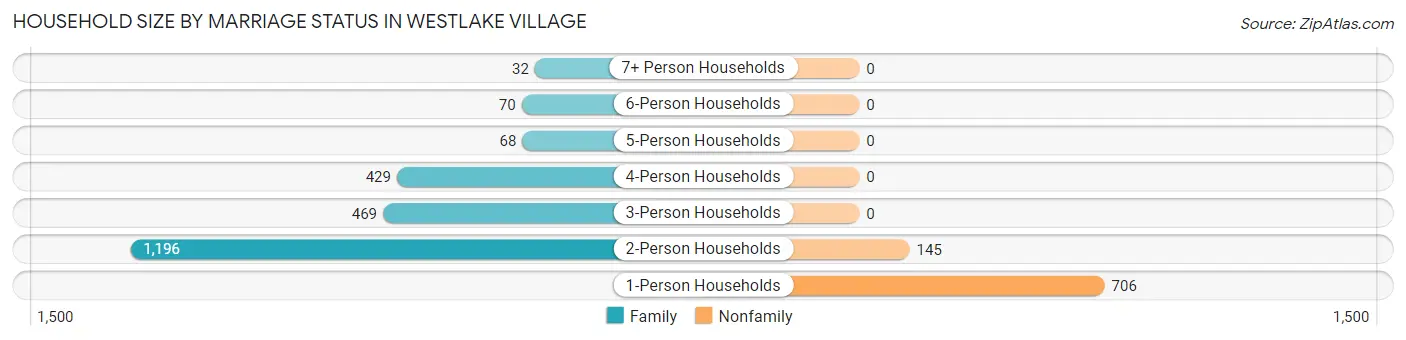
| Household Size | Family Households | Nonfamily Households |
| 1-Person Households | - | 706 (22.7%) |
| 2-Person Households | 1,196 (38.4%) | 145 (4.6%) |
| 3-Person Households | 469 (15.1%) | 0 (0.0%) |
| 4-Person Households | 429 (13.8%) | 0 (0.0%) |
| 5-Person Households | 68 (2.2%) | 0 (0.0%) |
| 6-Person Households | 70 (2.2%) | 0 (0.0%) |
| 7+ Person Households | 32 (1.0%) | 0 (0.0%) |
| Total | 2,264 (72.7%) | 851 (27.3%) |
Female Fertility in Westlake Village
Fertility by Age in Westlake Village
Average fertility rate in Westlake Village is 26.0 births per 1,000 women. Women in the age bracket of 35 to 50 years have the highest fertility rate with 41.0 births per 1,000 women. Women in the age bracket of 35 to 50 years acount for 87.2% of all women with births.
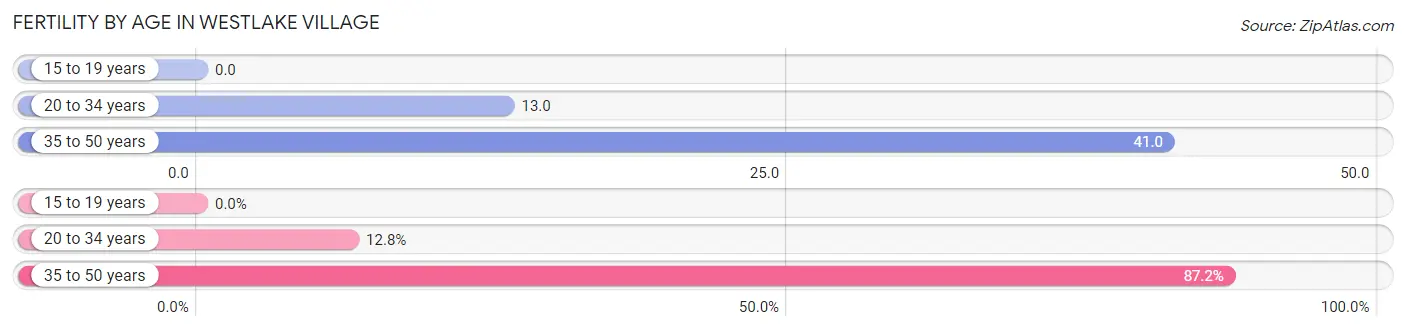
| Age Bracket | Women with Births | Births / 1,000 Women |
| 15 to 19 years | 0 (0.0%) | 0.0 |
| 20 to 34 years | 5 (12.8%) | 13.0 |
| 35 to 50 years | 34 (87.2%) | 41.0 |
| Total | 39 (100.0%) | 26.0 |
Fertility by Age by Marriage Status in Westlake Village
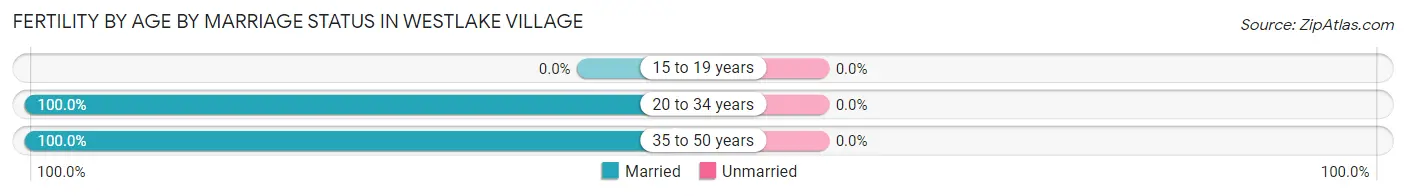
| Age Bracket | Married | Unmarried |
| 15 to 19 years | 0 (0.0%) | 0 (0.0%) |
| 20 to 34 years | 5 (100.0%) | 0 (0.0%) |
| 35 to 50 years | 34 (100.0%) | 0 (0.0%) |
| Total | 39 (100.0%) | 0 (0.0%) |
Fertility by Education in Westlake Village
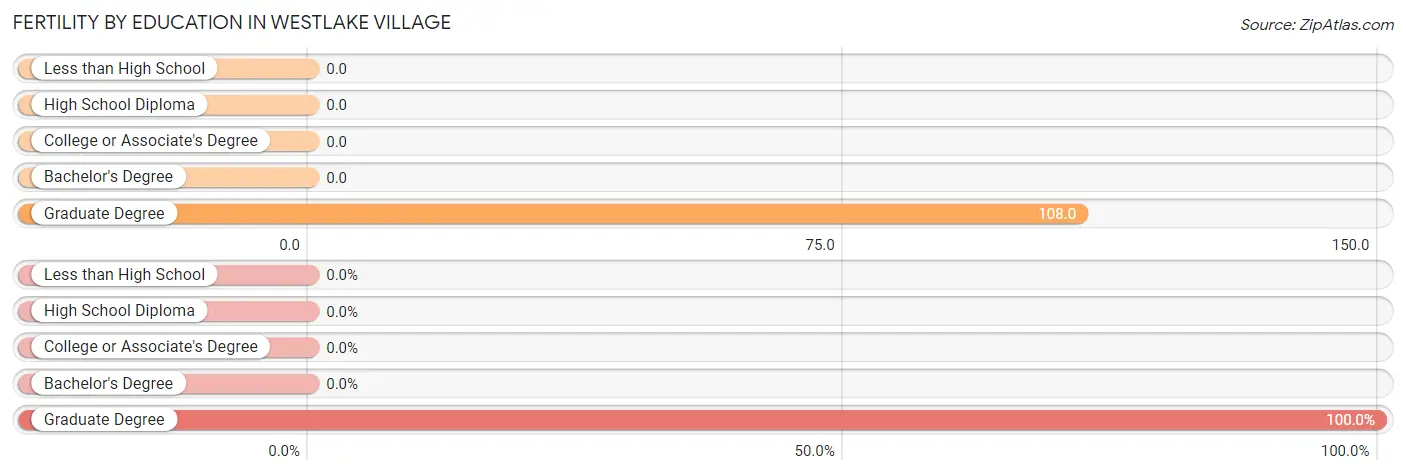
| Educational Attainment | Women with Births | Births / 1,000 Women |
| Less than High School | 0 (0.0%) | 0.0 |
| High School Diploma | 0 (0.0%) | 0.0 |
| College or Associate's Degree | 0 (0.0%) | 0.0 |
| Bachelor's Degree | 0 (0.0%) | 0.0 |
| Graduate Degree | 39 (100.0%) | 108.0 |
| Total | 39 (100.0%) | 26.0 |
Fertility by Education by Marriage Status in Westlake Village
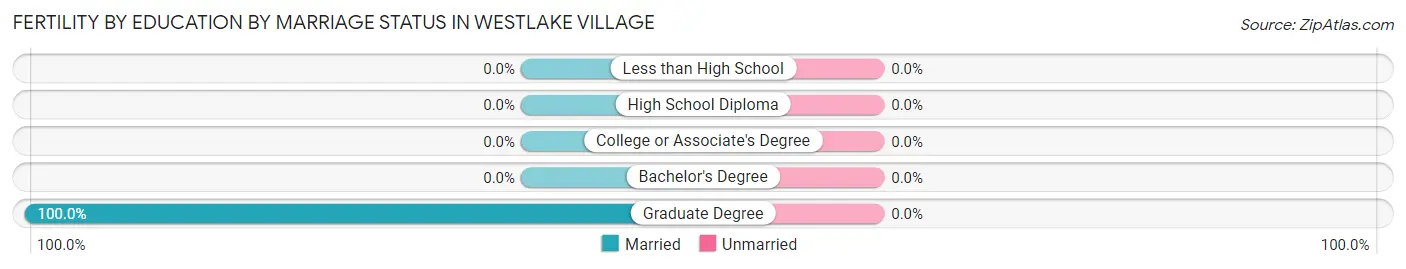
| Educational Attainment | Married | Unmarried |
| Less than High School | 0 (0.0%) | 0 (0.0%) |
| High School Diploma | 0 (0.0%) | 0 (0.0%) |
| College or Associate's Degree | 0 (0.0%) | 0 (0.0%) |
| Bachelor's Degree | 0 (0.0%) | 0 (0.0%) |
| Graduate Degree | 39 (100.0%) | 0 (0.0%) |
| Total | 39 (100.0%) | 0 (0.0%) |
Employment Characteristics in Westlake Village
Employment by Class of Employer in Westlake Village
Among the 3,611 employed individuals in Westlake Village, private company employees (2,061 | 57.1%), self-employed (incorporated) (565 | 15.7%), and self-employed (not incorporated) (374 | 10.4%) make up the most common classes of employment.
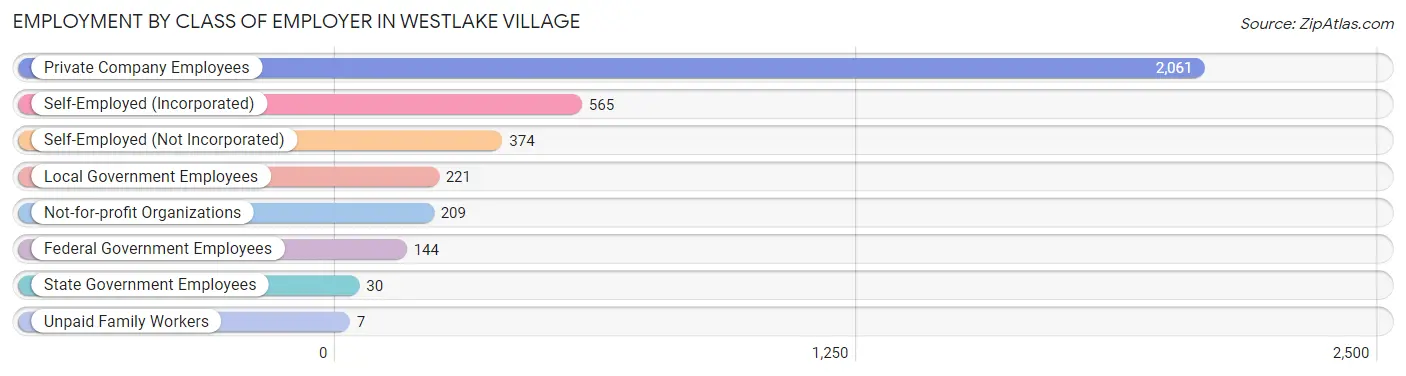
| Employer Class | # Employees | % Employees |
| Private Company Employees | 2,061 | 57.1% |
| Self-Employed (Incorporated) | 565 | 15.7% |
| Self-Employed (Not Incorporated) | 374 | 10.4% |
| Not-for-profit Organizations | 209 | 5.8% |
| Local Government Employees | 221 | 6.1% |
| State Government Employees | 30 | 0.8% |
| Federal Government Employees | 144 | 4.0% |
| Unpaid Family Workers | 7 | 0.2% |
| Total | 3,611 | 100.0% |
Employment Status by Age in Westlake Village
According to the labor force statistics for Westlake Village, out of the total population over 16 years of age (6,770), 57.1% or 3,866 individuals are in the labor force, with 2.9% or 112 of them unemployed. The age group with the highest labor force participation rate is 45 to 54 years, with 83.3% or 1,011 individuals in the labor force. Within the labor force, the 55 to 59 years age range has the highest percentage of unemployed individuals, with 6.7% or 22 of them being unemployed.
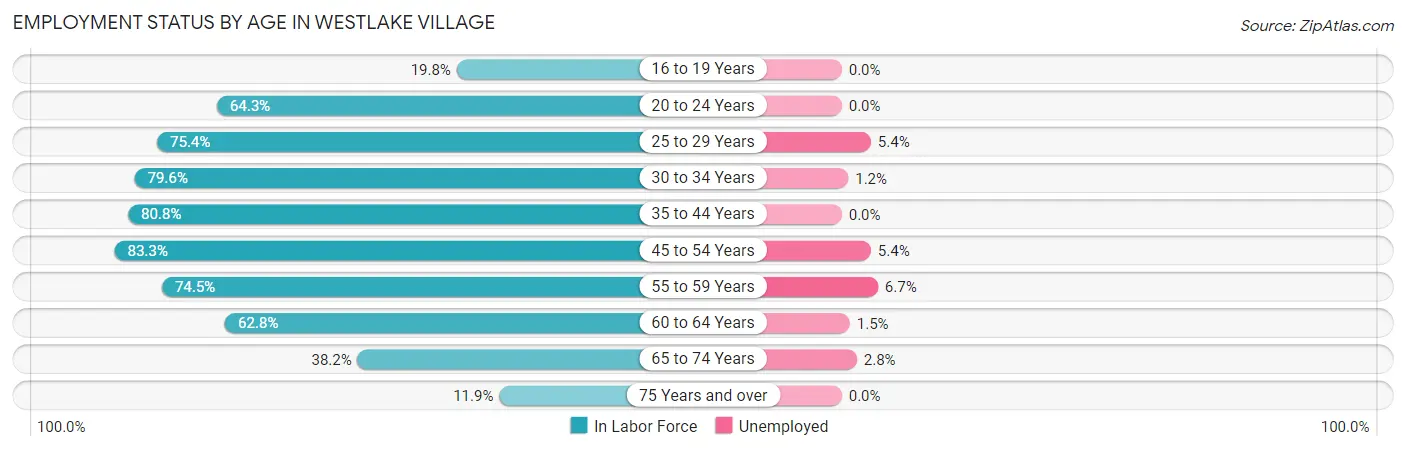
| Age Bracket | In Labor Force | Unemployed |
| 16 to 19 Years | 69 (19.8%) | 0 (0.0%) |
| 20 to 24 Years | 169 (64.3%) | 0 (0.0%) |
| 25 to 29 Years | 147 (75.4%) | 8 (5.4%) |
| 30 to 34 Years | 343 (79.6%) | 4 (1.2%) |
| 35 to 44 Years | 648 (80.8%) | 0 (0.0%) |
| 45 to 54 Years | 1,011 (83.3%) | 55 (5.4%) |
| 55 to 59 Years | 327 (74.5%) | 22 (6.7%) |
| 60 to 64 Years | 541 (62.8%) | 8 (1.5%) |
| 65 to 74 Years | 503 (38.2%) | 14 (2.8%) |
| 75 Years and over | 107 (11.9%) | 0 (0.0%) |
| Total | 3,866 (57.1%) | 112 (2.9%) |
Employment Status by Educational Attainment in Westlake Village
According to labor force statistics for Westlake Village, 76.5% of individuals (3,016) out of the total population between 25 and 64 years of age (3,943) are in the labor force, with 3.2% or 97 of them being unemployed. The group with the highest labor force participation rate are those with the educational attainment of bachelor's degree or higher, with 83.0% or 2,266 individuals in the labor force. Within the labor force, individuals with high school diploma education have the highest percentage of unemployment, with 6.0% or 16 of them being unemployed.
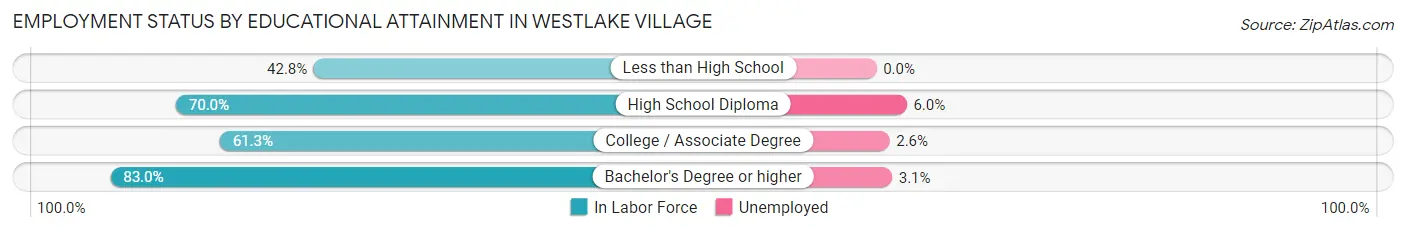
| Educational Attainment | In Labor Force | Unemployed |
| Less than High School | 59 (42.8%) | 0 (0.0%) |
| High School Diploma | 268 (70.0%) | 23 (6.0%) |
| College / Associate Degree | 424 (61.3%) | 18 (2.6%) |
| Bachelor's Degree or higher | 2,266 (83.0%) | 85 (3.1%) |
| Total | 3,016 (76.5%) | 126 (3.2%) |
Employment Occupations by Sex in Westlake Village
Management, Business, Science and Arts Occupations
The most common Management, Business, Science and Arts occupations in Westlake Village are Community & Social Service (759 | 20.2%), Management (623 | 16.6%), Business & Financial (409 | 10.9%), Arts, Media & Entertainment (399 | 10.6%), and Computers, Engineering & Science (334 | 8.9%).
Management, Business, Science and Arts Occupations by Sex
Within the Management, Business, Science and Arts occupations in Westlake Village, the most male-oriented occupations are Architecture & Engineering (92.4%), Computers, Engineering & Science (68.6%), and Arts, Media & Entertainment (68.4%), while the most female-oriented occupations are Life, Physical & Social Science (100.0%), Education Instruction & Library (91.4%), and Education, Arts & Media (82.8%).
| Occupation | Male | Female |
| Management | 416 (66.8%) | 207 (33.2%) |
| Business & Financial | 223 (54.5%) | 186 (45.5%) |
| Computers, Engineering & Science | 229 (68.6%) | 105 (31.4%) |
| Computers & Mathematics | 47 (57.3%) | 35 (42.7%) |
| Architecture & Engineering | 182 (92.4%) | 15 (7.6%) |
| Life, Physical & Social Science | 0 (0.0%) | 55 (100.0%) |
| Community & Social Service | 360 (47.4%) | 399 (52.6%) |
| Education, Arts & Media | 10 (17.2%) | 48 (82.8%) |
| Legal Services & Support | 60 (57.7%) | 44 (42.3%) |
| Education Instruction & Library | 17 (8.6%) | 181 (91.4%) |
| Arts, Media & Entertainment | 273 (68.4%) | 126 (31.6%) |
| Health Diagnosing & Treating | 107 (42.3%) | 146 (57.7%) |
| Health Technologists | 107 (44.0%) | 136 (56.0%) |
| Total (Category) | 1,335 (56.1%) | 1,043 (43.9%) |
| Total (Overall) | 2,127 (56.7%) | 1,627 (43.3%) |
Services Occupations
The most common Services occupations in Westlake Village are Personal Care & Service (60 | 1.6%), Food Preparation & Serving (43 | 1.1%), Healthcare Support (30 | 0.8%), Security & Protection (18 | 0.5%), and Firefighting & Prevention (14 | 0.4%).
Services Occupations by Sex
Within the Services occupations in Westlake Village, the most male-oriented occupations are Firefighting & Prevention (100.0%), Security & Protection (77.8%), and Food Preparation & Serving (72.1%), while the most female-oriented occupations are Healthcare Support (100.0%), Law Enforcement (100.0%), and Personal Care & Service (83.3%).
| Occupation | Male | Female |
| Healthcare Support | 0 (0.0%) | 30 (100.0%) |
| Security & Protection | 14 (77.8%) | 4 (22.2%) |
| Firefighting & Prevention | 14 (100.0%) | 0 (0.0%) |
| Law Enforcement | 0 (0.0%) | 4 (100.0%) |
| Food Preparation & Serving | 31 (72.1%) | 12 (27.9%) |
| Cleaning & Maintenance | 0 (0.0%) | 0 (0.0%) |
| Personal Care & Service | 10 (16.7%) | 50 (83.3%) |
| Total (Category) | 55 (36.4%) | 96 (63.6%) |
| Total (Overall) | 2,127 (56.7%) | 1,627 (43.3%) |
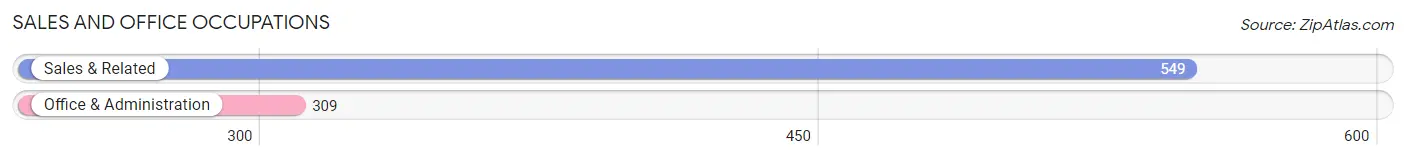
Sales and Office Occupations
The most common Sales and Office occupations in Westlake Village are Sales & Related (549 | 14.6%), and Office & Administration (309 | 8.2%).
Sales and Office Occupations by Sex
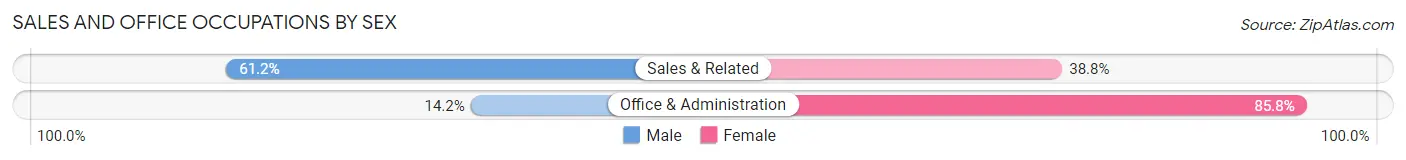
| Occupation | Male | Female |
| Sales & Related | 336 (61.2%) | 213 (38.8%) |
| Office & Administration | 44 (14.2%) | 265 (85.8%) |
| Total (Category) | 380 (44.3%) | 478 (55.7%) |
| Total (Overall) | 2,127 (56.7%) | 1,627 (43.3%) |
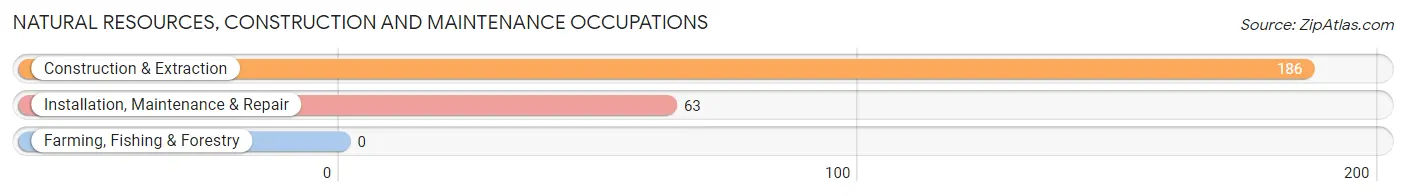
Natural Resources, Construction and Maintenance Occupations
The most common Natural Resources, Construction and Maintenance occupations in Westlake Village are Construction & Extraction (186 | 5.0%), and Installation, Maintenance & Repair (63 | 1.7%).
Natural Resources, Construction and Maintenance Occupations by Sex
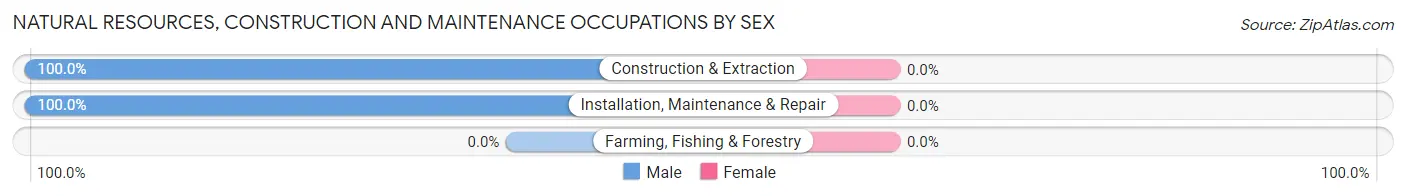
| Occupation | Male | Female |
| Farming, Fishing & Forestry | 0 (0.0%) | 0 (0.0%) |
| Construction & Extraction | 186 (100.0%) | 0 (0.0%) |
| Installation, Maintenance & Repair | 63 (100.0%) | 0 (0.0%) |
| Total (Category) | 249 (100.0%) | 0 (0.0%) |
| Total (Overall) | 2,127 (56.7%) | 1,627 (43.3%) |
Production, Transportation and Moving Occupations
The most common Production, Transportation and Moving occupations in Westlake Village are Production (59 | 1.6%), Transportation (42 | 1.1%), and Material Moving (17 | 0.4%).
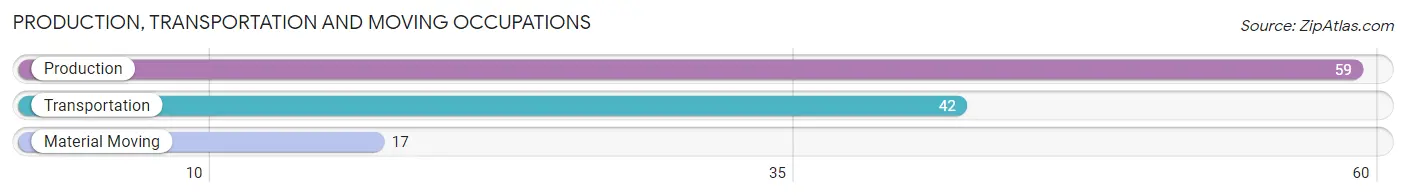
Production, Transportation and Moving Occupations by Sex
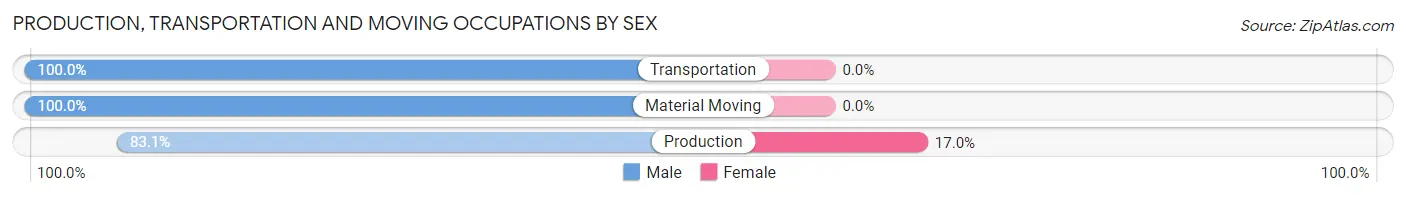
| Occupation | Male | Female |
| Production | 49 (83.1%) | 10 (17.0%) |
| Transportation | 42 (100.0%) | 0 (0.0%) |
| Material Moving | 17 (100.0%) | 0 (0.0%) |
| Total (Category) | 108 (91.5%) | 10 (8.5%) |
| Total (Overall) | 2,127 (56.7%) | 1,627 (43.3%) |
Employment Industries by Sex in Westlake Village
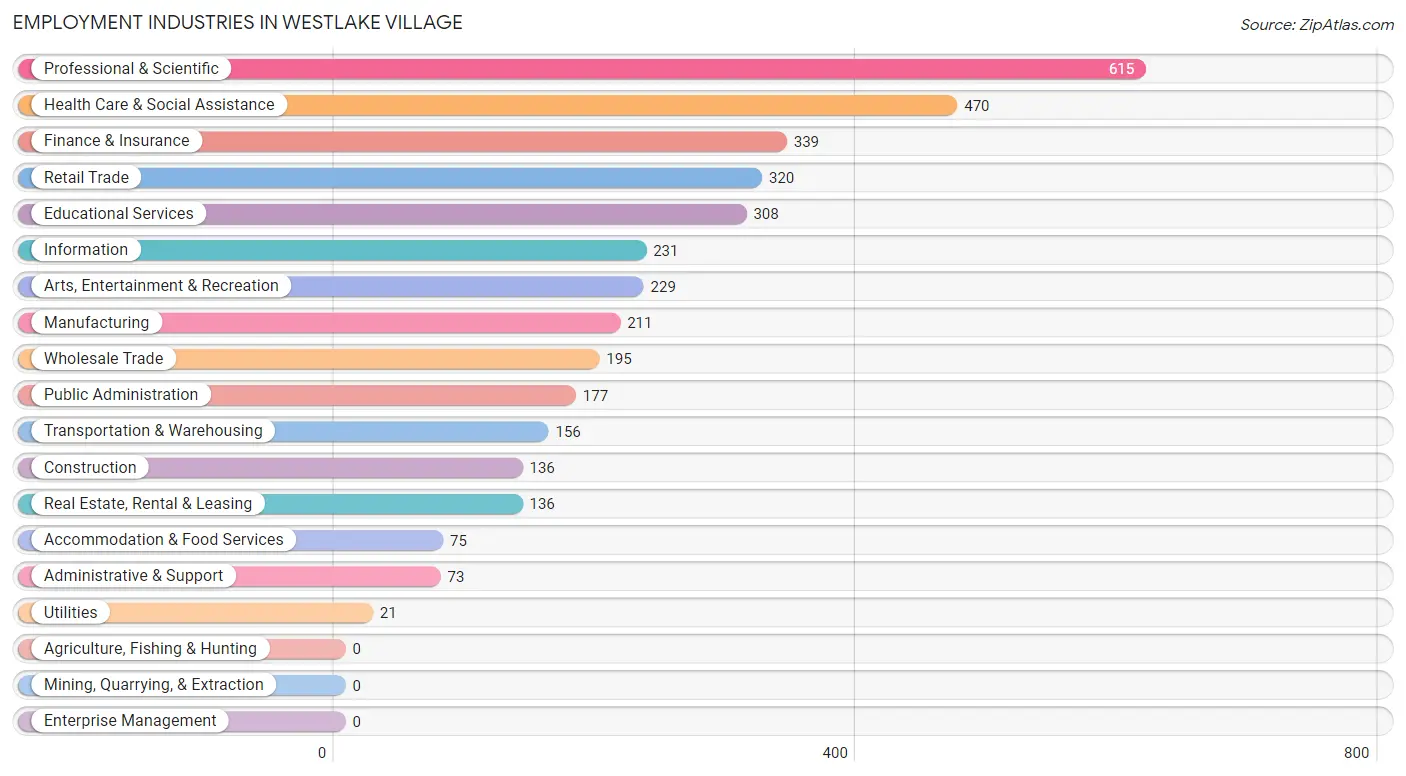
Employment Industries in Westlake Village
The major employment industries in Westlake Village include Professional & Scientific (615 | 16.4%), Health Care & Social Assistance (470 | 12.5%), Finance & Insurance (339 | 9.0%), Retail Trade (320 | 8.5%), and Educational Services (308 | 8.2%).
Employment Industries by Sex in Westlake Village
The Westlake Village industries that see more men than women are Utilities (100.0%), Construction (94.1%), and Transportation & Warehousing (87.8%), whereas the industries that tend to have a higher number of women are Educational Services (80.8%), Arts, Entertainment & Recreation (78.6%), and Real Estate, Rental & Leasing (69.9%).
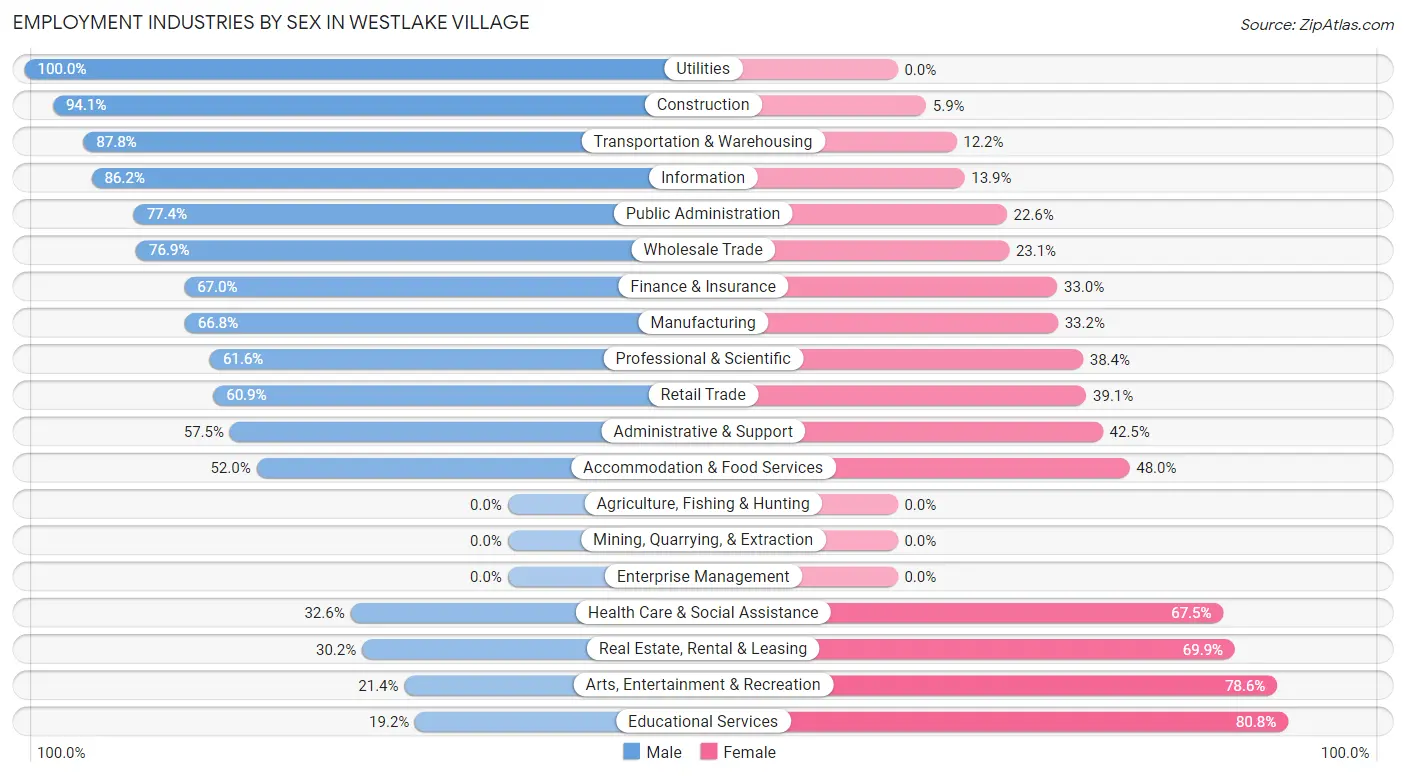
| Industry | Male | Female |
| Agriculture, Fishing & Hunting | 0 (0.0%) | 0 (0.0%) |
| Mining, Quarrying, & Extraction | 0 (0.0%) | 0 (0.0%) |
| Construction | 128 (94.1%) | 8 (5.9%) |
| Manufacturing | 141 (66.8%) | 70 (33.2%) |
| Wholesale Trade | 150 (76.9%) | 45 (23.1%) |
| Retail Trade | 195 (60.9%) | 125 (39.1%) |
| Transportation & Warehousing | 137 (87.8%) | 19 (12.2%) |
| Utilities | 21 (100.0%) | 0 (0.0%) |
| Information | 199 (86.2%) | 32 (13.9%) |
| Finance & Insurance | 227 (67.0%) | 112 (33.0%) |
| Real Estate, Rental & Leasing | 41 (30.1%) | 95 (69.9%) |
| Professional & Scientific | 379 (61.6%) | 236 (38.4%) |
| Enterprise Management | 0 (0.0%) | 0 (0.0%) |
| Administrative & Support | 42 (57.5%) | 31 (42.5%) |
| Educational Services | 59 (19.2%) | 249 (80.8%) |
| Health Care & Social Assistance | 153 (32.6%) | 317 (67.4%) |
| Arts, Entertainment & Recreation | 49 (21.4%) | 180 (78.6%) |
| Accommodation & Food Services | 39 (52.0%) | 36 (48.0%) |
| Public Administration | 137 (77.4%) | 40 (22.6%) |
| Total | 2,127 (56.7%) | 1,627 (43.3%) |
Education in Westlake Village
School Enrollment in Westlake Village
The most common levels of schooling among the 1,886 students in Westlake Village are high school (410 | 21.7%), elementary school (408 | 21.6%), and college / undergraduate (370 | 19.6%).
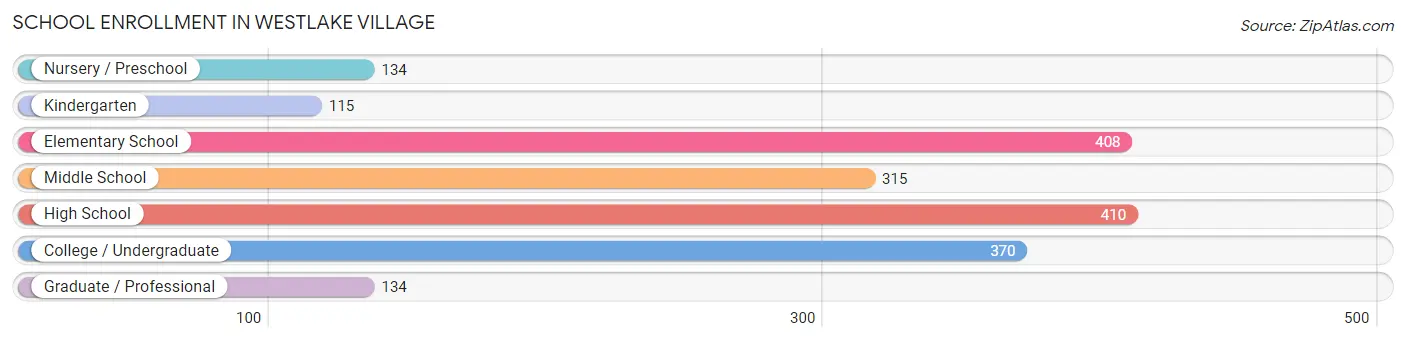
| School Level | # Students | % Students |
| Nursery / Preschool | 134 | 7.1% |
| Kindergarten | 115 | 6.1% |
| Elementary School | 408 | 21.6% |
| Middle School | 315 | 16.7% |
| High School | 410 | 21.7% |
| College / Undergraduate | 370 | 19.6% |
| Graduate / Professional | 134 | 7.1% |
| Total | 1,886 | 100.0% |
School Enrollment by Age by Funding Source in Westlake Village
Out of a total of 1,886 students who are enrolled in schools in Westlake Village, 466 (24.7%) attend a private institution, while the remaining 1,420 (75.3%) are enrolled in public schools. The age group of 3 to 4 year olds has the highest likelihood of being enrolled in private schools, with 99 (84.6% in the age bracket) enrolled. Conversely, the age group of 35 years and over has the lowest likelihood of being enrolled in a private school, with 117 (90.0% in the age bracket) attending a public institution.
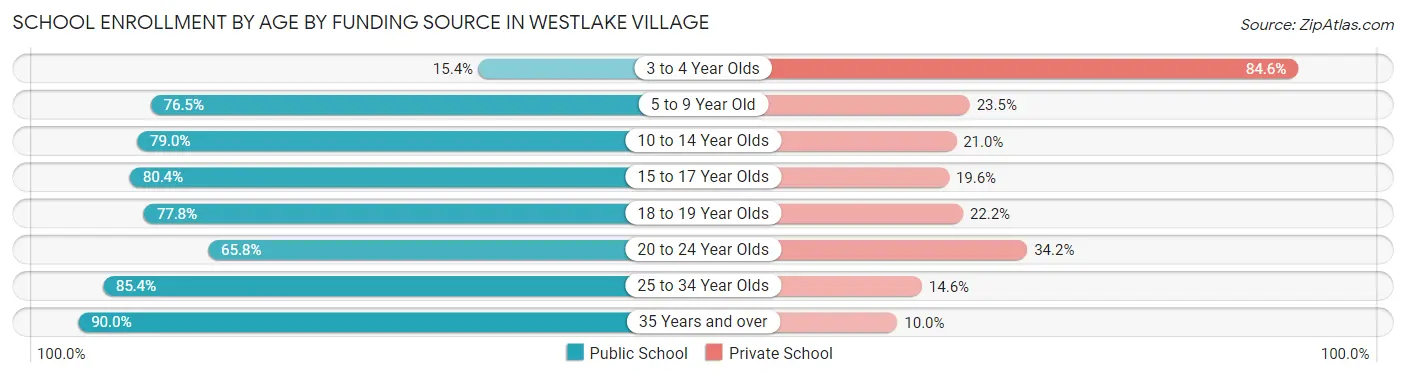
| Age Bracket | Public School | Private School |
| 3 to 4 Year Olds | 18 (15.4%) | 99 (84.6%) |
| 5 to 9 Year Old | 365 (76.5%) | 112 (23.5%) |
| 10 to 14 Year Olds | 347 (79.0%) | 92 (21.0%) |
| 15 to 17 Year Olds | 291 (80.4%) | 71 (19.6%) |
| 18 to 19 Year Olds | 35 (77.8%) | 10 (22.2%) |
| 20 to 24 Year Olds | 77 (65.8%) | 40 (34.2%) |
| 25 to 34 Year Olds | 170 (85.4%) | 29 (14.6%) |
| 35 Years and over | 117 (90.0%) | 13 (10.0%) |
| Total | 1,420 (75.3%) | 466 (24.7%) |
Educational Attainment by Field of Study in Westlake Village
Business (731 | 16.6%), engineering (678 | 15.4%), bio, nature & agricultural (523 | 11.9%), social sciences (494 | 11.2%), and education (322 | 7.3%) are the most common fields of study among 4,399 individuals in Westlake Village who have obtained a bachelor's degree or higher.
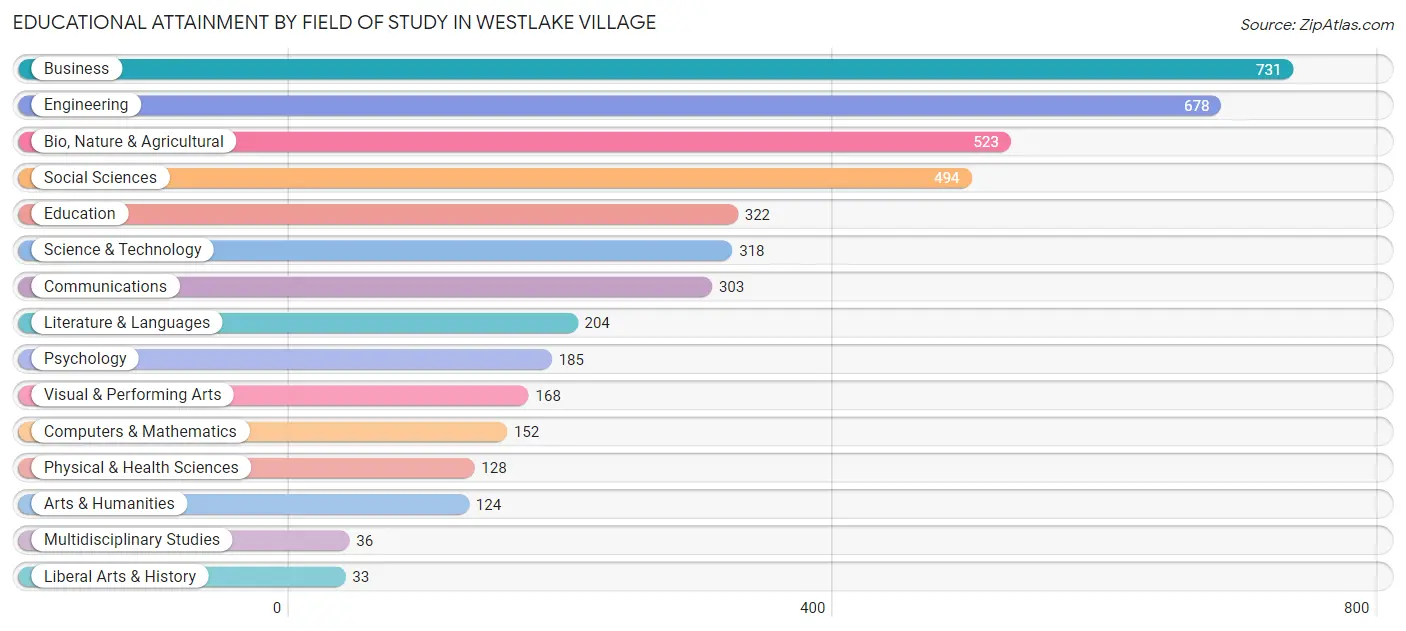
| Field of Study | # Graduates | % Graduates |
| Computers & Mathematics | 152 | 3.5% |
| Bio, Nature & Agricultural | 523 | 11.9% |
| Physical & Health Sciences | 128 | 2.9% |
| Psychology | 185 | 4.2% |
| Social Sciences | 494 | 11.2% |
| Engineering | 678 | 15.4% |
| Multidisciplinary Studies | 36 | 0.8% |
| Science & Technology | 318 | 7.2% |
| Business | 731 | 16.6% |
| Education | 322 | 7.3% |
| Literature & Languages | 204 | 4.6% |
| Liberal Arts & History | 33 | 0.7% |
| Visual & Performing Arts | 168 | 3.8% |
| Communications | 303 | 6.9% |
| Arts & Humanities | 124 | 2.8% |
| Total | 4,399 | 100.0% |
Transportation & Commute in Westlake Village
Vehicle Availability by Sex in Westlake Village
The most prevalent vehicle ownership categories in Westlake Village are males with 2 vehicles (951, accounting for 45.0%) and females with 2 vehicles (711, making up 63.7%).
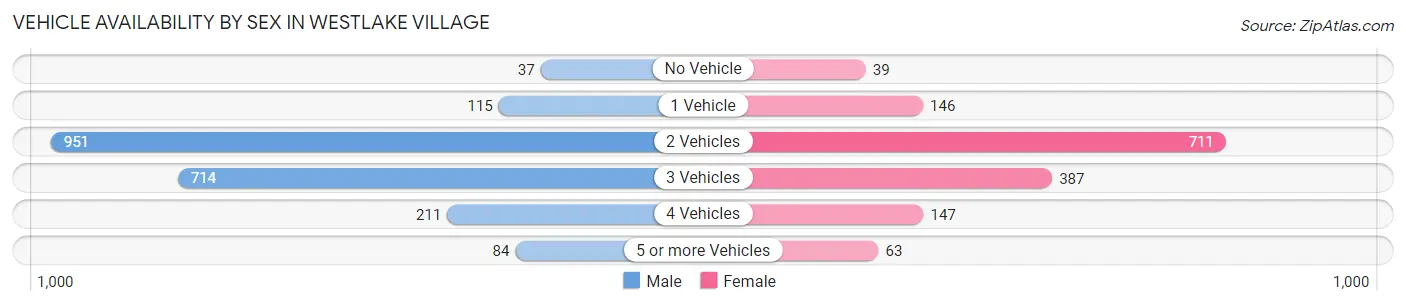
| Vehicles Available | Male | Female |
| No Vehicle | 37 (1.8%) | 39 (2.6%) |
| 1 Vehicle | 115 (5.4%) | 146 (9.8%) |
| 2 Vehicles | 951 (45.0%) | 711 (47.6%) |
| 3 Vehicles | 714 (33.8%) | 387 (25.9%) |
| 4 Vehicles | 211 (10.0%) | 147 (9.9%) |
| 5 or more Vehicles | 84 (4.0%) | 63 (4.2%) |
| Total | 2,112 (100.0%) | 1,493 (100.0%) |
Commute Time in Westlake Village
The most frequently occuring commute durations in Westlake Village are 5 to 9 minutes (539 commuters, 19.8%), 10 to 14 minutes (518 commuters, 19.0%), and 20 to 24 minutes (336 commuters, 12.3%).
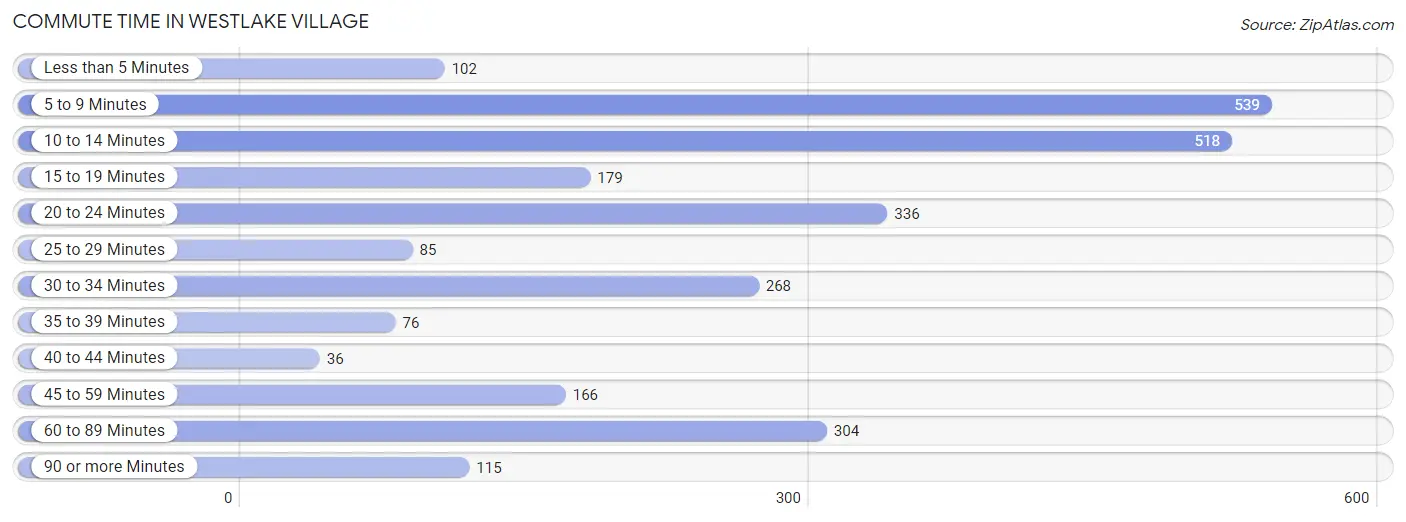
| Commute Time | # Commuters | % Commuters |
| Less than 5 Minutes | 102 | 3.7% |
| 5 to 9 Minutes | 539 | 19.8% |
| 10 to 14 Minutes | 518 | 19.0% |
| 15 to 19 Minutes | 179 | 6.6% |
| 20 to 24 Minutes | 336 | 12.3% |
| 25 to 29 Minutes | 85 | 3.1% |
| 30 to 34 Minutes | 268 | 9.8% |
| 35 to 39 Minutes | 76 | 2.8% |
| 40 to 44 Minutes | 36 | 1.3% |
| 45 to 59 Minutes | 166 | 6.1% |
| 60 to 89 Minutes | 304 | 11.2% |
| 90 or more Minutes | 115 | 4.2% |
Commute Time by Sex in Westlake Village
The most common commute times in Westlake Village are 10 to 14 minutes (299 commuters, 19.3%) for males and 5 to 9 minutes (378 commuters, 32.2%) for females.
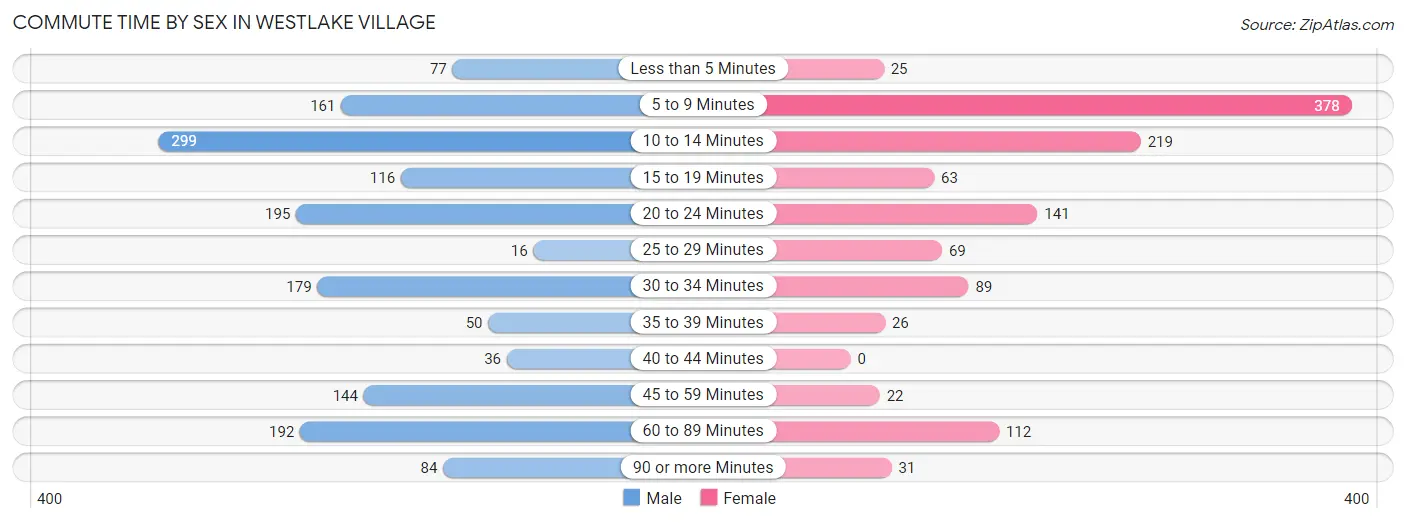
| Commute Time | Male | Female |
| Less than 5 Minutes | 77 (5.0%) | 25 (2.1%) |
| 5 to 9 Minutes | 161 (10.4%) | 378 (32.2%) |
| 10 to 14 Minutes | 299 (19.3%) | 219 (18.6%) |
| 15 to 19 Minutes | 116 (7.5%) | 63 (5.4%) |
| 20 to 24 Minutes | 195 (12.6%) | 141 (12.0%) |
| 25 to 29 Minutes | 16 (1.0%) | 69 (5.9%) |
| 30 to 34 Minutes | 179 (11.6%) | 89 (7.6%) |
| 35 to 39 Minutes | 50 (3.2%) | 26 (2.2%) |
| 40 to 44 Minutes | 36 (2.3%) | 0 (0.0%) |
| 45 to 59 Minutes | 144 (9.3%) | 22 (1.9%) |
| 60 to 89 Minutes | 192 (12.4%) | 112 (9.5%) |
| 90 or more Minutes | 84 (5.4%) | 31 (2.6%) |
Time of Departure to Work by Sex in Westlake Village
The most frequent times of departure to work in Westlake Village are 8:00 AM to 8:29 AM (261, 16.9%) for males and 8:00 AM to 8:29 AM (258, 22.0%) for females.
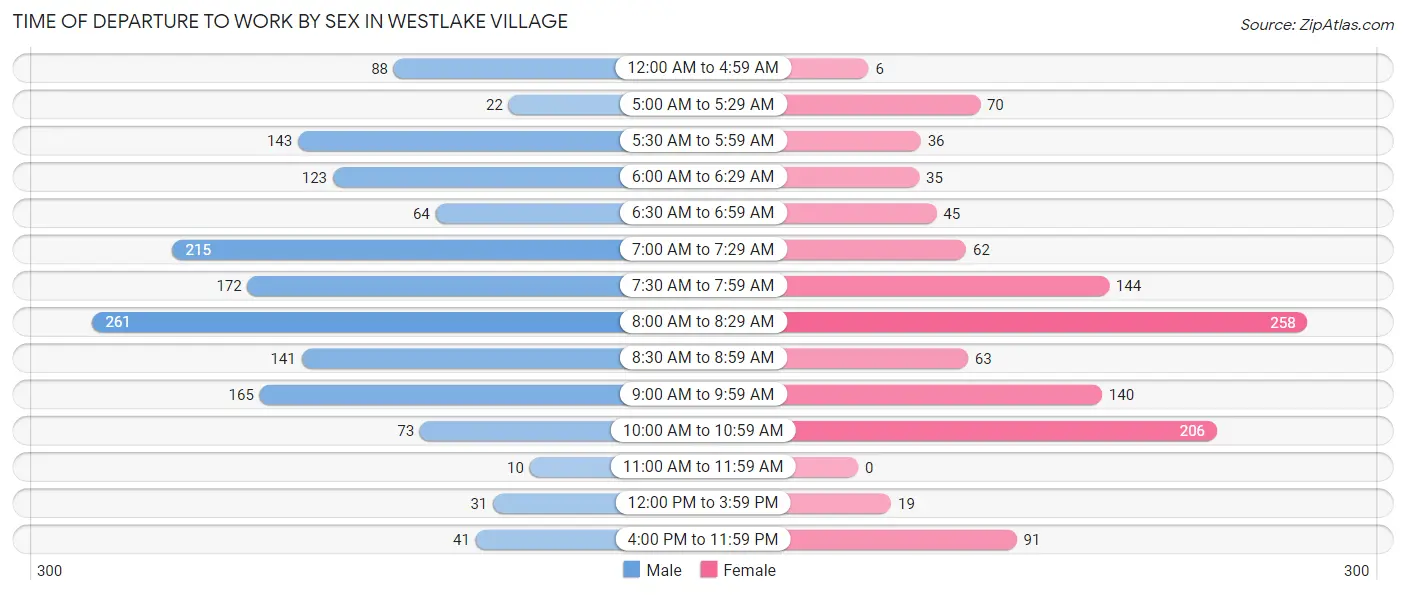
| Time of Departure | Male | Female |
| 12:00 AM to 4:59 AM | 88 (5.7%) | 6 (0.5%) |
| 5:00 AM to 5:29 AM | 22 (1.4%) | 70 (6.0%) |
| 5:30 AM to 5:59 AM | 143 (9.2%) | 36 (3.1%) |
| 6:00 AM to 6:29 AM | 123 (7.9%) | 35 (3.0%) |
| 6:30 AM to 6:59 AM | 64 (4.1%) | 45 (3.8%) |
| 7:00 AM to 7:29 AM | 215 (13.9%) | 62 (5.3%) |
| 7:30 AM to 7:59 AM | 172 (11.1%) | 144 (12.3%) |
| 8:00 AM to 8:29 AM | 261 (16.9%) | 258 (22.0%) |
| 8:30 AM to 8:59 AM | 141 (9.1%) | 63 (5.4%) |
| 9:00 AM to 9:59 AM | 165 (10.6%) | 140 (11.9%) |
| 10:00 AM to 10:59 AM | 73 (4.7%) | 206 (17.5%) |
| 11:00 AM to 11:59 AM | 10 (0.6%) | 0 (0.0%) |
| 12:00 PM to 3:59 PM | 31 (2.0%) | 19 (1.6%) |
| 4:00 PM to 11:59 PM | 41 (2.6%) | 91 (7.7%) |
| Total | 1,549 (100.0%) | 1,175 (100.0%) |
Housing Occupancy in Westlake Village
Occupancy by Ownership in Westlake Village
Of the total 3,115 dwellings in Westlake Village, owner-occupied units account for 2,504 (80.4%), while renter-occupied units make up 611 (19.6%).
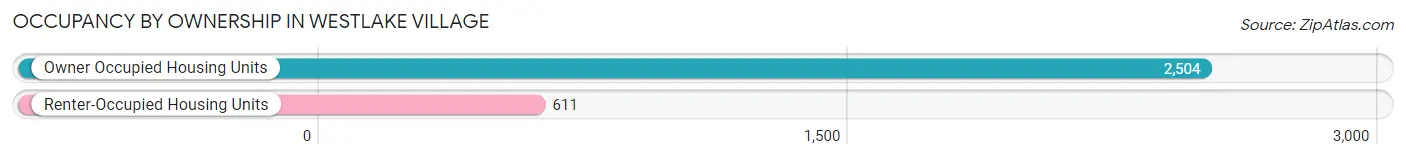
| Occupancy | # Housing Units | % Housing Units |
| Owner Occupied Housing Units | 2,504 | 80.4% |
| Renter-Occupied Housing Units | 611 | 19.6% |
| Total Occupied Housing Units | 3,115 | 100.0% |
Occupancy by Household Size in Westlake Village
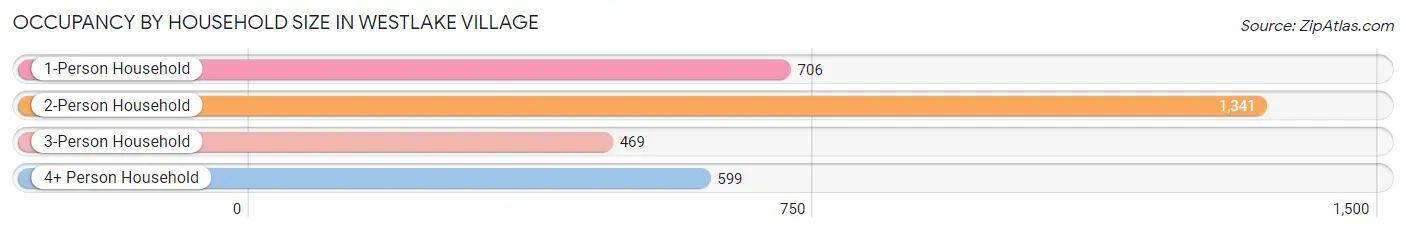
| Household Size | # Housing Units | % Housing Units |
| 1-Person Household | 706 | 22.7% |
| 2-Person Household | 1,341 | 43.0% |
| 3-Person Household | 469 | 15.1% |
| 4+ Person Household | 599 | 19.2% |
| Total Housing Units | 3,115 | 100.0% |
Occupancy by Ownership by Household Size in Westlake Village
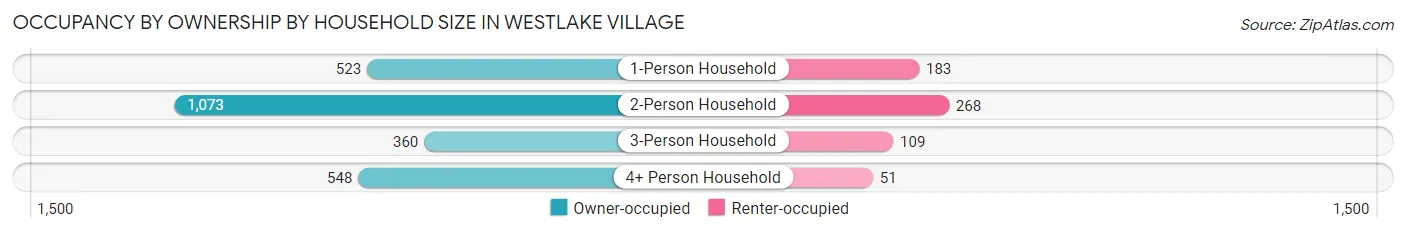
| Household Size | Owner-occupied | Renter-occupied |
| 1-Person Household | 523 (74.1%) | 183 (25.9%) |
| 2-Person Household | 1,073 (80.0%) | 268 (20.0%) |
| 3-Person Household | 360 (76.8%) | 109 (23.2%) |
| 4+ Person Household | 548 (91.5%) | 51 (8.5%) |
| Total Housing Units | 2,504 (80.4%) | 611 (19.6%) |
Occupancy by Educational Attainment in Westlake Village
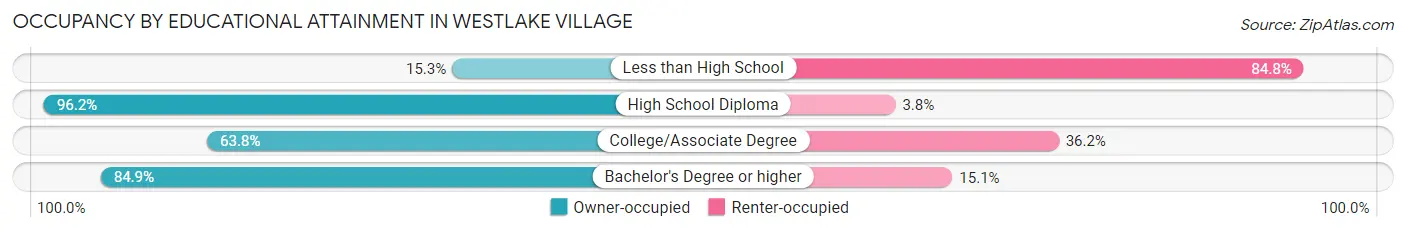
| Household Size | Owner-occupied | Renter-occupied |
| Less than High School | 9 (15.2%) | 50 (84.8%) |
| High School Diploma | 201 (96.2%) | 8 (3.8%) |
| College/Associate Degree | 372 (63.8%) | 211 (36.2%) |
| Bachelor's Degree or higher | 1,922 (84.9%) | 342 (15.1%) |
Occupancy by Age of Householder in Westlake Village
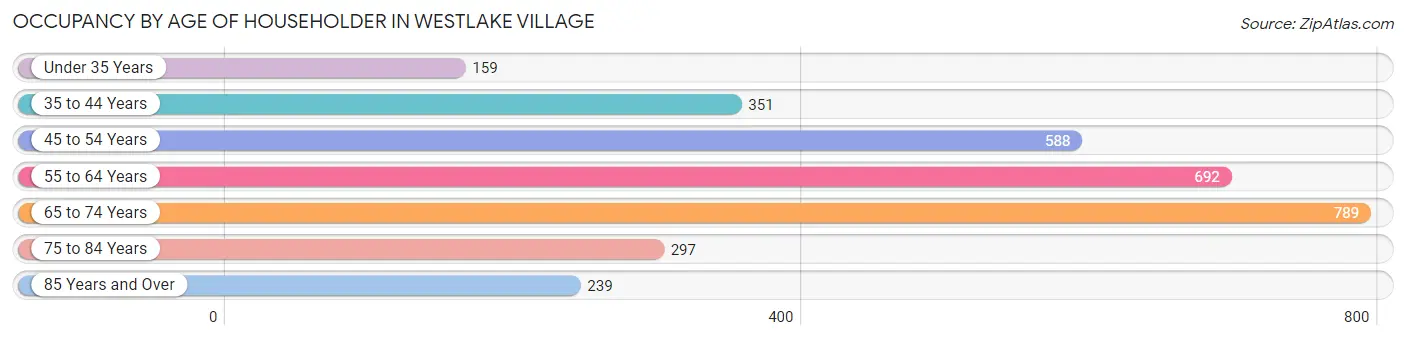
| Age Bracket | # Households | % Households |
| Under 35 Years | 159 | 5.1% |
| 35 to 44 Years | 351 | 11.3% |
| 45 to 54 Years | 588 | 18.9% |
| 55 to 64 Years | 692 | 22.2% |
| 65 to 74 Years | 789 | 25.3% |
| 75 to 84 Years | 297 | 9.5% |
| 85 Years and Over | 239 | 7.7% |
| Total | 3,115 | 100.0% |
Housing Finances in Westlake Village
Median Income by Occupancy in Westlake Village
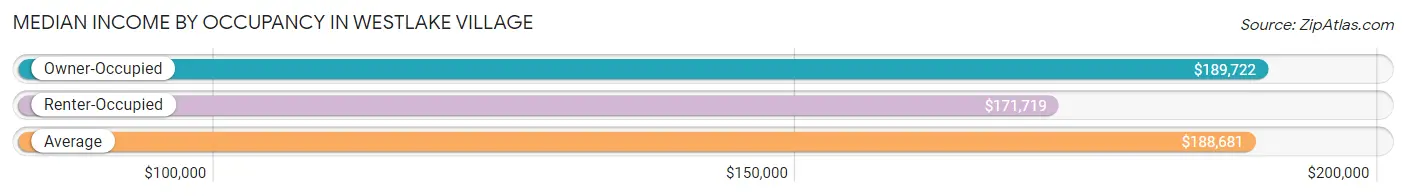
| Occupancy Type | # Households | Median Income |
| Owner-Occupied | 2,504 (80.4%) | $189,722 |
| Renter-Occupied | 611 (19.6%) | $171,719 |
| Average | 3,115 (100.0%) | $188,681 |
Occupancy by Householder Income Bracket in Westlake Village
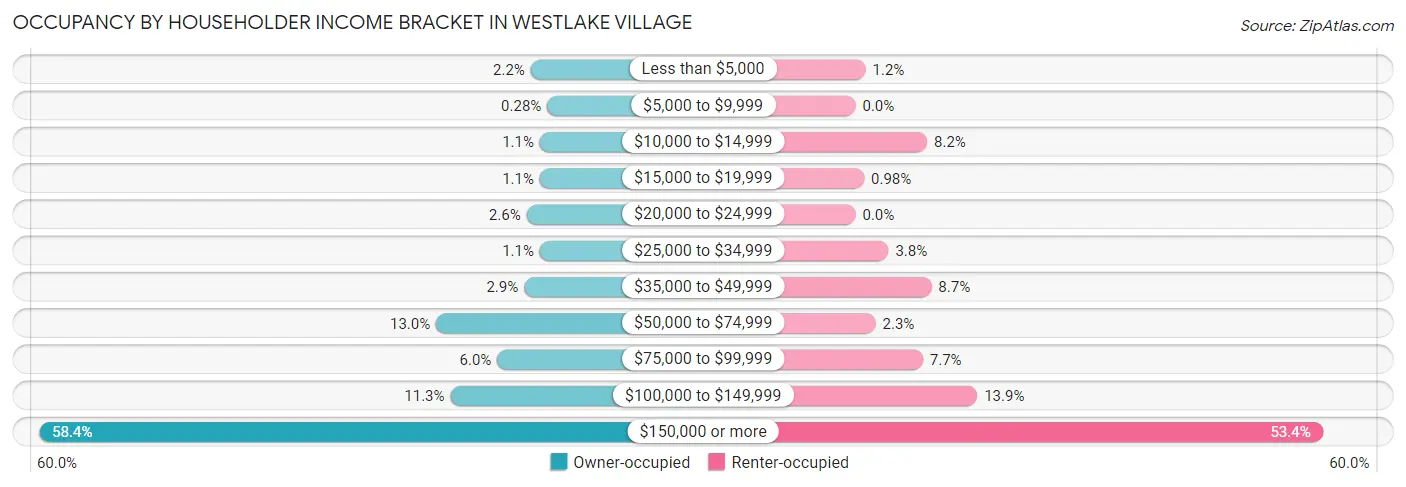
| Income Bracket | Owner-occupied | Renter-occupied |
| Less than $5,000 | 54 (2.2%) | 7 (1.1%) |
| $5,000 to $9,999 | 7 (0.3%) | 0 (0.0%) |
| $10,000 to $14,999 | 28 (1.1%) | 50 (8.2%) |
| $15,000 to $19,999 | 28 (1.1%) | 6 (1.0%) |
| $20,000 to $24,999 | 66 (2.6%) | 0 (0.0%) |
| $25,000 to $34,999 | 28 (1.1%) | 23 (3.8%) |
| $35,000 to $49,999 | 73 (2.9%) | 53 (8.7%) |
| $50,000 to $74,999 | 325 (13.0%) | 14 (2.3%) |
| $75,000 to $99,999 | 150 (6.0%) | 47 (7.7%) |
| $100,000 to $149,999 | 284 (11.3%) | 85 (13.9%) |
| $150,000 or more | 1,461 (58.4%) | 326 (53.4%) |
| Total | 2,504 (100.0%) | 611 (100.0%) |
Monthly Housing Cost Tiers in Westlake Village
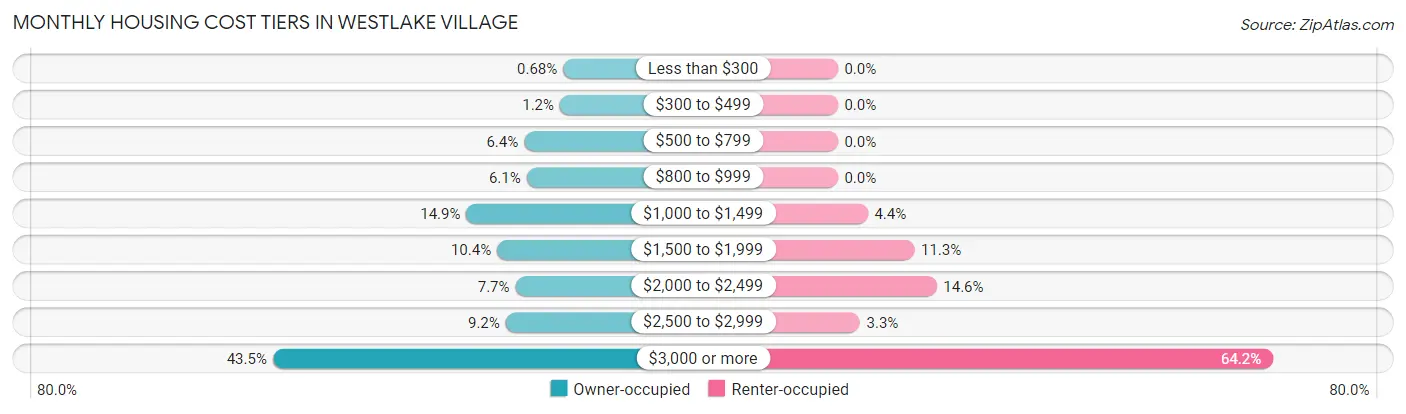
| Monthly Cost | Owner-occupied | Renter-occupied |
| Less than $300 | 17 (0.7%) | 0 (0.0%) |
| $300 to $499 | 29 (1.2%) | 0 (0.0%) |
| $500 to $799 | 161 (6.4%) | 0 (0.0%) |
| $800 to $999 | 152 (6.1%) | 0 (0.0%) |
| $1,000 to $1,499 | 374 (14.9%) | 27 (4.4%) |
| $1,500 to $1,999 | 261 (10.4%) | 69 (11.3%) |
| $2,000 to $2,499 | 193 (7.7%) | 89 (14.6%) |
| $2,500 to $2,999 | 229 (9.1%) | 20 (3.3%) |
| $3,000 or more | 1,088 (43.4%) | 392 (64.2%) |
| Total | 2,504 (100.0%) | 611 (100.0%) |
Physical Housing Characteristics in Westlake Village
Housing Structures in Westlake Village
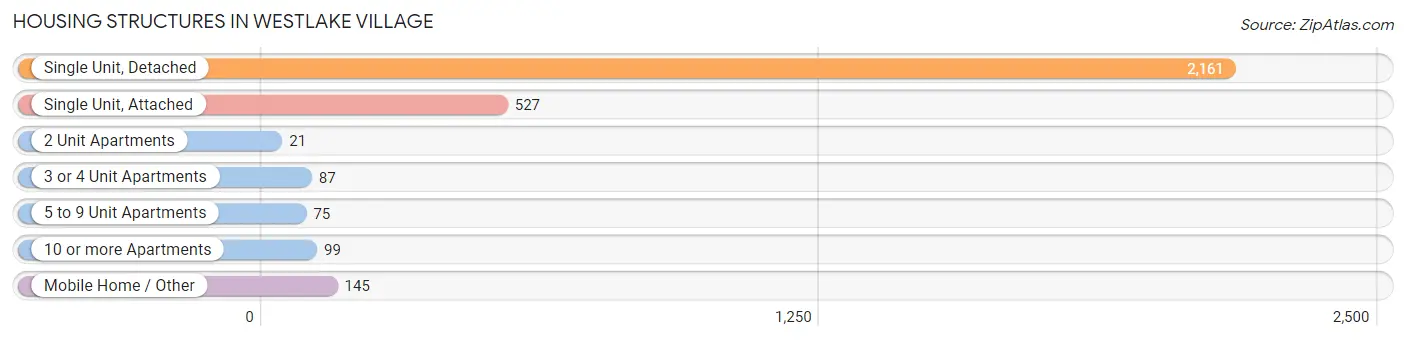
| Structure Type | # Housing Units | % Housing Units |
| Single Unit, Detached | 2,161 | 69.4% |
| Single Unit, Attached | 527 | 16.9% |
| 2 Unit Apartments | 21 | 0.7% |
| 3 or 4 Unit Apartments | 87 | 2.8% |
| 5 to 9 Unit Apartments | 75 | 2.4% |
| 10 or more Apartments | 99 | 3.2% |
| Mobile Home / Other | 145 | 4.6% |
| Total | 3,115 | 100.0% |
Housing Structures by Occupancy in Westlake Village
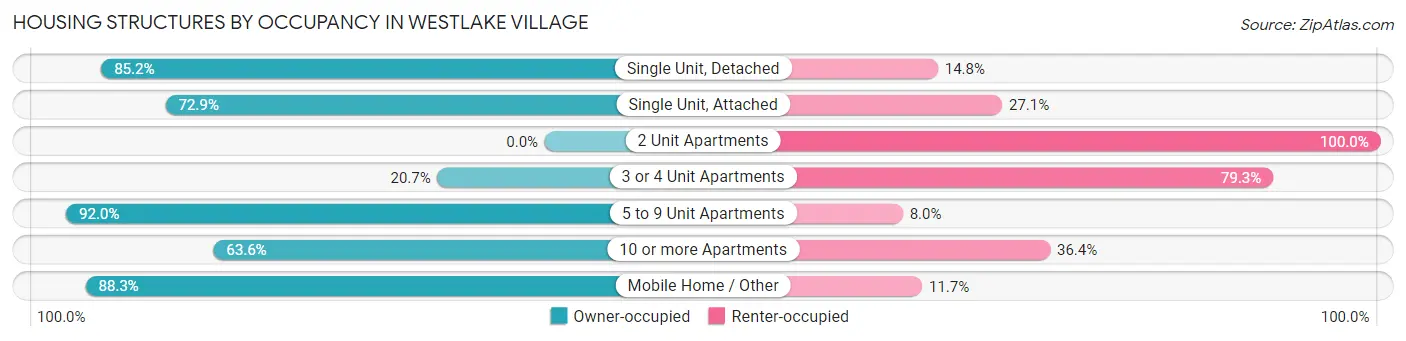
| Structure Type | Owner-occupied | Renter-occupied |
| Single Unit, Detached | 1,842 (85.2%) | 319 (14.8%) |
| Single Unit, Attached | 384 (72.9%) | 143 (27.1%) |
| 2 Unit Apartments | 0 (0.0%) | 21 (100.0%) |
| 3 or 4 Unit Apartments | 18 (20.7%) | 69 (79.3%) |
| 5 to 9 Unit Apartments | 69 (92.0%) | 6 (8.0%) |
| 10 or more Apartments | 63 (63.6%) | 36 (36.4%) |
| Mobile Home / Other | 128 (88.3%) | 17 (11.7%) |
| Total | 2,504 (80.4%) | 611 (19.6%) |
Housing Structures by Number of Rooms in Westlake Village
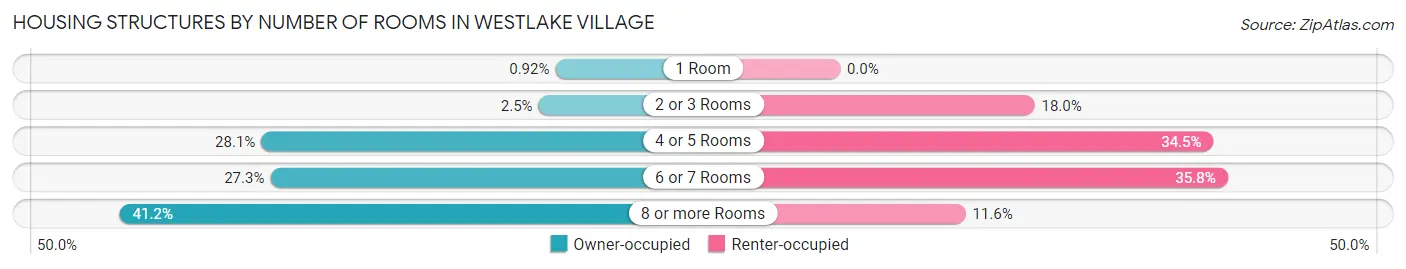
| Number of Rooms | Owner-occupied | Renter-occupied |
| 1 Room | 23 (0.9%) | 0 (0.0%) |
| 2 or 3 Rooms | 62 (2.5%) | 110 (18.0%) |
| 4 or 5 Rooms | 704 (28.1%) | 211 (34.5%) |
| 6 or 7 Rooms | 683 (27.3%) | 219 (35.8%) |
| 8 or more Rooms | 1,032 (41.2%) | 71 (11.6%) |
| Total | 2,504 (100.0%) | 611 (100.0%) |
Housing Structure by Heating Type in Westlake Village
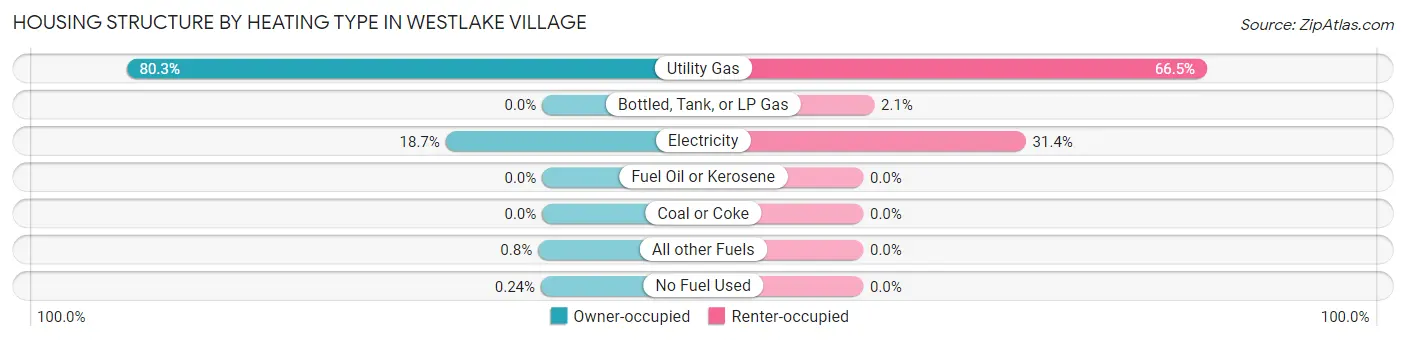
| Heating Type | Owner-occupied | Renter-occupied |
| Utility Gas | 2,011 (80.3%) | 406 (66.4%) |
| Bottled, Tank, or LP Gas | 0 (0.0%) | 13 (2.1%) |
| Electricity | 467 (18.6%) | 192 (31.4%) |
| Fuel Oil or Kerosene | 0 (0.0%) | 0 (0.0%) |
| Coal or Coke | 0 (0.0%) | 0 (0.0%) |
| All other Fuels | 20 (0.8%) | 0 (0.0%) |
| No Fuel Used | 6 (0.2%) | 0 (0.0%) |
| Total | 2,504 (100.0%) | 611 (100.0%) |
Household Vehicle Usage in Westlake Village
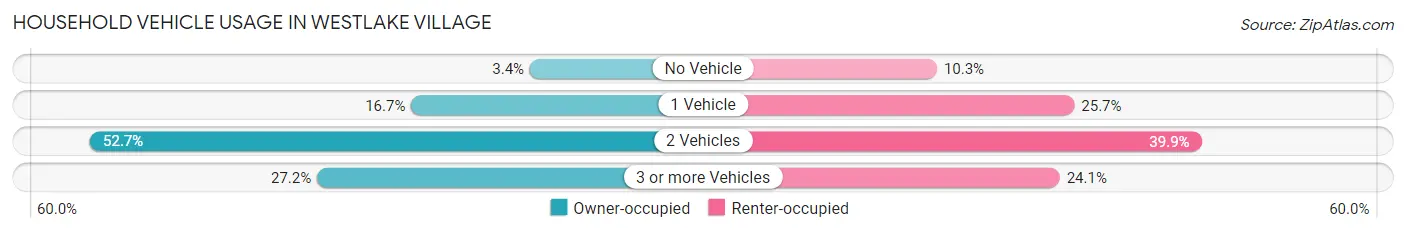
| Vehicles per Household | Owner-occupied | Renter-occupied |
| No Vehicle | 85 (3.4%) | 63 (10.3%) |
| 1 Vehicle | 418 (16.7%) | 157 (25.7%) |
| 2 Vehicles | 1,319 (52.7%) | 244 (39.9%) |
| 3 or more Vehicles | 682 (27.2%) | 147 (24.1%) |
| Total | 2,504 (100.0%) | 611 (100.0%) |
Real Estate & Mortgages in Westlake Village
Real Estate and Mortgage Overview in Westlake Village
| Characteristic | Without Mortgage | With Mortgage |
| Housing Units | 921 | 1,583 |
| Median Property Value | $1,167,300 | $1,259,200 |
| Median Household Income | $165,795 | $981 |
| Monthly Housing Costs | $1,184 | $1,038 |
| Real Estate Taxes | $7,465 | $0 |
Property Value by Mortgage Status in Westlake Village
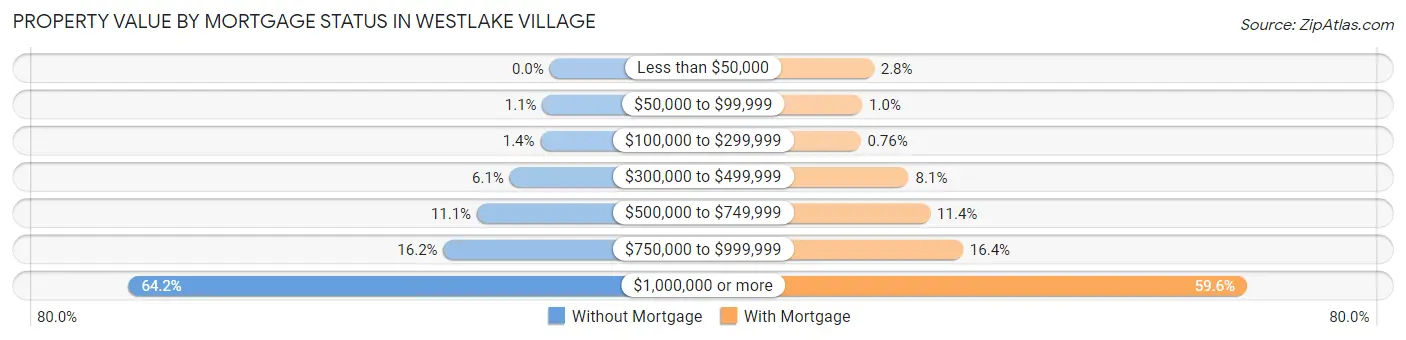
| Property Value | Without Mortgage | With Mortgage |
| Less than $50,000 | 0 (0.0%) | 44 (2.8%) |
| $50,000 to $99,999 | 10 (1.1%) | 16 (1.0%) |
| $100,000 to $299,999 | 13 (1.4%) | 12 (0.8%) |
| $300,000 to $499,999 | 56 (6.1%) | 128 (8.1%) |
| $500,000 to $749,999 | 102 (11.1%) | 180 (11.4%) |
| $750,000 to $999,999 | 149 (16.2%) | 259 (16.4%) |
| $1,000,000 or more | 591 (64.2%) | 944 (59.6%) |
| Total | 921 (100.0%) | 1,583 (100.0%) |
Household Income by Mortgage Status in Westlake Village
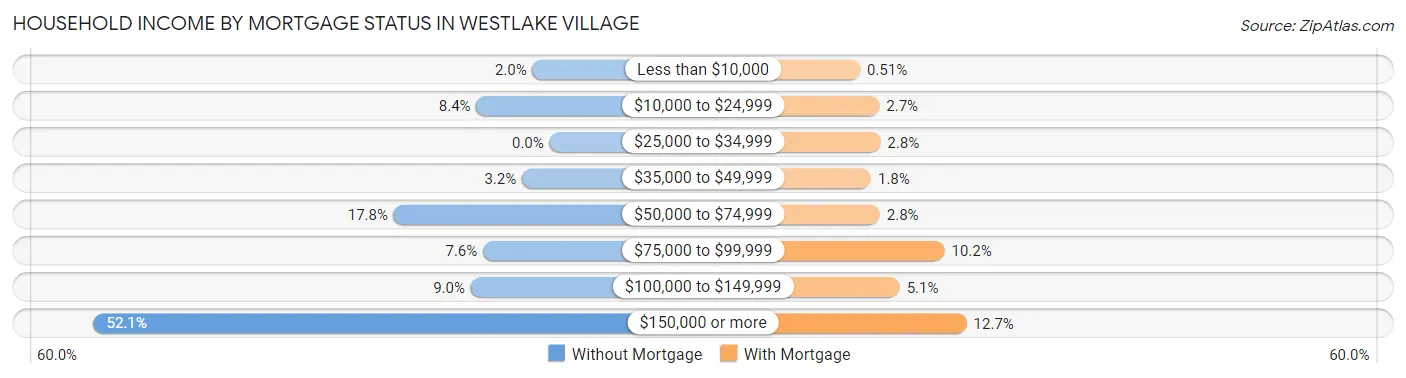
| Household Income | Without Mortgage | With Mortgage |
| Less than $10,000 | 18 (1.9%) | 8 (0.5%) |
| $10,000 to $24,999 | 77 (8.4%) | 43 (2.7%) |
| $25,000 to $34,999 | 0 (0.0%) | 45 (2.8%) |
| $35,000 to $49,999 | 29 (3.2%) | 28 (1.8%) |
| $50,000 to $74,999 | 164 (17.8%) | 44 (2.8%) |
| $75,000 to $99,999 | 70 (7.6%) | 161 (10.2%) |
| $100,000 to $149,999 | 83 (9.0%) | 80 (5.1%) |
| $150,000 or more | 480 (52.1%) | 201 (12.7%) |
| Total | 921 (100.0%) | 1,583 (100.0%) |
Property Value to Household Income Ratio in Westlake Village
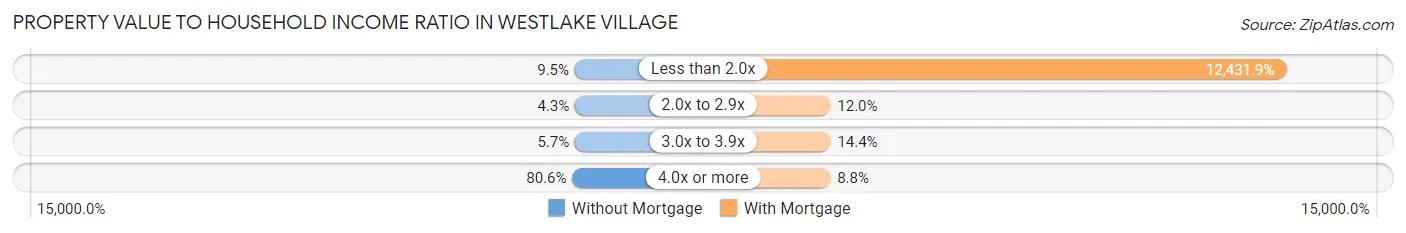
| Value-to-Income Ratio | Without Mortgage | With Mortgage |
| Less than 2.0x | 87 (9.5%) | 196,797 (12,431.9%) |
| 2.0x to 2.9x | 40 (4.3%) | 190 (12.0%) |
| 3.0x to 3.9x | 52 (5.7%) | 228 (14.4%) |
| 4.0x or more | 742 (80.6%) | 139 (8.8%) |
| Total | 921 (100.0%) | 1,583 (100.0%) |
Real Estate Taxes by Mortgage Status in Westlake Village
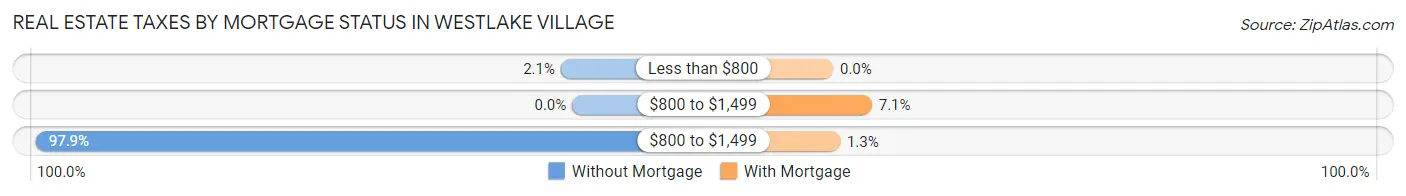
| Property Taxes | Without Mortgage | With Mortgage |
| Less than $800 | 19 (2.1%) | 0 (0.0%) |
| $800 to $1,499 | 0 (0.0%) | 112 (7.1%) |
| $800 to $1,499 | 902 (97.9%) | 20 (1.3%) |
| Total | 921 (100.0%) | 1,583 (100.0%) |
Health & Disability in Westlake Village
Health Insurance Coverage by Age in Westlake Village
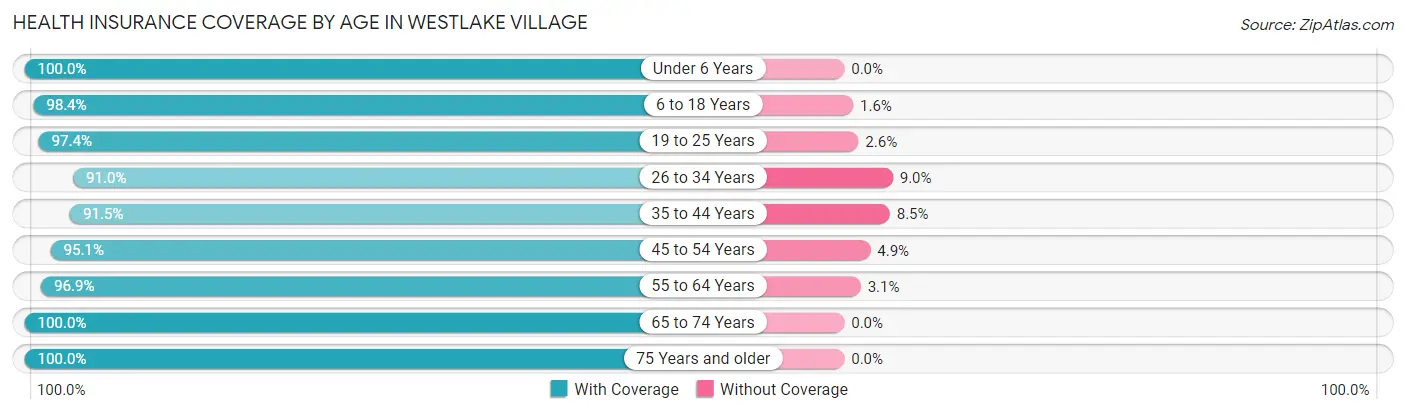
| Age Bracket | With Coverage | Without Coverage |
| Under 6 Years | 220 (100.0%) | 0 (0.0%) |
| 6 to 18 Years | 1,257 (98.4%) | 21 (1.6%) |
| 19 to 25 Years | 333 (97.4%) | 9 (2.6%) |
| 26 to 34 Years | 523 (91.0%) | 52 (9.0%) |
| 35 to 44 Years | 734 (91.5%) | 68 (8.5%) |
| 45 to 54 Years | 1,155 (95.1%) | 59 (4.9%) |
| 55 to 64 Years | 1,261 (96.9%) | 40 (3.1%) |
| 65 to 74 Years | 1,313 (100.0%) | 0 (0.0%) |
| 75 Years and older | 896 (100.0%) | 0 (0.0%) |
| Total | 7,692 (96.9%) | 249 (3.1%) |
Health Insurance Coverage by Citizenship Status in Westlake Village
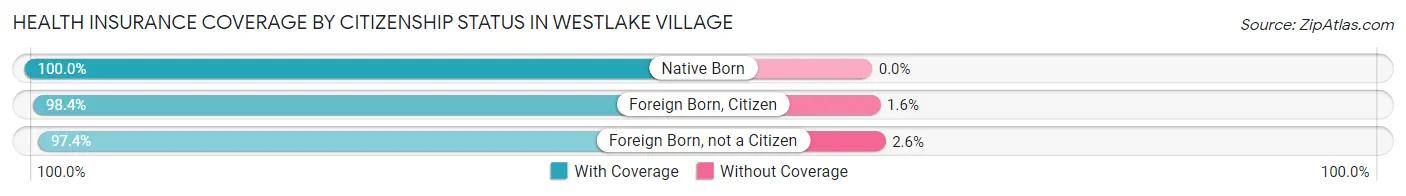
| Citizenship Status | With Coverage | Without Coverage |
| Native Born | 220 (100.0%) | 0 (0.0%) |
| Foreign Born, Citizen | 1,257 (98.4%) | 21 (1.6%) |
| Foreign Born, not a Citizen | 333 (97.4%) | 9 (2.6%) |
Health Insurance Coverage by Household Income in Westlake Village
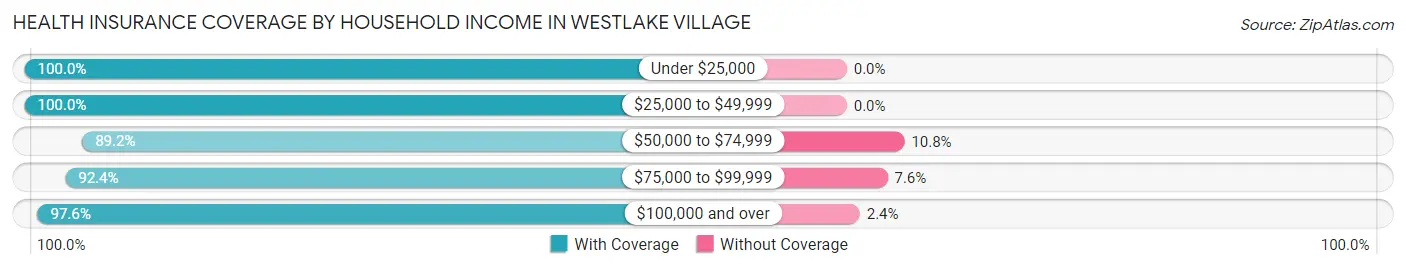
| Household Income | With Coverage | Without Coverage |
| Under $25,000 | 448 (100.0%) | 0 (0.0%) |
| $25,000 to $49,999 | 299 (100.0%) | 0 (0.0%) |
| $50,000 to $74,999 | 545 (89.2%) | 66 (10.8%) |
| $75,000 to $99,999 | 363 (92.4%) | 30 (7.6%) |
| $100,000 and over | 5,971 (97.6%) | 149 (2.4%) |
Public vs Private Health Insurance Coverage by Age in Westlake Village
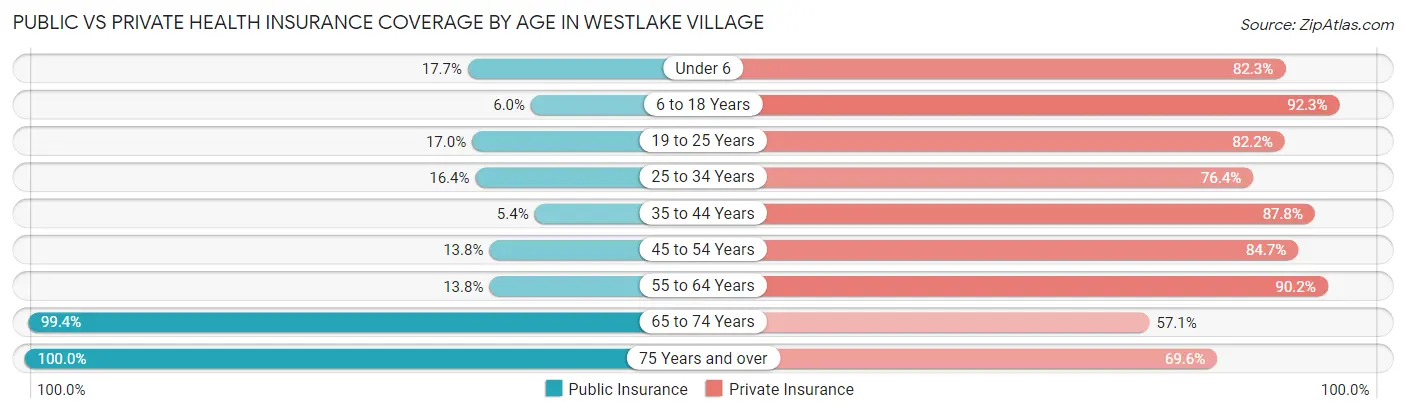
| Age Bracket | Public Insurance | Private Insurance |
| Under 6 | 39 (17.7%) | 181 (82.3%) |
| 6 to 18 Years | 77 (6.0%) | 1,180 (92.3%) |
| 19 to 25 Years | 58 (17.0%) | 281 (82.2%) |
| 25 to 34 Years | 94 (16.4%) | 439 (76.3%) |
| 35 to 44 Years | 43 (5.4%) | 704 (87.8%) |
| 45 to 54 Years | 167 (13.8%) | 1,028 (84.7%) |
| 55 to 64 Years | 179 (13.8%) | 1,173 (90.2%) |
| 65 to 74 Years | 1,305 (99.4%) | 750 (57.1%) |
| 75 Years and over | 896 (100.0%) | 624 (69.6%) |
| Total | 2,858 (36.0%) | 6,360 (80.1%) |
Disability Status by Sex by Age in Westlake Village
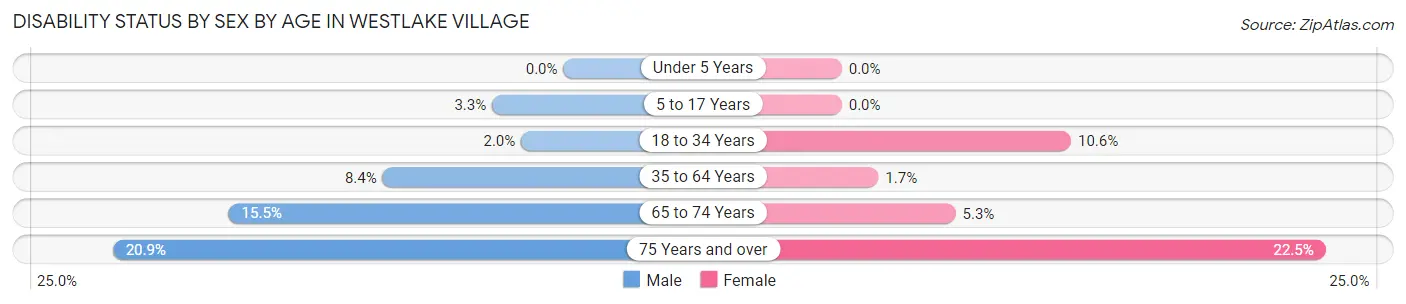
| Age Bracket | Male | Female |
| Under 5 Years | 0 (0.0%) | 0 (0.0%) |
| 5 to 17 Years | 19 (3.3%) | 0 (0.0%) |
| 18 to 34 Years | 10 (2.0%) | 45 (10.6%) |
| 35 to 64 Years | 130 (8.4%) | 30 (1.7%) |
| 65 to 74 Years | 98 (15.5%) | 36 (5.3%) |
| 75 Years and over | 97 (20.9%) | 97 (22.5%) |
Disability Class by Sex by Age in Westlake Village
Disability Class: Hearing Difficulty
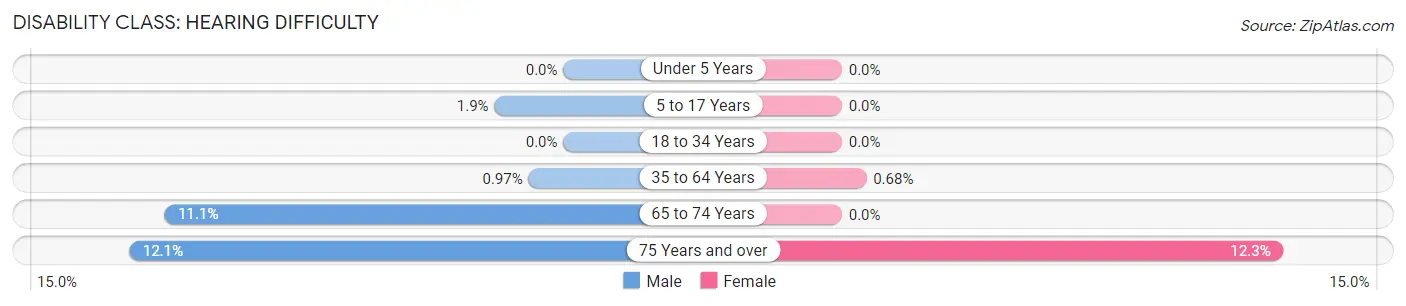
| Age Bracket | Male | Female |
| Under 5 Years | 0 (0.0%) | 0 (0.0%) |
| 5 to 17 Years | 11 (1.9%) | 0 (0.0%) |
| 18 to 34 Years | 0 (0.0%) | 0 (0.0%) |
| 35 to 64 Years | 15 (1.0%) | 12 (0.7%) |
| 65 to 74 Years | 70 (11.1%) | 0 (0.0%) |
| 75 Years and over | 56 (12.1%) | 53 (12.3%) |
Disability Class: Vision Difficulty
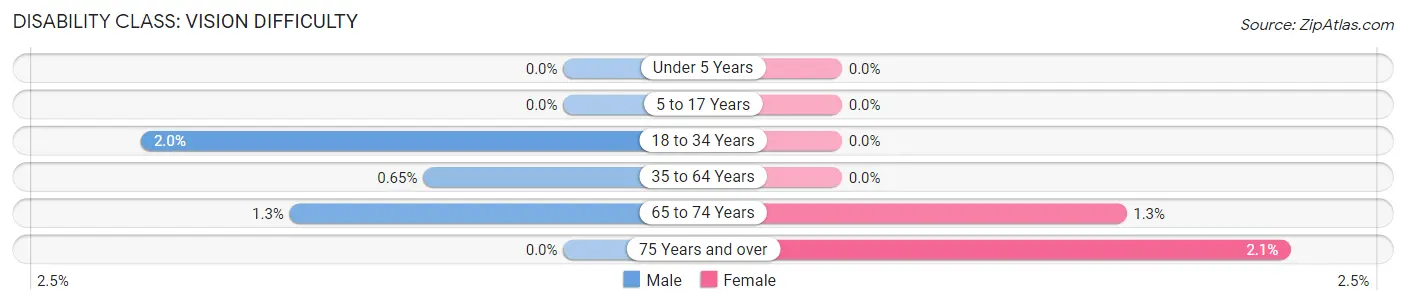
| Age Bracket | Male | Female |
| Under 5 Years | 0 (0.0%) | 0 (0.0%) |
| 5 to 17 Years | 0 (0.0%) | 0 (0.0%) |
| 18 to 34 Years | 10 (2.0%) | 0 (0.0%) |
| 35 to 64 Years | 10 (0.6%) | 0 (0.0%) |
| 65 to 74 Years | 8 (1.3%) | 9 (1.3%) |
| 75 Years and over | 0 (0.0%) | 9 (2.1%) |
Disability Class: Cognitive Difficulty
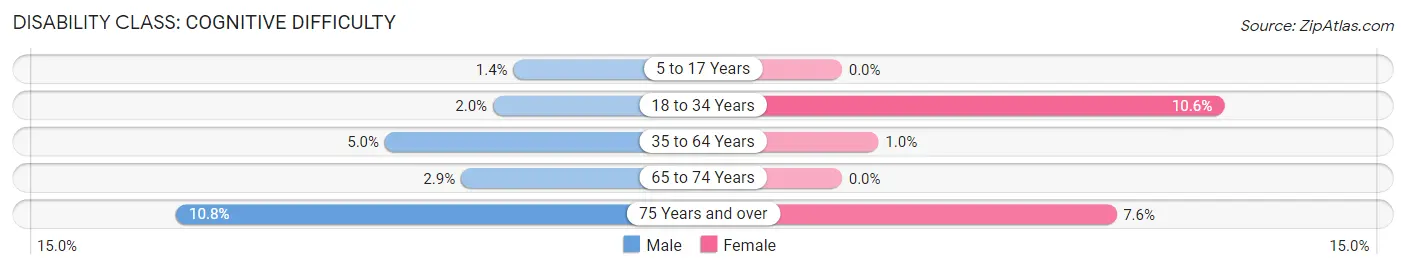
| Age Bracket | Male | Female |
| 5 to 17 Years | 8 (1.4%) | 0 (0.0%) |
| 18 to 34 Years | 10 (2.0%) | 45 (10.6%) |
| 35 to 64 Years | 77 (5.0%) | 18 (1.0%) |
| 65 to 74 Years | 18 (2.9%) | 0 (0.0%) |
| 75 Years and over | 50 (10.8%) | 33 (7.6%) |
Disability Class: Ambulatory Difficulty
| Age Bracket | Male | Female |
| 5 to 17 Years | 0 (0.0%) | 0 (0.0%) |
| 18 to 34 Years | 0 (0.0%) | 0 (0.0%) |
| 35 to 64 Years | 46 (3.0%) | 0 (0.0%) |
| 65 to 74 Years | 22 (3.5%) | 27 (4.0%) |
| 75 Years and over | 31 (6.7%) | 59 (13.7%) |
Disability Class: Self-Care Difficulty
| Age Bracket | Male | Female |
| 5 to 17 Years | 0 (0.0%) | 0 (0.0%) |
| 18 to 34 Years | 0 (0.0%) | 15 (3.5%) |
| 35 to 64 Years | 8 (0.5%) | 0 (0.0%) |
| 65 to 74 Years | 24 (3.8%) | 7 (1.0%) |
| 75 Years and over | 9 (1.9%) | 8 (1.8%) |
Technology Access in Westlake Village
Computing Device Access in Westlake Village
| Device Type | # Households | % Households |
| Desktop or Laptop | 2,948 | 94.6% |
| Smartphone | 2,897 | 93.0% |
| Tablet | 2,397 | 76.9% |
| No Computing Device | 82 | 2.6% |
| Total | 3,115 | 100.0% |
Internet Access in Westlake Village
| Internet Type | # Households | % Households |
| Dial-Up Internet | 0 | 0.0% |
| Broadband Home | 2,724 | 87.5% |
| Cellular Data Only | 150 | 4.8% |
| Satellite Internet | 262 | 8.4% |
| No Internet | 161 | 5.2% |
| Total | 3,115 | 100.0% |
Westlake Village Summary
Westlake Village is a city located in Los Angeles County, California, United States. It is located in the western part of the county, near the Ventura County line. The population was estimated to be 8,270 at the 2010 census.
History
Westlake Village was founded in the late 1960s by the Janss Investment Company, which was owned by the Janss family. The Janss family had previously developed the nearby community of Thousand Oaks. The area was originally part of the Rancho Simi land grant, and was used for cattle grazing and farming. In the late 1960s, the Janss Investment Company purchased the land and began developing it into a planned community.
The first homes were built in 1969, and the community was officially incorporated as the City of Westlake Village in 1981. The city is named after the nearby Westlake Lake, which was formed by the damming of the Arroyo Simi in 1968.
Geography
Westlake Village is located in the western part of Los Angeles County, near the Ventura County line. It is bordered by the cities of Thousand Oaks to the north, Agoura Hills to the east, and Calabasas to the south. The city is situated in the Conejo Valley, and is surrounded by the Santa Monica Mountains to the west and the Simi Hills to the east.
The city covers an area of 8.2 square miles, and has an elevation of 830 feet. The climate is Mediterranean, with hot, dry summers and mild, wet winters.
Economy
Westlake Village is a primarily residential community, and the economy is largely based on the service industry. The city is home to a number of corporate headquarters, including Dole Food Company, K-Swiss, and J.D. Power and Associates.
The city is also home to a number of shopping centers, including the Westlake Promenade and the Westlake Village Shopping Center. The city is also home to a number of restaurants, bars, and other entertainment venues.
Demographics
As of the 2010 census, the population of Westlake Village was 8,270. The racial makeup of the city was 79.2% White, 4.3% African American, 0.3% Native American, 8.2% Asian, 0.1% Pacific Islander, 4.2% from other races, and 3.8% from two or more races. Hispanic or Latino of any race were 11.2% of the population.
The median household income in Westlake Village was $118,837, and the median family income was $133,837. The per capita income was $50,945. About 3.2% of families and 4.3% of the population were below the poverty line, including 4.3% of those under age 18 and 4.2% of those age 65 or over.
Common Questions
What is Per Capita Income in Westlake Village?
Per Capita income in Westlake Village is $99,908.
What is the Median Family Income in Westlake Village?
Median Family Income in Westlake Village is $208,788.
What is the Median Household income in Westlake Village?
Median Household Income in Westlake Village is $188,681.
What is Income or Wage Gap in Westlake Village?
Income or Wage Gap in Westlake Village is 42.0%.
Women in Westlake Village earn 58.0 cents for every dollar earned by a man.
What is Inequality or Gini Index in Westlake Village?
Inequality or Gini Index in Westlake Village is 0.49.
What is the Total Population of Westlake Village?
Total Population of Westlake Village is 7,948.
What is the Total Male Population of Westlake Village?
Total Male Population of Westlake Village is 3,862.
What is the Total Female Population of Westlake Village?
Total Female Population of Westlake Village is 4,086.
What is the Ratio of Males per 100 Females in Westlake Village?
There are 94.52 Males per 100 Females in Westlake Village.
What is the Ratio of Females per 100 Males in Westlake Village?
There are 105.80 Females per 100 Males in Westlake Village.
What is the Median Population Age in Westlake Village?
Median Population Age in Westlake Village is 51.2 Years.
What is the Average Family Size in Westlake Village
Average Family Size in Westlake Village is 3.0 People.
What is the Average Household Size in Westlake Village
Average Household Size in Westlake Village is 2.5 People.
How Large is the Labor Force in Westlake Village?
There are 3,866 People in the Labor Forcein in Westlake Village.
What is the Percentage of People in the Labor Force in Westlake Village?
57.1% of People are in the Labor Force in Westlake Village.
What is the Unemployment Rate in Westlake Village?
Unemployment Rate in Westlake Village is 2.9%.