Castaic, CA Map & Demographics
Castaic Map
Castaic Overview
$47,984
PER CAPITA INCOME
$143,200
AVG FAMILY INCOME
$132,429
AVG HOUSEHOLD INCOME
36.6%
WAGE / INCOME GAP [ % ]
63.4¢/ $1
WAGE / INCOME GAP [ $ ]
$15,308
FAMILY INCOME DEFICIT
0.37
INEQUALITY / GINI INDEX
18,643
TOTAL POPULATION
9,277
MALE POPULATION
9,366
FEMALE POPULATION
99.05
MALES / 100 FEMALES
100.96
FEMALES / 100 MALES
36.9
MEDIAN AGE
3.5
AVG FAMILY SIZE
3.2
AVG HOUSEHOLD SIZE
9,681
LABOR FORCE [ PEOPLE ]
68.8%
PERCENT IN LABOR FORCE
5.4%
UNEMPLOYMENT RATE
Castaic Zip Codes
Income in Castaic
Income Overview in Castaic
Per Capita Income in Castaic is $47,984, while median incomes of families and households are $143,200 and $132,429 respectively.
| Characteristic | Number | Measure |
| Per Capita Income | 18,643 | $47,984 |
| Median Family Income | 4,858 | $143,200 |
| Mean Family Income | 4,858 | $163,043 |
| Median Household Income | 5,775 | $132,429 |
| Mean Household Income | 5,775 | $151,276 |
| Income Deficit | 4,858 | $15,308 |
| Wage / Income Gap (%) | 18,643 | 36.63% |
| Wage / Income Gap ($) | 18,643 | 63.37¢ per $1 |
| Gini / Inequality Index | 18,643 | 0.37 |
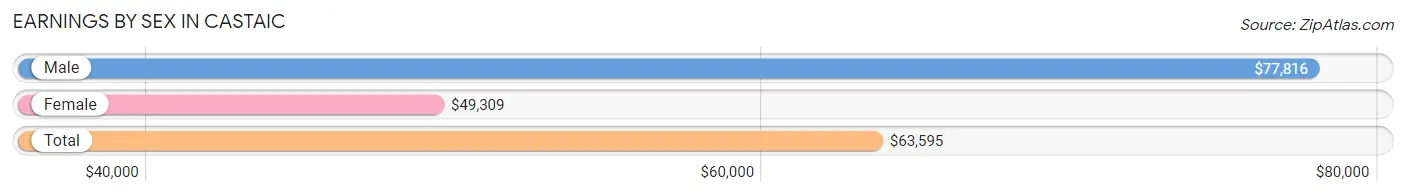
Earnings by Sex in Castaic
Average Earnings in Castaic are $63,595, $77,816 for men and $49,309 for women, a difference of 36.6%.
| Sex | Number | Average Earnings |
| Male | 5,274 (53.4%) | $77,816 |
| Female | 4,604 (46.6%) | $49,309 |
| Total | 9,878 (100.0%) | $63,595 |
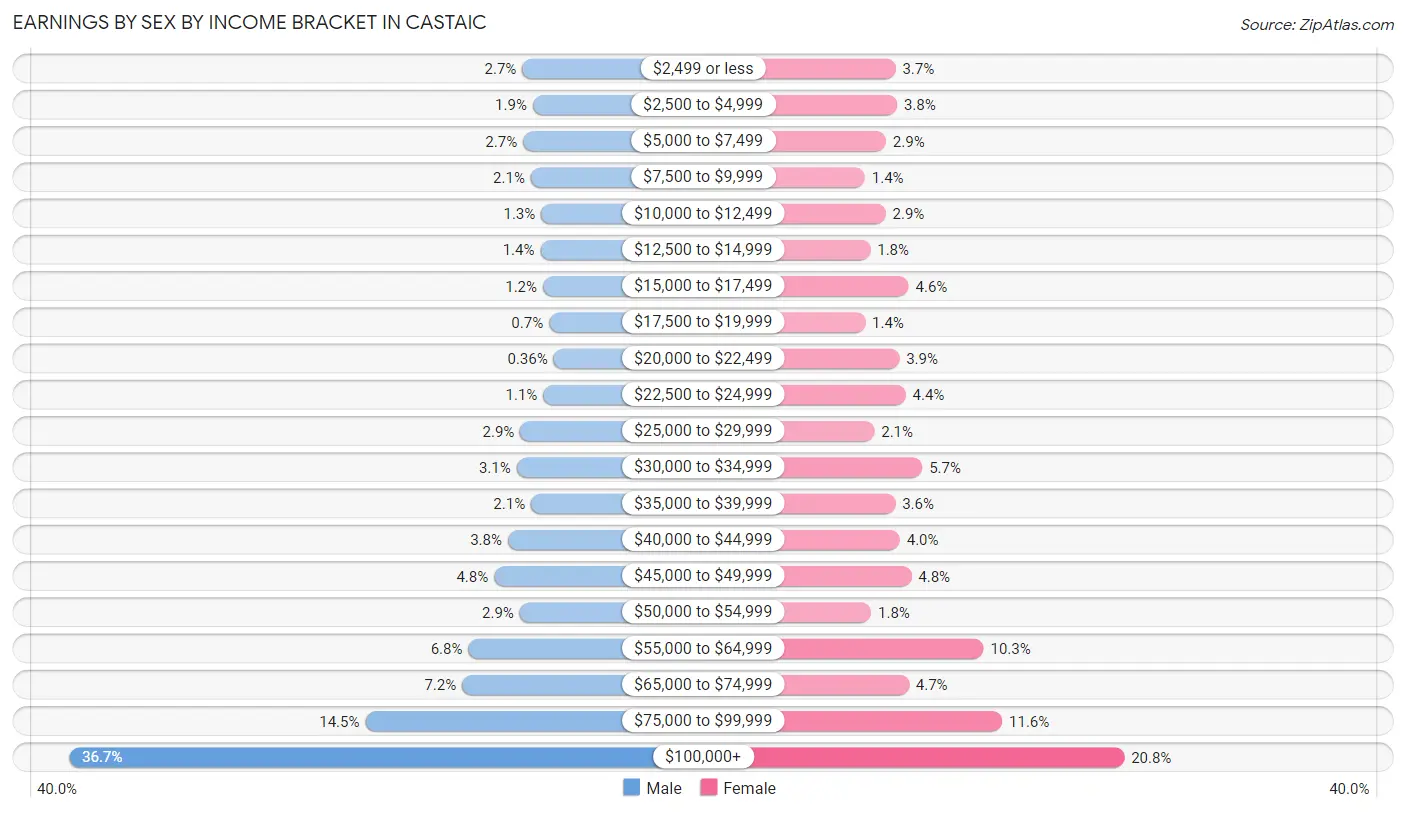
Earnings by Sex by Income Bracket in Castaic
The most common earnings brackets in Castaic are $100,000+ for men (1,934 | 36.7%) and $100,000+ for women (957 | 20.8%).
| Income | Male | Female |
| $2,499 or less | 143 (2.7%) | 168 (3.6%) |
| $2,500 to $4,999 | 101 (1.9%) | 173 (3.8%) |
| $5,000 to $7,499 | 140 (2.6%) | 135 (2.9%) |
| $7,500 to $9,999 | 109 (2.1%) | 62 (1.3%) |
| $10,000 to $12,499 | 68 (1.3%) | 134 (2.9%) |
| $12,500 to $14,999 | 71 (1.3%) | 81 (1.8%) |
| $15,000 to $17,499 | 61 (1.2%) | 213 (4.6%) |
| $17,500 to $19,999 | 37 (0.7%) | 63 (1.4%) |
| $20,000 to $22,499 | 19 (0.4%) | 181 (3.9%) |
| $22,500 to $24,999 | 60 (1.1%) | 203 (4.4%) |
| $25,000 to $29,999 | 151 (2.9%) | 95 (2.1%) |
| $30,000 to $34,999 | 165 (3.1%) | 260 (5.7%) |
| $35,000 to $39,999 | 108 (2.1%) | 167 (3.6%) |
| $40,000 to $44,999 | 200 (3.8%) | 183 (4.0%) |
| $45,000 to $49,999 | 254 (4.8%) | 223 (4.8%) |
| $50,000 to $54,999 | 153 (2.9%) | 84 (1.8%) |
| $55,000 to $64,999 | 356 (6.8%) | 472 (10.2%) |
| $65,000 to $74,999 | 381 (7.2%) | 214 (4.6%) |
| $75,000 to $99,999 | 763 (14.5%) | 536 (11.6%) |
| $100,000+ | 1,934 (36.7%) | 957 (20.8%) |
| Total | 5,274 (100.0%) | 4,604 (100.0%) |
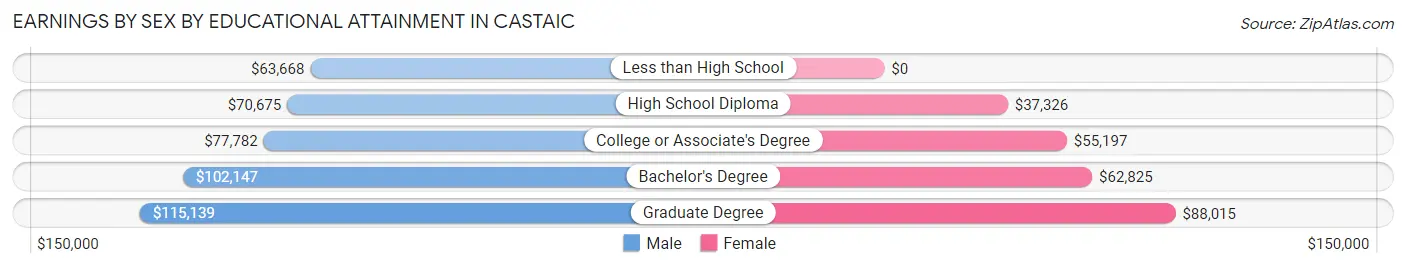
Earnings by Sex by Educational Attainment in Castaic
Average earnings in Castaic are $85,579 for men and $56,871 for women, a difference of 33.6%. Men with an educational attainment of graduate degree enjoy the highest average annual earnings of $115,139, while those with less than high school education earn the least with $63,668. Women with an educational attainment of graduate degree earn the most with the average annual earnings of $88,015, while those with high school diploma education have the smallest earnings of $37,326.
| Educational Attainment | Male Income | Female Income |
| Less than High School | $63,668 | $0 |
| High School Diploma | $70,675 | $37,326 |
| College or Associate's Degree | $77,782 | $55,197 |
| Bachelor's Degree | $102,147 | $62,825 |
| Graduate Degree | $115,139 | $88,015 |
| Total | $85,579 | $56,871 |
Family Income in Castaic
Family Income Brackets in Castaic
According to the Castaic family income data, there are 1,433 families falling into the $200,000+ income range, which is the most common income bracket and makes up 29.5% of all families. Conversely, the $15,000 to $24,999 income bracket is the least frequent group with only 10 families (0.2%) belonging to this category.
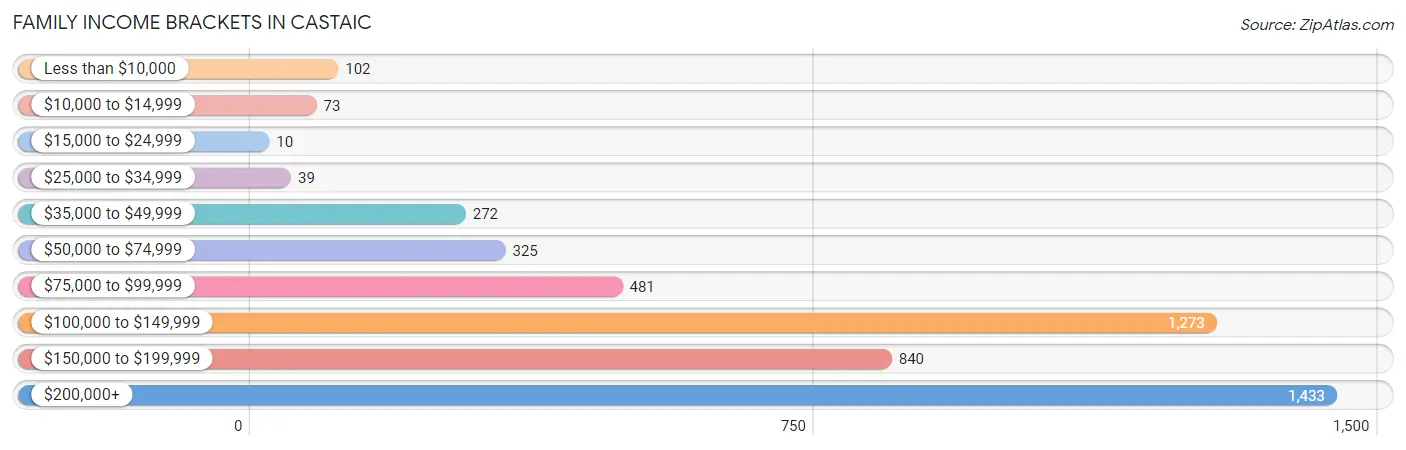
| Income Bracket | # Families | % Families |
| Less than $10,000 | 102 | 2.1% |
| $10,000 to $14,999 | 73 | 1.5% |
| $15,000 to $24,999 | 10 | 0.2% |
| $25,000 to $34,999 | 39 | 0.8% |
| $35,000 to $49,999 | 272 | 5.6% |
| $50,000 to $74,999 | 325 | 6.7% |
| $75,000 to $99,999 | 481 | 9.9% |
| $100,000 to $149,999 | 1,273 | 26.2% |
| $150,000 to $199,999 | 840 | 17.3% |
| $200,000+ | 1,433 | 29.5% |
Family Income by Famaliy Size in Castaic
7+ person families (93 | 1.9%) account for the highest median family income in Castaic with $246,576 per family, while 2-person families (1,552 | 32.0%) have the highest median income of $63,906 per family member.
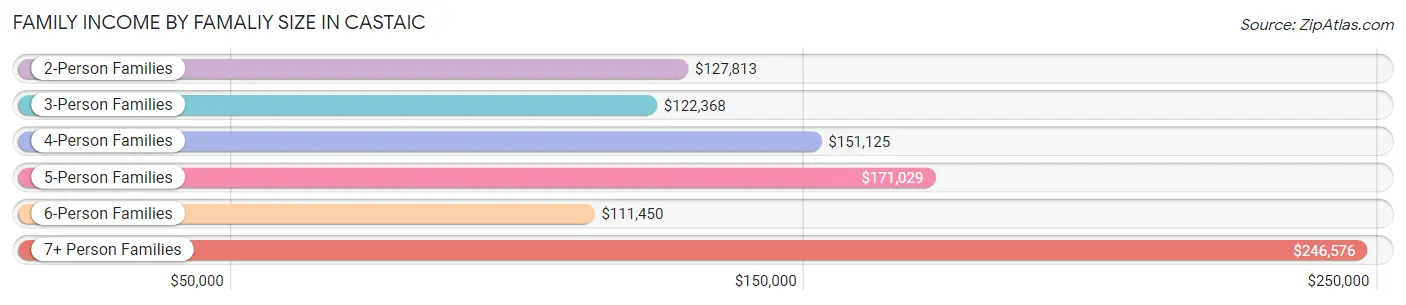
| Income Bracket | # Families | Median Income |
| 2-Person Families | 1,552 (32.0%) | $127,813 |
| 3-Person Families | 1,194 (24.6%) | $122,368 |
| 4-Person Families | 1,258 (25.9%) | $151,125 |
| 5-Person Families | 604 (12.4%) | $171,029 |
| 6-Person Families | 157 (3.2%) | $111,450 |
| 7+ Person Families | 93 (1.9%) | $246,576 |
| Total | 4,858 (100.0%) | $143,200 |
Family Income by Number of Earners in Castaic
The median family income in Castaic is $143,200, with families comprising 3+ earners (743) having the highest median family income of $207,337, while families with no earners (410) have the lowest median family income of $63,200, accounting for 15.3% and 8.4% of families, respectively.
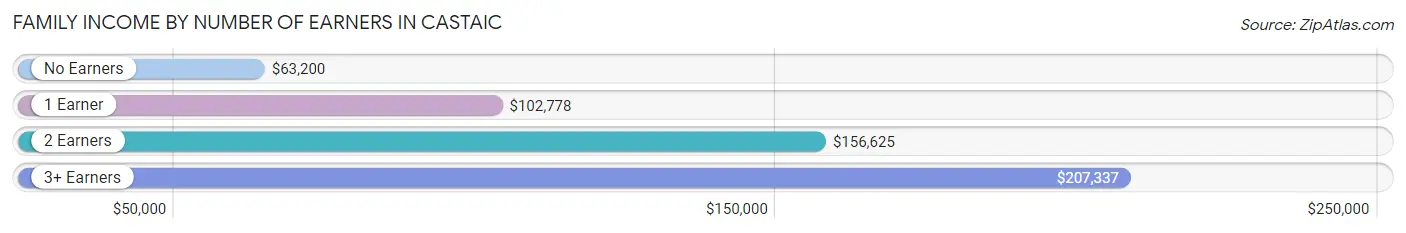
| Number of Earners | # Families | Median Income |
| No Earners | 410 (8.4%) | $63,200 |
| 1 Earner | 1,276 (26.3%) | $102,778 |
| 2 Earners | 2,429 (50.0%) | $156,625 |
| 3+ Earners | 743 (15.3%) | $207,337 |
| Total | 4,858 (100.0%) | $143,200 |
Household Income in Castaic
Household Income Brackets in Castaic
With 1,548 households falling in the category, the $100,000 to $149,999 income range is the most frequent in Castaic, accounting for 26.8% of all households. In contrast, only 98 households (1.7%) fall into the $10,000 to $14,999 income bracket, making it the least populous group.
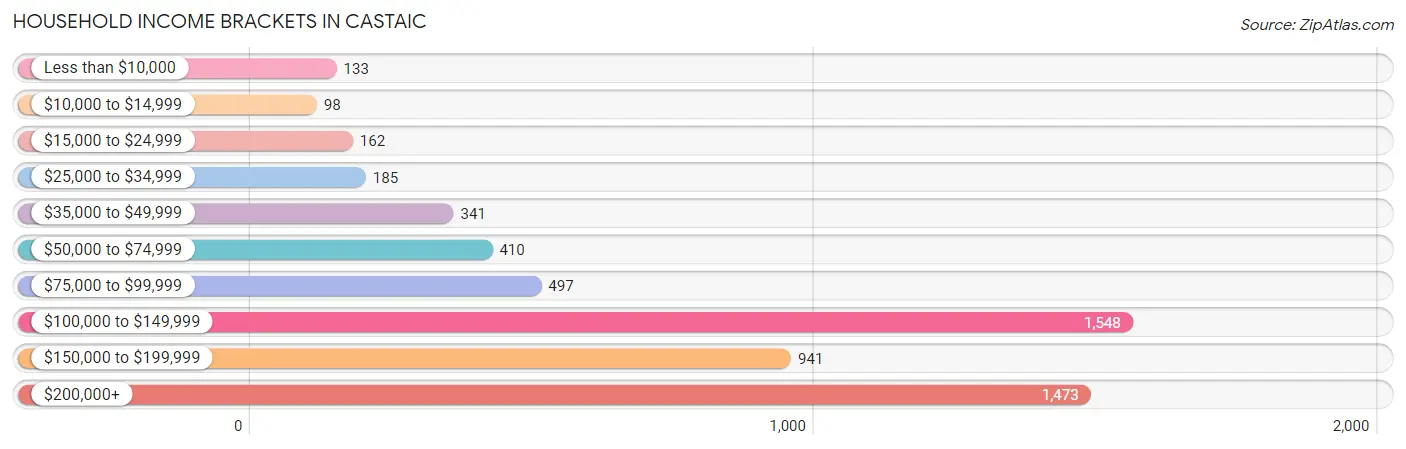
| Income Bracket | # Households | % Households |
| Less than $10,000 | 133 | 2.3% |
| $10,000 to $14,999 | 98 | 1.7% |
| $15,000 to $24,999 | 162 | 2.8% |
| $25,000 to $34,999 | 185 | 3.2% |
| $35,000 to $49,999 | 341 | 5.9% |
| $50,000 to $74,999 | 410 | 7.1% |
| $75,000 to $99,999 | 497 | 8.6% |
| $100,000 to $149,999 | 1,548 | 26.8% |
| $150,000 to $199,999 | 941 | 16.3% |
| $200,000+ | 1,473 | 25.5% |
Household Income by Householder Age in Castaic
The median household income in Castaic is $132,429, with the highest median household income of $151,750 found in the 45 to 64 years age bracket for the primary householder. A total of 2,744 households (47.5%) fall into this category. Meanwhile, the 15 to 24 years age bracket for the primary householder has the lowest median household income of $0, with 14 households (0.2%) in this group.
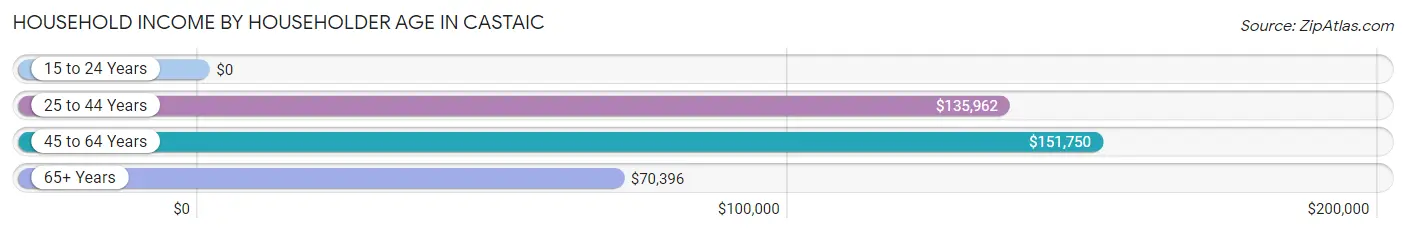
| Income Bracket | # Households | Median Income |
| 15 to 24 Years | 14 (0.2%) | $0 |
| 25 to 44 Years | 1,934 (33.5%) | $135,962 |
| 45 to 64 Years | 2,744 (47.5%) | $151,750 |
| 65+ Years | 1,083 (18.8%) | $70,396 |
| Total | 5,775 (100.0%) | $132,429 |
Poverty in Castaic
Income Below Poverty by Sex and Age in Castaic
With 4.3% poverty level for males and 3.1% for females among the residents of Castaic, 15 year old males and 65 to 74 year old females are the most vulnerable to poverty, with 49 males (26.1%) and 49 females (7.1%) in their respective age groups living below the poverty level.
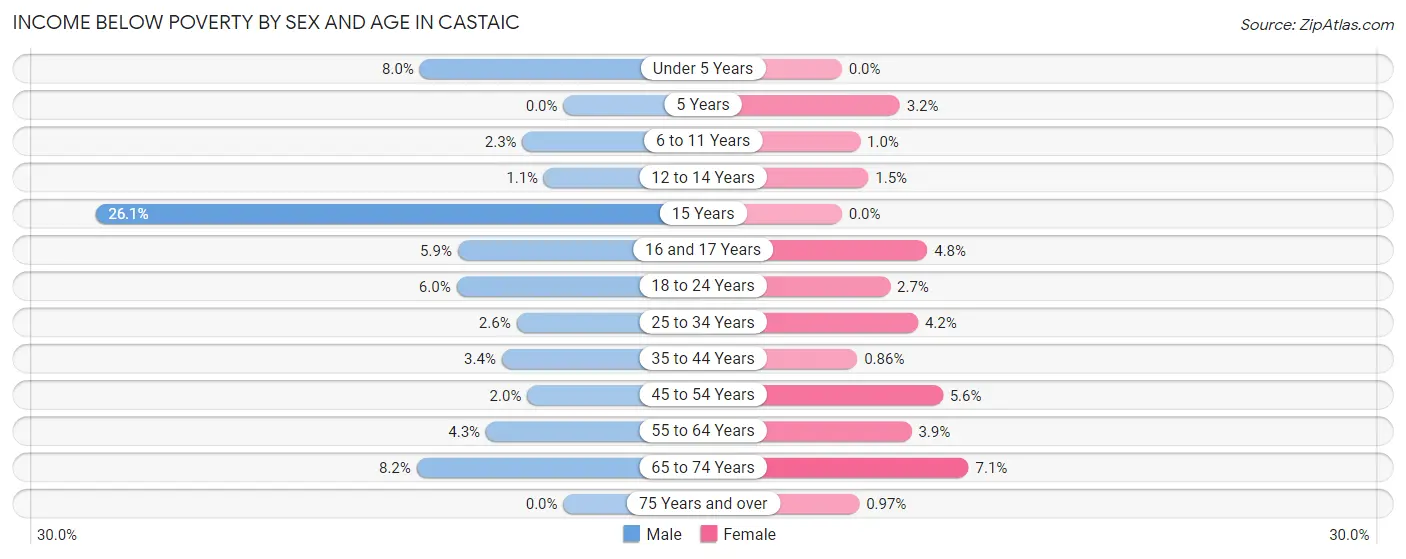
| Age Bracket | Male | Female |
| Under 5 Years | 65 (8.0%) | 0 (0.0%) |
| 5 Years | 0 (0.0%) | 4 (3.2%) |
| 6 to 11 Years | 19 (2.3%) | 8 (1.0%) |
| 12 to 14 Years | 4 (1.1%) | 9 (1.5%) |
| 15 Years | 49 (26.1%) | 0 (0.0%) |
| 16 and 17 Years | 15 (5.9%) | 11 (4.8%) |
| 18 to 24 Years | 41 (5.9%) | 15 (2.7%) |
| 25 to 34 Years | 30 (2.6%) | 56 (4.2%) |
| 35 to 44 Years | 44 (3.4%) | 11 (0.9%) |
| 45 to 54 Years | 27 (2.0%) | 78 (5.6%) |
| 55 to 64 Years | 58 (4.3%) | 48 (3.9%) |
| 65 to 74 Years | 50 (8.2%) | 49 (7.1%) |
| 75 Years and over | 0 (0.0%) | 4 (1.0%) |
| Total | 402 (4.3%) | 293 (3.1%) |
Income Above Poverty by Sex and Age in Castaic
According to the poverty statistics in Castaic, males aged 5 years and females aged under 5 years are the age groups that are most secure financially, with 100.0% of males and 100.0% of females in these age groups living above the poverty line.
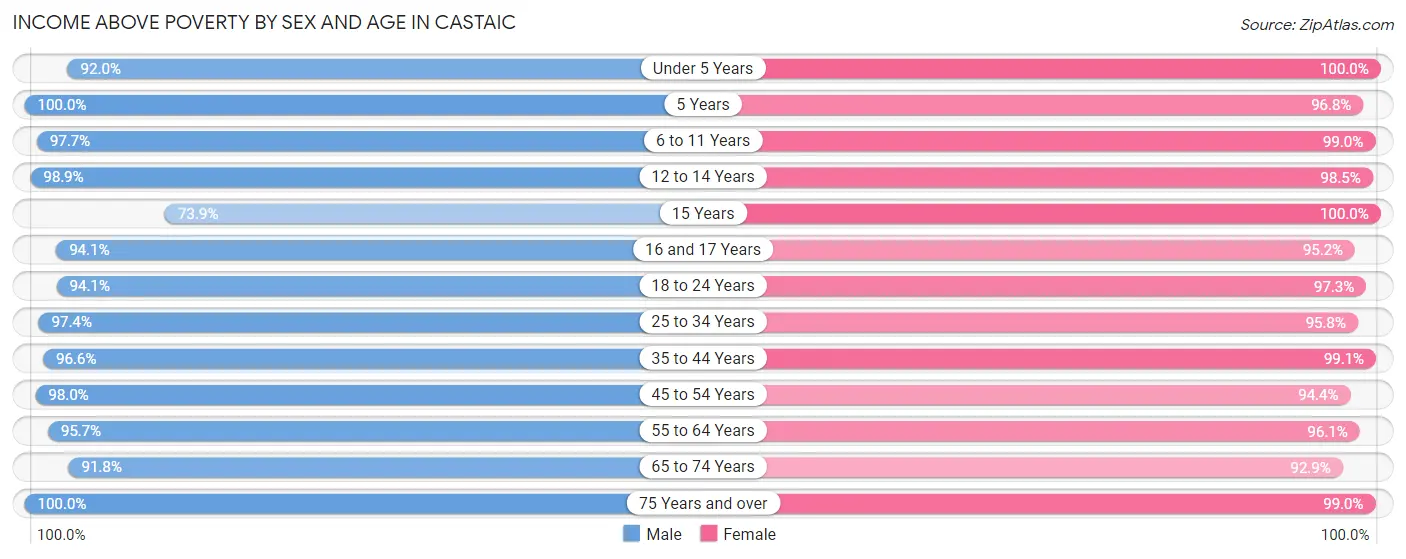
| Age Bracket | Male | Female |
| Under 5 Years | 748 (92.0%) | 516 (100.0%) |
| 5 Years | 80 (100.0%) | 120 (96.8%) |
| 6 to 11 Years | 816 (97.7%) | 775 (99.0%) |
| 12 to 14 Years | 365 (98.9%) | 598 (98.5%) |
| 15 Years | 139 (73.9%) | 215 (100.0%) |
| 16 and 17 Years | 240 (94.1%) | 220 (95.2%) |
| 18 to 24 Years | 648 (94.1%) | 543 (97.3%) |
| 25 to 34 Years | 1,118 (97.4%) | 1,266 (95.8%) |
| 35 to 44 Years | 1,239 (96.6%) | 1,266 (99.1%) |
| 45 to 54 Years | 1,317 (98.0%) | 1,311 (94.4%) |
| 55 to 64 Years | 1,288 (95.7%) | 1,189 (96.1%) |
| 65 to 74 Years | 562 (91.8%) | 645 (92.9%) |
| 75 Years and over | 273 (100.0%) | 409 (99.0%) |
| Total | 8,833 (95.7%) | 9,073 (96.9%) |
Income Below Poverty Among Married-Couple Families in Castaic
The poverty statistics for married-couple families in Castaic show that 4.3% or 171 of the total 4,006 families live below the poverty line. Families with 5 or more children have the highest poverty rate of 100.0%, comprising of 3 families. On the other hand, families with 3 or 4 children have the lowest poverty rate of 0.0%, which includes 0 families.
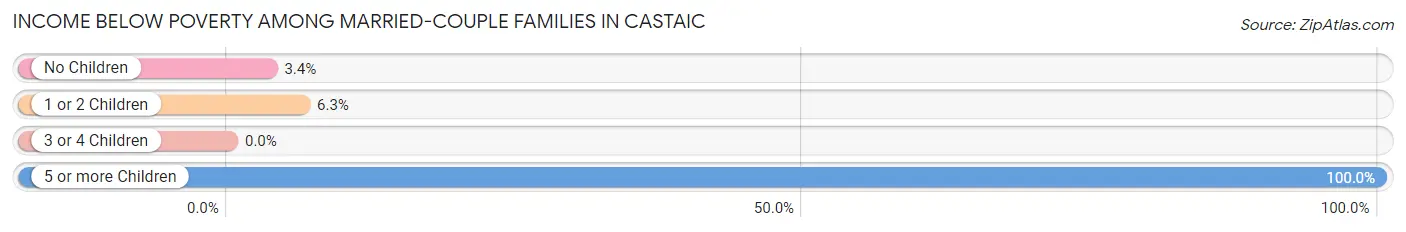
| Children | Above Poverty | Below Poverty |
| No Children | 1,857 (96.6%) | 66 (3.4%) |
| 1 or 2 Children | 1,525 (93.7%) | 102 (6.3%) |
| 3 or 4 Children | 453 (100.0%) | 0 (0.0%) |
| 5 or more Children | 0 (0.0%) | 3 (100.0%) |
| Total | 3,835 (95.7%) | 171 (4.3%) |
Income Below Poverty Among Single-Parent Households in Castaic
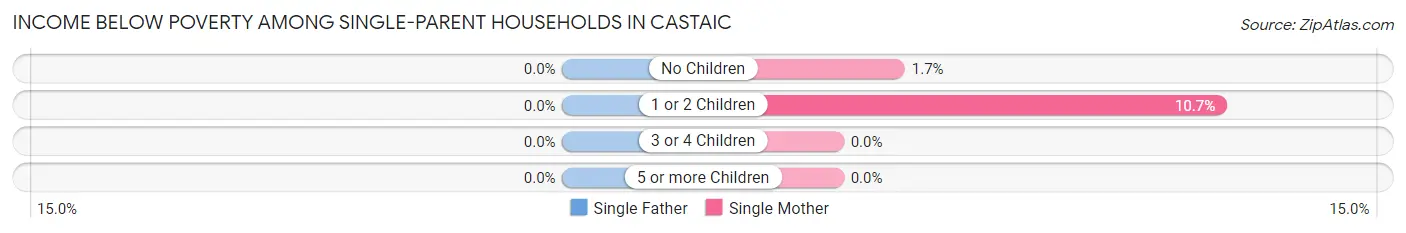
| Children | Single Father | Single Mother |
| No Children | 0 (0.0%) | 6 (1.7%) |
| 1 or 2 Children | 0 (0.0%) | 15 (10.7%) |
| 3 or 4 Children | 0 (0.0%) | 0 (0.0%) |
| 5 or more Children | 0 (0.0%) | 0 (0.0%) |
| Total | 0 (0.0%) | 21 (3.9%) |
Income Below Poverty Among Married-Couple vs Single-Parent Households in Castaic
The poverty data for Castaic shows that 171 of the married-couple family households (4.3%) and 21 of the single-parent households (2.5%) are living below the poverty level. Within the married-couple family households, those with 5 or more children have the highest poverty rate, with 3 households (100.0%) falling below the poverty line. Among the single-parent households, those with 1 or 2 children have the highest poverty rate, with 15 household (4.9%) living below poverty.
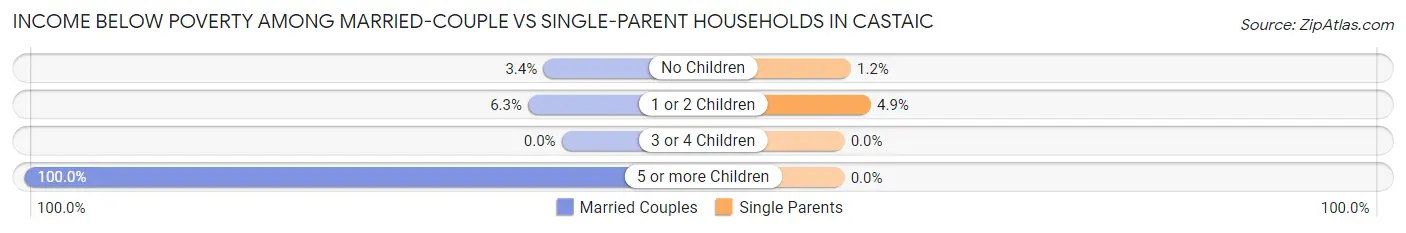
| Children | Married-Couple Families | Single-Parent Households |
| No Children | 66 (3.4%) | 6 (1.2%) |
| 1 or 2 Children | 102 (6.3%) | 15 (4.9%) |
| 3 or 4 Children | 0 (0.0%) | 0 (0.0%) |
| 5 or more Children | 3 (100.0%) | 0 (0.0%) |
| Total | 171 (4.3%) | 21 (2.5%) |
Race in Castaic
The most populous races in Castaic are White / Caucasian (11,189 | 60.0%), Hispanic or Latino (6,457 | 34.6%), and Two or more Races (2,827 | 15.2%).
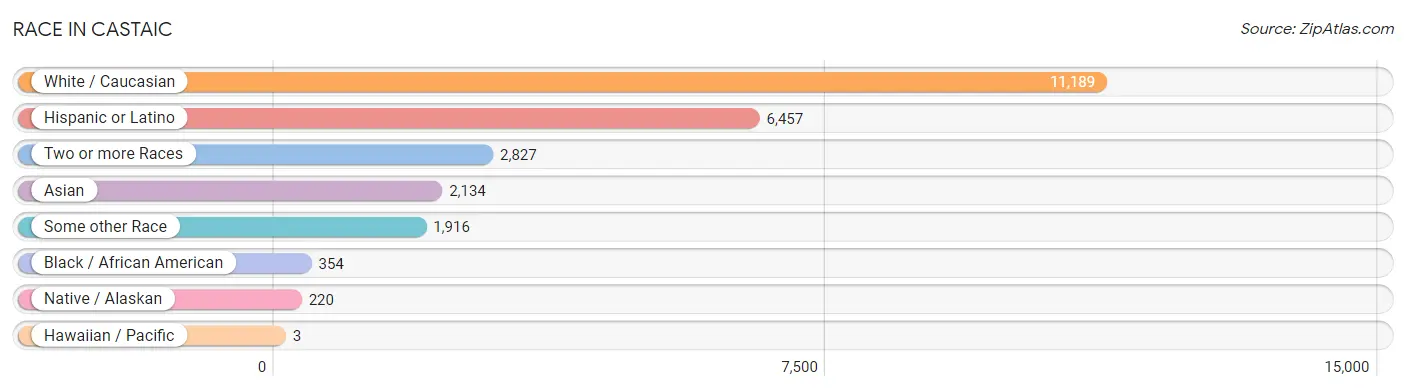
| Race | # Population | % Population |
| Asian | 2,134 | 11.5% |
| Black / African American | 354 | 1.9% |
| Hawaiian / Pacific | 3 | 0.0% |
| Hispanic or Latino | 6,457 | 34.6% |
| Native / Alaskan | 220 | 1.2% |
| White / Caucasian | 11,189 | 60.0% |
| Two or more Races | 2,827 | 15.2% |
| Some other Race | 1,916 | 10.3% |
| Total | 18,643 | 100.0% |
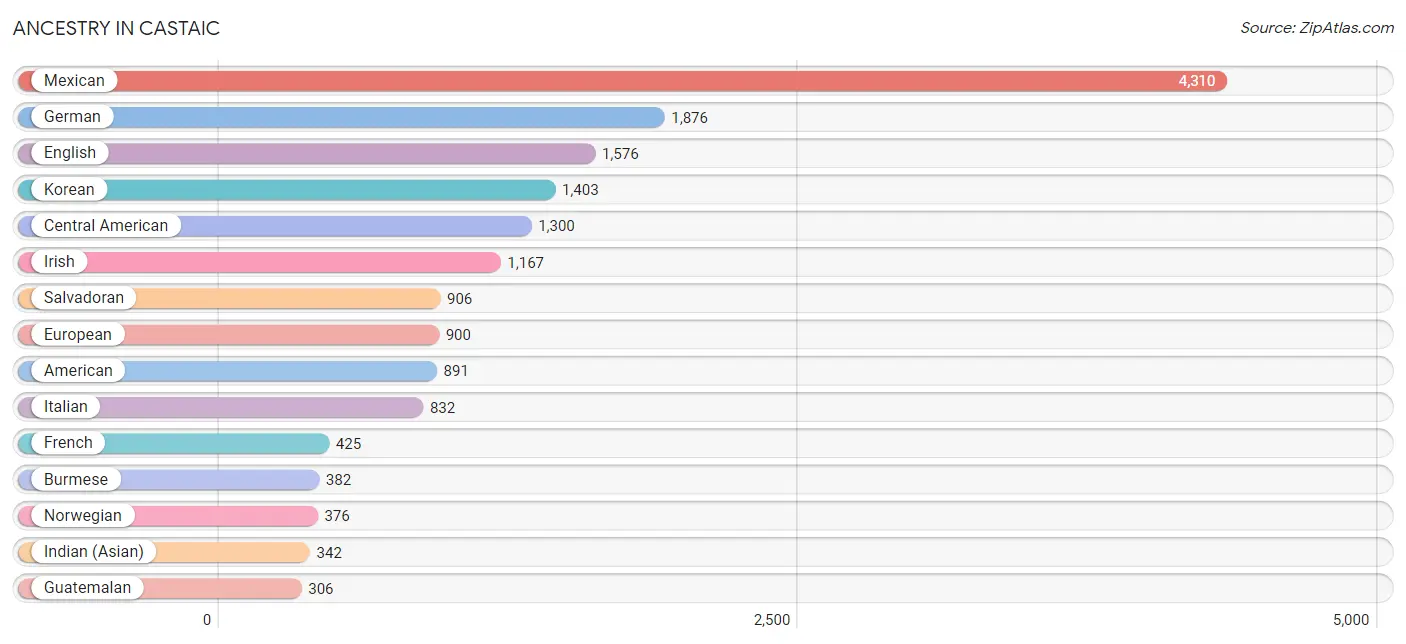
Ancestry in Castaic
The most populous ancestries reported in Castaic are Mexican (4,310 | 23.1%), German (1,876 | 10.1%), English (1,576 | 8.5%), Korean (1,403 | 7.5%), and Central American (1,300 | 7.0%), together accounting for 56.1% of all Castaic residents.
| Ancestry | # Population | % Population |
| African | 51 | 0.3% |
| Albanian | 15 | 0.1% |
| Aleut | 32 | 0.2% |
| American | 891 | 4.8% |
| Arab | 115 | 0.6% |
| Argentinean | 59 | 0.3% |
| Armenian | 215 | 1.1% |
| Assyrian / Chaldean / Syriac | 28 | 0.2% |
| Austrian | 29 | 0.2% |
| Basque | 47 | 0.3% |
| Belgian | 8 | 0.0% |
| Belizean | 21 | 0.1% |
| Bhutanese | 64 | 0.3% |
| Brazilian | 118 | 0.6% |
| British | 142 | 0.8% |
| Bulgarian | 16 | 0.1% |
| Burmese | 382 | 2.1% |
| Canadian | 94 | 0.5% |
| Central American | 1,300 | 7.0% |
| Cherokee | 141 | 0.8% |
| Chilean | 10 | 0.1% |
| Choctaw | 23 | 0.1% |
| Colombian | 53 | 0.3% |
| Costa Rican | 43 | 0.2% |
| Creek | 24 | 0.1% |
| Croatian | 41 | 0.2% |
| Cuban | 184 | 1.0% |
| Cypriot | 10 | 0.1% |
| Czech | 82 | 0.4% |
| Danish | 139 | 0.7% |
| Dominican | 4 | 0.0% |
| Dutch | 81 | 0.4% |
| Eastern European | 79 | 0.4% |
| Egyptian | 73 | 0.4% |
| English | 1,576 | 8.5% |
| European | 900 | 4.8% |
| Filipino | 7 | 0.0% |
| Finnish | 79 | 0.4% |
| French | 425 | 2.3% |
| French Canadian | 183 | 1.0% |
| German | 1,876 | 10.1% |
| Greek | 92 | 0.5% |
| Guatemalan | 306 | 1.6% |
| Honduran | 23 | 0.1% |
| Hungarian | 182 | 1.0% |
| Indian (Asian) | 342 | 1.8% |
| Iranian | 64 | 0.3% |
| Irish | 1,167 | 6.3% |
| Israeli | 10 | 0.1% |
| Italian | 832 | 4.5% |
| Japanese | 9 | 0.1% |
| Korean | 1,403 | 7.5% |
| Laotian | 7 | 0.0% |
| Latvian | 28 | 0.2% |
| Lebanese | 26 | 0.1% |
| Lithuanian | 7 | 0.0% |
| Luxembourger | 4 | 0.0% |
| Mexican | 4,310 | 23.1% |
| Mexican American Indian | 142 | 0.8% |
| Native Hawaiian | 31 | 0.2% |
| Nicaraguan | 22 | 0.1% |
| Nigerian | 18 | 0.1% |
| Northern European | 79 | 0.4% |
| Norwegian | 376 | 2.0% |
| Pakistani | 82 | 0.4% |
| Peruvian | 141 | 0.8% |
| Polish | 282 | 1.5% |
| Portuguese | 100 | 0.5% |
| Pueblo | 19 | 0.1% |
| Puerto Rican | 119 | 0.6% |
| Romanian | 13 | 0.1% |
| Russian | 227 | 1.2% |
| Salvadoran | 906 | 4.9% |
| Scandinavian | 115 | 0.6% |
| Scotch-Irish | 177 | 0.9% |
| Scottish | 269 | 1.4% |
| Serbian | 63 | 0.3% |
| Sioux | 28 | 0.2% |
| Slovak | 14 | 0.1% |
| Somali | 3 | 0.0% |
| South American | 263 | 1.4% |
| Spaniard | 79 | 0.4% |
| Spanish | 168 | 0.9% |
| Spanish American Indian | 54 | 0.3% |
| Sri Lankan | 146 | 0.8% |
| Subsaharan African | 80 | 0.4% |
| Swedish | 156 | 0.8% |
| Swiss | 3 | 0.0% |
| Thai | 121 | 0.6% |
| Turkish | 3 | 0.0% |
| Ukrainian | 218 | 1.2% |
| Welsh | 31 | 0.2% |
| West Indian | 55 | 0.3% |
| Yaqui | 56 | 0.3% | View All 94 Rows |
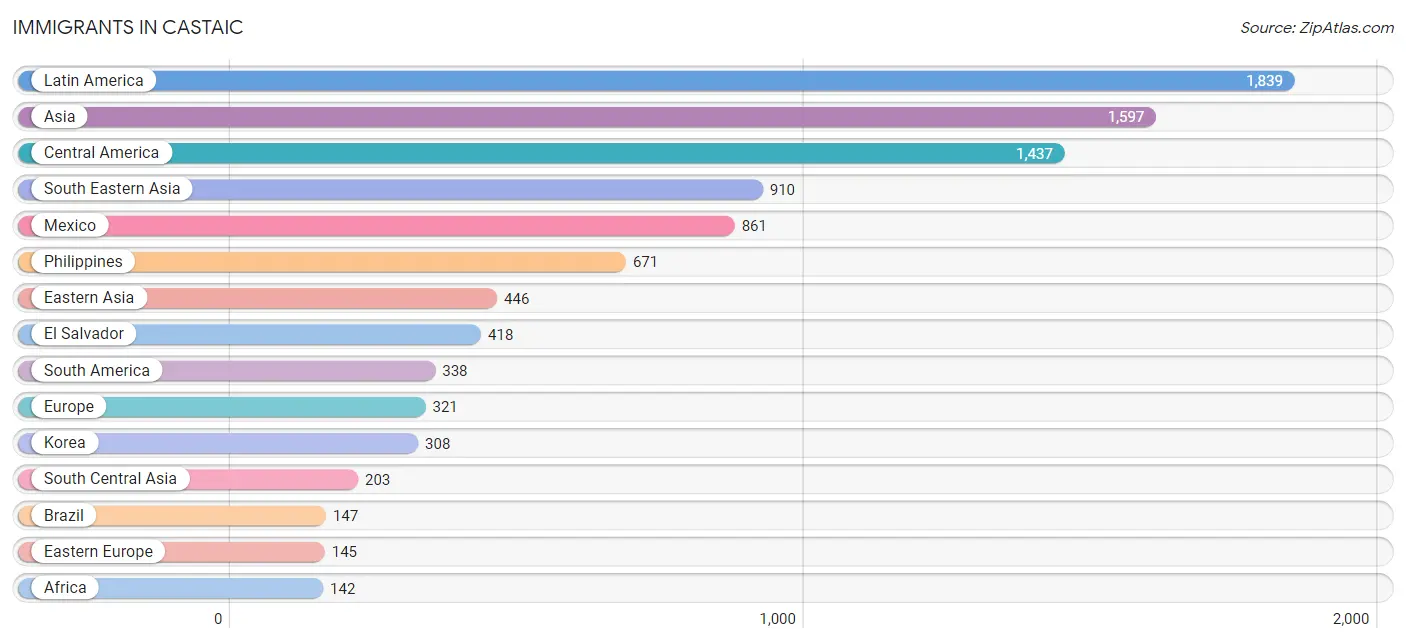
Immigrants in Castaic
The most numerous immigrant groups reported in Castaic came from Latin America (1,839 | 9.9%), Asia (1,597 | 8.6%), Central America (1,437 | 7.7%), South Eastern Asia (910 | 4.9%), and Mexico (861 | 4.6%), together accounting for 35.6% of all Castaic residents.
| Immigration Origin | # Population | % Population |
| Africa | 142 | 0.8% |
| Argentina | 59 | 0.3% |
| Armenia | 25 | 0.1% |
| Asia | 1,597 | 8.6% |
| Austria | 8 | 0.0% |
| Belarus | 39 | 0.2% |
| Belize | 10 | 0.1% |
| Brazil | 147 | 0.8% |
| Canada | 28 | 0.2% |
| Caribbean | 64 | 0.3% |
| Central America | 1,437 | 7.7% |
| China | 138 | 0.7% |
| Colombia | 33 | 0.2% |
| Costa Rica | 32 | 0.2% |
| Cuba | 54 | 0.3% |
| Dominican Republic | 10 | 0.1% |
| Eastern Asia | 446 | 2.4% |
| Eastern Europe | 145 | 0.8% |
| Ecuador | 30 | 0.2% |
| Egypt | 99 | 0.5% |
| El Salvador | 418 | 2.2% |
| England | 77 | 0.4% |
| Europe | 321 | 1.7% |
| Fiji | 8 | 0.0% |
| France | 15 | 0.1% |
| Germany | 7 | 0.0% |
| Ghana | 6 | 0.0% |
| Guatemala | 108 | 0.6% |
| Honduras | 8 | 0.0% |
| Hong Kong | 27 | 0.1% |
| India | 81 | 0.4% |
| Indonesia | 141 | 0.8% |
| Iran | 89 | 0.5% |
| Iraq | 10 | 0.1% |
| Ireland | 8 | 0.0% |
| Italy | 12 | 0.1% |
| Kazakhstan | 15 | 0.1% |
| Korea | 308 | 1.7% |
| Latin America | 1,839 | 9.9% |
| Mexico | 861 | 4.6% |
| Middle Africa | 8 | 0.0% |
| Nigeria | 18 | 0.1% |
| Northern Africa | 99 | 0.5% |
| Northern Europe | 126 | 0.7% |
| Oceania | 8 | 0.0% |
| Peru | 69 | 0.4% |
| Philippines | 671 | 3.6% |
| Poland | 6 | 0.0% |
| Russia | 11 | 0.1% |
| South Africa | 11 | 0.1% |
| South America | 338 | 1.8% |
| South Central Asia | 203 | 1.1% |
| South Eastern Asia | 910 | 4.9% |
| Southern Europe | 20 | 0.1% |
| Spain | 8 | 0.0% |
| Sri Lanka | 18 | 0.1% |
| Taiwan | 35 | 0.2% |
| Thailand | 33 | 0.2% |
| Turkey | 3 | 0.0% |
| Ukraine | 89 | 0.5% |
| Vietnam | 65 | 0.4% |
| Western Africa | 24 | 0.1% |
| Western Asia | 38 | 0.2% |
| Western Europe | 30 | 0.2% |
| Zaire | 8 | 0.0% | View All 65 Rows |
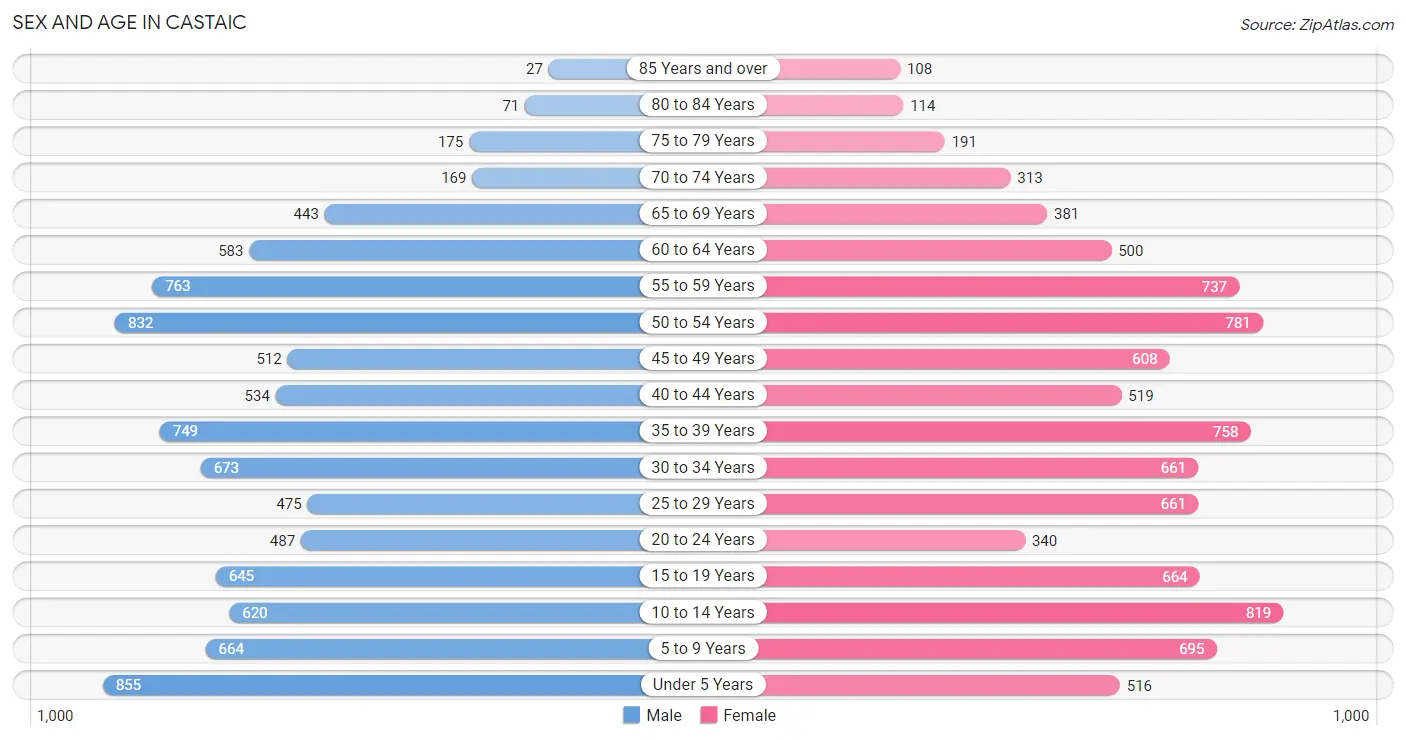
Sex and Age in Castaic
Sex and Age in Castaic
The most populous age groups in Castaic are Under 5 Years (855 | 9.2%) for men and 10 to 14 Years (819 | 8.7%) for women.
| Age Bracket | Male | Female |
| Under 5 Years | 855 (9.2%) | 516 (5.5%) |
| 5 to 9 Years | 664 (7.2%) | 695 (7.4%) |
| 10 to 14 Years | 620 (6.7%) | 819 (8.7%) |
| 15 to 19 Years | 645 (7.0%) | 664 (7.1%) |
| 20 to 24 Years | 487 (5.2%) | 340 (3.6%) |
| 25 to 29 Years | 475 (5.1%) | 661 (7.1%) |
| 30 to 34 Years | 673 (7.2%) | 661 (7.1%) |
| 35 to 39 Years | 749 (8.1%) | 758 (8.1%) |
| 40 to 44 Years | 534 (5.8%) | 519 (5.5%) |
| 45 to 49 Years | 512 (5.5%) | 608 (6.5%) |
| 50 to 54 Years | 832 (9.0%) | 781 (8.3%) |
| 55 to 59 Years | 763 (8.2%) | 737 (7.9%) |
| 60 to 64 Years | 583 (6.3%) | 500 (5.3%) |
| 65 to 69 Years | 443 (4.8%) | 381 (4.1%) |
| 70 to 74 Years | 169 (1.8%) | 313 (3.3%) |
| 75 to 79 Years | 175 (1.9%) | 191 (2.0%) |
| 80 to 84 Years | 71 (0.8%) | 114 (1.2%) |
| 85 Years and over | 27 (0.3%) | 108 (1.1%) |
| Total | 9,277 (100.0%) | 9,366 (100.0%) |
Families and Households in Castaic
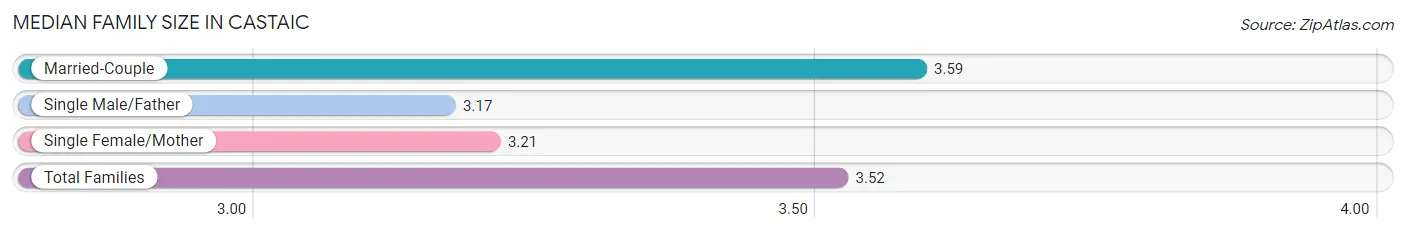
Median Family Size in Castaic
The median family size in Castaic is 3.52 persons per family, with married-couple families (4,006 | 82.5%) accounting for the largest median family size of 3.59 persons per family. On the other hand, single male/father families (312 | 6.4%) represent the smallest median family size with 3.17 persons per family.
| Family Type | # Families | Family Size |
| Married-Couple | 4,006 (82.5%) | 3.59 |
| Single Male/Father | 312 (6.4%) | 3.17 |
| Single Female/Mother | 540 (11.1%) | 3.21 |
| Total Families | 4,858 (100.0%) | 3.52 |
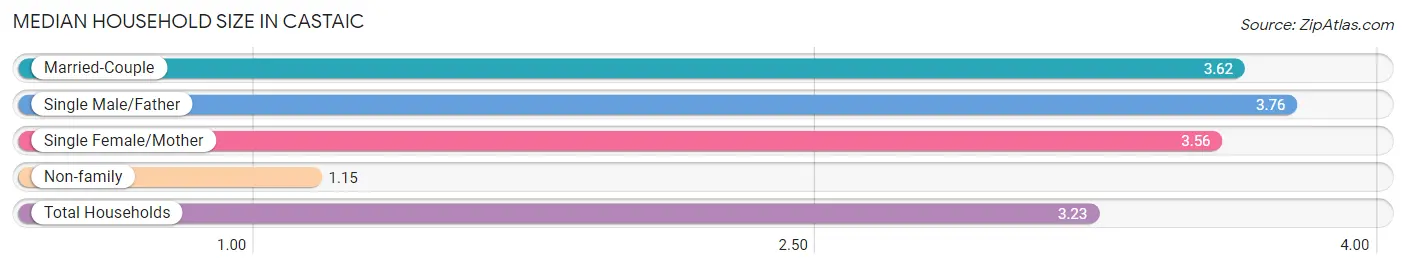
Median Household Size in Castaic
The median household size in Castaic is 3.23 persons per household, with single male/father households (312 | 5.4%) accounting for the largest median household size of 3.76 persons per household. non-family households (917 | 15.9%) represent the smallest median household size with 1.15 persons per household.
| Household Type | # Households | Household Size |
| Married-Couple | 4,006 (69.4%) | 3.62 |
| Single Male/Father | 312 (5.4%) | 3.76 |
| Single Female/Mother | 540 (9.3%) | 3.56 |
| Non-family | 917 (15.9%) | 1.15 |
| Total Households | 5,775 (100.0%) | 3.23 |
Household Size by Marriage Status in Castaic
Out of a total of 5,775 households in Castaic, 4,858 (84.1%) are family households, while 917 (15.9%) are nonfamily households. The most numerous type of family households are 2-person households, comprising 1,418, and the most common type of nonfamily households are 1-person households, comprising 778.
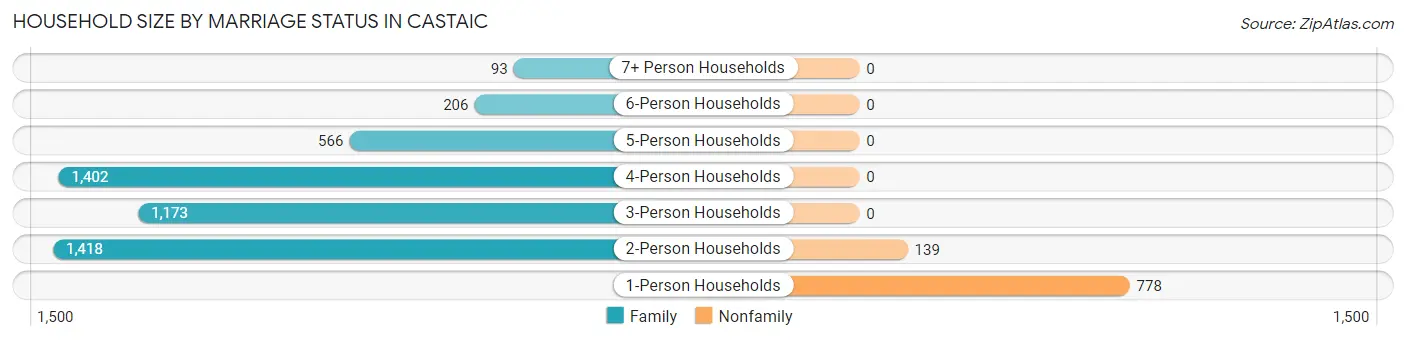
| Household Size | Family Households | Nonfamily Households |
| 1-Person Households | - | 778 (13.5%) |
| 2-Person Households | 1,418 (24.5%) | 139 (2.4%) |
| 3-Person Households | 1,173 (20.3%) | 0 (0.0%) |
| 4-Person Households | 1,402 (24.3%) | 0 (0.0%) |
| 5-Person Households | 566 (9.8%) | 0 (0.0%) |
| 6-Person Households | 206 (3.6%) | 0 (0.0%) |
| 7+ Person Households | 93 (1.6%) | 0 (0.0%) |
| Total | 4,858 (84.1%) | 917 (15.9%) |
Female Fertility in Castaic
Fertility by Age in Castaic
Average fertility rate in Castaic is 85.0 births per 1,000 women. Women in the age bracket of 20 to 34 years have the highest fertility rate with 118.0 births per 1,000 women. Women in the age bracket of 20 to 34 years acount for 53.4% of all women with births.
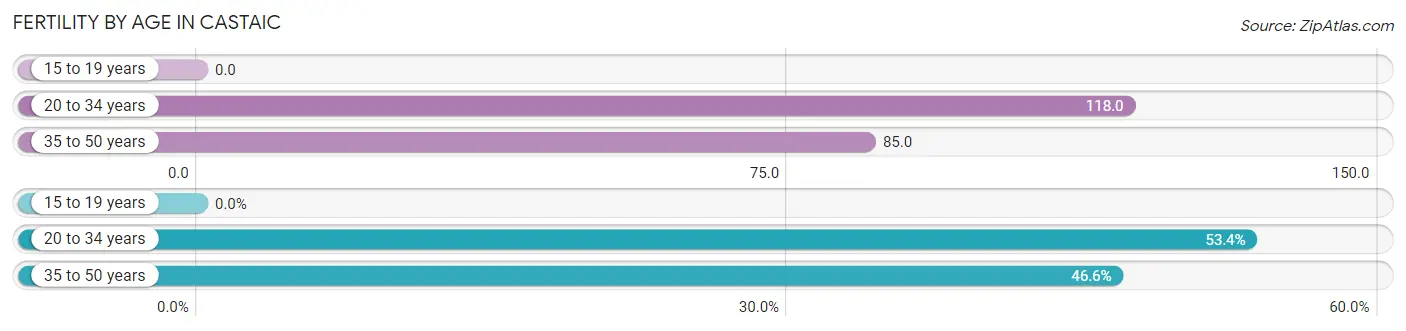
| Age Bracket | Women with Births | Births / 1,000 Women |
| 15 to 19 years | 0 (0.0%) | 0.0 |
| 20 to 34 years | 196 (53.4%) | 118.0 |
| 35 to 50 years | 171 (46.6%) | 85.0 |
| Total | 367 (100.0%) | 85.0 |
Fertility by Age by Marriage Status in Castaic
76.3% of women with births (367) in Castaic are married. The highest percentage of unmarried women with births falls into 35 to 50 years age bracket with 32.2% of them unmarried at the time of birth, while the lowest percentage of unmarried women with births belong to 20 to 34 years age bracket with 16.3% of them unmarried.
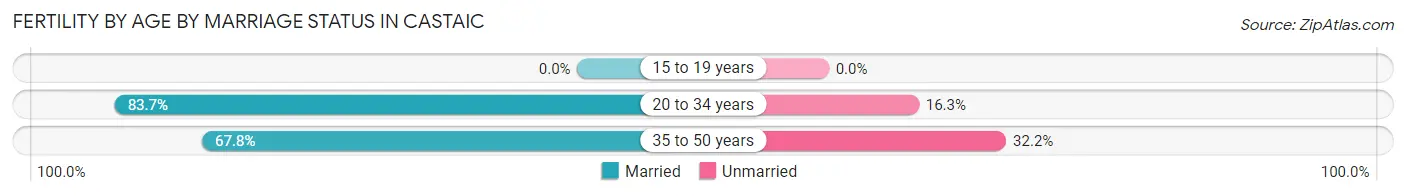
| Age Bracket | Married | Unmarried |
| 15 to 19 years | 0 (0.0%) | 0 (0.0%) |
| 20 to 34 years | 164 (83.7%) | 32 (16.3%) |
| 35 to 50 years | 116 (67.8%) | 55 (32.2%) |
| Total | 280 (76.3%) | 87 (23.7%) |
Fertility by Education in Castaic
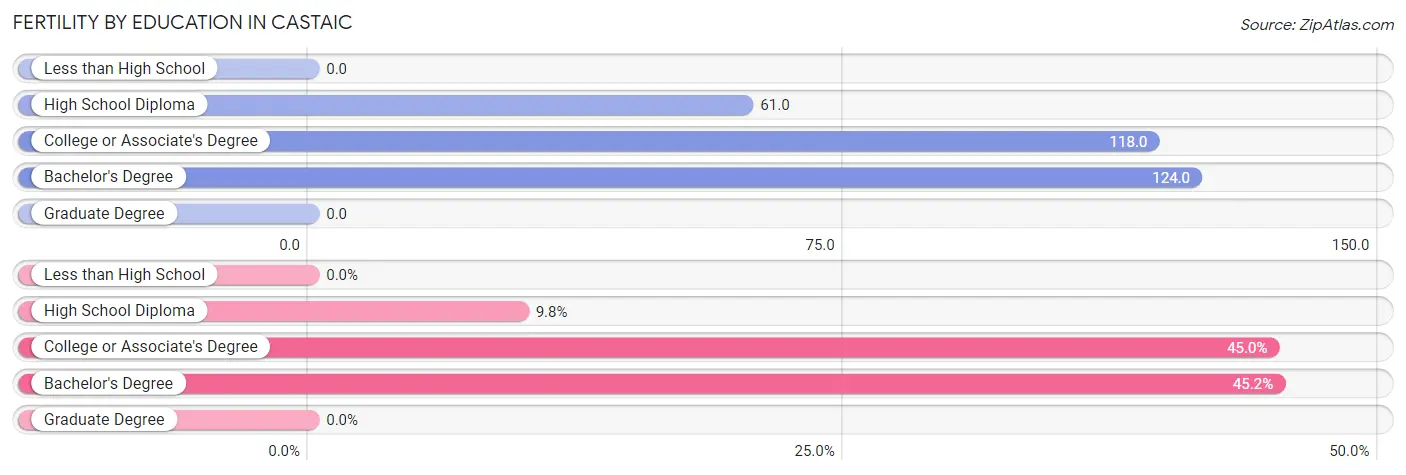
| Educational Attainment | Women with Births | Births / 1,000 Women |
| Less than High School | 0 (0.0%) | 0.0 |
| High School Diploma | 36 (9.8%) | 61.0 |
| College or Associate's Degree | 165 (45.0%) | 118.0 |
| Bachelor's Degree | 166 (45.2%) | 124.0 |
| Graduate Degree | 0 (0.0%) | 0.0 |
| Total | 367 (100.0%) | 85.0 |
Fertility by Education by Marriage Status in Castaic
23.7% of women with births in Castaic are unmarried. Women with the educational attainment of bachelor's degree are most likely to be married with 100.0% of them married at childbirth, while women with the educational attainment of high school diploma are least likely to be married with 100.0% of them unmarried at childbirth.
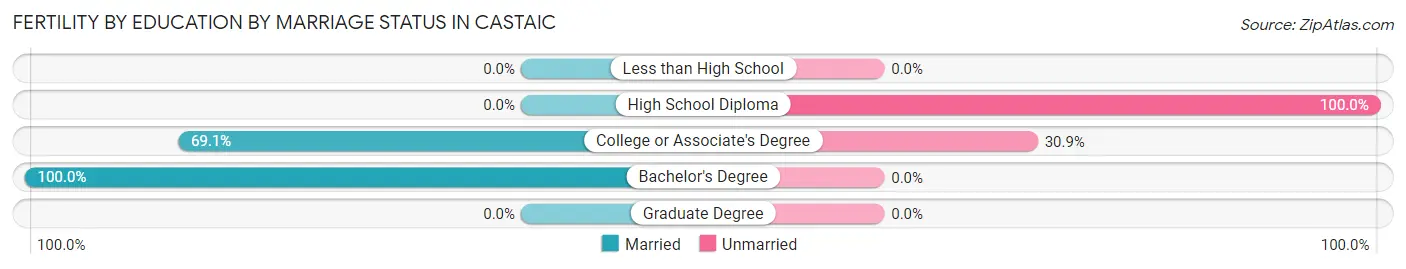
| Educational Attainment | Married | Unmarried |
| Less than High School | 0 (0.0%) | 0 (0.0%) |
| High School Diploma | 0 (0.0%) | 36 (100.0%) |
| College or Associate's Degree | 114 (69.1%) | 51 (30.9%) |
| Bachelor's Degree | 166 (100.0%) | 0 (0.0%) |
| Graduate Degree | 0 (0.0%) | 0 (0.0%) |
| Total | 280 (76.3%) | 87 (23.7%) |
Employment Characteristics in Castaic
Employment by Class of Employer in Castaic
Among the 8,899 employed individuals in Castaic, private company employees (5,325 | 59.8%), local government employees (1,392 | 15.6%), and not-for-profit organizations (750 | 8.4%) make up the most common classes of employment.
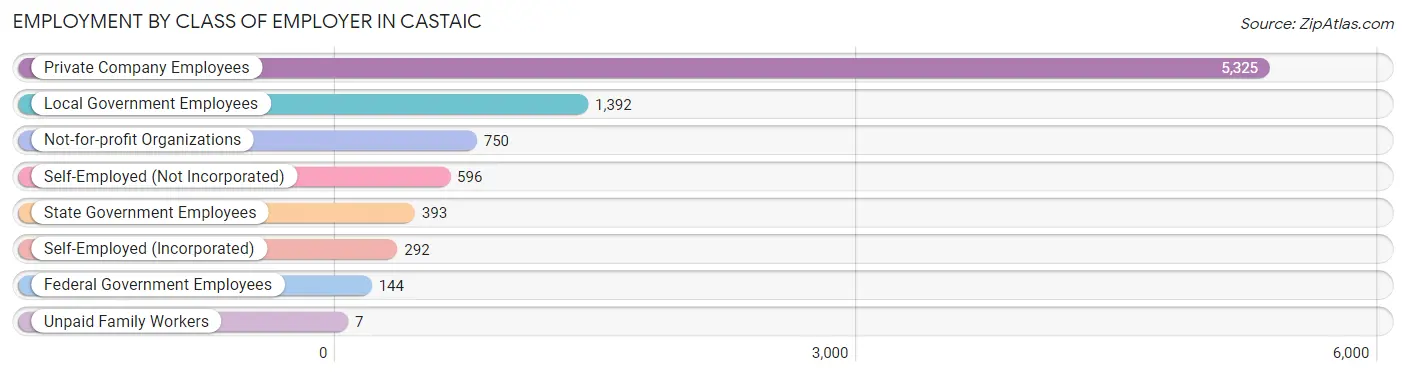
| Employer Class | # Employees | % Employees |
| Private Company Employees | 5,325 | 59.8% |
| Self-Employed (Incorporated) | 292 | 3.3% |
| Self-Employed (Not Incorporated) | 596 | 6.7% |
| Not-for-profit Organizations | 750 | 8.4% |
| Local Government Employees | 1,392 | 15.6% |
| State Government Employees | 393 | 4.4% |
| Federal Government Employees | 144 | 1.6% |
| Unpaid Family Workers | 7 | 0.1% |
| Total | 8,899 | 100.0% |
Employment Status by Age in Castaic
According to the labor force statistics for Castaic, out of the total population over 16 years of age (14,071), 68.8% or 9,681 individuals are in the labor force, with 5.4% or 523 of them unemployed. The age group with the highest labor force participation rate is 35 to 44 years, with 91.4% or 2,340 individuals in the labor force. Within the labor force, the 16 to 19 years age range has the highest percentage of unemployed individuals, with 21.1% or 66 of them being unemployed.
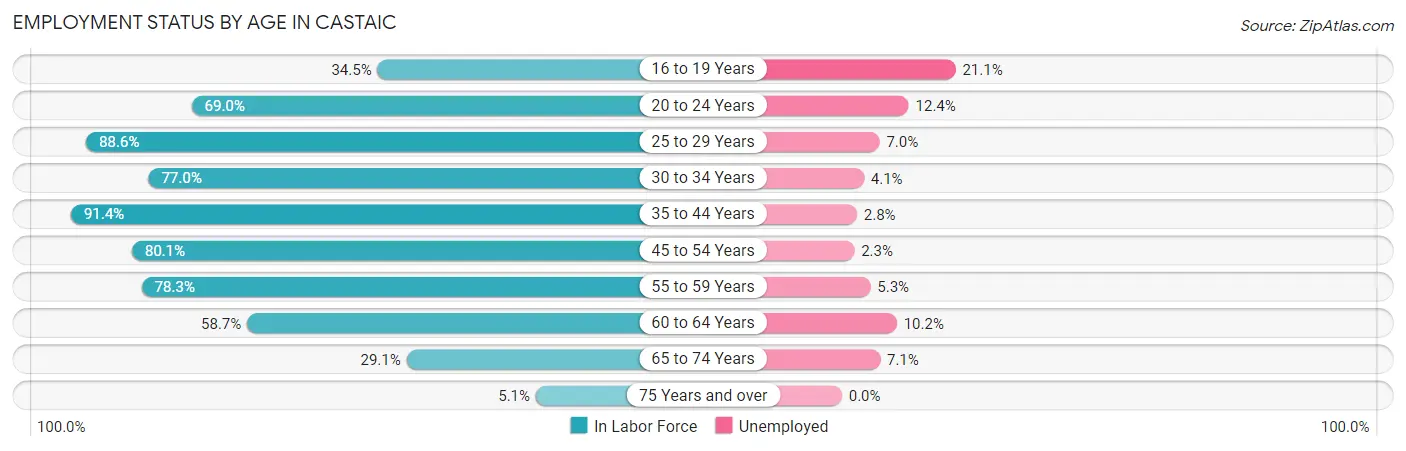
| Age Bracket | In Labor Force | Unemployed |
| 16 to 19 Years | 313 (34.5%) | 66 (21.1%) |
| 20 to 24 Years | 571 (69.0%) | 71 (12.4%) |
| 25 to 29 Years | 1,006 (88.6%) | 70 (7.0%) |
| 30 to 34 Years | 1,027 (77.0%) | 42 (4.1%) |
| 35 to 44 Years | 2,340 (91.4%) | 66 (2.8%) |
| 45 to 54 Years | 2,189 (80.1%) | 50 (2.3%) |
| 55 to 59 Years | 1,174 (78.3%) | 62 (5.3%) |
| 60 to 64 Years | 636 (58.7%) | 65 (10.2%) |
| 65 to 74 Years | 380 (29.1%) | 27 (7.1%) |
| 75 Years and over | 35 (5.1%) | 0 (0.0%) |
| Total | 9,681 (68.8%) | 523 (5.4%) |
Employment Status by Educational Attainment in Castaic
According to labor force statistics for Castaic, 80.9% of individuals (8,370) out of the total population between 25 and 64 years of age (10,346) are in the labor force, with 4.2% or 352 of them being unemployed. The group with the highest labor force participation rate are those with the educational attainment of bachelor's degree or higher, with 84.9% or 3,751 individuals in the labor force. Within the labor force, individuals with high school diploma education have the highest percentage of unemployment, with 6.0% or 78 of them being unemployed.
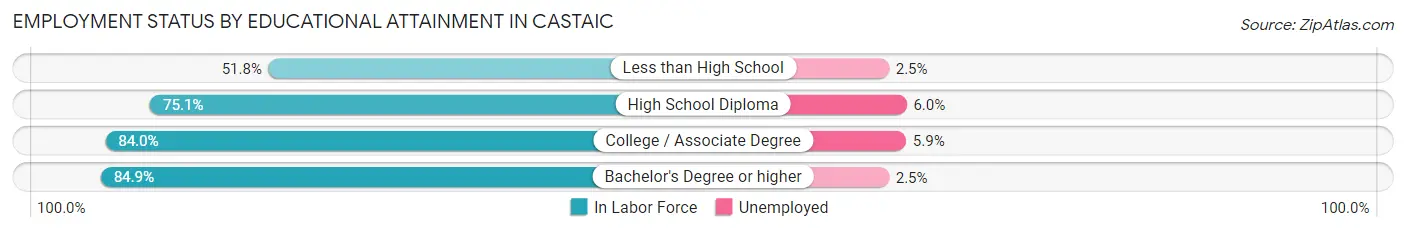
| Educational Attainment | In Labor Force | Unemployed |
| Less than High School | 326 (51.8%) | 16 (2.5%) |
| High School Diploma | 1,292 (75.1%) | 103 (6.0%) |
| College / Associate Degree | 3,006 (84.0%) | 211 (5.9%) |
| Bachelor's Degree or higher | 3,751 (84.9%) | 110 (2.5%) |
| Total | 8,370 (80.9%) | 435 (4.2%) |
Employment Occupations by Sex in Castaic
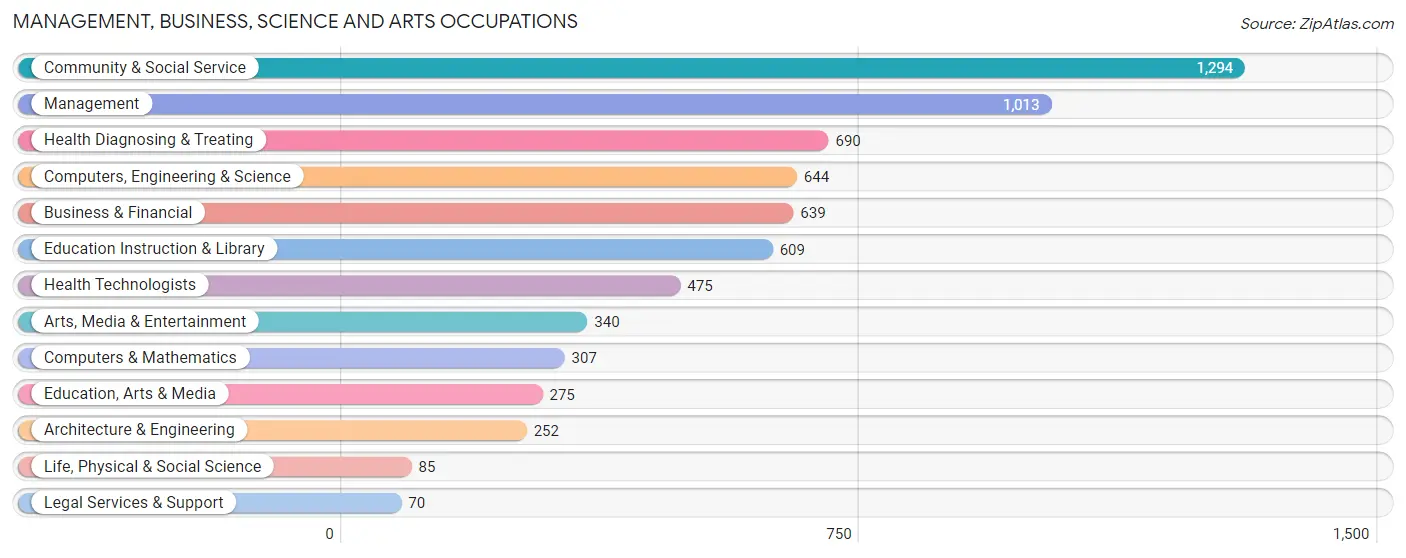
Management, Business, Science and Arts Occupations
The most common Management, Business, Science and Arts occupations in Castaic are Community & Social Service (1,294 | 14.2%), Management (1,013 | 11.1%), Health Diagnosing & Treating (690 | 7.5%), Computers, Engineering & Science (644 | 7.0%), and Business & Financial (639 | 7.0%).
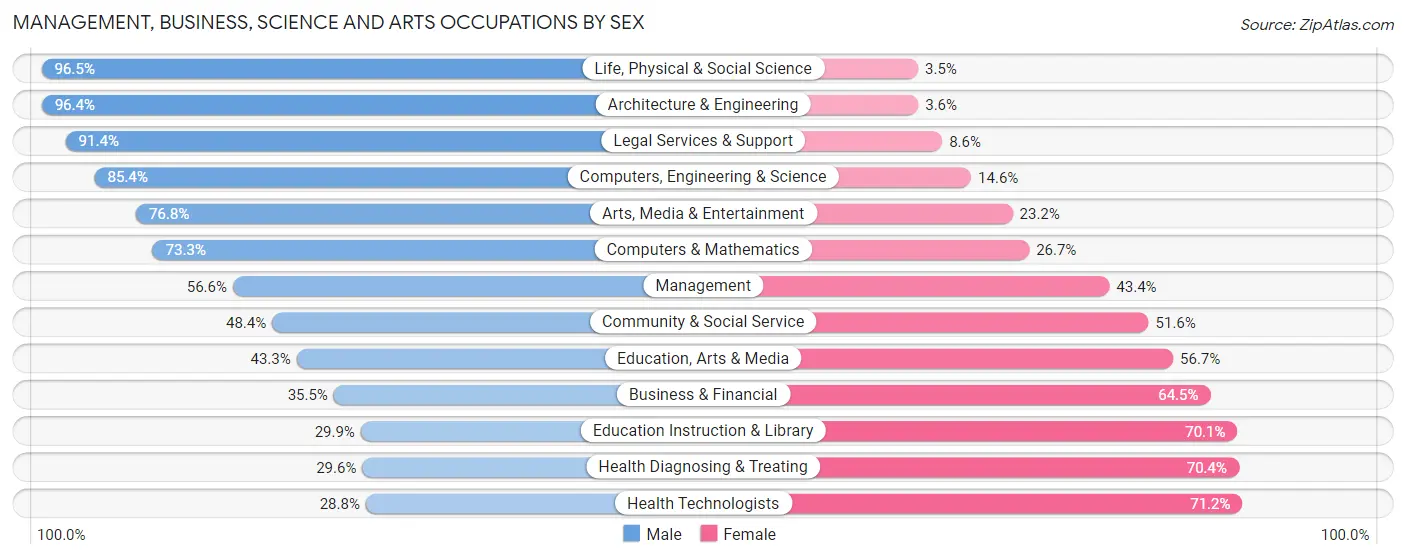
Management, Business, Science and Arts Occupations by Sex
Within the Management, Business, Science and Arts occupations in Castaic, the most male-oriented occupations are Life, Physical & Social Science (96.5%), Architecture & Engineering (96.4%), and Legal Services & Support (91.4%), while the most female-oriented occupations are Health Technologists (71.2%), Health Diagnosing & Treating (70.4%), and Education Instruction & Library (70.1%).
| Occupation | Male | Female |
| Management | 573 (56.6%) | 440 (43.4%) |
| Business & Financial | 227 (35.5%) | 412 (64.5%) |
| Computers, Engineering & Science | 550 (85.4%) | 94 (14.6%) |
| Computers & Mathematics | 225 (73.3%) | 82 (26.7%) |
| Architecture & Engineering | 243 (96.4%) | 9 (3.6%) |
| Life, Physical & Social Science | 82 (96.5%) | 3 (3.5%) |
| Community & Social Service | 626 (48.4%) | 668 (51.6%) |
| Education, Arts & Media | 119 (43.3%) | 156 (56.7%) |
| Legal Services & Support | 64 (91.4%) | 6 (8.6%) |
| Education Instruction & Library | 182 (29.9%) | 427 (70.1%) |
| Arts, Media & Entertainment | 261 (76.8%) | 79 (23.2%) |
| Health Diagnosing & Treating | 204 (29.6%) | 486 (70.4%) |
| Health Technologists | 137 (28.8%) | 338 (71.2%) |
| Total (Category) | 2,180 (50.9%) | 2,100 (49.1%) |
| Total (Overall) | 4,999 (54.7%) | 4,139 (45.3%) |
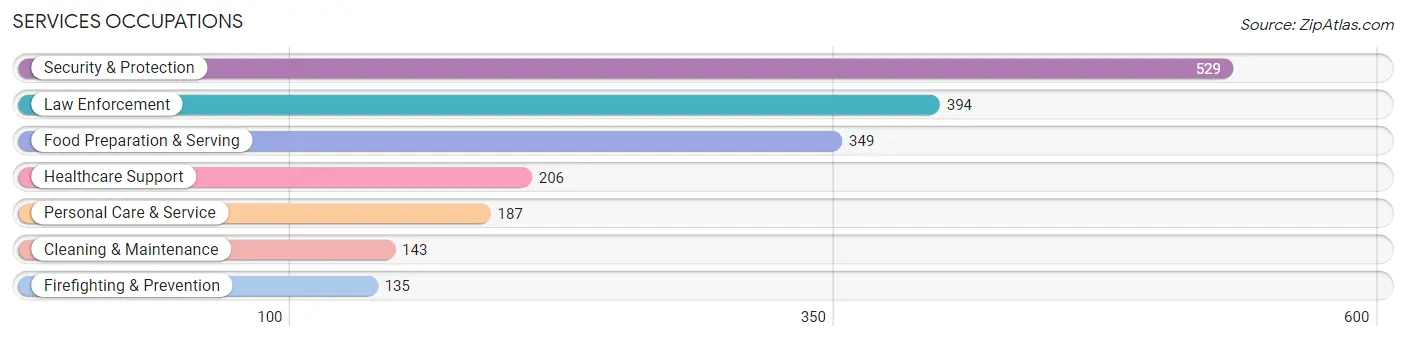
Services Occupations
The most common Services occupations in Castaic are Security & Protection (529 | 5.8%), Law Enforcement (394 | 4.3%), Food Preparation & Serving (349 | 3.8%), Healthcare Support (206 | 2.2%), and Personal Care & Service (187 | 2.1%).
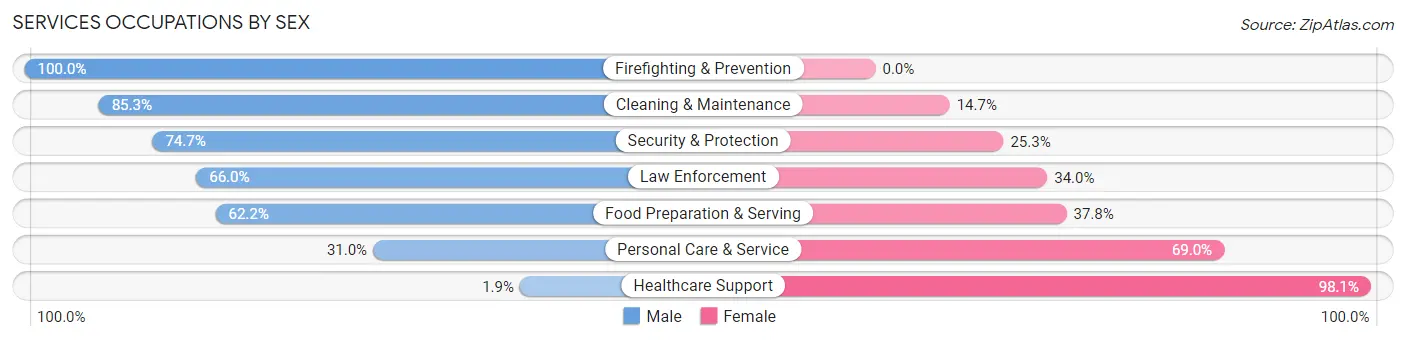
Services Occupations by Sex
Within the Services occupations in Castaic, the most male-oriented occupations are Firefighting & Prevention (100.0%), Cleaning & Maintenance (85.3%), and Security & Protection (74.7%), while the most female-oriented occupations are Healthcare Support (98.1%), Personal Care & Service (69.0%), and Food Preparation & Serving (37.8%).
| Occupation | Male | Female |
| Healthcare Support | 4 (1.9%) | 202 (98.1%) |
| Security & Protection | 395 (74.7%) | 134 (25.3%) |
| Firefighting & Prevention | 135 (100.0%) | 0 (0.0%) |
| Law Enforcement | 260 (66.0%) | 134 (34.0%) |
| Food Preparation & Serving | 217 (62.2%) | 132 (37.8%) |
| Cleaning & Maintenance | 122 (85.3%) | 21 (14.7%) |
| Personal Care & Service | 58 (31.0%) | 129 (69.0%) |
| Total (Category) | 796 (56.3%) | 618 (43.7%) |
| Total (Overall) | 4,999 (54.7%) | 4,139 (45.3%) |
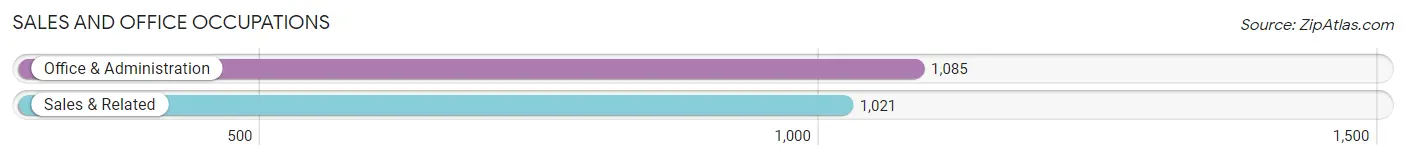
Sales and Office Occupations
The most common Sales and Office occupations in Castaic are Office & Administration (1,085 | 11.9%), and Sales & Related (1,021 | 11.2%).
Sales and Office Occupations by Sex
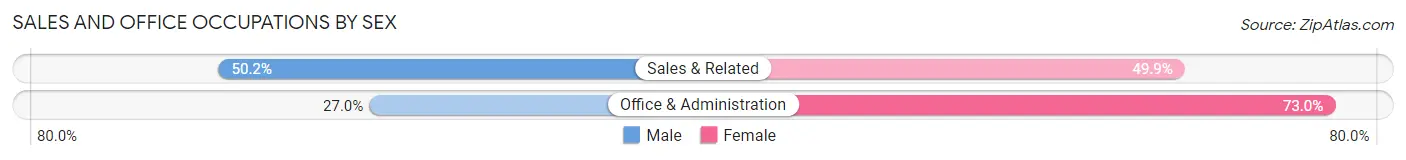
| Occupation | Male | Female |
| Sales & Related | 512 (50.1%) | 509 (49.8%) |
| Office & Administration | 293 (27.0%) | 792 (73.0%) |
| Total (Category) | 805 (38.2%) | 1,301 (61.8%) |
| Total (Overall) | 4,999 (54.7%) | 4,139 (45.3%) |
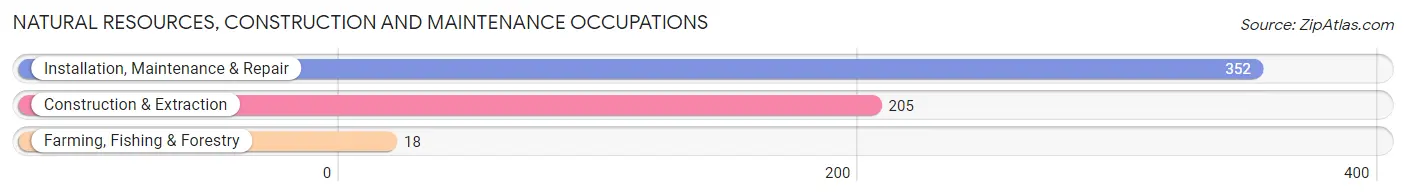
Natural Resources, Construction and Maintenance Occupations
The most common Natural Resources, Construction and Maintenance occupations in Castaic are Installation, Maintenance & Repair (352 | 3.8%), Construction & Extraction (205 | 2.2%), and Farming, Fishing & Forestry (18 | 0.2%).
Natural Resources, Construction and Maintenance Occupations by Sex
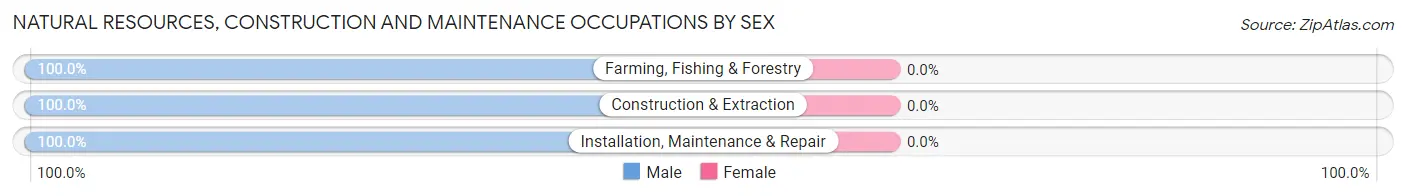
| Occupation | Male | Female |
| Farming, Fishing & Forestry | 18 (100.0%) | 0 (0.0%) |
| Construction & Extraction | 205 (100.0%) | 0 (0.0%) |
| Installation, Maintenance & Repair | 352 (100.0%) | 0 (0.0%) |
| Total (Category) | 575 (100.0%) | 0 (0.0%) |
| Total (Overall) | 4,999 (54.7%) | 4,139 (45.3%) |
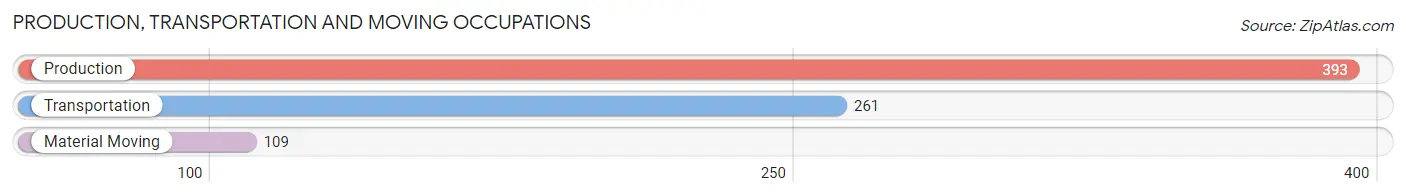
Production, Transportation and Moving Occupations
The most common Production, Transportation and Moving occupations in Castaic are Production (393 | 4.3%), Transportation (261 | 2.9%), and Material Moving (109 | 1.2%).
Production, Transportation and Moving Occupations by Sex
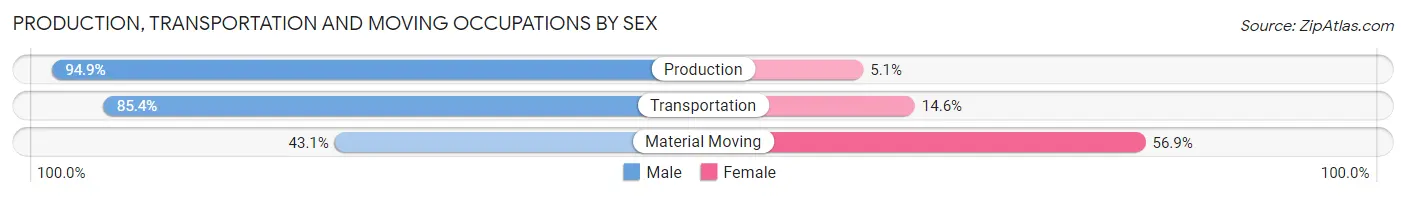
| Occupation | Male | Female |
| Production | 373 (94.9%) | 20 (5.1%) |
| Transportation | 223 (85.4%) | 38 (14.6%) |
| Material Moving | 47 (43.1%) | 62 (56.9%) |
| Total (Category) | 643 (84.3%) | 120 (15.7%) |
| Total (Overall) | 4,999 (54.7%) | 4,139 (45.3%) |
Employment Industries by Sex in Castaic
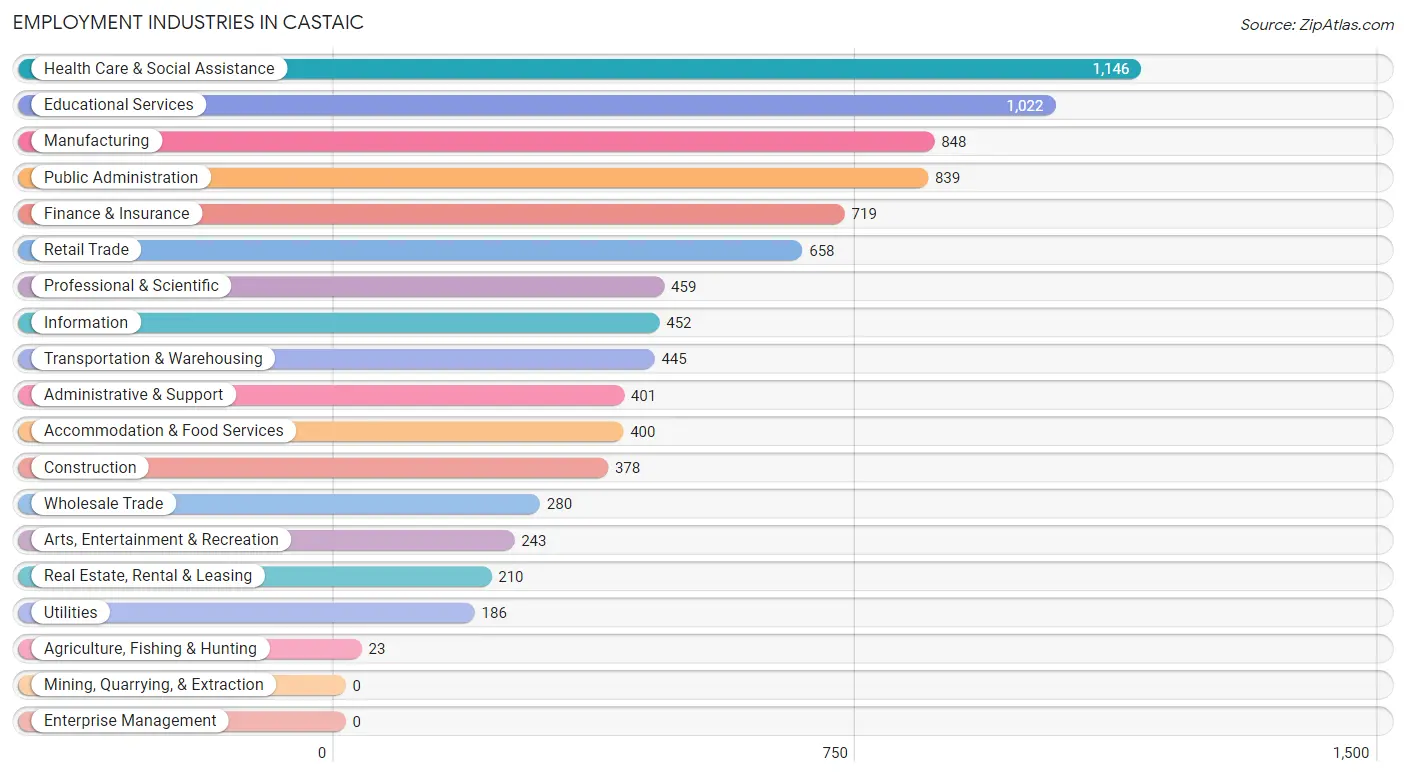
Employment Industries in Castaic
The major employment industries in Castaic include Health Care & Social Assistance (1,146 | 12.5%), Educational Services (1,022 | 11.2%), Manufacturing (848 | 9.3%), Public Administration (839 | 9.2%), and Finance & Insurance (719 | 7.9%).
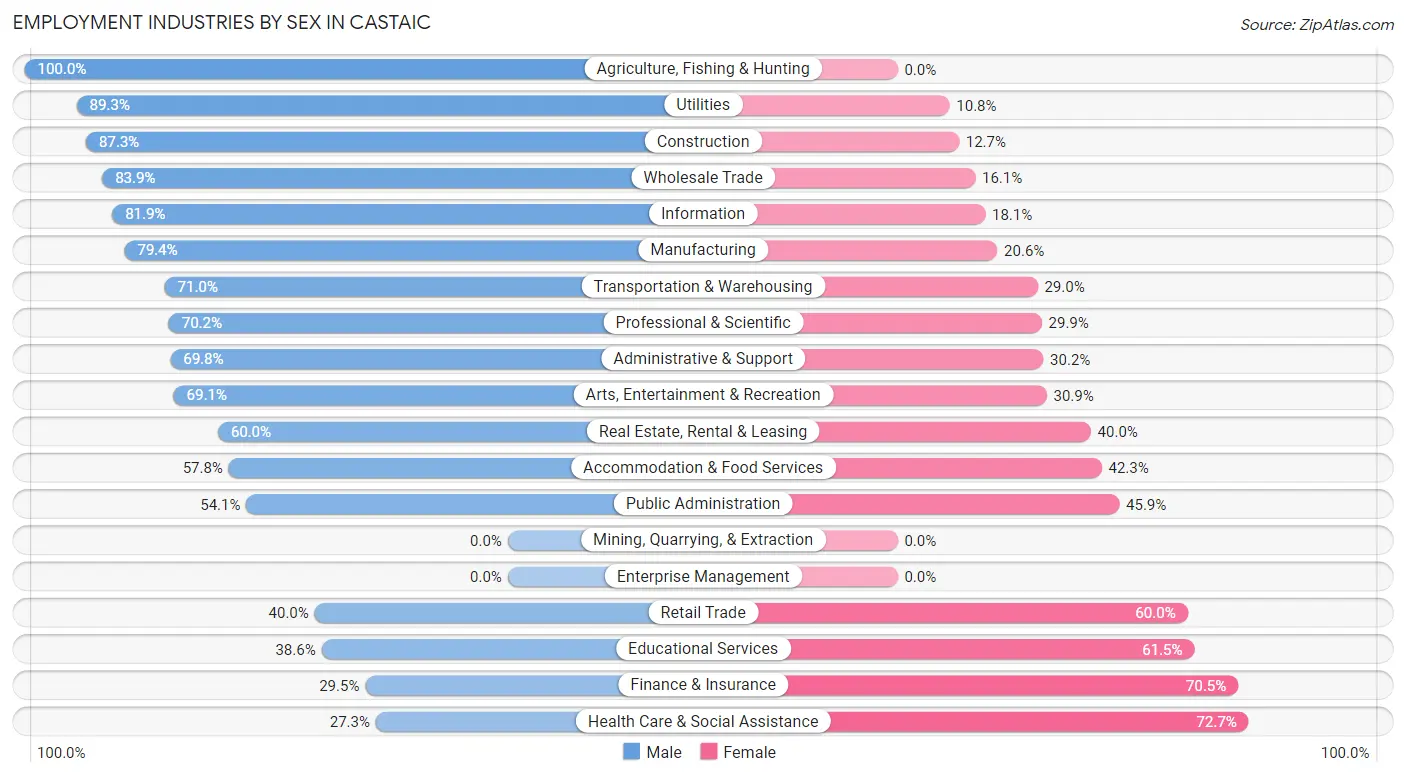
Employment Industries by Sex in Castaic
The Castaic industries that see more men than women are Agriculture, Fishing & Hunting (100.0%), Utilities (89.2%), and Construction (87.3%), whereas the industries that tend to have a higher number of women are Health Care & Social Assistance (72.7%), Finance & Insurance (70.5%), and Educational Services (61.5%).
| Industry | Male | Female |
| Agriculture, Fishing & Hunting | 23 (100.0%) | 0 (0.0%) |
| Mining, Quarrying, & Extraction | 0 (0.0%) | 0 (0.0%) |
| Construction | 330 (87.3%) | 48 (12.7%) |
| Manufacturing | 673 (79.4%) | 175 (20.6%) |
| Wholesale Trade | 235 (83.9%) | 45 (16.1%) |
| Retail Trade | 263 (40.0%) | 395 (60.0%) |
| Transportation & Warehousing | 316 (71.0%) | 129 (29.0%) |
| Utilities | 166 (89.2%) | 20 (10.7%) |
| Information | 370 (81.9%) | 82 (18.1%) |
| Finance & Insurance | 212 (29.5%) | 507 (70.5%) |
| Real Estate, Rental & Leasing | 126 (60.0%) | 84 (40.0%) |
| Professional & Scientific | 322 (70.2%) | 137 (29.8%) |
| Enterprise Management | 0 (0.0%) | 0 (0.0%) |
| Administrative & Support | 280 (69.8%) | 121 (30.2%) |
| Educational Services | 394 (38.6%) | 628 (61.5%) |
| Health Care & Social Assistance | 313 (27.3%) | 833 (72.7%) |
| Arts, Entertainment & Recreation | 168 (69.1%) | 75 (30.9%) |
| Accommodation & Food Services | 231 (57.8%) | 169 (42.2%) |
| Public Administration | 454 (54.1%) | 385 (45.9%) |
| Total | 4,999 (54.7%) | 4,139 (45.3%) |
Education in Castaic
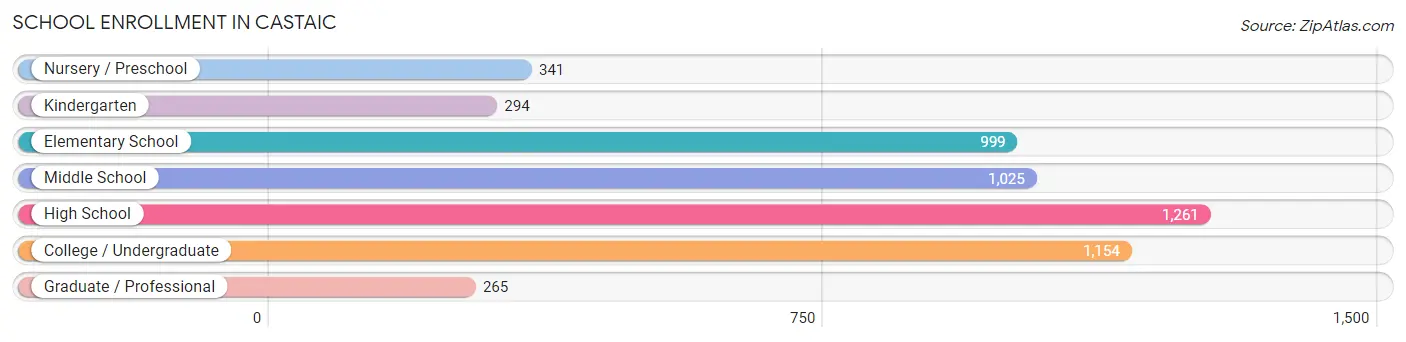
School Enrollment in Castaic
The most common levels of schooling among the 5,339 students in Castaic are high school (1,261 | 23.6%), college / undergraduate (1,154 | 21.6%), and middle school (1,025 | 19.2%).
| School Level | # Students | % Students |
| Nursery / Preschool | 341 | 6.4% |
| Kindergarten | 294 | 5.5% |
| Elementary School | 999 | 18.7% |
| Middle School | 1,025 | 19.2% |
| High School | 1,261 | 23.6% |
| College / Undergraduate | 1,154 | 21.6% |
| Graduate / Professional | 265 | 5.0% |
| Total | 5,339 | 100.0% |
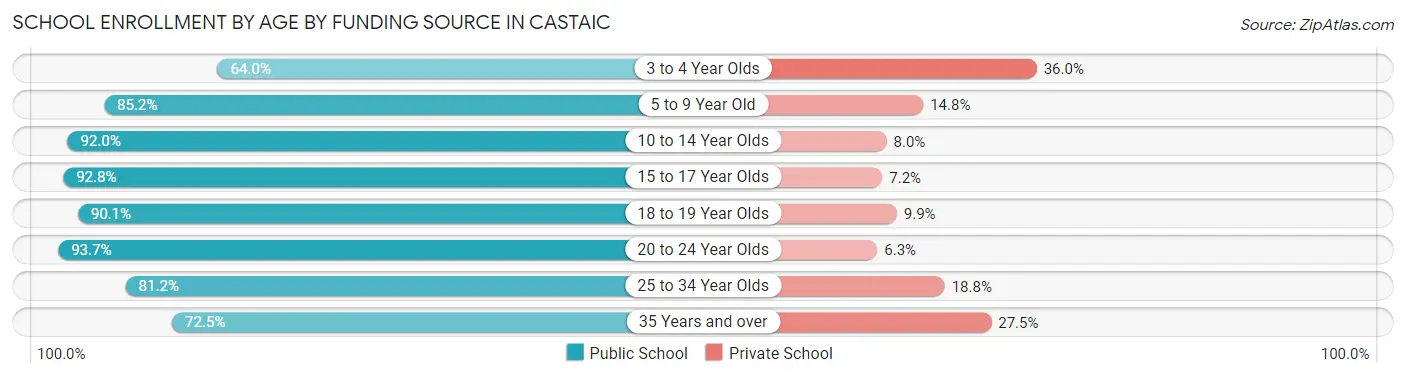
School Enrollment by Age by Funding Source in Castaic
Out of a total of 5,339 students who are enrolled in schools in Castaic, 699 (13.1%) attend a private institution, while the remaining 4,640 (86.9%) are enrolled in public schools. The age group of 3 to 4 year olds has the highest likelihood of being enrolled in private schools, with 114 (36.0% in the age bracket) enrolled. Conversely, the age group of 20 to 24 year olds has the lowest likelihood of being enrolled in a private school, with 389 (93.7% in the age bracket) attending a public institution.
| Age Bracket | Public School | Private School |
| 3 to 4 Year Olds | 203 (64.0%) | 114 (36.0%) |
| 5 to 9 Year Old | 971 (85.2%) | 169 (14.8%) |
| 10 to 14 Year Olds | 1,324 (92.0%) | 115 (8.0%) |
| 15 to 17 Year Olds | 825 (92.8%) | 64 (7.2%) |
| 18 to 19 Year Olds | 300 (90.1%) | 33 (9.9%) |
| 20 to 24 Year Olds | 389 (93.7%) | 26 (6.3%) |
| 25 to 34 Year Olds | 418 (81.2%) | 97 (18.8%) |
| 35 Years and over | 211 (72.5%) | 80 (27.5%) |
| Total | 4,640 (86.9%) | 699 (13.1%) |
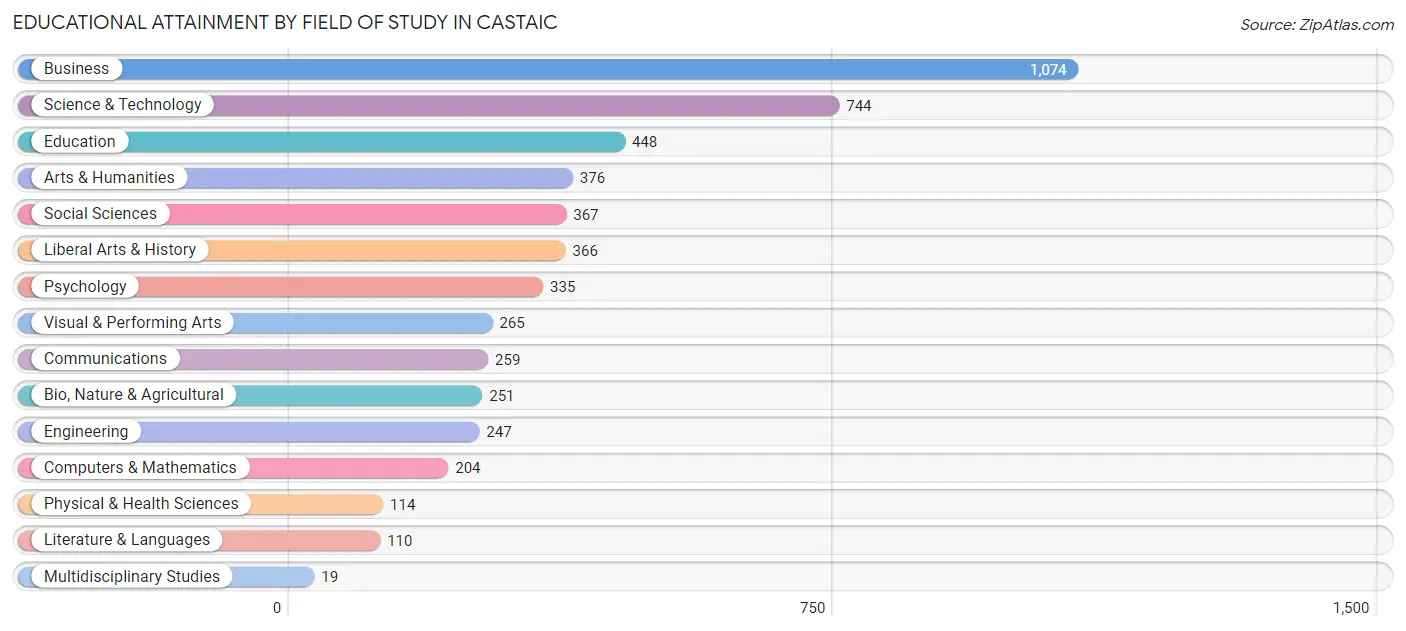
Educational Attainment by Field of Study in Castaic
Business (1,074 | 20.7%), science & technology (744 | 14.4%), education (448 | 8.6%), arts & humanities (376 | 7.3%), and social sciences (367 | 7.1%) are the most common fields of study among 5,179 individuals in Castaic who have obtained a bachelor's degree or higher.
| Field of Study | # Graduates | % Graduates |
| Computers & Mathematics | 204 | 3.9% |
| Bio, Nature & Agricultural | 251 | 4.9% |
| Physical & Health Sciences | 114 | 2.2% |
| Psychology | 335 | 6.5% |
| Social Sciences | 367 | 7.1% |
| Engineering | 247 | 4.8% |
| Multidisciplinary Studies | 19 | 0.4% |
| Science & Technology | 744 | 14.4% |
| Business | 1,074 | 20.7% |
| Education | 448 | 8.6% |
| Literature & Languages | 110 | 2.1% |
| Liberal Arts & History | 366 | 7.1% |
| Visual & Performing Arts | 265 | 5.1% |
| Communications | 259 | 5.0% |
| Arts & Humanities | 376 | 7.3% |
| Total | 5,179 | 100.0% |
Transportation & Commute in Castaic
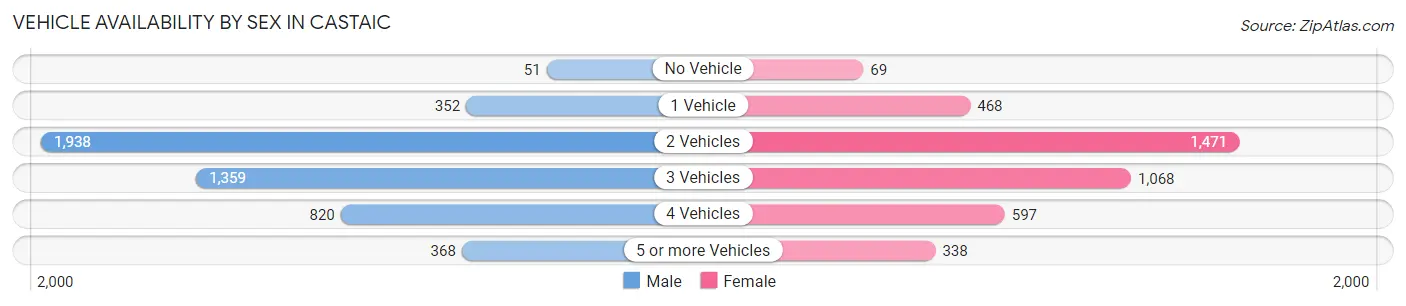
Vehicle Availability by Sex in Castaic
The most prevalent vehicle ownership categories in Castaic are males with 2 vehicles (1,938, accounting for 39.7%) and females with 2 vehicles (1,471, making up 48.3%).
| Vehicles Available | Male | Female |
| No Vehicle | 51 (1.0%) | 69 (1.7%) |
| 1 Vehicle | 352 (7.2%) | 468 (11.7%) |
| 2 Vehicles | 1,938 (39.7%) | 1,471 (36.7%) |
| 3 Vehicles | 1,359 (27.8%) | 1,068 (26.6%) |
| 4 Vehicles | 820 (16.8%) | 597 (14.9%) |
| 5 or more Vehicles | 368 (7.5%) | 338 (8.4%) |
| Total | 4,888 (100.0%) | 4,011 (100.0%) |
Commute Time in Castaic
The most frequently occuring commute durations in Castaic are 45 to 59 minutes (1,557 commuters, 19.6%), 10 to 14 minutes (1,201 commuters, 15.1%), and 60 to 89 minutes (1,039 commuters, 13.1%).
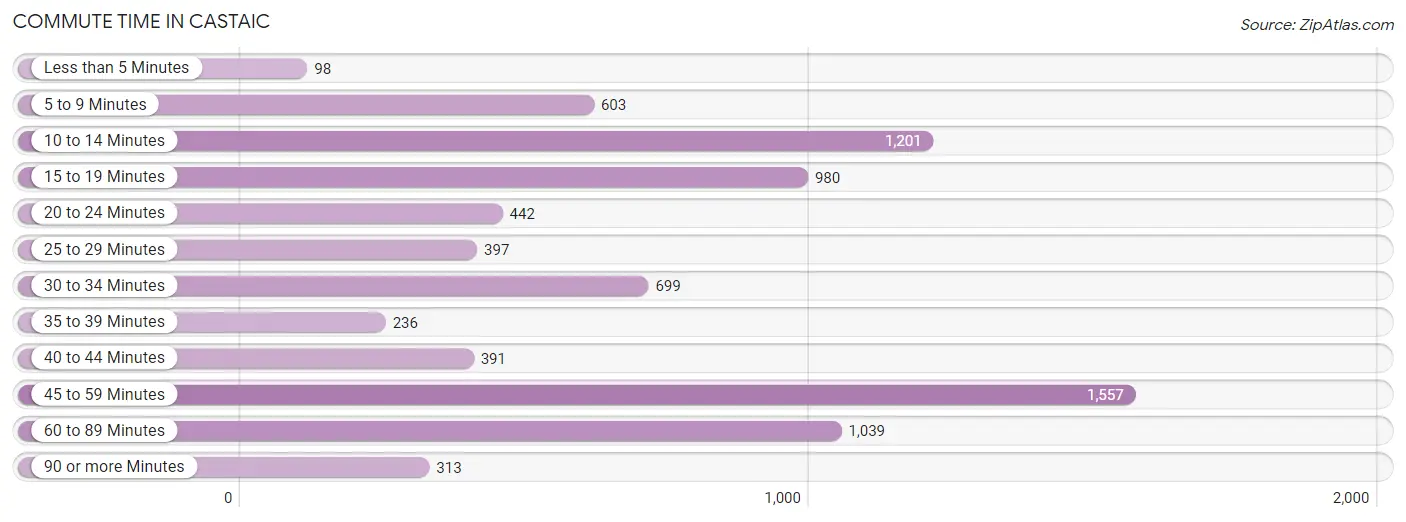
| Commute Time | # Commuters | % Commuters |
| Less than 5 Minutes | 98 | 1.2% |
| 5 to 9 Minutes | 603 | 7.6% |
| 10 to 14 Minutes | 1,201 | 15.1% |
| 15 to 19 Minutes | 980 | 12.3% |
| 20 to 24 Minutes | 442 | 5.6% |
| 25 to 29 Minutes | 397 | 5.0% |
| 30 to 34 Minutes | 699 | 8.8% |
| 35 to 39 Minutes | 236 | 3.0% |
| 40 to 44 Minutes | 391 | 4.9% |
| 45 to 59 Minutes | 1,557 | 19.6% |
| 60 to 89 Minutes | 1,039 | 13.1% |
| 90 or more Minutes | 313 | 3.9% |
Commute Time by Sex in Castaic
The most common commute times in Castaic are 45 to 59 minutes (1,010 commuters, 22.4%) for males and 15 to 19 minutes (567 commuters, 16.5%) for females.
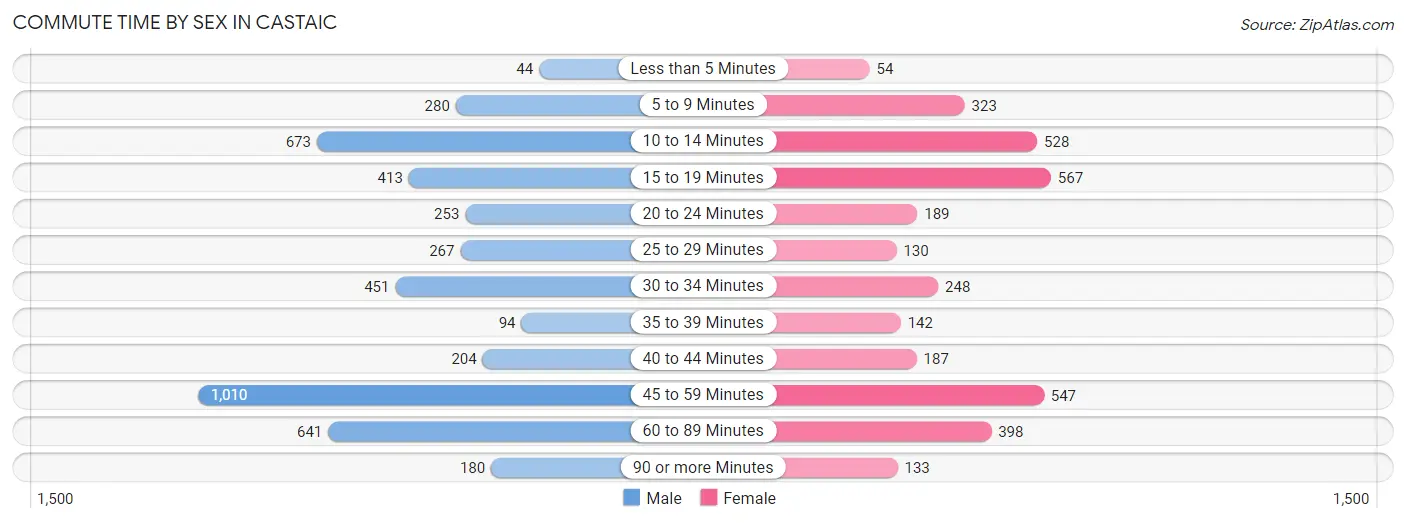
| Commute Time | Male | Female |
| Less than 5 Minutes | 44 (1.0%) | 54 (1.6%) |
| 5 to 9 Minutes | 280 (6.2%) | 323 (9.4%) |
| 10 to 14 Minutes | 673 (14.9%) | 528 (15.3%) |
| 15 to 19 Minutes | 413 (9.2%) | 567 (16.5%) |
| 20 to 24 Minutes | 253 (5.6%) | 189 (5.5%) |
| 25 to 29 Minutes | 267 (5.9%) | 130 (3.8%) |
| 30 to 34 Minutes | 451 (10.0%) | 248 (7.2%) |
| 35 to 39 Minutes | 94 (2.1%) | 142 (4.1%) |
| 40 to 44 Minutes | 204 (4.5%) | 187 (5.4%) |
| 45 to 59 Minutes | 1,010 (22.4%) | 547 (15.9%) |
| 60 to 89 Minutes | 641 (14.2%) | 398 (11.6%) |
| 90 or more Minutes | 180 (4.0%) | 133 (3.9%) |
Time of Departure to Work by Sex in Castaic
The most frequent times of departure to work in Castaic are 7:00 AM to 7:29 AM (694, 15.4%) for males and 7:30 AM to 7:59 AM (504, 14.6%) for females.
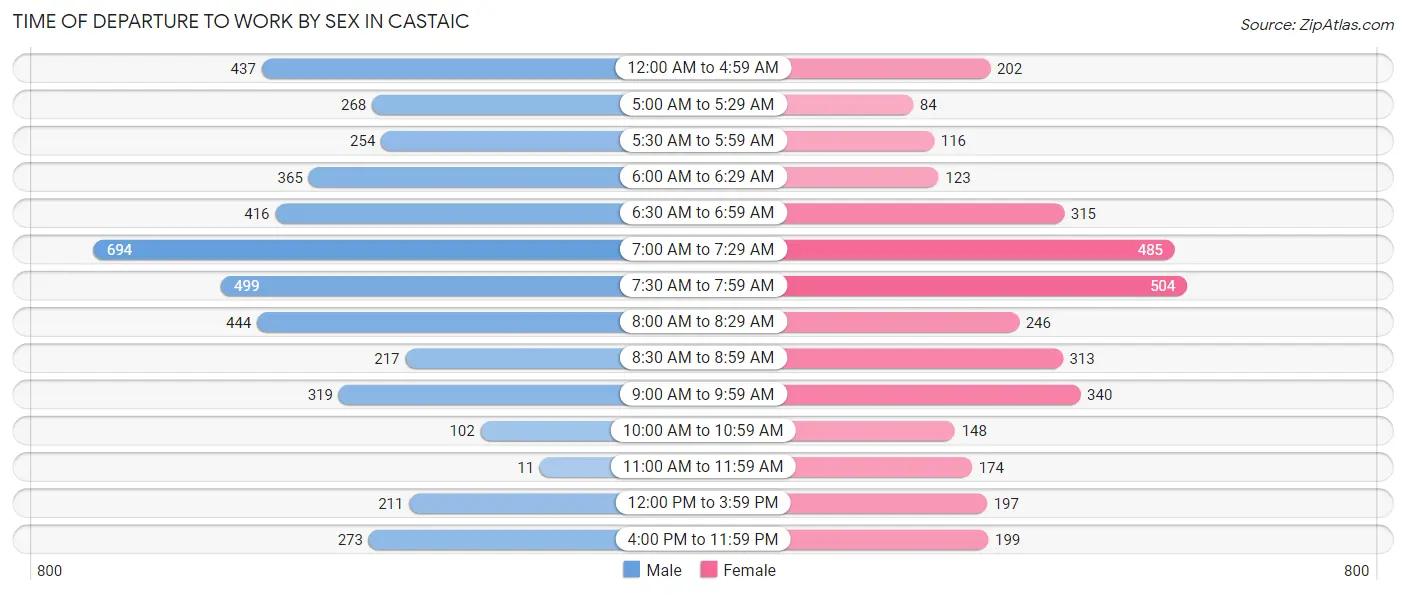
| Time of Departure | Male | Female |
| 12:00 AM to 4:59 AM | 437 (9.7%) | 202 (5.9%) |
| 5:00 AM to 5:29 AM | 268 (5.9%) | 84 (2.4%) |
| 5:30 AM to 5:59 AM | 254 (5.6%) | 116 (3.4%) |
| 6:00 AM to 6:29 AM | 365 (8.1%) | 123 (3.6%) |
| 6:30 AM to 6:59 AM | 416 (9.2%) | 315 (9.1%) |
| 7:00 AM to 7:29 AM | 694 (15.4%) | 485 (14.1%) |
| 7:30 AM to 7:59 AM | 499 (11.1%) | 504 (14.6%) |
| 8:00 AM to 8:29 AM | 444 (9.8%) | 246 (7.1%) |
| 8:30 AM to 8:59 AM | 217 (4.8%) | 313 (9.1%) |
| 9:00 AM to 9:59 AM | 319 (7.1%) | 340 (9.9%) |
| 10:00 AM to 10:59 AM | 102 (2.3%) | 148 (4.3%) |
| 11:00 AM to 11:59 AM | 11 (0.2%) | 174 (5.1%) |
| 12:00 PM to 3:59 PM | 211 (4.7%) | 197 (5.7%) |
| 4:00 PM to 11:59 PM | 273 (6.0%) | 199 (5.8%) |
| Total | 4,510 (100.0%) | 3,446 (100.0%) |
Housing Occupancy in Castaic
Occupancy by Ownership in Castaic
Of the total 5,775 dwellings in Castaic, owner-occupied units account for 4,869 (84.3%), while renter-occupied units make up 906 (15.7%).
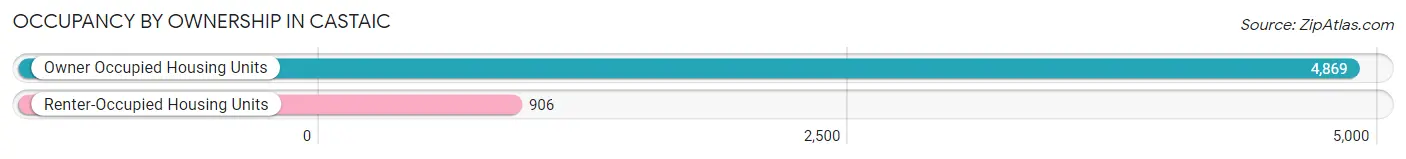
| Occupancy | # Housing Units | % Housing Units |
| Owner Occupied Housing Units | 4,869 | 84.3% |
| Renter-Occupied Housing Units | 906 | 15.7% |
| Total Occupied Housing Units | 5,775 | 100.0% |
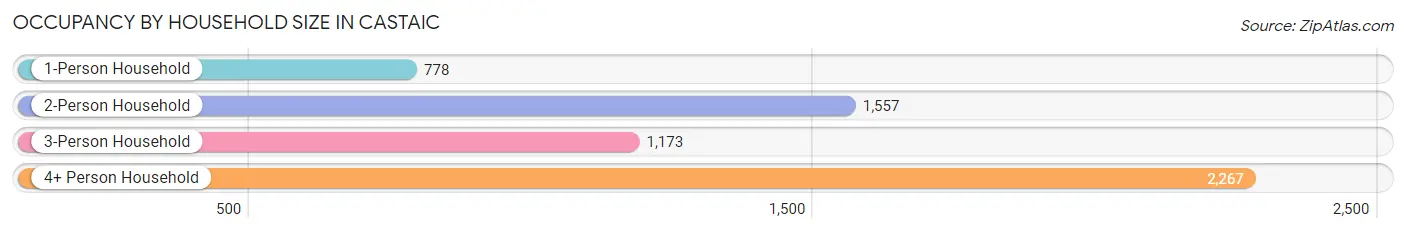
Occupancy by Household Size in Castaic
| Household Size | # Housing Units | % Housing Units |
| 1-Person Household | 778 | 13.5% |
| 2-Person Household | 1,557 | 27.0% |
| 3-Person Household | 1,173 | 20.3% |
| 4+ Person Household | 2,267 | 39.3% |
| Total Housing Units | 5,775 | 100.0% |
Occupancy by Ownership by Household Size in Castaic
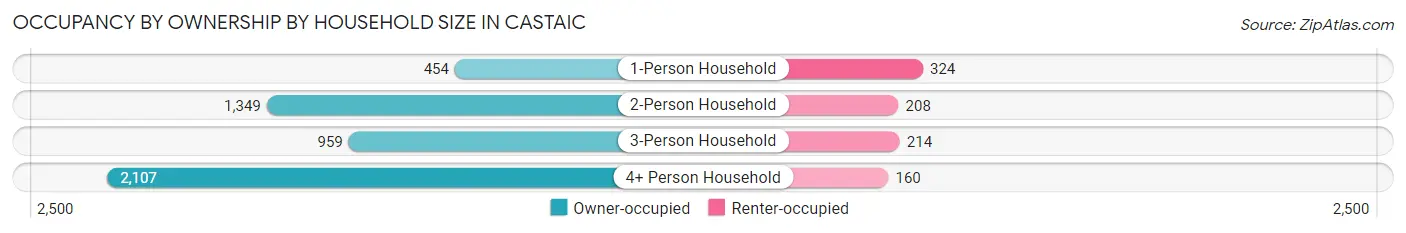
| Household Size | Owner-occupied | Renter-occupied |
| 1-Person Household | 454 (58.4%) | 324 (41.6%) |
| 2-Person Household | 1,349 (86.6%) | 208 (13.4%) |
| 3-Person Household | 959 (81.8%) | 214 (18.2%) |
| 4+ Person Household | 2,107 (92.9%) | 160 (7.1%) |
| Total Housing Units | 4,869 (84.3%) | 906 (15.7%) |
Occupancy by Educational Attainment in Castaic
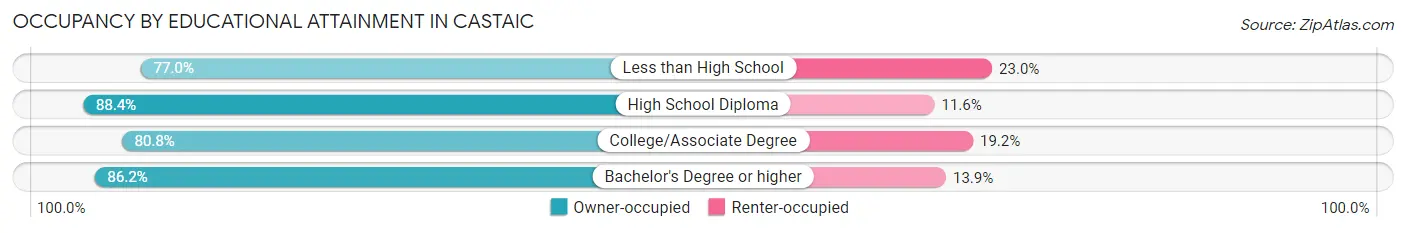
| Household Size | Owner-occupied | Renter-occupied |
| Less than High School | 221 (77.0%) | 66 (23.0%) |
| High School Diploma | 925 (88.4%) | 121 (11.6%) |
| College/Associate Degree | 1,564 (80.8%) | 372 (19.2%) |
| Bachelor's Degree or higher | 2,159 (86.2%) | 347 (13.9%) |
Occupancy by Age of Householder in Castaic
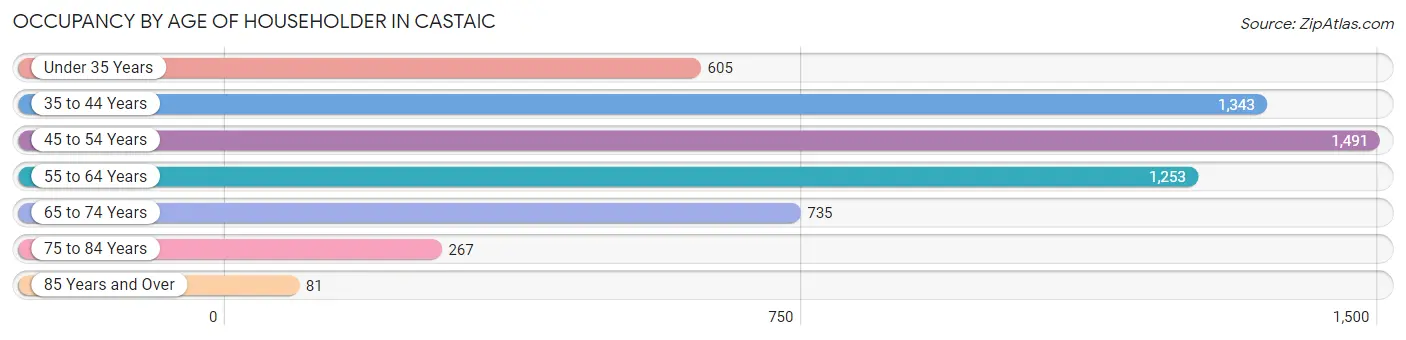
| Age Bracket | # Households | % Households |
| Under 35 Years | 605 | 10.5% |
| 35 to 44 Years | 1,343 | 23.3% |
| 45 to 54 Years | 1,491 | 25.8% |
| 55 to 64 Years | 1,253 | 21.7% |
| 65 to 74 Years | 735 | 12.7% |
| 75 to 84 Years | 267 | 4.6% |
| 85 Years and Over | 81 | 1.4% |
| Total | 5,775 | 100.0% |
Housing Finances in Castaic
Median Income by Occupancy in Castaic
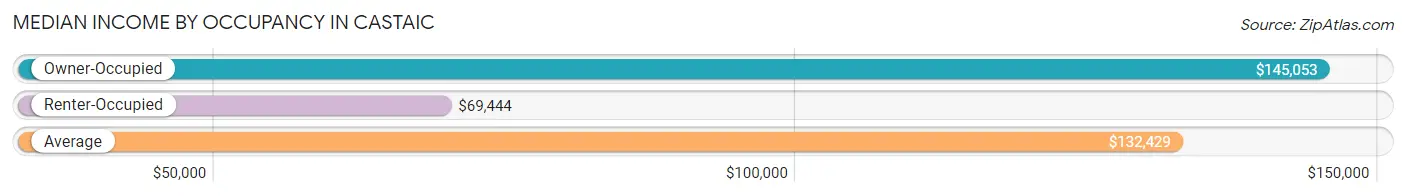
| Occupancy Type | # Households | Median Income |
| Owner-Occupied | 4,869 (84.3%) | $145,053 |
| Renter-Occupied | 906 (15.7%) | $69,444 |
| Average | 5,775 (100.0%) | $132,429 |
Occupancy by Householder Income Bracket in Castaic
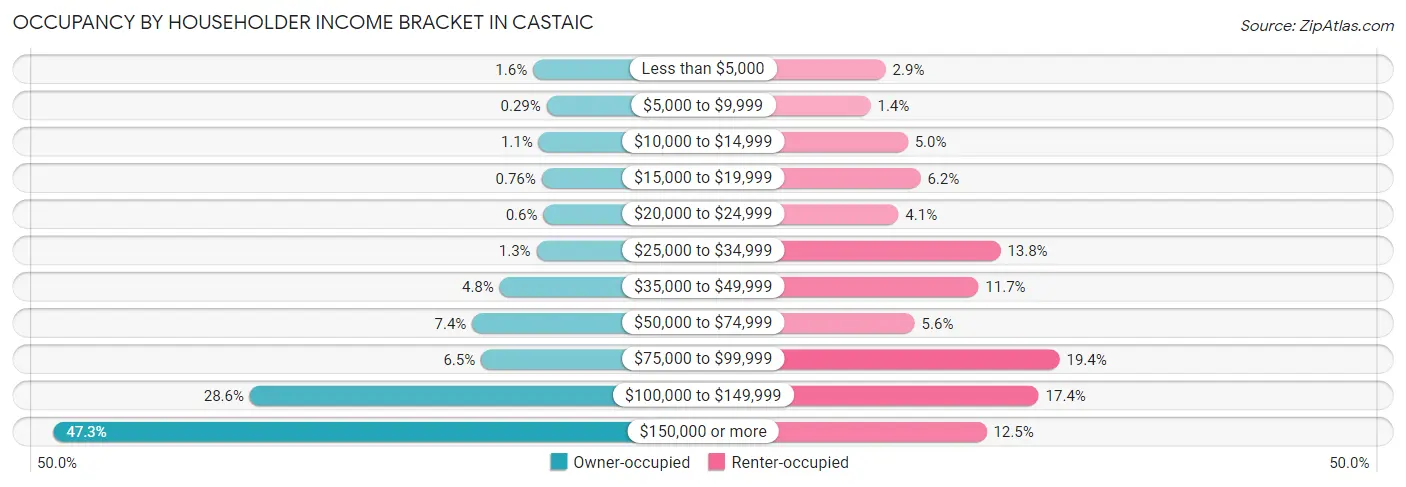
| Income Bracket | Owner-occupied | Renter-occupied |
| Less than $5,000 | 77 (1.6%) | 26 (2.9%) |
| $5,000 to $9,999 | 14 (0.3%) | 13 (1.4%) |
| $10,000 to $14,999 | 51 (1.1%) | 45 (5.0%) |
| $15,000 to $19,999 | 37 (0.8%) | 56 (6.2%) |
| $20,000 to $24,999 | 29 (0.6%) | 37 (4.1%) |
| $25,000 to $34,999 | 61 (1.3%) | 125 (13.8%) |
| $35,000 to $49,999 | 232 (4.8%) | 106 (11.7%) |
| $50,000 to $74,999 | 359 (7.4%) | 51 (5.6%) |
| $75,000 to $99,999 | 318 (6.5%) | 176 (19.4%) |
| $100,000 to $149,999 | 1,390 (28.5%) | 158 (17.4%) |
| $150,000 or more | 2,301 (47.3%) | 113 (12.5%) |
| Total | 4,869 (100.0%) | 906 (100.0%) |
Monthly Housing Cost Tiers in Castaic
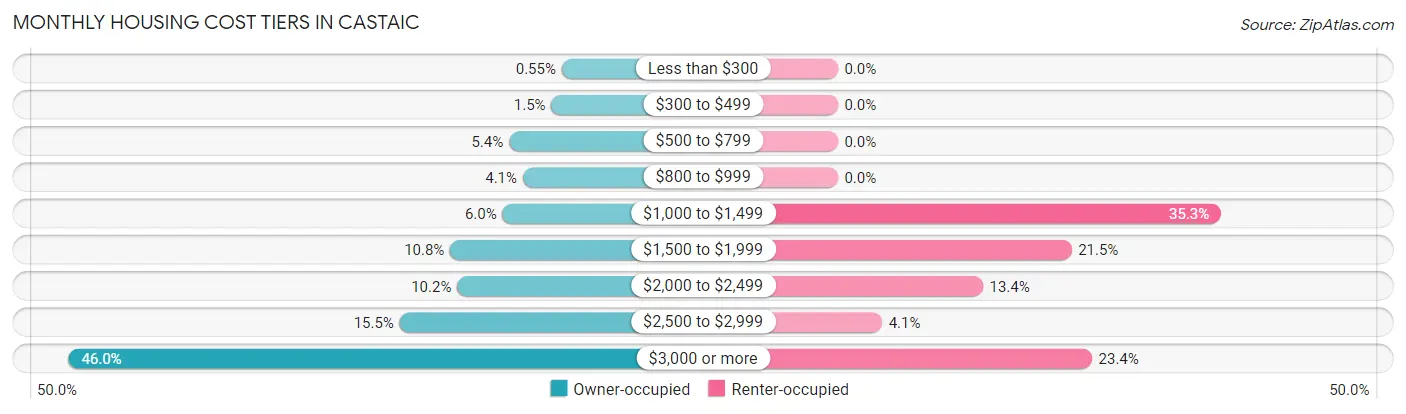
| Monthly Cost | Owner-occupied | Renter-occupied |
| Less than $300 | 27 (0.5%) | 0 (0.0%) |
| $300 to $499 | 73 (1.5%) | 0 (0.0%) |
| $500 to $799 | 263 (5.4%) | 0 (0.0%) |
| $800 to $999 | 201 (4.1%) | 0 (0.0%) |
| $1,000 to $1,499 | 292 (6.0%) | 320 (35.3%) |
| $1,500 to $1,999 | 527 (10.8%) | 195 (21.5%) |
| $2,000 to $2,499 | 495 (10.2%) | 121 (13.4%) |
| $2,500 to $2,999 | 753 (15.5%) | 37 (4.1%) |
| $3,000 or more | 2,238 (46.0%) | 212 (23.4%) |
| Total | 4,869 (100.0%) | 906 (100.0%) |
Physical Housing Characteristics in Castaic
Housing Structures in Castaic
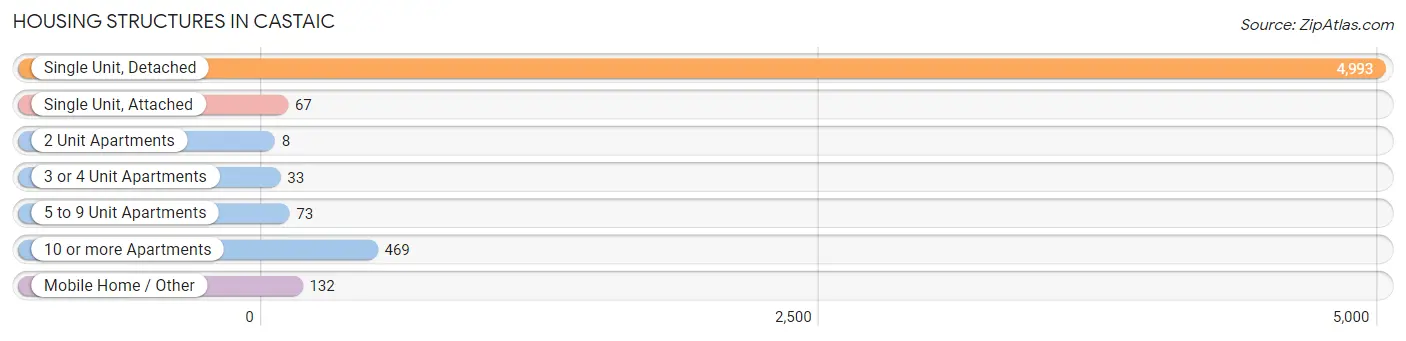
| Structure Type | # Housing Units | % Housing Units |
| Single Unit, Detached | 4,993 | 86.5% |
| Single Unit, Attached | 67 | 1.2% |
| 2 Unit Apartments | 8 | 0.1% |
| 3 or 4 Unit Apartments | 33 | 0.6% |
| 5 to 9 Unit Apartments | 73 | 1.3% |
| 10 or more Apartments | 469 | 8.1% |
| Mobile Home / Other | 132 | 2.3% |
| Total | 5,775 | 100.0% |
Housing Structures by Occupancy in Castaic
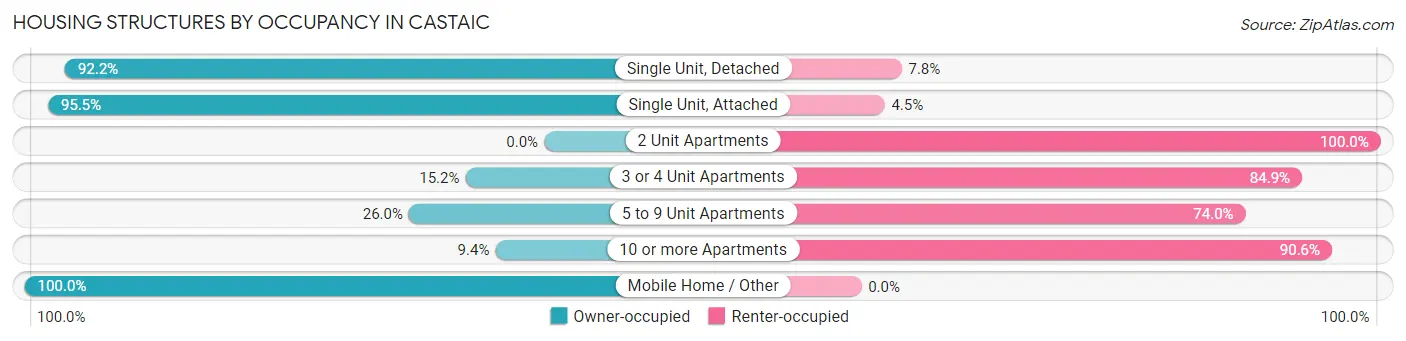
| Structure Type | Owner-occupied | Renter-occupied |
| Single Unit, Detached | 4,605 (92.2%) | 388 (7.8%) |
| Single Unit, Attached | 64 (95.5%) | 3 (4.5%) |
| 2 Unit Apartments | 0 (0.0%) | 8 (100.0%) |
| 3 or 4 Unit Apartments | 5 (15.1%) | 28 (84.9%) |
| 5 to 9 Unit Apartments | 19 (26.0%) | 54 (74.0%) |
| 10 or more Apartments | 44 (9.4%) | 425 (90.6%) |
| Mobile Home / Other | 132 (100.0%) | 0 (0.0%) |
| Total | 4,869 (84.3%) | 906 (15.7%) |
Housing Structures by Number of Rooms in Castaic
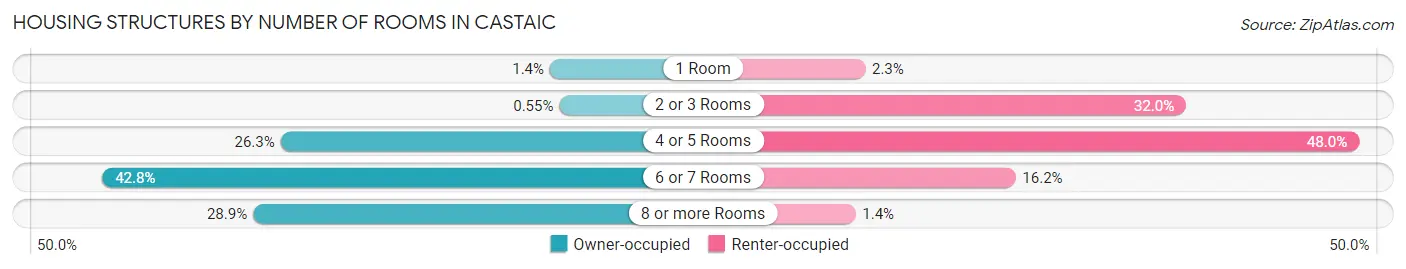
| Number of Rooms | Owner-occupied | Renter-occupied |
| 1 Room | 69 (1.4%) | 21 (2.3%) |
| 2 or 3 Rooms | 27 (0.5%) | 290 (32.0%) |
| 4 or 5 Rooms | 1,282 (26.3%) | 435 (48.0%) |
| 6 or 7 Rooms | 2,085 (42.8%) | 147 (16.2%) |
| 8 or more Rooms | 1,406 (28.9%) | 13 (1.4%) |
| Total | 4,869 (100.0%) | 906 (100.0%) |
Housing Structure by Heating Type in Castaic
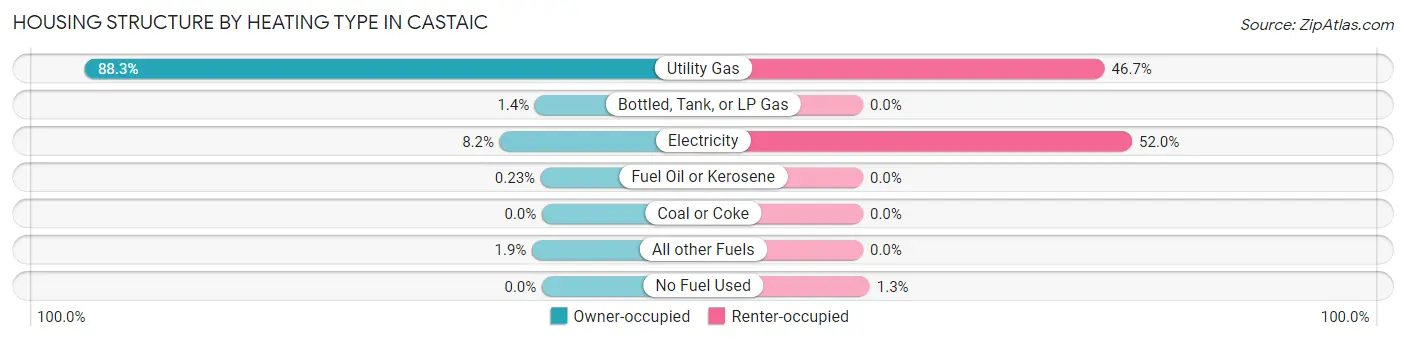
| Heating Type | Owner-occupied | Renter-occupied |
| Utility Gas | 4,301 (88.3%) | 423 (46.7%) |
| Bottled, Tank, or LP Gas | 66 (1.4%) | 0 (0.0%) |
| Electricity | 398 (8.2%) | 471 (52.0%) |
| Fuel Oil or Kerosene | 11 (0.2%) | 0 (0.0%) |
| Coal or Coke | 0 (0.0%) | 0 (0.0%) |
| All other Fuels | 93 (1.9%) | 0 (0.0%) |
| No Fuel Used | 0 (0.0%) | 12 (1.3%) |
| Total | 4,869 (100.0%) | 906 (100.0%) |
Household Vehicle Usage in Castaic
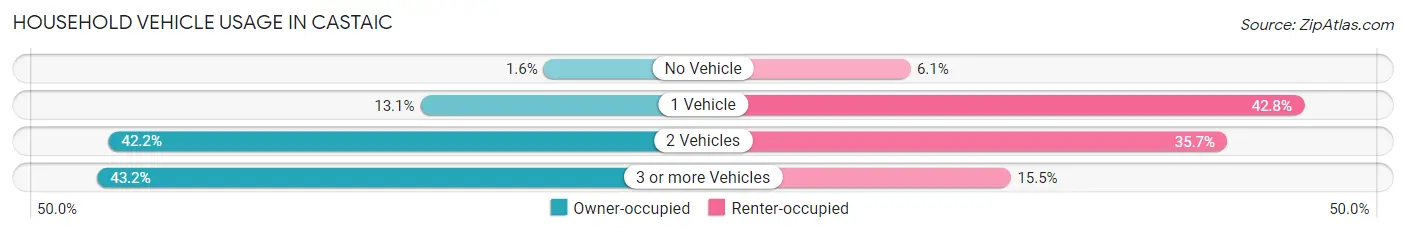
| Vehicles per Household | Owner-occupied | Renter-occupied |
| No Vehicle | 76 (1.6%) | 55 (6.1%) |
| 1 Vehicle | 636 (13.1%) | 388 (42.8%) |
| 2 Vehicles | 2,053 (42.2%) | 323 (35.6%) |
| 3 or more Vehicles | 2,104 (43.2%) | 140 (15.4%) |
| Total | 4,869 (100.0%) | 906 (100.0%) |
Real Estate & Mortgages in Castaic
Real Estate and Mortgage Overview in Castaic
| Characteristic | Without Mortgage | With Mortgage |
| Housing Units | 797 | 4,072 |
| Median Property Value | $629,000 | $669,900 |
| Median Household Income | $120,417 | $1,996 |
| Monthly Housing Costs | $860 | $2,238 |
| Real Estate Taxes | $5,476 | $26 |
Property Value by Mortgage Status in Castaic
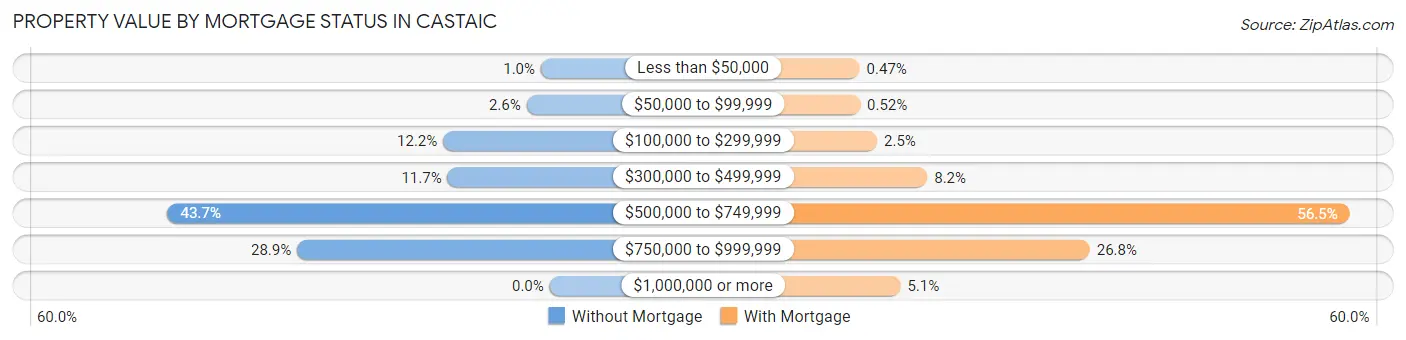
| Property Value | Without Mortgage | With Mortgage |
| Less than $50,000 | 8 (1.0%) | 19 (0.5%) |
| $50,000 to $99,999 | 21 (2.6%) | 21 (0.5%) |
| $100,000 to $299,999 | 97 (12.2%) | 100 (2.5%) |
| $300,000 to $499,999 | 93 (11.7%) | 334 (8.2%) |
| $500,000 to $749,999 | 348 (43.7%) | 2,299 (56.5%) |
| $750,000 to $999,999 | 230 (28.9%) | 1,090 (26.8%) |
| $1,000,000 or more | 0 (0.0%) | 209 (5.1%) |
| Total | 797 (100.0%) | 4,072 (100.0%) |
Household Income by Mortgage Status in Castaic
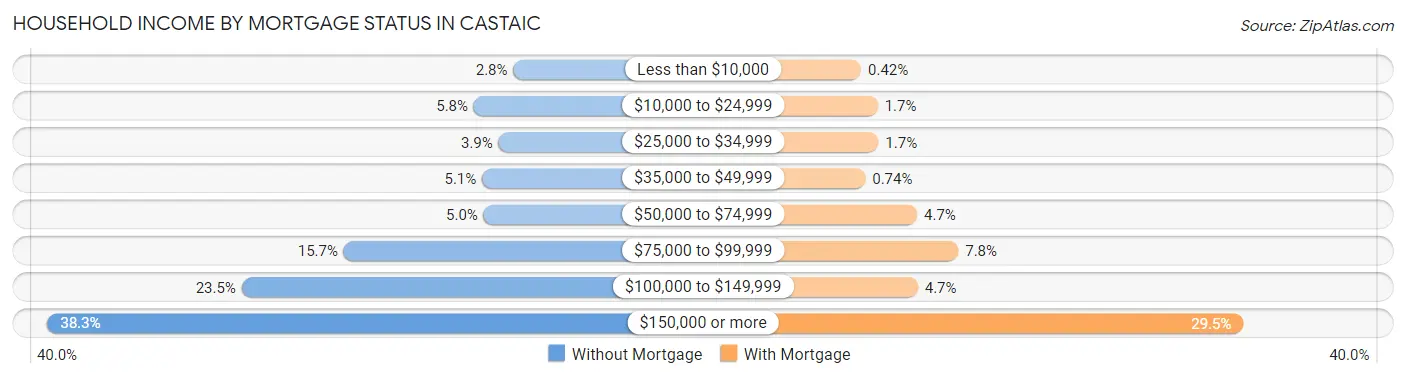
| Household Income | Without Mortgage | With Mortgage |
| Less than $10,000 | 22 (2.8%) | 17 (0.4%) |
| $10,000 to $24,999 | 46 (5.8%) | 69 (1.7%) |
| $25,000 to $34,999 | 31 (3.9%) | 71 (1.7%) |
| $35,000 to $49,999 | 41 (5.1%) | 30 (0.7%) |
| $50,000 to $74,999 | 40 (5.0%) | 191 (4.7%) |
| $75,000 to $99,999 | 125 (15.7%) | 319 (7.8%) |
| $100,000 to $149,999 | 187 (23.5%) | 193 (4.7%) |
| $150,000 or more | 305 (38.3%) | 1,203 (29.5%) |
| Total | 797 (100.0%) | 4,072 (100.0%) |
Property Value to Household Income Ratio in Castaic
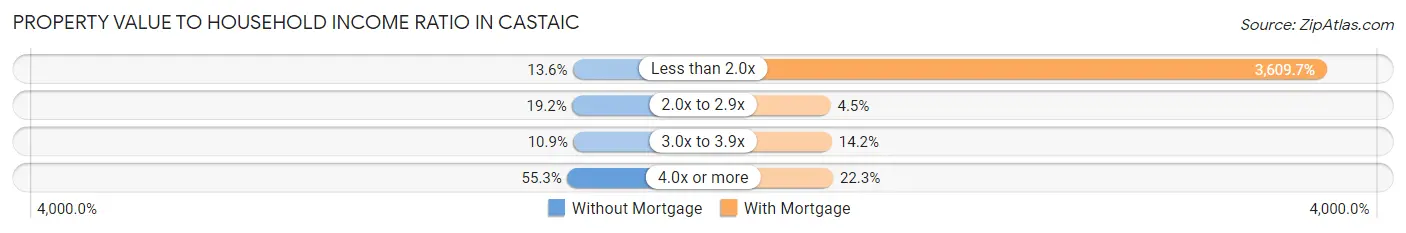
| Value-to-Income Ratio | Without Mortgage | With Mortgage |
| Less than 2.0x | 108 (13.6%) | 146,986 (3,609.7%) |
| 2.0x to 2.9x | 153 (19.2%) | 185 (4.5%) |
| 3.0x to 3.9x | 87 (10.9%) | 580 (14.2%) |
| 4.0x or more | 441 (55.3%) | 909 (22.3%) |
| Total | 797 (100.0%) | 4,072 (100.0%) |
Real Estate Taxes by Mortgage Status in Castaic
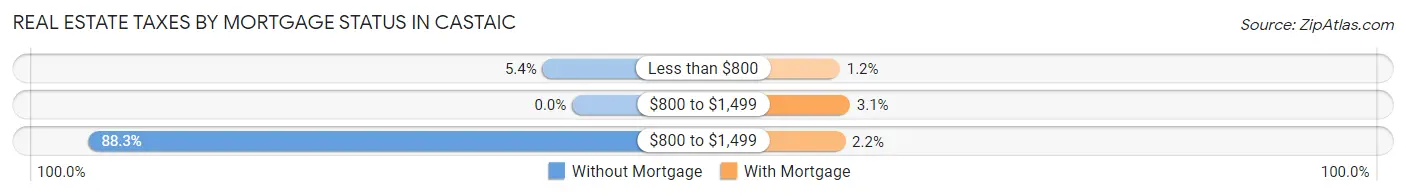
| Property Taxes | Without Mortgage | With Mortgage |
| Less than $800 | 43 (5.4%) | 50 (1.2%) |
| $800 to $1,499 | 0 (0.0%) | 125 (3.1%) |
| $800 to $1,499 | 704 (88.3%) | 90 (2.2%) |
| Total | 797 (100.0%) | 4,072 (100.0%) |
Health & Disability in Castaic
Health Insurance Coverage by Age in Castaic
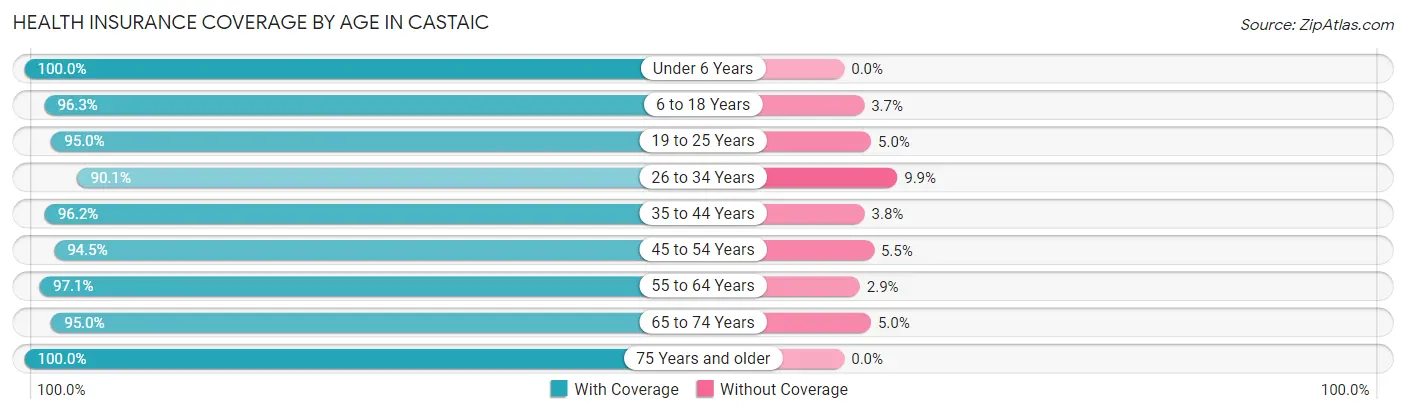
| Age Bracket | With Coverage | Without Coverage |
| Under 6 Years | 1,575 (100.0%) | 0 (0.0%) |
| 6 to 18 Years | 3,604 (96.3%) | 139 (3.7%) |
| 19 to 25 Years | 1,122 (95.0%) | 59 (5.0%) |
| 26 to 34 Years | 2,034 (90.1%) | 223 (9.9%) |
| 35 to 44 Years | 2,463 (96.2%) | 97 (3.8%) |
| 45 to 54 Years | 2,582 (94.5%) | 151 (5.5%) |
| 55 to 64 Years | 2,508 (97.1%) | 75 (2.9%) |
| 65 to 74 Years | 1,241 (95.0%) | 65 (5.0%) |
| 75 Years and older | 686 (100.0%) | 0 (0.0%) |
| Total | 17,815 (95.7%) | 809 (4.3%) |
Health Insurance Coverage by Citizenship Status in Castaic
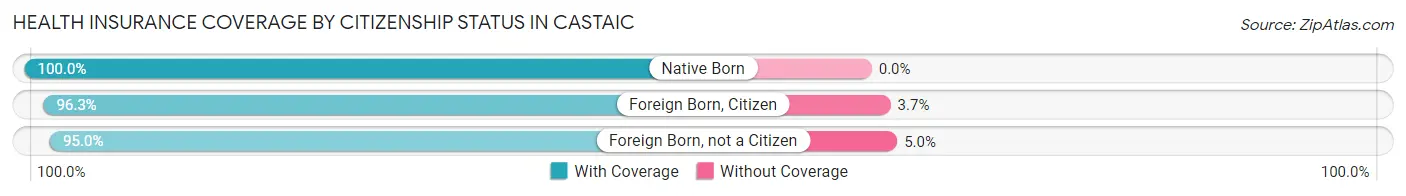
| Citizenship Status | With Coverage | Without Coverage |
| Native Born | 1,575 (100.0%) | 0 (0.0%) |
| Foreign Born, Citizen | 3,604 (96.3%) | 139 (3.7%) |
| Foreign Born, not a Citizen | 1,122 (95.0%) | 59 (5.0%) |
Health Insurance Coverage by Household Income in Castaic
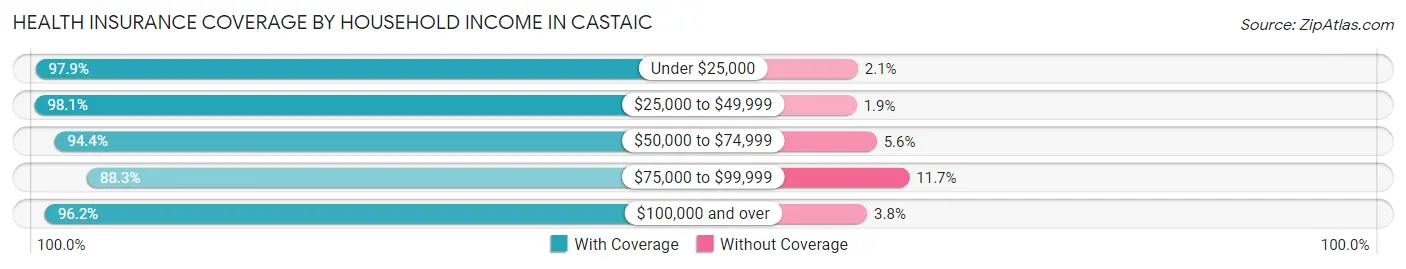
| Household Income | With Coverage | Without Coverage |
| Under $25,000 | 708 (97.9%) | 15 (2.1%) |
| $25,000 to $49,999 | 1,109 (98.1%) | 21 (1.9%) |
| $50,000 to $74,999 | 1,044 (94.4%) | 62 (5.6%) |
| $75,000 to $99,999 | 1,250 (88.3%) | 166 (11.7%) |
| $100,000 and over | 13,704 (96.2%) | 545 (3.8%) |
Public vs Private Health Insurance Coverage by Age in Castaic
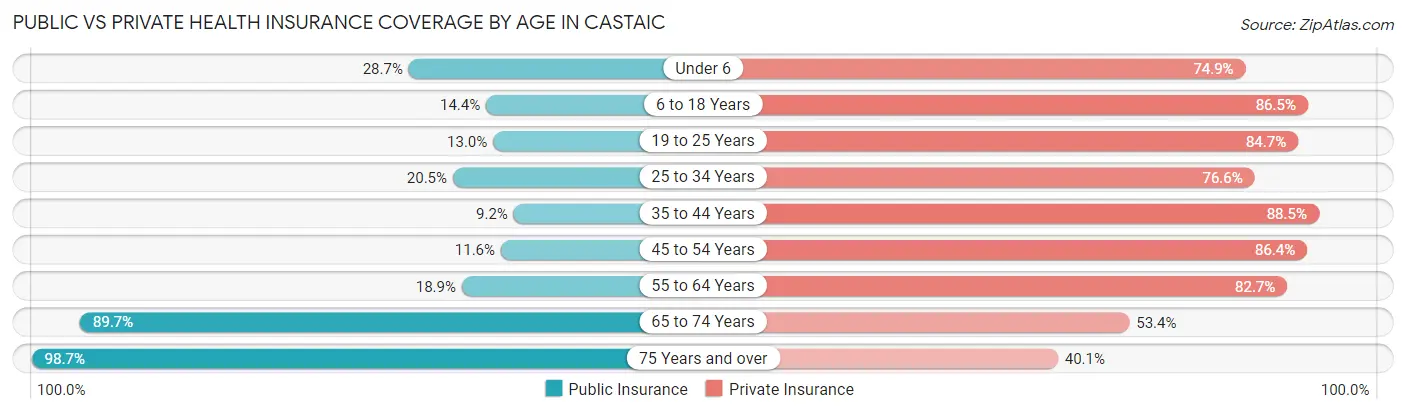
| Age Bracket | Public Insurance | Private Insurance |
| Under 6 | 452 (28.7%) | 1,180 (74.9%) |
| 6 to 18 Years | 537 (14.3%) | 3,237 (86.5%) |
| 19 to 25 Years | 154 (13.0%) | 1,000 (84.7%) |
| 25 to 34 Years | 463 (20.5%) | 1,729 (76.6%) |
| 35 to 44 Years | 236 (9.2%) | 2,266 (88.5%) |
| 45 to 54 Years | 317 (11.6%) | 2,360 (86.4%) |
| 55 to 64 Years | 487 (18.9%) | 2,135 (82.7%) |
| 65 to 74 Years | 1,172 (89.7%) | 697 (53.4%) |
| 75 Years and over | 677 (98.7%) | 275 (40.1%) |
| Total | 4,495 (24.1%) | 14,879 (79.9%) |
Disability Status by Sex by Age in Castaic
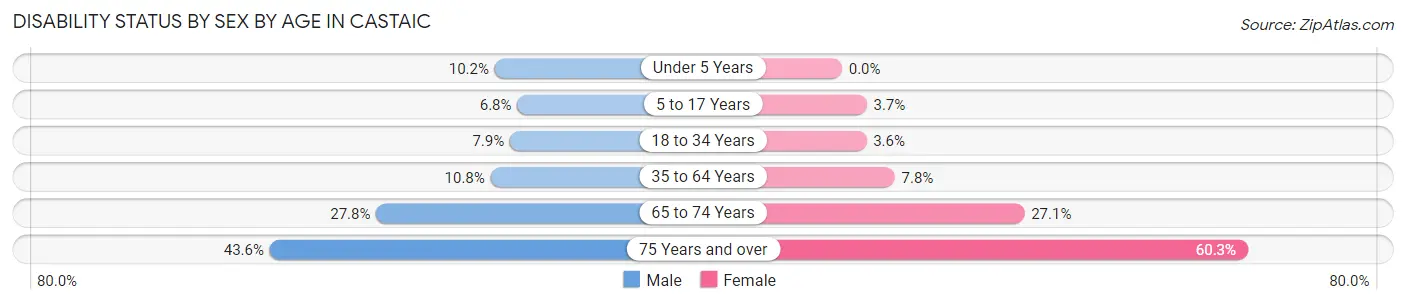
| Age Bracket | Male | Female |
| Under 5 Years | 87 (10.2%) | 0 (0.0%) |
| 5 to 17 Years | 118 (6.8%) | 72 (3.7%) |
| 18 to 34 Years | 144 (7.9%) | 68 (3.6%) |
| 35 to 64 Years | 429 (10.8%) | 306 (7.8%) |
| 65 to 74 Years | 170 (27.8%) | 188 (27.1%) |
| 75 Years and over | 119 (43.6%) | 249 (60.3%) |
Disability Class by Sex by Age in Castaic
Disability Class: Hearing Difficulty
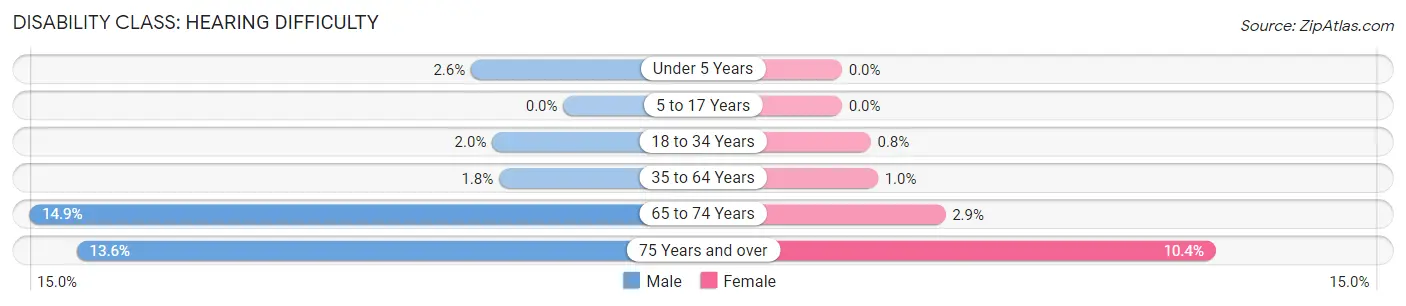
| Age Bracket | Male | Female |
| Under 5 Years | 22 (2.6%) | 0 (0.0%) |
| 5 to 17 Years | 0 (0.0%) | 0 (0.0%) |
| 18 to 34 Years | 36 (2.0%) | 15 (0.8%) |
| 35 to 64 Years | 71 (1.8%) | 39 (1.0%) |
| 65 to 74 Years | 91 (14.9%) | 20 (2.9%) |
| 75 Years and over | 37 (13.6%) | 43 (10.4%) |
Disability Class: Vision Difficulty
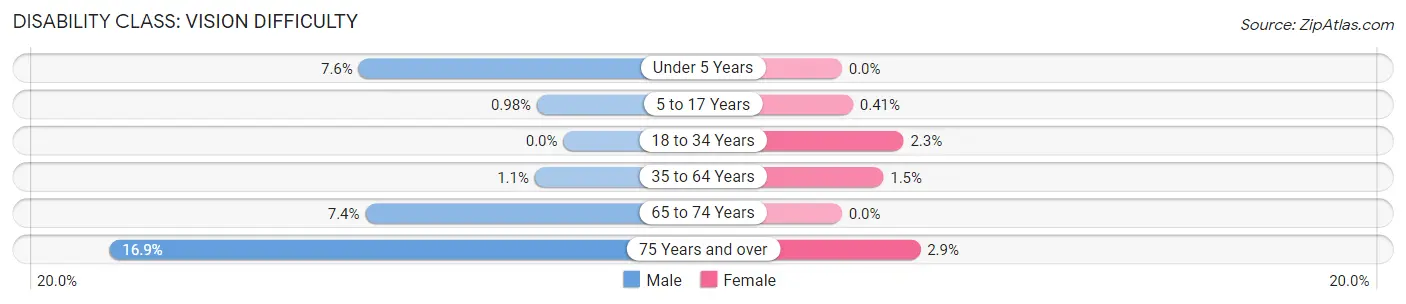
| Age Bracket | Male | Female |
| Under 5 Years | 65 (7.6%) | 0 (0.0%) |
| 5 to 17 Years | 17 (1.0%) | 8 (0.4%) |
| 18 to 34 Years | 0 (0.0%) | 43 (2.3%) |
| 35 to 64 Years | 42 (1.1%) | 60 (1.5%) |
| 65 to 74 Years | 45 (7.3%) | 0 (0.0%) |
| 75 Years and over | 46 (16.9%) | 12 (2.9%) |
Disability Class: Cognitive Difficulty
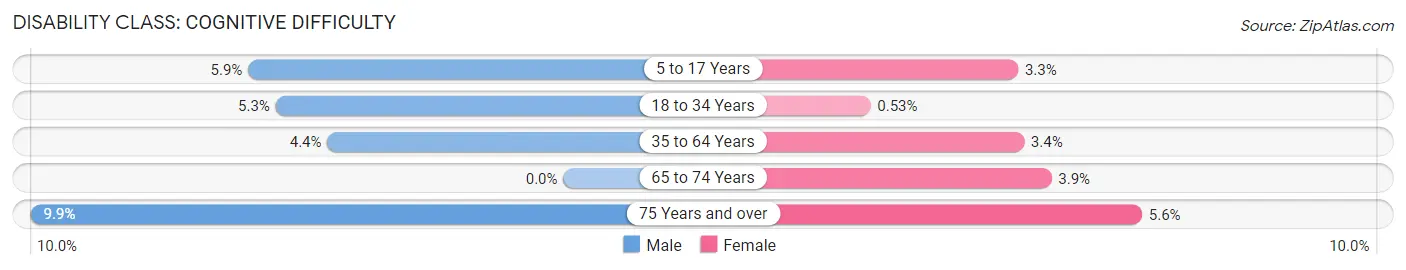
| Age Bracket | Male | Female |
| 5 to 17 Years | 101 (5.9%) | 64 (3.3%) |
| 18 to 34 Years | 97 (5.3%) | 10 (0.5%) |
| 35 to 64 Years | 174 (4.4%) | 132 (3.4%) |
| 65 to 74 Years | 0 (0.0%) | 27 (3.9%) |
| 75 Years and over | 27 (9.9%) | 23 (5.6%) |
Disability Class: Ambulatory Difficulty
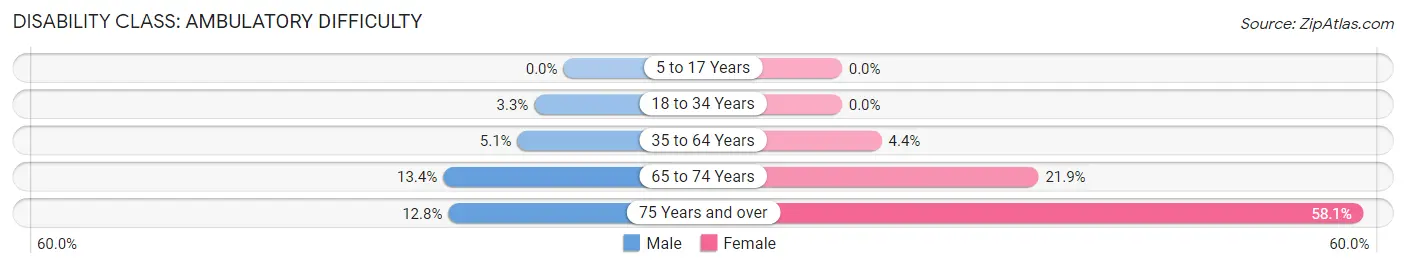
| Age Bracket | Male | Female |
| 5 to 17 Years | 0 (0.0%) | 0 (0.0%) |
| 18 to 34 Years | 59 (3.3%) | 0 (0.0%) |
| 35 to 64 Years | 203 (5.1%) | 173 (4.4%) |
| 65 to 74 Years | 82 (13.4%) | 152 (21.9%) |
| 75 Years and over | 35 (12.8%) | 240 (58.1%) |
Disability Class: Self-Care Difficulty
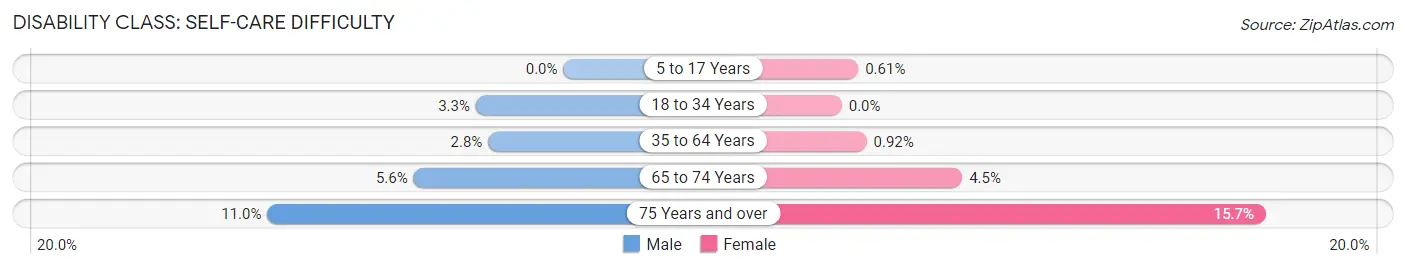
| Age Bracket | Male | Female |
| 5 to 17 Years | 0 (0.0%) | 12 (0.6%) |
| 18 to 34 Years | 59 (3.3%) | 0 (0.0%) |
| 35 to 64 Years | 111 (2.8%) | 36 (0.9%) |
| 65 to 74 Years | 34 (5.6%) | 31 (4.5%) |
| 75 Years and over | 30 (11.0%) | 65 (15.7%) |
Technology Access in Castaic
Computing Device Access in Castaic
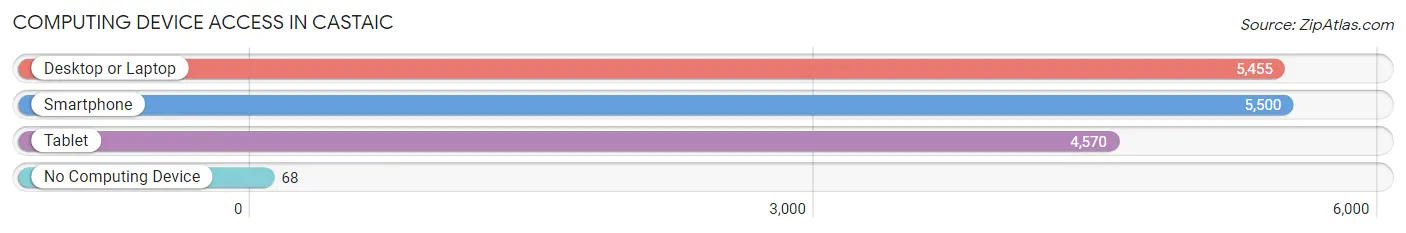
| Device Type | # Households | % Households |
| Desktop or Laptop | 5,455 | 94.5% |
| Smartphone | 5,500 | 95.2% |
| Tablet | 4,570 | 79.1% |
| No Computing Device | 68 | 1.2% |
| Total | 5,775 | 100.0% |
Internet Access in Castaic
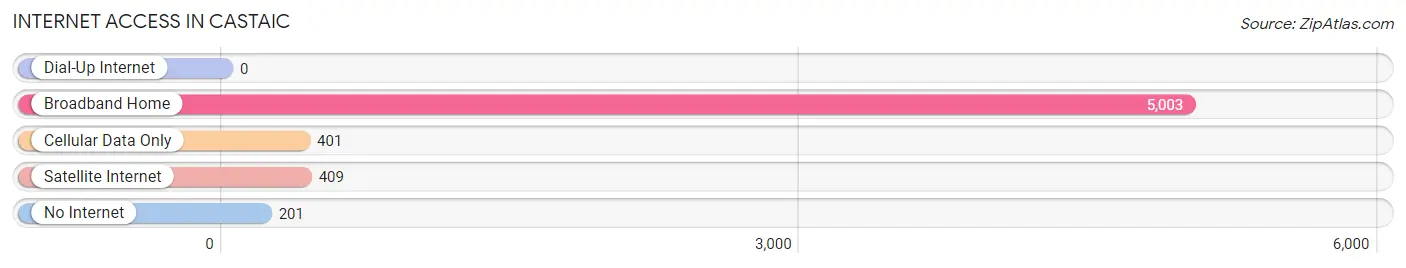
| Internet Type | # Households | % Households |
| Dial-Up Internet | 0 | 0.0% |
| Broadband Home | 5,003 | 86.6% |
| Cellular Data Only | 401 | 6.9% |
| Satellite Internet | 409 | 7.1% |
| No Internet | 201 | 3.5% |
| Total | 5,775 | 100.0% |
Castaic Summary
Castaic, California is a small unincorporated community located in the Santa Clarita Valley of Los Angeles County. It is situated in the foothills of the Sierra Pelona Mountains, approximately 40 miles northwest of downtown Los Angeles. The population of Castaic was estimated to be 19,015 in 2019.
History
The area now known as Castaic was originally inhabited by the Tataviam people, a Native American tribe that lived in the area for thousands of years. The first Europeans to settle in the area were Spanish missionaries in the late 1700s. The area was later part of the Rancho San Francisco land grant, which was granted to Francisco Lopez in 1839.
In the late 1800s, the area was settled by homesteaders, who built small farms and ranches. The area was known as Castac, which was derived from the Tataviam word for “eye of the valley.” In the early 1900s, the area was developed as an agricultural center, with the construction of a railroad line and the opening of a post office.
In the 1950s, the area began to experience rapid growth as Los Angeles expanded. The Castaic Lake State Recreation Area was established in 1968, and the Castaic Dam was completed in 1973. The dam created Castaic Lake, which is now the largest body of water in the Santa Clarita Valley.
Geography
Castaic is located in the Santa Clarita Valley of Los Angeles County. It is situated in the foothills of the Sierra Pelona Mountains, approximately 40 miles northwest of downtown Los Angeles. The area is characterized by rolling hills and valleys, with elevations ranging from 1,000 to 3,000 feet.
The climate in Castaic is Mediterranean, with hot, dry summers and mild, wet winters. The average annual temperature is 68°F, and the average annual precipitation is 17 inches.
Economy
The economy of Castaic is largely based on agriculture and tourism. The area is home to several wineries, and the Castaic Lake State Recreation Area is a popular destination for fishing, boating, and camping.
The area is also home to several industrial and manufacturing businesses, including a cement plant, a plastics factory, and a metal fabrication plant. The area is also home to several retail businesses, including a Walmart Supercenter and a Home Depot.
Demographics
As of 2019, the population of Castaic was estimated to be 19,015. The racial makeup of the area is 73.3% White, 11.2% Hispanic or Latino, 8.2% Asian, and 4.3% African American. The median household income is $87,845, and the median home value is $541,000.
The area is served by the Castaic Union School District, which includes four elementary schools, one middle school, and one high school. The area is also home to several private schools, including a Catholic school and a Montessori school.
Common Questions
What is Per Capita Income in Castaic?
Per Capita income in Castaic is $47,984.
What is the Median Family Income in Castaic?
Median Family Income in Castaic is $143,200.
What is the Median Household income in Castaic?
Median Household Income in Castaic is $132,429.
What is Income or Wage Gap in Castaic?
Income or Wage Gap in Castaic is 36.6%.
Women in Castaic earn 63.4 cents for every dollar earned by a man.
What is Family Income Deficit in Castaic?
Family Income Deficit in Castaic is $15,308.
Families that are below poverty line in Castaic earn $15,308 less on average than the poverty threshold level.
What is Inequality or Gini Index in Castaic?
Inequality or Gini Index in Castaic is 0.37.
What is the Total Population of Castaic?
Total Population of Castaic is 18,643.
What is the Total Male Population of Castaic?
Total Male Population of Castaic is 9,277.
What is the Total Female Population of Castaic?
Total Female Population of Castaic is 9,366.
What is the Ratio of Males per 100 Females in Castaic?
There are 99.05 Males per 100 Females in Castaic.
What is the Ratio of Females per 100 Males in Castaic?
There are 100.96 Females per 100 Males in Castaic.
What is the Median Population Age in Castaic?
Median Population Age in Castaic is 36.9 Years.
What is the Average Family Size in Castaic
Average Family Size in Castaic is 3.5 People.
What is the Average Household Size in Castaic
Average Household Size in Castaic is 3.2 People.
How Large is the Labor Force in Castaic?
There are 9,681 People in the Labor Forcein in Castaic.
What is the Percentage of People in the Labor Force in Castaic?
68.8% of People are in the Labor Force in Castaic.
What is the Unemployment Rate in Castaic?
Unemployment Rate in Castaic is 5.4%.