Cities with the Lowest Poverty Level Among Seniors Over the Age of 75 in Florida
RELATED REPORTS & OPTIONS
Lowest Poverty | Seniors 75+
Florida
Compare Cities
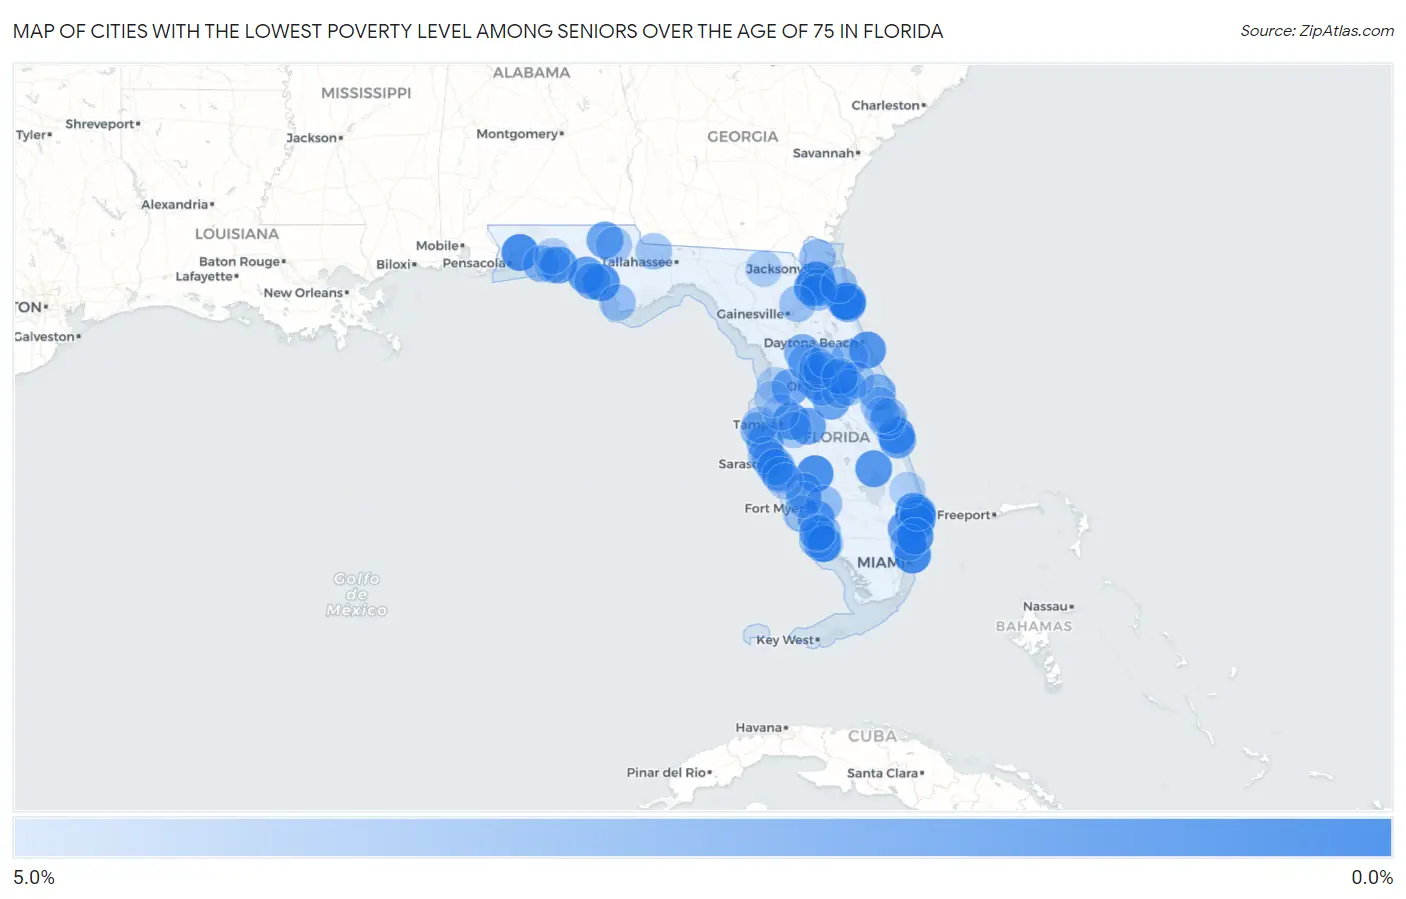
Map of Cities with the Lowest Poverty Level Among Seniors Over the Age of 75 in Florida
5.0%
0.0%
Cities with the Lowest Poverty Level Among Seniors Over the Age of 75 in Florida
| City | Senior Poverty | vs State | vs National | |
| 1. | St Augustine Beach | 0.16% | 11.8%(-11.6)#1 | 11.1%(-10.9)#7 |
| 2. | Bal Harbour | 0.54% | 11.8%(-11.3)#2 | 11.1%(-10.5)#58 |
| 3. | Bagdad | 0.67% | 11.8%(-11.1)#3 | 11.1%(-10.4)#80 |
| 4. | Lely Resort | 0.76% | 11.8%(-11.0)#4 | 11.1%(-10.3)#96 |
| 5. | Southeast Arcadia | 0.85% | 11.8%(-10.9)#5 | 11.1%(-10.2)#116 |
| 6. | Parker | 0.97% | 11.8%(-10.8)#6 | 11.1%(-10.1)#137 |
| 7. | Orchid | 0.99% | 11.8%(-10.8)#7 | 11.1%(-10.1)#139 |
| 8. | Golf | 1.1% | 11.8%(-10.7)#8 | 11.1%(-9.96)#164 |
| 9. | Oakleaf Plantation | 1.1% | 11.8%(-10.7)#9 | 11.1%(-9.95)#165 |
| 10. | Middleburg | 1.2% | 11.8%(-10.6)#10 | 11.1%(-9.91)#175 |
| 11. | Ponce Inlet | 1.2% | 11.8%(-10.6)#11 | 11.1%(-9.90)#179 |
| 12. | Miramar Beach | 1.3% | 11.8%(-10.5)#12 | 11.1%(-9.80)#211 |
| 13. | Cypress Quarters | 1.3% | 11.8%(-10.5)#13 | 11.1%(-9.75)#224 |
| 14. | Atlantis | 1.3% | 11.8%(-10.5)#14 | 11.1%(-9.75)#226 |
| 15. | Pelican Marsh | 1.4% | 11.8%(-10.4)#15 | 11.1%(-9.65)#262 |
| 16. | Seffner | 1.5% | 11.8%(-10.3)#16 | 11.1%(-9.59)#286 |
| 17. | Ocean Ridge | 1.5% | 11.8%(-10.3)#17 | 11.1%(-9.57)#294 |
| 18. | San Carlos Park | 1.6% | 11.8%(-10.2)#18 | 11.1%(-9.43)#352 |
| 19. | Parkland | 1.8% | 11.8%(-10.0)#19 | 11.1%(-9.31)#410 |
| 20. | Groveland | 1.8% | 11.8%(-9.98)#20 | 11.1%(-9.26)#425 |
| 21. | Panama City Beach | 1.8% | 11.8%(-9.97)#21 | 11.1%(-9.24)#433 |
| 22. | Tierra Verde | 1.9% | 11.8%(-9.92)#22 | 11.1%(-9.20)#458 |
| 23. | Mulberry | 1.9% | 11.8%(-9.91)#23 | 11.1%(-9.19)#463 |
| 24. | Indian River Shores | 2.0% | 11.8%(-9.78)#24 | 11.1%(-9.06)#526 |
| 25. | Chipley | 2.0% | 11.8%(-9.76)#25 | 11.1%(-9.03)#541 |
| 26. | Gulf Stream | 2.0% | 11.8%(-9.75)#26 | 11.1%(-9.03)#549 |
| 27. | Celebration | 2.1% | 11.8%(-9.73)#27 | 11.1%(-9.00)#567 |
| 28. | Hill N Dale | 2.2% | 11.8%(-9.60)#28 | 11.1%(-8.87)#653 |
| 29. | Highland Beach | 2.3% | 11.8%(-9.53)#29 | 11.1%(-8.80)#694 |
| 30. | St Augustine South | 2.3% | 11.8%(-9.53)#30 | 11.1%(-8.80)#695 |
| 31. | Asbury Lake | 2.3% | 11.8%(-9.47)#31 | 11.1%(-8.75)#730 |
| 32. | Osprey | 2.3% | 11.8%(-9.46)#32 | 11.1%(-8.74)#741 |
| 33. | Midway Cdp Santa Rosa County | 2.5% | 11.8%(-9.31)#33 | 11.1%(-8.59)#838 |
| 34. | Clermont | 2.5% | 11.8%(-9.30)#34 | 11.1%(-8.58)#849 |
| 35. | Punta Gorda | 2.5% | 11.8%(-9.24)#35 | 11.1%(-8.52)#888 |
| 36. | Sea Ranch Lakes | 2.6% | 11.8%(-9.23)#36 | 11.1%(-8.50)#903 |
| 37. | Belleview | 2.6% | 11.8%(-9.19)#37 | 11.1%(-8.47)#922 |
| 38. | Maitland | 2.6% | 11.8%(-9.19)#38 | 11.1%(-8.47)#930 |
| 39. | Lower Grand Lagoon | 2.6% | 11.8%(-9.18)#39 | 11.1%(-8.46)#933 |
| 40. | Forest City | 2.6% | 11.8%(-9.17)#40 | 11.1%(-8.44)#947 |
| 41. | Sharpes | 2.7% | 11.8%(-9.07)#41 | 11.1%(-8.34)#1,028 |
| 42. | Butler Beach | 2.8% | 11.8%(-9.04)#42 | 11.1%(-8.32)#1,046 |
| 43. | South Sarasota | 2.8% | 11.8%(-9.00)#43 | 11.1%(-8.27)#1,076 |
| 44. | The Villages | 3.0% | 11.8%(-8.84)#44 | 11.1%(-8.11)#1,207 |
| 45. | Mary Esther | 3.0% | 11.8%(-8.81)#45 | 11.1%(-8.08)#1,220 |
| 46. | Pinecraft | 3.0% | 11.8%(-8.76)#46 | 11.1%(-8.04)#1,270 |
| 47. | Indian Shores | 3.0% | 11.8%(-8.75)#47 | 11.1%(-8.02)#1,281 |
| 48. | Island Walk | 3.2% | 11.8%(-8.63)#48 | 11.1%(-7.91)#1,372 |
| 49. | Lake Helen | 3.2% | 11.8%(-8.59)#49 | 11.1%(-7.87)#1,404 |
| 50. | Longboat Key | 3.2% | 11.8%(-8.55)#50 | 11.1%(-7.82)#1,457 |
| 51. | Berkshire Lakes | 3.3% | 11.8%(-8.52)#51 | 11.1%(-7.79)#1,477 |
| 52. | Yalaha | 3.3% | 11.8%(-8.52)#52 | 11.1%(-7.79)#1,478 |
| 53. | Lauderdale By The Sea | 3.3% | 11.8%(-8.49)#53 | 11.1%(-7.77)#1,500 |
| 54. | Broadview Park | 3.3% | 11.8%(-8.48)#54 | 11.1%(-7.76)#1,505 |
| 55. | Oak Ridge | 3.3% | 11.8%(-8.45)#55 | 11.1%(-7.73)#1,539 |
| 56. | Nassau Village Ratliff | 3.4% | 11.8%(-8.44)#56 | 11.1%(-7.71)#1,551 |
| 57. | Silver Lake | 3.5% | 11.8%(-8.33)#57 | 11.1%(-7.61)#1,654 |
| 58. | Olga | 3.5% | 11.8%(-8.30)#58 | 11.1%(-7.58)#1,670 |
| 59. | Naples | 3.6% | 11.8%(-8.24)#59 | 11.1%(-7.51)#1,716 |
| 60. | Port St Joe | 3.6% | 11.8%(-8.23)#60 | 11.1%(-7.51)#1,725 |
| 61. | Malabar | 3.6% | 11.8%(-8.20)#61 | 11.1%(-7.48)#1,771 |
| 62. | Penney Farms | 3.6% | 11.8%(-8.19)#62 | 11.1%(-7.46)#1,782 |
| 63. | Bradenton Beach | 3.6% | 11.8%(-8.18)#63 | 11.1%(-7.46)#1,784 |
| 64. | Viera West | 3.6% | 11.8%(-8.14)#64 | 11.1%(-7.42)#1,816 |
| 65. | Nocatee | 3.7% | 11.8%(-8.13)#65 | 11.1%(-7.41)#1,821 |
| 66. | Waldo | 3.7% | 11.8%(-8.12)#66 | 11.1%(-7.40)#1,842 |
| 67. | Melbourne Beach | 3.7% | 11.8%(-8.12)#67 | 11.1%(-7.39)#1,844 |
| 68. | Bradfordville | 3.8% | 11.8%(-8.00)#68 | 11.1%(-7.27)#1,964 |
| 69. | Chuluota | 3.8% | 11.8%(-7.99)#69 | 11.1%(-7.27)#1,967 |
| 70. | Gretna | 3.8% | 11.8%(-7.98)#70 | 11.1%(-7.26)#1,983 |
| 71. | Siesta Key | 3.8% | 11.8%(-7.97)#71 | 11.1%(-7.25)#1,989 |
| 72. | Pelican Bay | 3.9% | 11.8%(-7.94)#72 | 11.1%(-7.21)#2,032 |
| 73. | Verona Walk | 3.9% | 11.8%(-7.92)#73 | 11.1%(-7.20)#2,044 |
| 74. | Fish Hawk | 3.9% | 11.8%(-7.88)#74 | 11.1%(-7.16)#2,085 |
| 75. | Alford | 3.9% | 11.8%(-7.87)#75 | 11.1%(-7.15)#2,102 |
| 76. | Ave Maria | 3.9% | 11.8%(-7.86)#76 | 11.1%(-7.14)#2,109 |
| 77. | Tavares | 4.0% | 11.8%(-7.82)#77 | 11.1%(-7.09)#2,146 |
| 78. | St James City | 4.0% | 11.8%(-7.76)#78 | 11.1%(-7.03)#2,208 |
| 79. | Pine Ridge Cdp Collier County | 4.0% | 11.8%(-7.75)#79 | 11.1%(-7.03)#2,214 |
| 80. | Destin | 4.1% | 11.8%(-7.72)#80 | 11.1%(-7.00)#2,243 |
| 81. | Rio Pinar | 4.1% | 11.8%(-7.68)#81 | 11.1%(-6.96)#2,285 |
| 82. | Umatilla | 4.2% | 11.8%(-7.63)#82 | 11.1%(-6.90)#2,320 |
| 83. | Belleair | 4.2% | 11.8%(-7.61)#83 | 11.1%(-6.88)#2,374 |
| 84. | Palmer Ranch | 4.2% | 11.8%(-7.60)#84 | 11.1%(-6.87)#2,378 |
| 85. | Burnt Store Marina | 4.2% | 11.8%(-7.58)#85 | 11.1%(-6.86)#2,393 |
| 86. | Laurel | 4.2% | 11.8%(-7.54)#86 | 11.1%(-6.82)#2,424 |
| 87. | White Springs | 4.3% | 11.8%(-7.49)#87 | 11.1%(-6.77)#2,476 |
| 88. | Hypoluxo | 4.3% | 11.8%(-7.49)#88 | 11.1%(-6.76)#2,480 |
| 89. | Wekiwa Springs | 4.3% | 11.8%(-7.48)#89 | 11.1%(-6.75)#2,483 |
| 90. | Jupiter Farms | 4.4% | 11.8%(-7.39)#90 | 11.1%(-6.67)#2,584 |
| 91. | Plantation | 4.4% | 11.8%(-7.39)#91 | 11.1%(-6.67)#2,585 |
| 92. | Ocklawaha | 4.4% | 11.8%(-7.37)#92 | 11.1%(-6.64)#2,614 |
| 93. | Naples Park | 4.4% | 11.8%(-7.35)#93 | 11.1%(-6.62)#2,626 |
| 94. | North Weeki Wachee | 4.5% | 11.8%(-7.30)#94 | 11.1%(-6.58)#2,667 |
| 95. | Lutz | 4.5% | 11.8%(-7.29)#95 | 11.1%(-6.56)#2,685 |
| 96. | Niceville | 4.5% | 11.8%(-7.28)#96 | 11.1%(-6.56)#2,691 |
| 97. | Meadow Oaks | 4.5% | 11.8%(-7.27)#97 | 11.1%(-6.54)#2,704 |
| 98. | Rainbow Springs | 4.5% | 11.8%(-7.27)#98 | 11.1%(-6.54)#2,706 |
| 99. | Melbourne Village | 4.6% | 11.8%(-7.16)#99 | 11.1%(-6.43)#2,840 |
| 100. | Marco Shores-Hammock Bay | 4.7% | 11.8%(-7.14)#100 | 11.1%(-6.42)#2,859 |
Common Questions
What are the Top 10 Cities with the Lowest Poverty Level Among Seniors Over the Age of 75 in Florida?
Top 10 Cities with the Lowest Poverty Level Among Seniors Over the Age of 75 in Florida are:
#1
0.16%
#2
0.54%
#3
0.67%
#4
0.76%
#5
0.85%
#6
0.97%
#7
0.99%
#8
1.1%
#9
1.1%
#10
1.2%
What city has the Lowest Poverty Level Among Seniors Over the Age of 75 in Florida?
St Augustine Beach has the Lowest Poverty Level Among Seniors Over the Age of 75 in Florida with 0.16%.
What is the Poverty Level Among Seniors Over the Age of 75 in the State of Florida?
Poverty Level Among Seniors Over the Age of 75 in Florida is 11.8%.
What is the Poverty Level Among Seniors Over the Age of 75 in the United States?
Poverty Level Among Seniors Over the Age of 75 in the United States is 11.1%.