Phoenix Lake, CA Map & Demographics
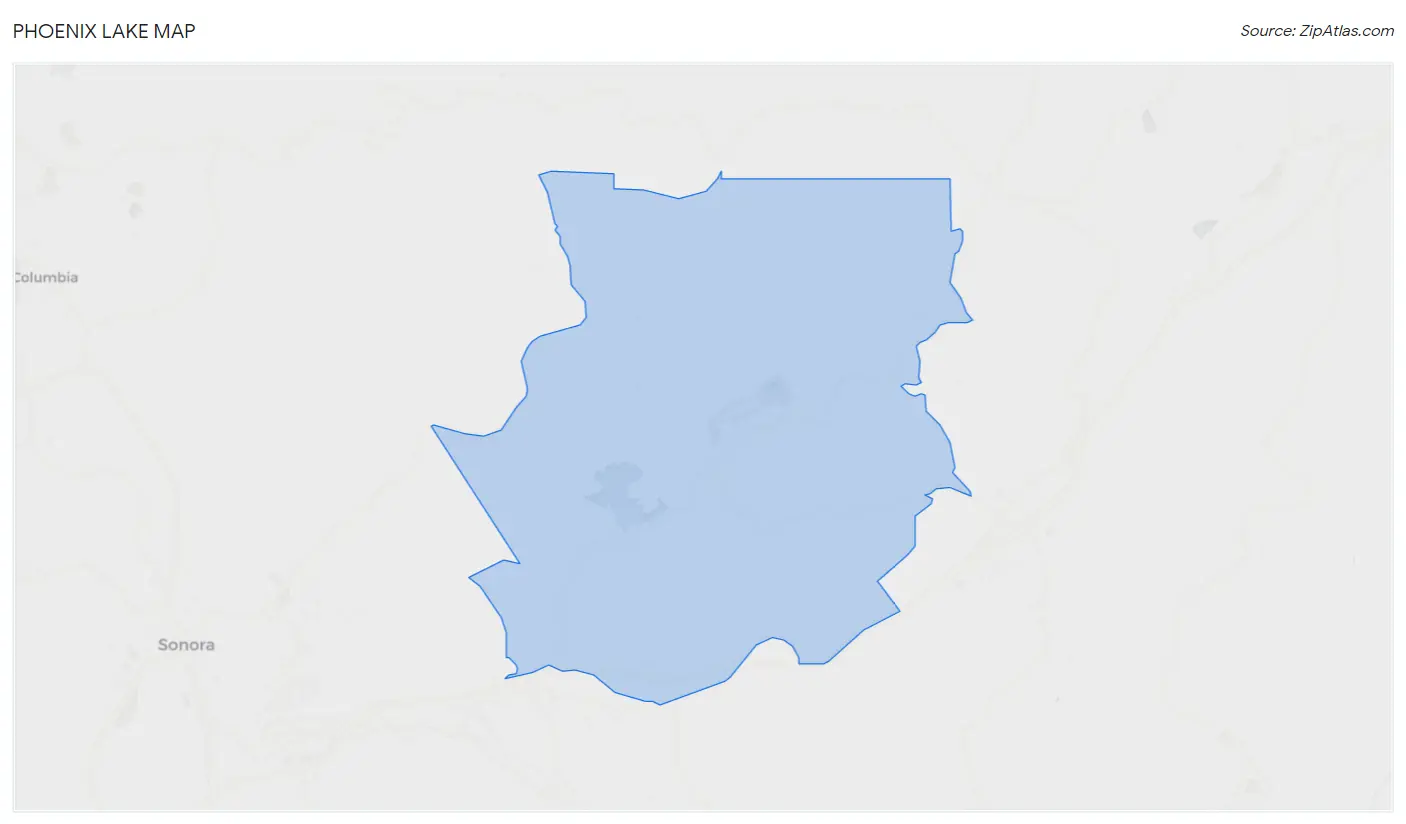
Phoenix Lake Map
Phoenix Lake Overview
$50,265
PER CAPITA INCOME
$108,191
AVG FAMILY INCOME
$72,173
AVG HOUSEHOLD INCOME
37.0%
WAGE / INCOME GAP [ % ]
63.0¢/ $1
WAGE / INCOME GAP [ $ ]
0.45
INEQUALITY / GINI INDEX
4,377
TOTAL POPULATION
2,162
MALE POPULATION
2,215
FEMALE POPULATION
97.61
MALES / 100 FEMALES
102.45
FEMALES / 100 MALES
58.5
MEDIAN AGE
2.7
AVG FAMILY SIZE
2.2
AVG HOUSEHOLD SIZE
1,753
LABOR FORCE [ PEOPLE ]
45.3%
PERCENT IN LABOR FORCE
5.8%
UNEMPLOYMENT RATE
Income in Phoenix Lake
Income Overview in Phoenix Lake
Per Capita Income in Phoenix Lake is $50,265, while median incomes of families and households are $108,191 and $72,173 respectively.
| Characteristic | Number | Measure |
| Per Capita Income | 4,377 | $50,265 |
| Median Family Income | 1,131 | $108,191 |
| Mean Family Income | 1,131 | $141,926 |
| Median Household Income | 2,010 | $72,173 |
| Mean Household Income | 2,010 | $107,196 |
| Income Deficit | 1,131 | $0 |
| Wage / Income Gap (%) | 4,377 | 37.02% |
| Wage / Income Gap ($) | 4,377 | 62.98¢ per $1 |
| Gini / Inequality Index | 4,377 | 0.45 |
Earnings by Sex in Phoenix Lake
Average Earnings in Phoenix Lake are $35,375, $51,731 for men and $32,582 for women, a difference of 37.0%.
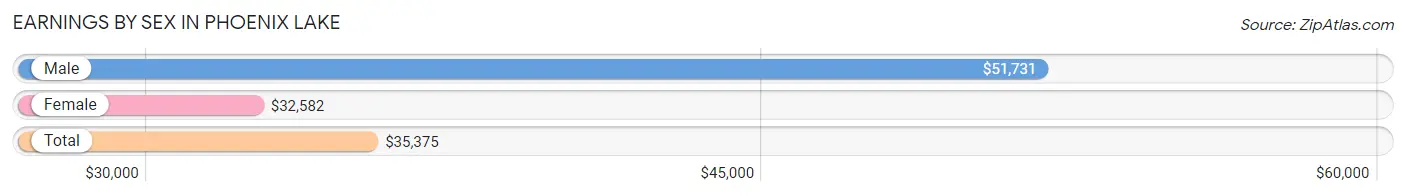
| Sex | Number | Average Earnings |
| Male | 996 (50.5%) | $51,731 |
| Female | 976 (49.5%) | $32,582 |
| Total | 1,972 (100.0%) | $35,375 |
Earnings by Sex by Income Bracket in Phoenix Lake
The most common earnings brackets in Phoenix Lake are $100,000+ for men (312 | 31.3%) and $30,000 to $34,999 for women (245 | 25.1%).
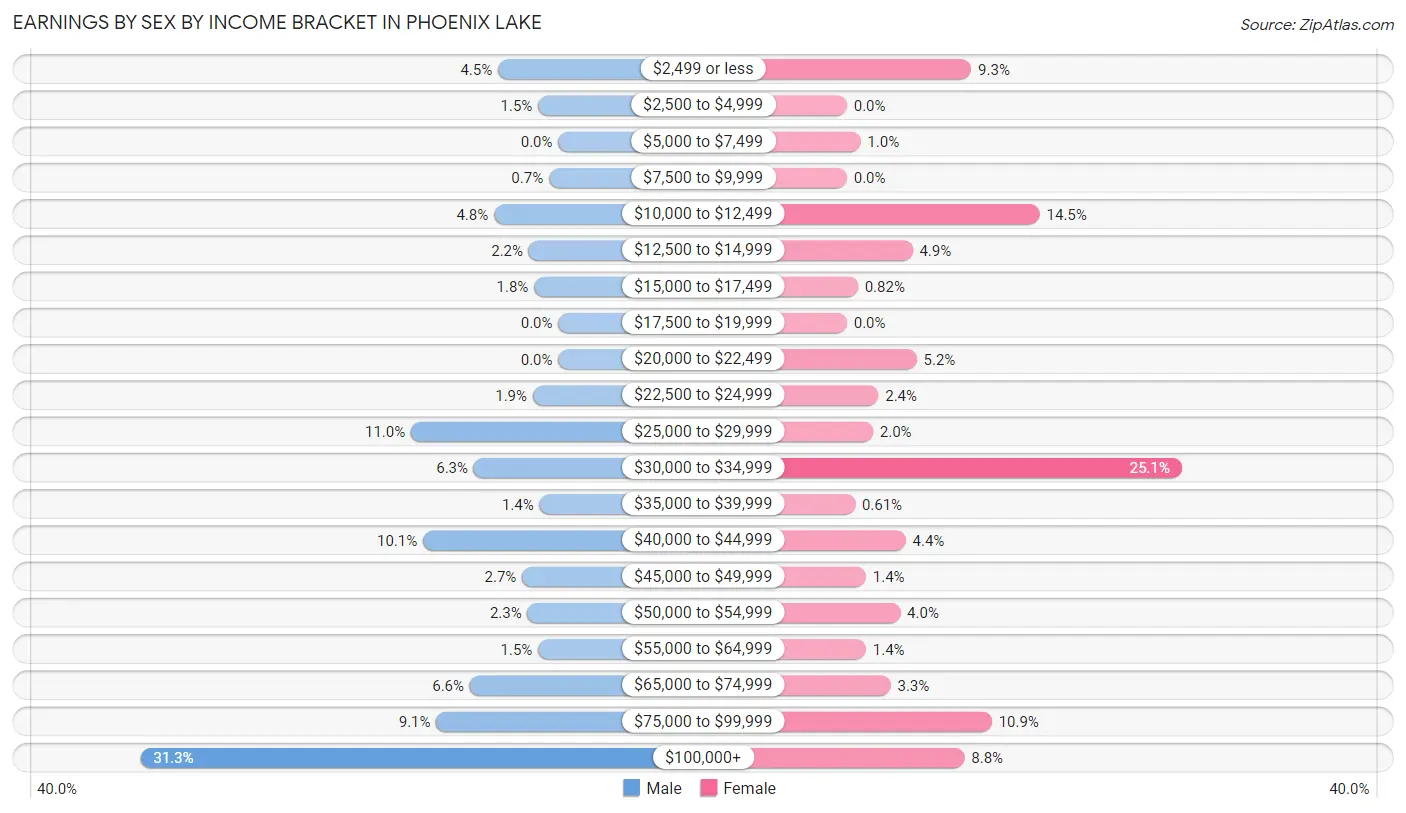
| Income | Male | Female |
| $2,499 or less | 45 (4.5%) | 91 (9.3%) |
| $2,500 to $4,999 | 15 (1.5%) | 0 (0.0%) |
| $5,000 to $7,499 | 0 (0.0%) | 10 (1.0%) |
| $7,500 to $9,999 | 7 (0.7%) | 0 (0.0%) |
| $10,000 to $12,499 | 48 (4.8%) | 141 (14.4%) |
| $12,500 to $14,999 | 22 (2.2%) | 48 (4.9%) |
| $15,000 to $17,499 | 18 (1.8%) | 8 (0.8%) |
| $17,500 to $19,999 | 0 (0.0%) | 0 (0.0%) |
| $20,000 to $22,499 | 0 (0.0%) | 51 (5.2%) |
| $22,500 to $24,999 | 19 (1.9%) | 23 (2.4%) |
| $25,000 to $29,999 | 110 (11.0%) | 19 (1.9%) |
| $30,000 to $34,999 | 63 (6.3%) | 245 (25.1%) |
| $35,000 to $39,999 | 14 (1.4%) | 6 (0.6%) |
| $40,000 to $44,999 | 101 (10.1%) | 43 (4.4%) |
| $45,000 to $49,999 | 27 (2.7%) | 14 (1.4%) |
| $50,000 to $54,999 | 23 (2.3%) | 39 (4.0%) |
| $55,000 to $64,999 | 15 (1.5%) | 14 (1.4%) |
| $65,000 to $74,999 | 66 (6.6%) | 32 (3.3%) |
| $75,000 to $99,999 | 91 (9.1%) | 106 (10.9%) |
| $100,000+ | 312 (31.3%) | 86 (8.8%) |
| Total | 996 (100.0%) | 976 (100.0%) |
Earnings by Sex by Educational Attainment in Phoenix Lake
Average earnings in Phoenix Lake are $53,125 for men and $34,324 for women, a difference of 35.4%. Men with an educational attainment of bachelor's degree enjoy the highest average annual earnings of $188,054, while those with high school diploma education earn the least with $41,265. Women with an educational attainment of graduate degree earn the most with the average annual earnings of $88,854, while those with bachelor's degree education have the smallest earnings of $25,714.
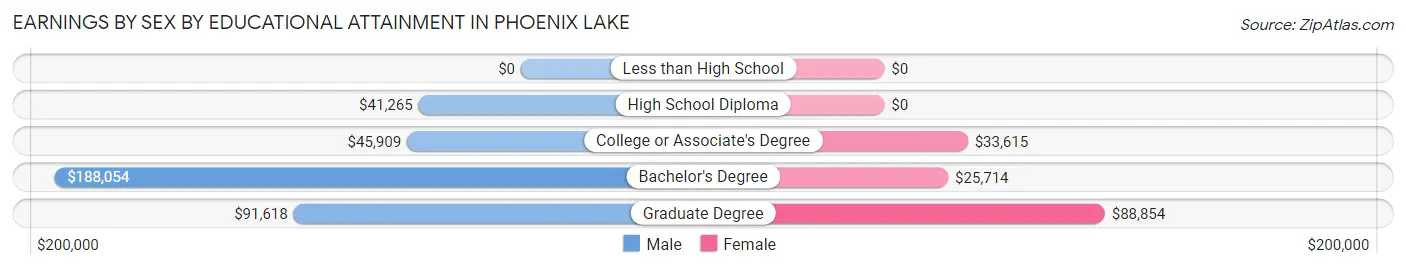
| Educational Attainment | Male Income | Female Income |
| Less than High School | - | - |
| High School Diploma | $41,265 | $0 |
| College or Associate's Degree | $45,909 | $33,615 |
| Bachelor's Degree | $188,054 | $25,714 |
| Graduate Degree | $91,618 | $88,854 |
| Total | $53,125 | $34,324 |
Family Income in Phoenix Lake
Family Income Brackets in Phoenix Lake
According to the Phoenix Lake family income data, there are 269 families falling into the $200,000+ income range, which is the most common income bracket and makes up 23.8% of all families.
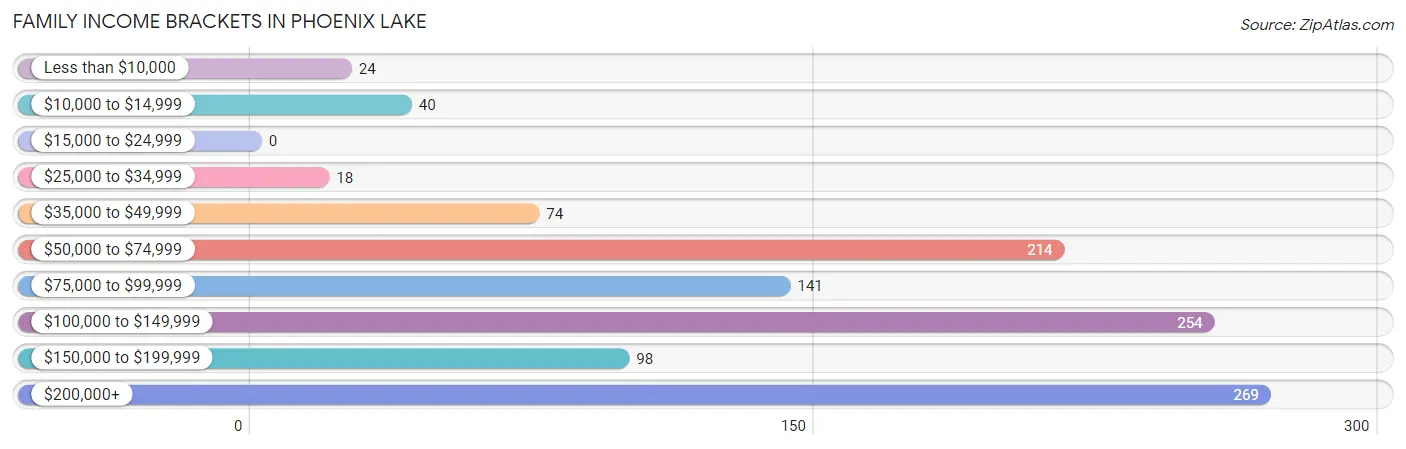
| Income Bracket | # Families | % Families |
| Less than $10,000 | 24 | 2.1% |
| $10,000 to $14,999 | 40 | 3.5% |
| $15,000 to $24,999 | 0 | 0.0% |
| $25,000 to $34,999 | 18 | 1.6% |
| $35,000 to $49,999 | 74 | 6.5% |
| $50,000 to $74,999 | 214 | 18.9% |
| $75,000 to $99,999 | 141 | 12.5% |
| $100,000 to $149,999 | 254 | 22.5% |
| $150,000 to $199,999 | 98 | 8.7% |
| $200,000+ | 269 | 23.8% |
Family Income by Famaliy Size in Phoenix Lake
4-person families (85 | 7.5%) account for the highest median family income in Phoenix Lake with $176,544 per family, while 2-person families (797 | 70.5%) have the highest median income of $47,598 per family member.
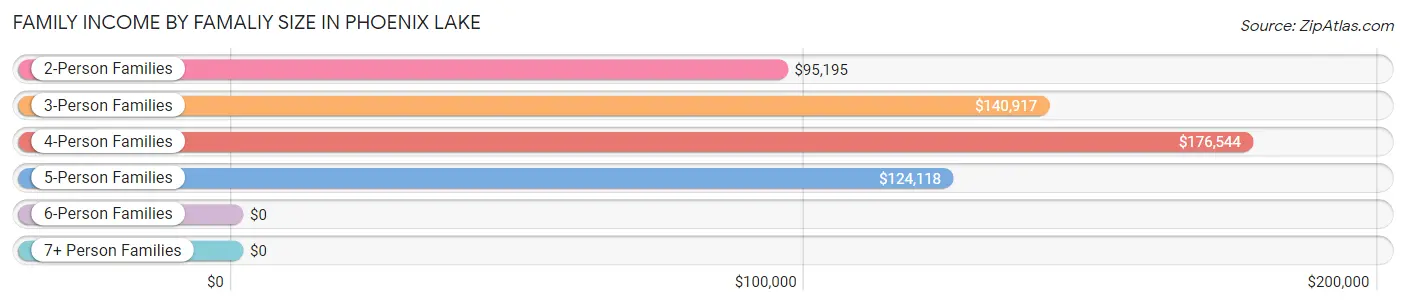
| Income Bracket | # Families | Median Income |
| 2-Person Families | 797 (70.5%) | $95,195 |
| 3-Person Families | 121 (10.7%) | $140,917 |
| 4-Person Families | 85 (7.5%) | $176,544 |
| 5-Person Families | 92 (8.1%) | $124,118 |
| 6-Person Families | 36 (3.2%) | $0 |
| 7+ Person Families | 0 (0.0%) | $0 |
| Total | 1,131 (100.0%) | $108,191 |
Family Income by Number of Earners in Phoenix Lake
The median family income in Phoenix Lake is $108,191, with families comprising 3+ earners (46) having the highest median family income of $250,001, while families with no earners (323) have the lowest median family income of $57,031, accounting for 4.1% and 28.6% of families, respectively.
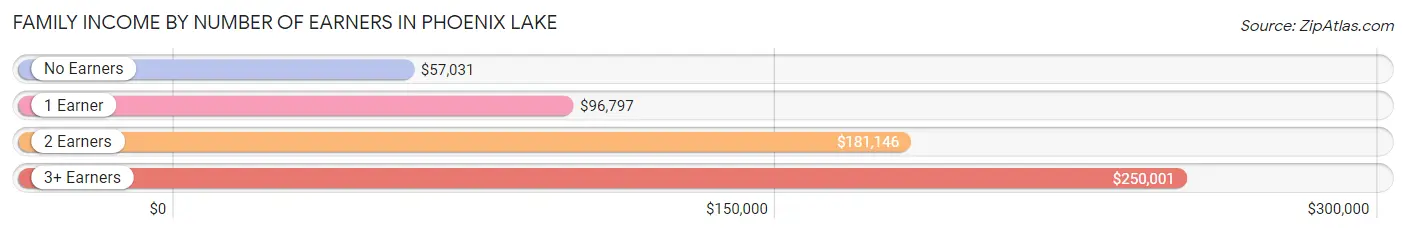
| Number of Earners | # Families | Median Income |
| No Earners | 323 (28.6%) | $57,031 |
| 1 Earner | 335 (29.6%) | $96,797 |
| 2 Earners | 427 (37.8%) | $181,146 |
| 3+ Earners | 46 (4.1%) | $250,001 |
| Total | 1,131 (100.0%) | $108,191 |
Household Income in Phoenix Lake
Household Income Brackets in Phoenix Lake
With 476 households falling in the category, the $50,000 to $74,999 income range is the most frequent in Phoenix Lake, accounting for 23.7% of all households. In contrast, only 70 households (3.5%) fall into the less than $10,000 income bracket, making it the least populous group.
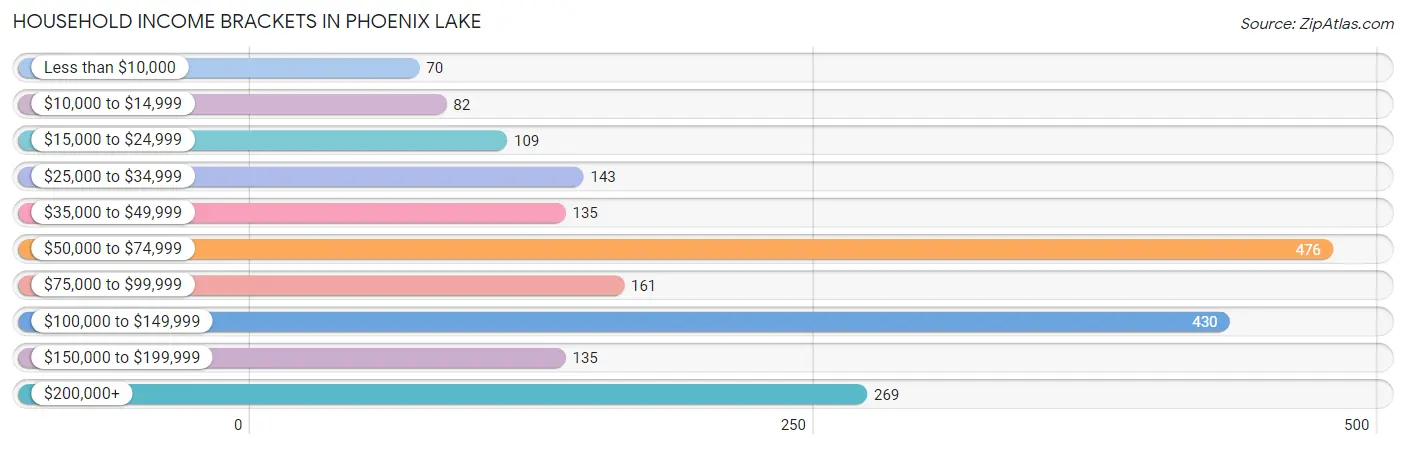
| Income Bracket | # Households | % Households |
| Less than $10,000 | 70 | 3.5% |
| $10,000 to $14,999 | 82 | 4.1% |
| $15,000 to $24,999 | 109 | 5.4% |
| $25,000 to $34,999 | 143 | 7.1% |
| $35,000 to $49,999 | 135 | 6.7% |
| $50,000 to $74,999 | 476 | 23.7% |
| $75,000 to $99,999 | 161 | 8.0% |
| $100,000 to $149,999 | 430 | 21.4% |
| $150,000 to $199,999 | 135 | 6.7% |
| $200,000+ | 269 | 13.4% |
Household Income by Householder Age in Phoenix Lake
The median household income in Phoenix Lake is $72,173, with the highest median household income of $124,412 found in the 25 to 44 years age bracket for the primary householder. A total of 160 households (8.0%) fall into this category. Meanwhile, the 15 to 24 years age bracket for the primary householder has the lowest median household income of $0, with 48 households (2.4%) in this group.
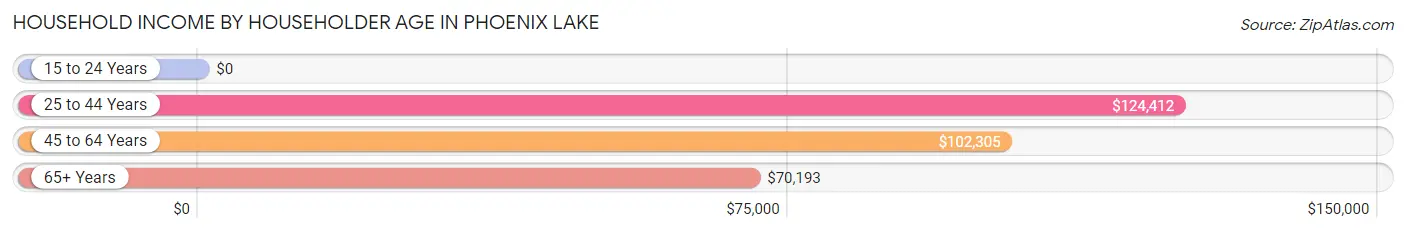
| Income Bracket | # Households | Median Income |
| 15 to 24 Years | 48 (2.4%) | $0 |
| 25 to 44 Years | 160 (8.0%) | $124,412 |
| 45 to 64 Years | 867 (43.1%) | $102,305 |
| 65+ Years | 935 (46.5%) | $70,193 |
| Total | 2,010 (100.0%) | $72,173 |
Poverty in Phoenix Lake
Income Below Poverty by Sex and Age in Phoenix Lake
With 6.3% poverty level for males and 9.4% for females among the residents of Phoenix Lake, 5 year old males and 45 to 54 year old females are the most vulnerable to poverty, with 24 males (54.5%) and 39 females (21.3%) in their respective age groups living below the poverty level.
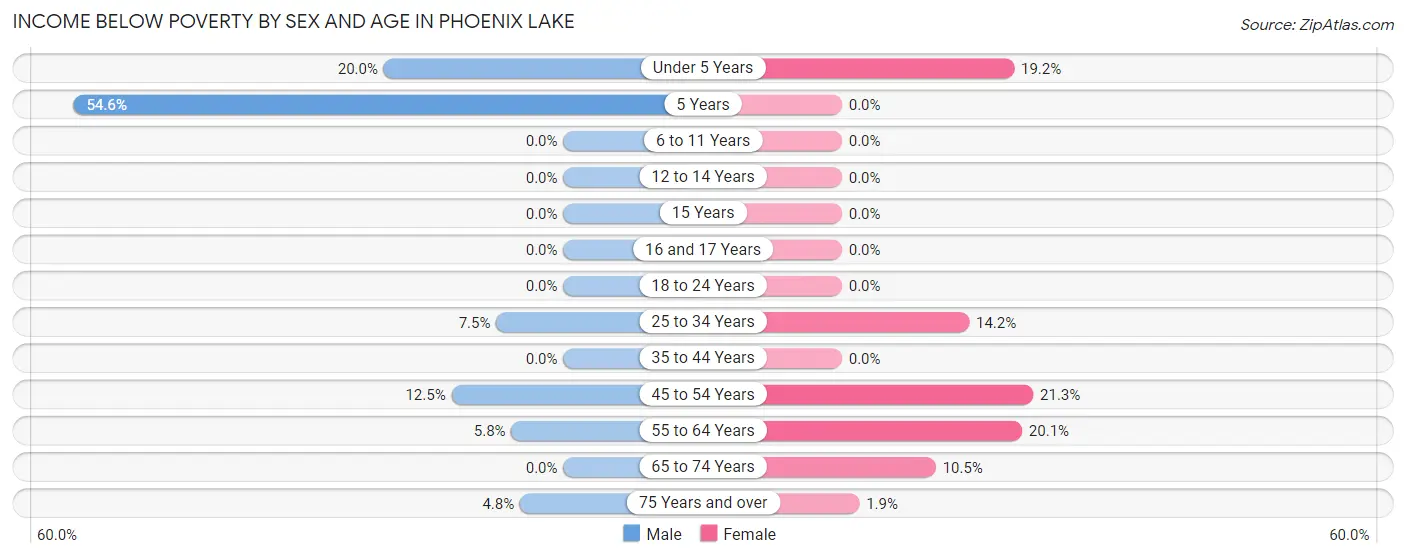
| Age Bracket | Male | Female |
| Under 5 Years | 13 (20.0%) | 14 (19.2%) |
| 5 Years | 24 (54.5%) | 0 (0.0%) |
| 6 to 11 Years | 0 (0.0%) | 0 (0.0%) |
| 12 to 14 Years | 0 (0.0%) | 0 (0.0%) |
| 15 Years | 0 (0.0%) | 0 (0.0%) |
| 16 and 17 Years | 0 (0.0%) | 0 (0.0%) |
| 18 to 24 Years | 0 (0.0%) | 0 (0.0%) |
| 25 to 34 Years | 13 (7.5%) | 17 (14.2%) |
| 35 to 44 Years | 0 (0.0%) | 0 (0.0%) |
| 45 to 54 Years | 40 (12.5%) | 39 (21.3%) |
| 55 to 64 Years | 32 (5.8%) | 72 (20.1%) |
| 65 to 74 Years | 0 (0.0%) | 55 (10.5%) |
| 75 Years and over | 15 (4.8%) | 7 (1.9%) |
| Total | 137 (6.3%) | 204 (9.4%) |
Income Above Poverty by Sex and Age in Phoenix Lake
According to the poverty statistics in Phoenix Lake, males aged 6 to 11 years and females aged 6 to 11 years are the age groups that are most secure financially, with 100.0% of males and 100.0% of females in these age groups living above the poverty line.
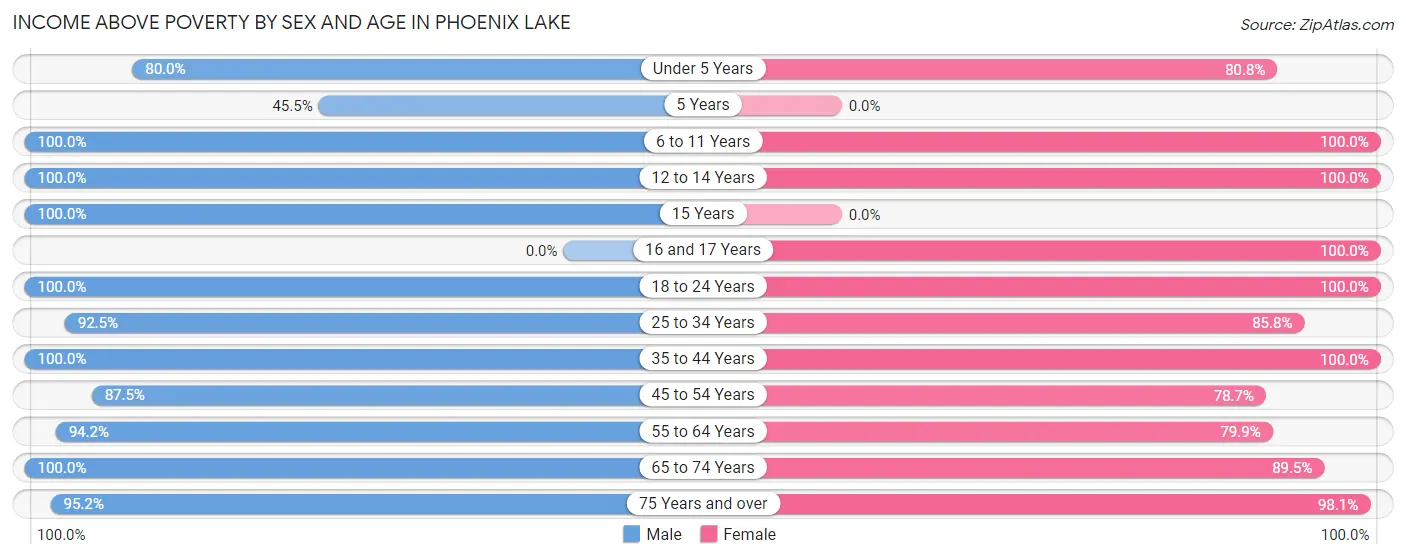
| Age Bracket | Male | Female |
| Under 5 Years | 52 (80.0%) | 59 (80.8%) |
| 5 Years | 20 (45.5%) | 0 (0.0%) |
| 6 to 11 Years | 76 (100.0%) | 54 (100.0%) |
| 12 to 14 Years | 23 (100.0%) | 68 (100.0%) |
| 15 Years | 70 (100.0%) | 0 (0.0%) |
| 16 and 17 Years | 0 (0.0%) | 4 (100.0%) |
| 18 to 24 Years | 131 (100.0%) | 298 (100.0%) |
| 25 to 34 Years | 161 (92.5%) | 103 (85.8%) |
| 35 to 44 Years | 59 (100.0%) | 135 (100.0%) |
| 45 to 54 Years | 281 (87.5%) | 144 (78.7%) |
| 55 to 64 Years | 522 (94.2%) | 287 (79.9%) |
| 65 to 74 Years | 334 (100.0%) | 471 (89.5%) |
| 75 Years and over | 296 (95.2%) | 353 (98.1%) |
| Total | 2,025 (93.7%) | 1,976 (90.6%) |
Income Below Poverty Among Married-Couple Families in Phoenix Lake
The poverty statistics for married-couple families in Phoenix Lake show that 6.5% or 57 of the total 876 families live below the poverty line. Families with 3 or 4 children have the highest poverty rate of 34.0%, comprising of 17 families. On the other hand, families with 1 or 2 children have the lowest poverty rate of 0.0%, which includes 0 families.
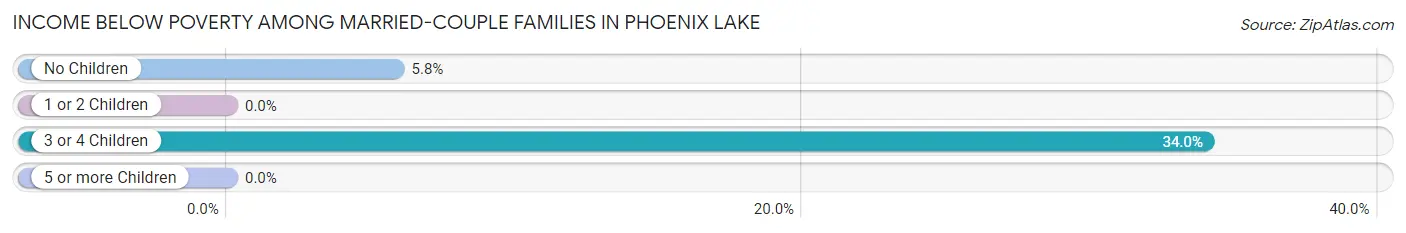
| Children | Above Poverty | Below Poverty |
| No Children | 650 (94.2%) | 40 (5.8%) |
| 1 or 2 Children | 136 (100.0%) | 0 (0.0%) |
| 3 or 4 Children | 33 (66.0%) | 17 (34.0%) |
| 5 or more Children | 0 (0.0%) | 0 (0.0%) |
| Total | 819 (93.5%) | 57 (6.5%) |
Income Below Poverty Among Single-Parent Households in Phoenix Lake
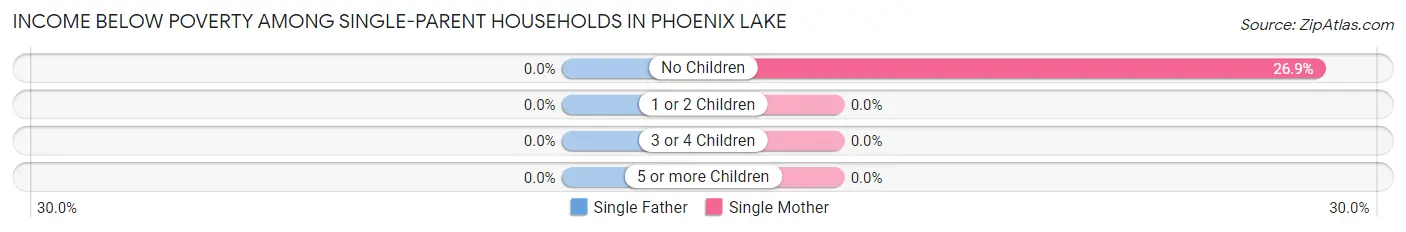
| Children | Single Father | Single Mother |
| No Children | 0 (0.0%) | 7 (26.9%) |
| 1 or 2 Children | 0 (0.0%) | 0 (0.0%) |
| 3 or 4 Children | 0 (0.0%) | 0 (0.0%) |
| 5 or more Children | 0 (0.0%) | 0 (0.0%) |
| Total | 0 (0.0%) | 7 (10.8%) |
Income Below Poverty Among Married-Couple vs Single-Parent Households in Phoenix Lake
The poverty data for Phoenix Lake shows that 57 of the married-couple family households (6.5%) and 7 of the single-parent households (2.8%) are living below the poverty level. Within the married-couple family households, those with 3 or 4 children have the highest poverty rate, with 17 households (34.0%) falling below the poverty line. Among the single-parent households, those with no children have the highest poverty rate, with 7 household (4.2%) living below poverty.
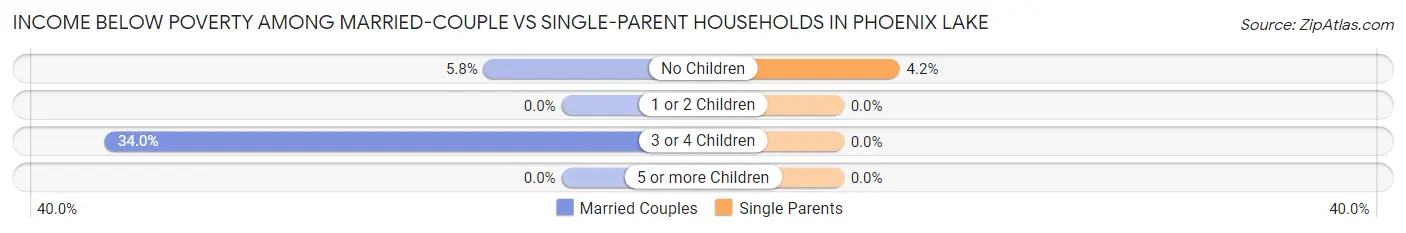
| Children | Married-Couple Families | Single-Parent Households |
| No Children | 40 (5.8%) | 7 (4.2%) |
| 1 or 2 Children | 0 (0.0%) | 0 (0.0%) |
| 3 or 4 Children | 17 (34.0%) | 0 (0.0%) |
| 5 or more Children | 0 (0.0%) | 0 (0.0%) |
| Total | 57 (6.5%) | 7 (2.8%) |
Race in Phoenix Lake
The most populous races in Phoenix Lake are White / Caucasian (4,012 | 91.7%), Two or more Races (273 | 6.2%), and Hispanic or Latino (218 | 5.0%).
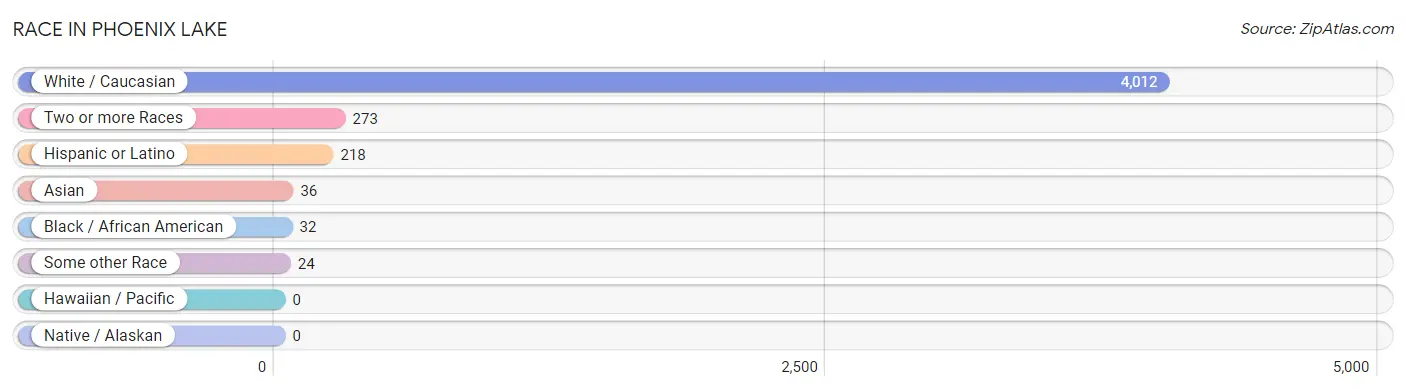
| Race | # Population | % Population |
| Asian | 36 | 0.8% |
| Black / African American | 32 | 0.7% |
| Hawaiian / Pacific | 0 | 0.0% |
| Hispanic or Latino | 218 | 5.0% |
| Native / Alaskan | 0 | 0.0% |
| White / Caucasian | 4,012 | 91.7% |
| Two or more Races | 273 | 6.2% |
| Some other Race | 24 | 0.5% |
| Total | 4,377 | 100.0% |
Ancestry in Phoenix Lake
The most populous ancestries reported in Phoenix Lake are German (888 | 20.3%), English (785 | 17.9%), Irish (653 | 14.9%), Italian (403 | 9.2%), and Portuguese (202 | 4.6%), together accounting for 67.0% of all Phoenix Lake residents.
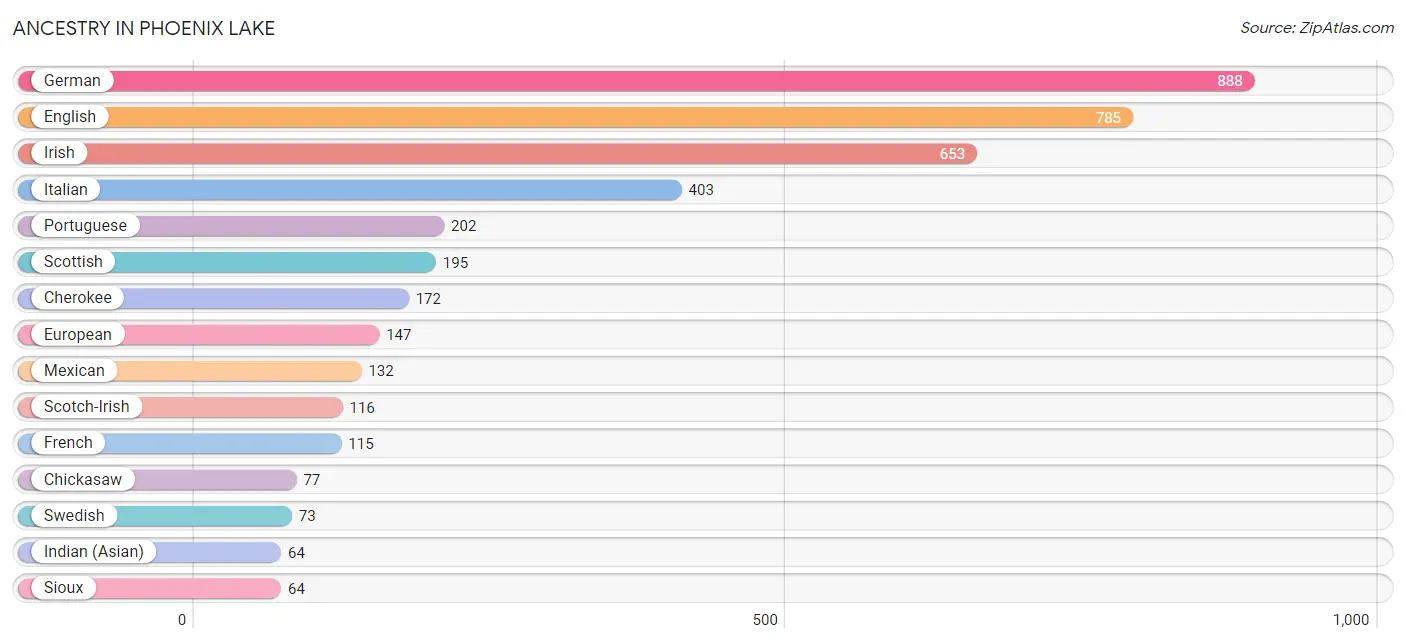
| Ancestry | # Population | % Population |
| American | 13 | 0.3% |
| Bhutanese | 45 | 1.0% |
| British | 50 | 1.1% |
| Canadian | 18 | 0.4% |
| Central American | 63 | 1.4% |
| Cherokee | 172 | 3.9% |
| Chickasaw | 77 | 1.8% |
| Czech | 17 | 0.4% |
| Danish | 10 | 0.2% |
| Dutch | 19 | 0.4% |
| English | 785 | 17.9% |
| European | 147 | 3.4% |
| Filipino | 11 | 0.3% |
| French | 115 | 2.6% |
| French American Indian | 29 | 0.7% |
| German | 888 | 20.3% |
| Hungarian | 29 | 0.7% |
| Indian (Asian) | 64 | 1.5% |
| Irish | 653 | 14.9% |
| Italian | 403 | 9.2% |
| Mexican | 132 | 3.0% |
| Polish | 62 | 1.4% |
| Portuguese | 202 | 4.6% |
| Romanian | 55 | 1.3% |
| Russian | 55 | 1.3% |
| Salvadoran | 63 | 1.4% |
| Scotch-Irish | 116 | 2.6% |
| Scottish | 195 | 4.5% |
| Sioux | 64 | 1.5% |
| Slavic | 12 | 0.3% |
| Spanish | 23 | 0.5% |
| Sri Lankan | 25 | 0.6% |
| Swedish | 73 | 1.7% |
| Swiss | 41 | 0.9% |
| Turkish | 12 | 0.3% |
| Welsh | 23 | 0.5% |
| Yugoslavian | 10 | 0.2% | View All 37 Rows |
Immigrants in Phoenix Lake
The most numerous immigrant groups reported in Phoenix Lake came from Central America (63 | 1.4%), El Salvador (63 | 1.4%), Latin America (63 | 1.4%), Europe (49 | 1.1%), and Western Europe (35 | 0.8%), together accounting for 6.2% of all Phoenix Lake residents.
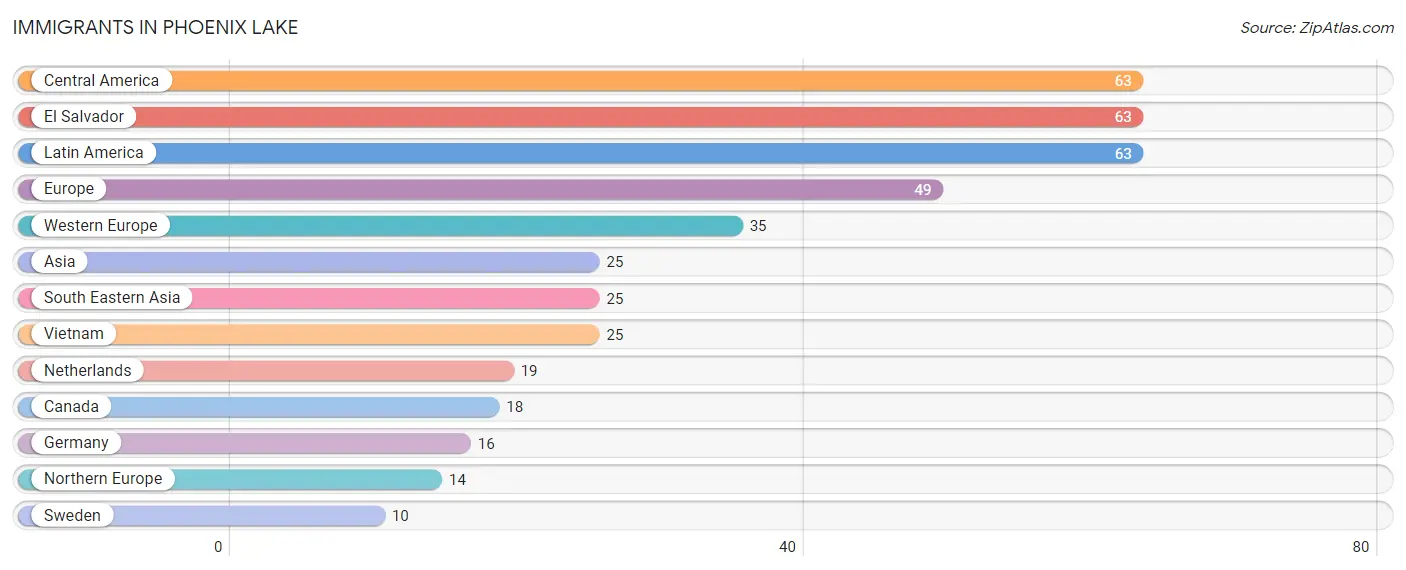
| Immigration Origin | # Population | % Population |
| Asia | 25 | 0.6% |
| Canada | 18 | 0.4% |
| Central America | 63 | 1.4% |
| El Salvador | 63 | 1.4% |
| Europe | 49 | 1.1% |
| Germany | 16 | 0.4% |
| Latin America | 63 | 1.4% |
| Netherlands | 19 | 0.4% |
| Northern Europe | 14 | 0.3% |
| South Eastern Asia | 25 | 0.6% |
| Sweden | 10 | 0.2% |
| Vietnam | 25 | 0.6% |
| Western Europe | 35 | 0.8% | View All 13 Rows |
Sex and Age in Phoenix Lake
Sex and Age in Phoenix Lake
The most populous age groups in Phoenix Lake are 60 to 64 Years (289 | 13.4%) for men and 20 to 24 Years (298 | 13.5%) for women.
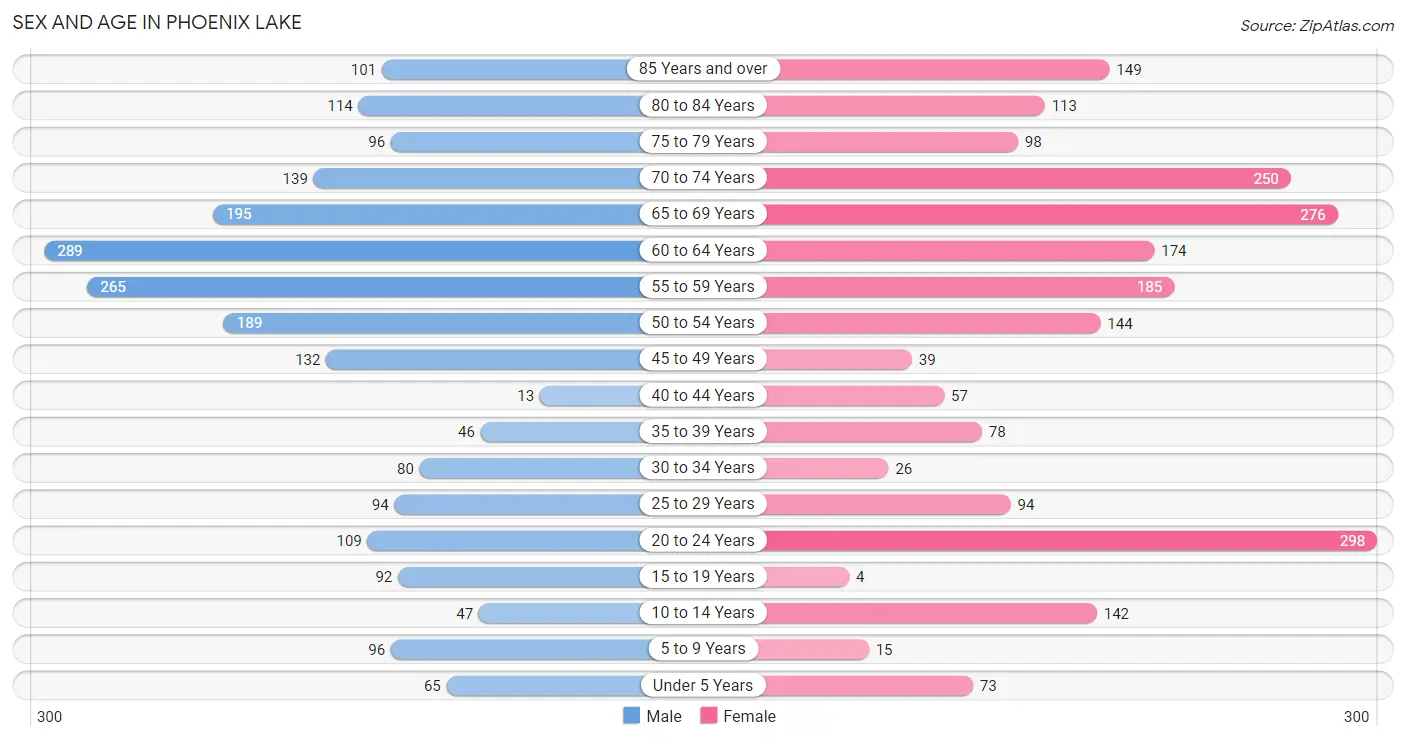
| Age Bracket | Male | Female |
| Under 5 Years | 65 (3.0%) | 73 (3.3%) |
| 5 to 9 Years | 96 (4.4%) | 15 (0.7%) |
| 10 to 14 Years | 47 (2.2%) | 142 (6.4%) |
| 15 to 19 Years | 92 (4.3%) | 4 (0.2%) |
| 20 to 24 Years | 109 (5.0%) | 298 (13.5%) |
| 25 to 29 Years | 94 (4.3%) | 94 (4.2%) |
| 30 to 34 Years | 80 (3.7%) | 26 (1.2%) |
| 35 to 39 Years | 46 (2.1%) | 78 (3.5%) |
| 40 to 44 Years | 13 (0.6%) | 57 (2.6%) |
| 45 to 49 Years | 132 (6.1%) | 39 (1.8%) |
| 50 to 54 Years | 189 (8.7%) | 144 (6.5%) |
| 55 to 59 Years | 265 (12.3%) | 185 (8.4%) |
| 60 to 64 Years | 289 (13.4%) | 174 (7.9%) |
| 65 to 69 Years | 195 (9.0%) | 276 (12.5%) |
| 70 to 74 Years | 139 (6.4%) | 250 (11.3%) |
| 75 to 79 Years | 96 (4.4%) | 98 (4.4%) |
| 80 to 84 Years | 114 (5.3%) | 113 (5.1%) |
| 85 Years and over | 101 (4.7%) | 149 (6.7%) |
| Total | 2,162 (100.0%) | 2,215 (100.0%) |
Families and Households in Phoenix Lake
Median Family Size in Phoenix Lake
The median family size in Phoenix Lake is 2.73 persons per family, with single female/mother families (65 | 5.8%) accounting for the largest median family size of 3.38 persons per family. On the other hand, single male/father families (190 | 16.8%) represent the smallest median family size with 2.09 persons per family.
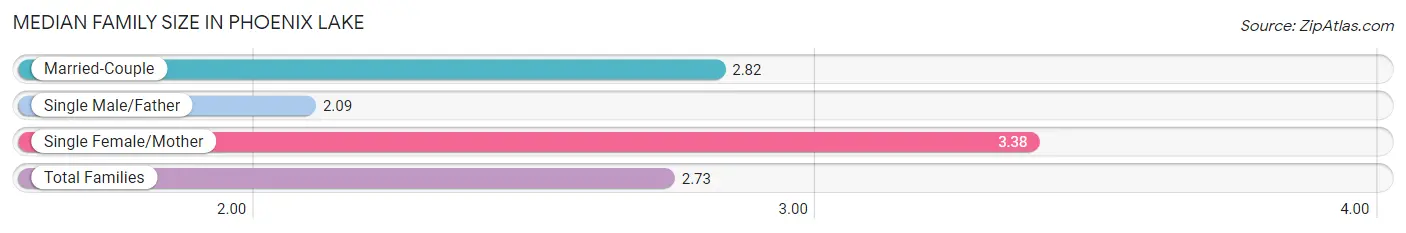
| Family Type | # Families | Family Size |
| Married-Couple | 876 (77.4%) | 2.82 |
| Single Male/Father | 190 (16.8%) | 2.09 |
| Single Female/Mother | 65 (5.8%) | 3.38 |
| Total Families | 1,131 (100.0%) | 2.73 |
Median Household Size in Phoenix Lake
The median household size in Phoenix Lake is 2.18 persons per household, with single female/mother households (65 | 3.2%) accounting for the largest median household size of 3.83 persons per household. non-family households (879 | 43.7%) represent the smallest median household size with 1.29 persons per household.
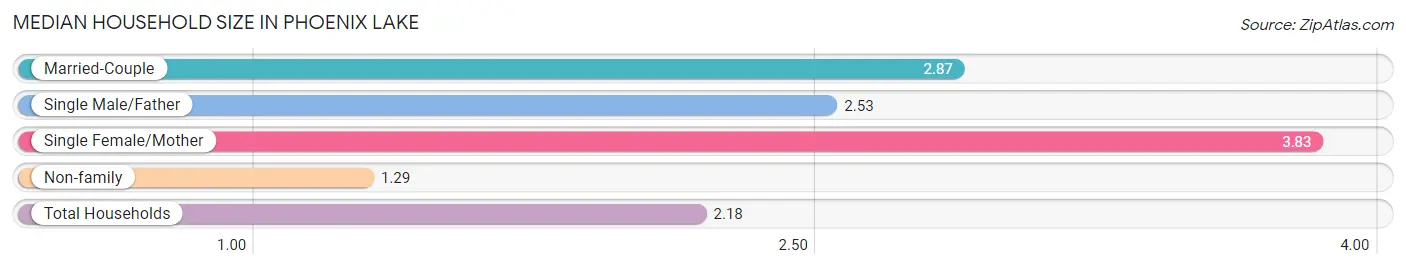
| Household Type | # Households | Household Size |
| Married-Couple | 876 (43.6%) | 2.87 |
| Single Male/Father | 190 (9.5%) | 2.53 |
| Single Female/Mother | 65 (3.2%) | 3.83 |
| Non-family | 879 (43.7%) | 1.29 |
| Total Households | 2,010 (100.0%) | 2.18 |
Household Size by Marriage Status in Phoenix Lake
Out of a total of 2,010 households in Phoenix Lake, 1,131 (56.3%) are family households, while 879 (43.7%) are nonfamily households. The most numerous type of family households are 2-person households, comprising 699, and the most common type of nonfamily households are 1-person households, comprising 702.
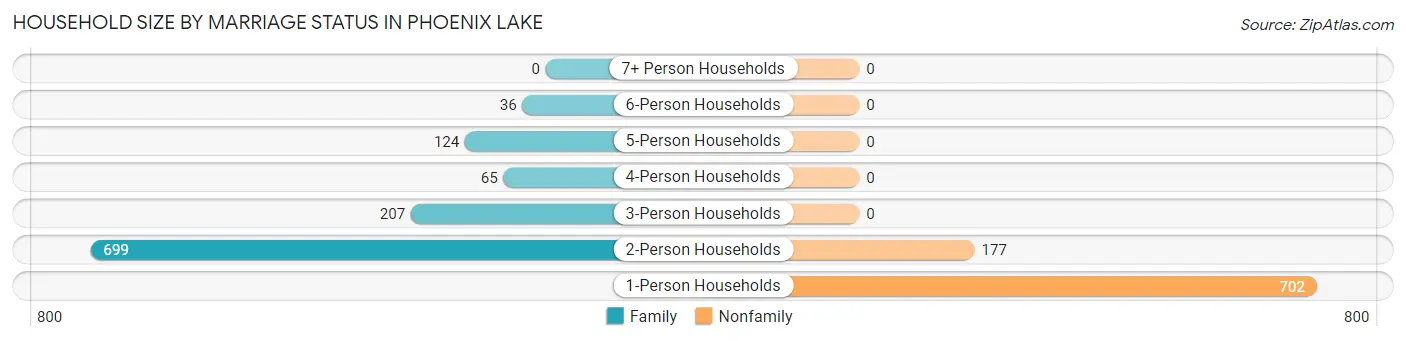
| Household Size | Family Households | Nonfamily Households |
| 1-Person Households | - | 702 (34.9%) |
| 2-Person Households | 699 (34.8%) | 177 (8.8%) |
| 3-Person Households | 207 (10.3%) | 0 (0.0%) |
| 4-Person Households | 65 (3.2%) | 0 (0.0%) |
| 5-Person Households | 124 (6.2%) | 0 (0.0%) |
| 6-Person Households | 36 (1.8%) | 0 (0.0%) |
| 7+ Person Households | 0 (0.0%) | 0 (0.0%) |
| Total | 1,131 (56.3%) | 879 (43.7%) |
Female Fertility in Phoenix Lake
Fertility by Age in Phoenix Lake
Average fertility rate in Phoenix Lake is 75.0 births per 1,000 women. Women in the age bracket of 20 to 34 years have the highest fertility rate with 120.0 births per 1,000 women. Women in the age bracket of 20 to 34 years acount for 100.0% of all women with births.
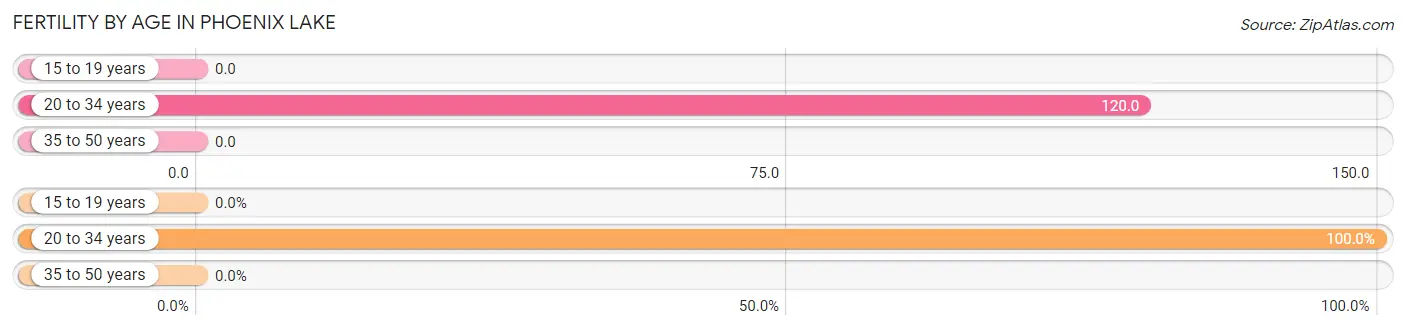
| Age Bracket | Women with Births | Births / 1,000 Women |
| 15 to 19 years | 0 (0.0%) | 0.0 |
| 20 to 34 years | 50 (100.0%) | 120.0 |
| 35 to 50 years | 0 (0.0%) | 0.0 |
| Total | 50 (100.0%) | 75.0 |
Fertility by Age by Marriage Status in Phoenix Lake
18.0% of women with births (50) in Phoenix Lake are married. The highest percentage of unmarried women with births falls into 20 to 34 years age bracket with 82.0% of them unmarried at the time of birth, while the lowest percentage of unmarried women with births belong to 20 to 34 years age bracket with 82.0% of them unmarried.
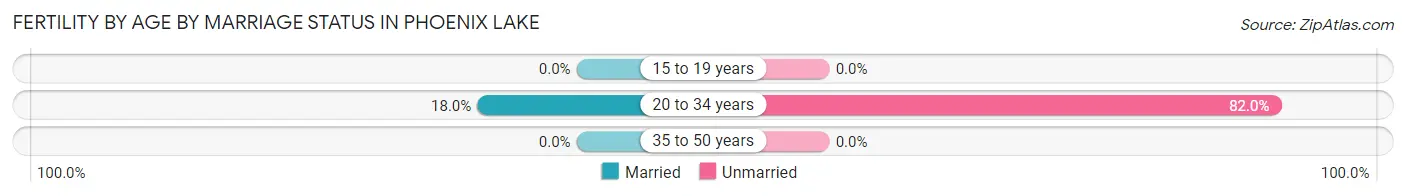
| Age Bracket | Married | Unmarried |
| 15 to 19 years | 0 (0.0%) | 0 (0.0%) |
| 20 to 34 years | 9 (18.0%) | 41 (82.0%) |
| 35 to 50 years | 0 (0.0%) | 0 (0.0%) |
| Total | 9 (18.0%) | 41 (82.0%) |
Fertility by Education in Phoenix Lake
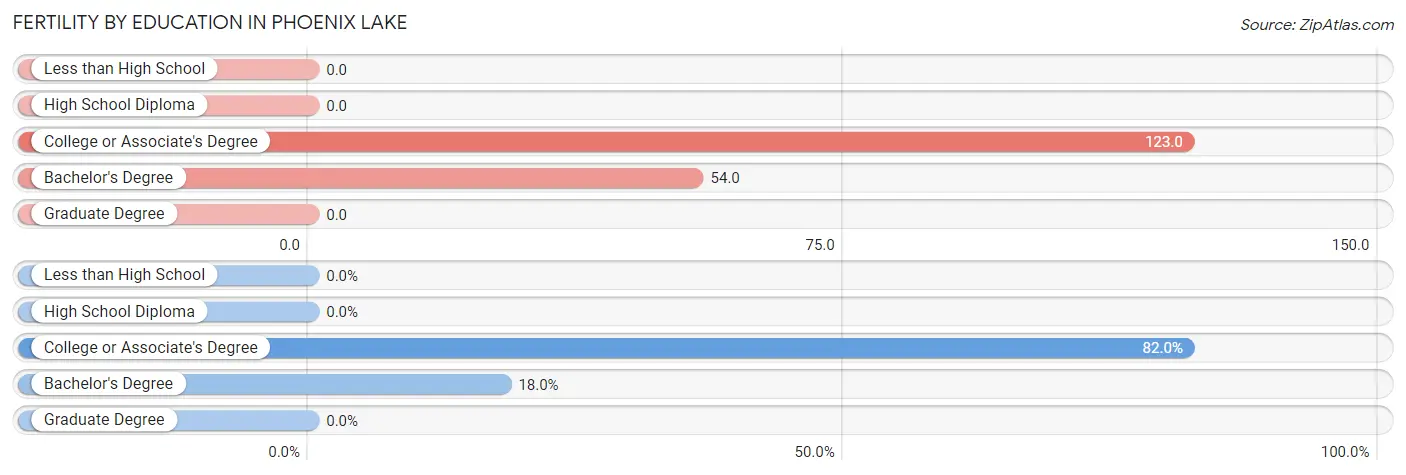
| Educational Attainment | Women with Births | Births / 1,000 Women |
| Less than High School | 0 (0.0%) | 0.0 |
| High School Diploma | 0 (0.0%) | 0.0 |
| College or Associate's Degree | 41 (82.0%) | 123.0 |
| Bachelor's Degree | 9 (18.0%) | 54.0 |
| Graduate Degree | 0 (0.0%) | 0.0 |
| Total | 50 (100.0%) | 75.0 |
Fertility by Education by Marriage Status in Phoenix Lake
82.0% of women with births in Phoenix Lake are unmarried. Women with the educational attainment of bachelor's degree are most likely to be married with 100.0% of them married at childbirth, while women with the educational attainment of college or associate's degree are least likely to be married with 100.0% of them unmarried at childbirth.
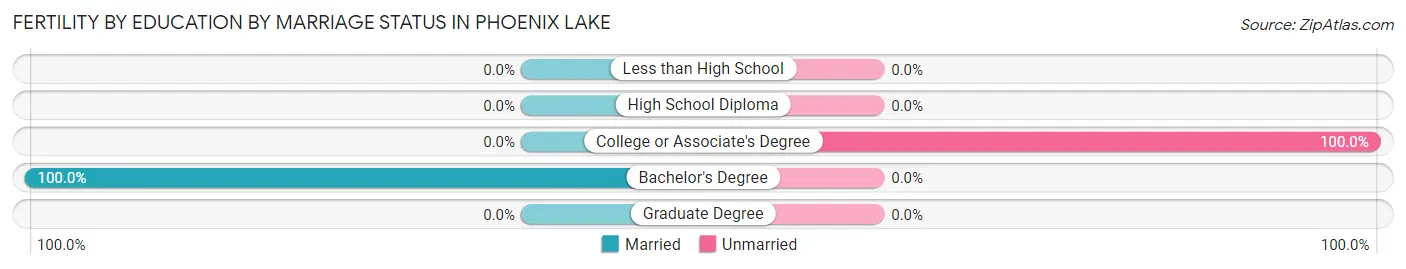
| Educational Attainment | Married | Unmarried |
| Less than High School | 0 (0.0%) | 0 (0.0%) |
| High School Diploma | 0 (0.0%) | 0 (0.0%) |
| College or Associate's Degree | 0 (0.0%) | 41 (100.0%) |
| Bachelor's Degree | 9 (100.0%) | 0 (0.0%) |
| Graduate Degree | 0 (0.0%) | 0 (0.0%) |
| Total | 9 (18.0%) | 41 (82.0%) |
Employment Characteristics in Phoenix Lake
Employment by Class of Employer in Phoenix Lake
Among the 1,561 employed individuals in Phoenix Lake, private company employees (889 | 57.0%), state government employees (206 | 13.2%), and local government employees (154 | 9.9%) make up the most common classes of employment.
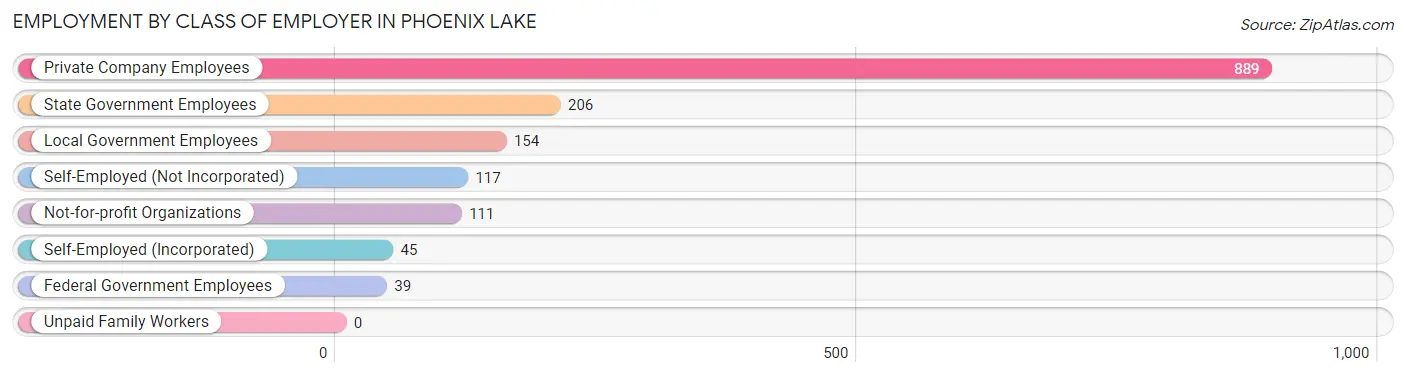
| Employer Class | # Employees | % Employees |
| Private Company Employees | 889 | 57.0% |
| Self-Employed (Incorporated) | 45 | 2.9% |
| Self-Employed (Not Incorporated) | 117 | 7.5% |
| Not-for-profit Organizations | 111 | 7.1% |
| Local Government Employees | 154 | 9.9% |
| State Government Employees | 206 | 13.2% |
| Federal Government Employees | 39 | 2.5% |
| Unpaid Family Workers | 0 | 0.0% |
| Total | 1,561 | 100.0% |
Employment Status by Age in Phoenix Lake
According to the labor force statistics for Phoenix Lake, out of the total population over 16 years of age (3,869), 45.3% or 1,753 individuals are in the labor force, with 5.8% or 102 of them unemployed. The age group with the highest labor force participation rate is 25 to 29 years, with 100.0% or 188 individuals in the labor force. Within the labor force, the 75 years and over age range has the highest percentage of unemployed individuals, with 51.5% or 17 of them being unemployed.
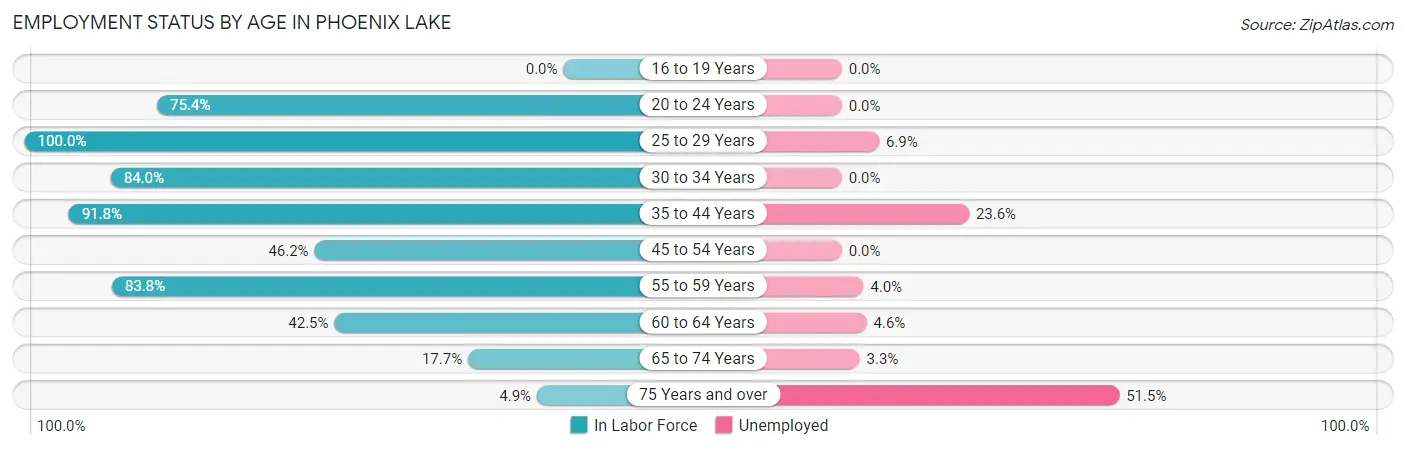
| Age Bracket | In Labor Force | Unemployed |
| 16 to 19 Years | 0 (0.0%) | 0 (0.0%) |
| 20 to 24 Years | 307 (75.4%) | 0 (0.0%) |
| 25 to 29 Years | 188 (100.0%) | 13 (6.9%) |
| 30 to 34 Years | 89 (84.0%) | 0 (0.0%) |
| 35 to 44 Years | 178 (91.8%) | 42 (23.6%) |
| 45 to 54 Years | 233 (46.2%) | 0 (0.0%) |
| 55 to 59 Years | 377 (83.8%) | 15 (4.0%) |
| 60 to 64 Years | 197 (42.5%) | 9 (4.6%) |
| 65 to 74 Years | 152 (17.7%) | 5 (3.3%) |
| 75 Years and over | 33 (4.9%) | 17 (51.5%) |
| Total | 1,753 (45.3%) | 102 (5.8%) |
Employment Status by Educational Attainment in Phoenix Lake
According to labor force statistics for Phoenix Lake, 66.2% of individuals (1,261) out of the total population between 25 and 64 years of age (1,905) are in the labor force, with 6.3% or 79 of them being unemployed. The group with the highest labor force participation rate are those with the educational attainment of bachelor's degree or higher, with 86.0% or 479 individuals in the labor force. Within the labor force, individuals with less than high school education have the highest percentage of unemployment, with 52.6% or 30 of them being unemployed.
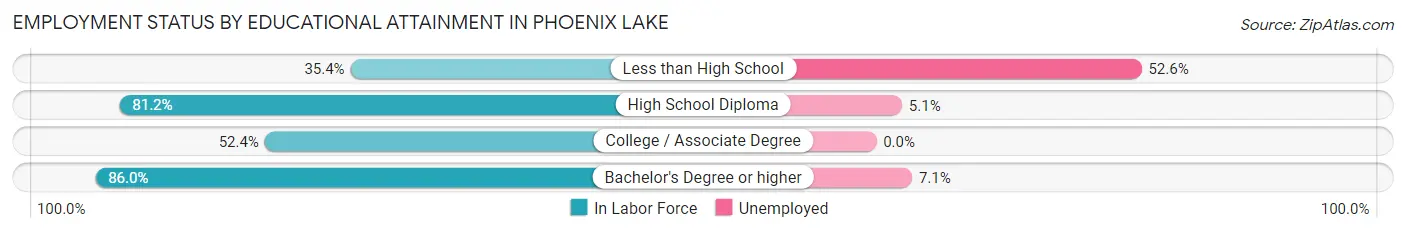
| Educational Attainment | In Labor Force | Unemployed |
| Less than High School | 57 (35.4%) | 85 (52.6%) |
| High School Diploma | 294 (81.2%) | 18 (5.1%) |
| College / Associate Degree | 432 (52.4%) | 0 (0.0%) |
| Bachelor's Degree or higher | 479 (86.0%) | 40 (7.1%) |
| Total | 1,261 (66.2%) | 120 (6.3%) |
Employment Occupations by Sex in Phoenix Lake
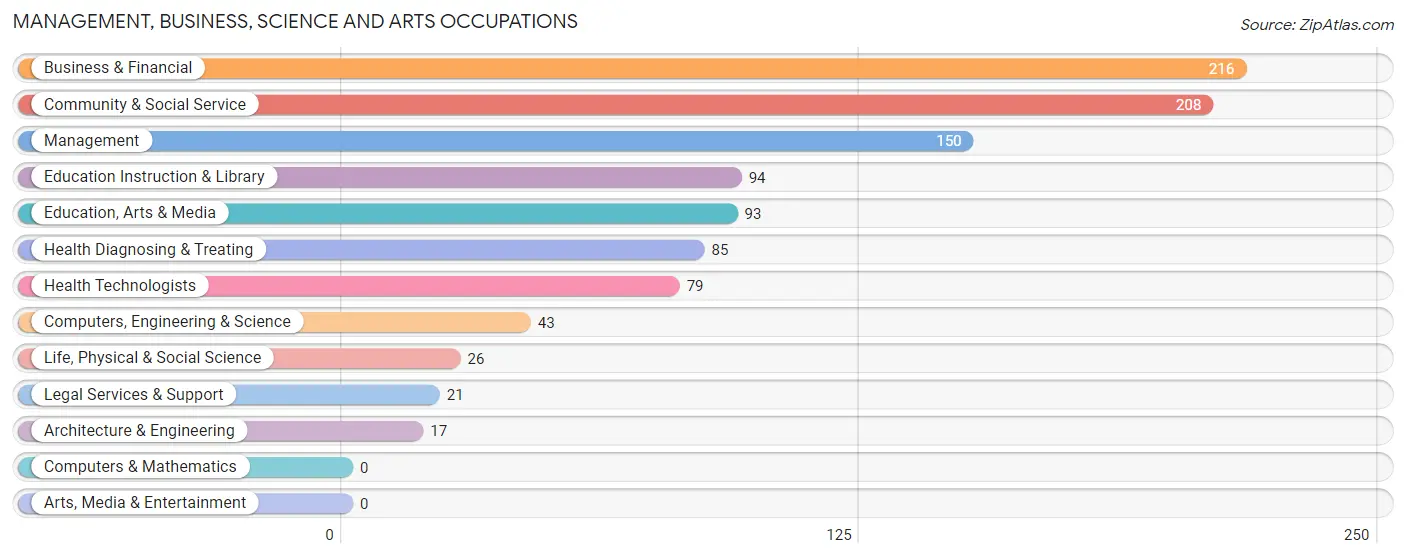
Management, Business, Science and Arts Occupations
The most common Management, Business, Science and Arts occupations in Phoenix Lake are Business & Financial (216 | 13.1%), Community & Social Service (208 | 12.6%), Management (150 | 9.1%), Education Instruction & Library (94 | 5.7%), and Education, Arts & Media (93 | 5.6%).
Management, Business, Science and Arts Occupations by Sex
Within the Management, Business, Science and Arts occupations in Phoenix Lake, the most male-oriented occupations are Architecture & Engineering (100.0%), Management (64.0%), and Business & Financial (58.8%), while the most female-oriented occupations are Life, Physical & Social Science (100.0%), Education, Arts & Media (100.0%), and Legal Services & Support (100.0%).
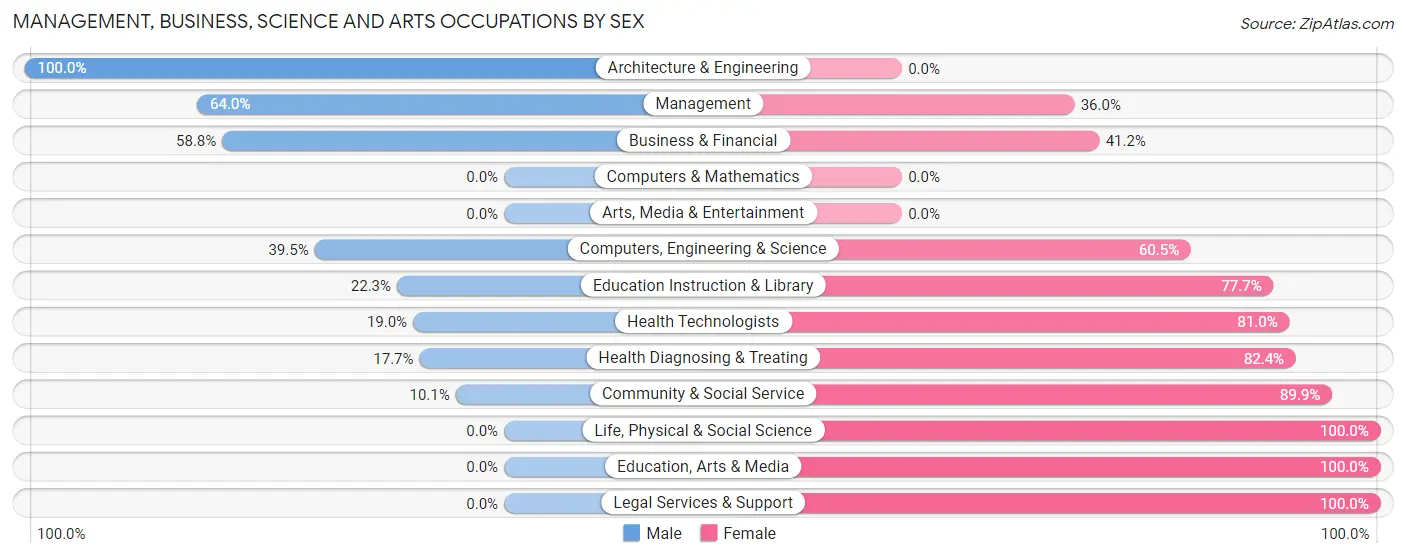
| Occupation | Male | Female |
| Management | 96 (64.0%) | 54 (36.0%) |
| Business & Financial | 127 (58.8%) | 89 (41.2%) |
| Computers, Engineering & Science | 17 (39.5%) | 26 (60.5%) |
| Computers & Mathematics | 0 (0.0%) | 0 (0.0%) |
| Architecture & Engineering | 17 (100.0%) | 0 (0.0%) |
| Life, Physical & Social Science | 0 (0.0%) | 26 (100.0%) |
| Community & Social Service | 21 (10.1%) | 187 (89.9%) |
| Education, Arts & Media | 0 (0.0%) | 93 (100.0%) |
| Legal Services & Support | 0 (0.0%) | 21 (100.0%) |
| Education Instruction & Library | 21 (22.3%) | 73 (77.7%) |
| Arts, Media & Entertainment | 0 (0.0%) | 0 (0.0%) |
| Health Diagnosing & Treating | 15 (17.6%) | 70 (82.4%) |
| Health Technologists | 15 (19.0%) | 64 (81.0%) |
| Total (Category) | 276 (39.3%) | 426 (60.7%) |
| Total (Overall) | 821 (49.7%) | 832 (50.3%) |
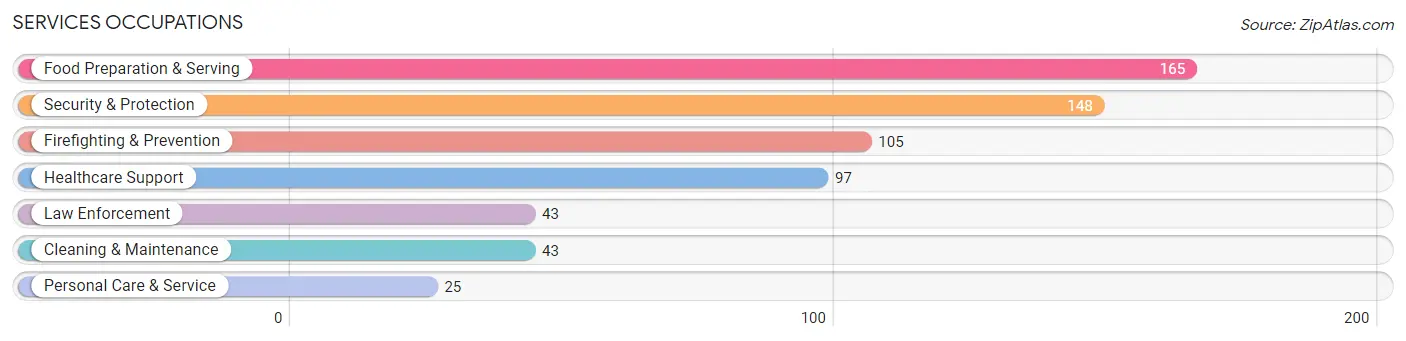
Services Occupations
The most common Services occupations in Phoenix Lake are Food Preparation & Serving (165 | 10.0%), Security & Protection (148 | 8.9%), Firefighting & Prevention (105 | 6.4%), Healthcare Support (97 | 5.9%), and Law Enforcement (43 | 2.6%).
Services Occupations by Sex
Within the Services occupations in Phoenix Lake, the most male-oriented occupations are Security & Protection (100.0%), Firefighting & Prevention (100.0%), and Law Enforcement (100.0%), while the most female-oriented occupations are Food Preparation & Serving (100.0%), Personal Care & Service (100.0%), and Healthcare Support (60.8%).
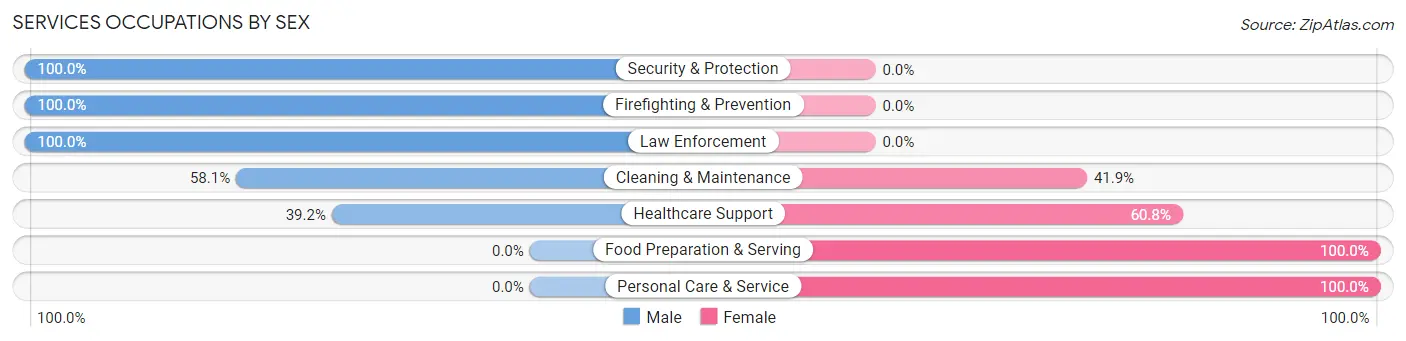
| Occupation | Male | Female |
| Healthcare Support | 38 (39.2%) | 59 (60.8%) |
| Security & Protection | 148 (100.0%) | 0 (0.0%) |
| Firefighting & Prevention | 105 (100.0%) | 0 (0.0%) |
| Law Enforcement | 43 (100.0%) | 0 (0.0%) |
| Food Preparation & Serving | 0 (0.0%) | 165 (100.0%) |
| Cleaning & Maintenance | 25 (58.1%) | 18 (41.9%) |
| Personal Care & Service | 0 (0.0%) | 25 (100.0%) |
| Total (Category) | 211 (44.1%) | 267 (55.9%) |
| Total (Overall) | 821 (49.7%) | 832 (50.3%) |
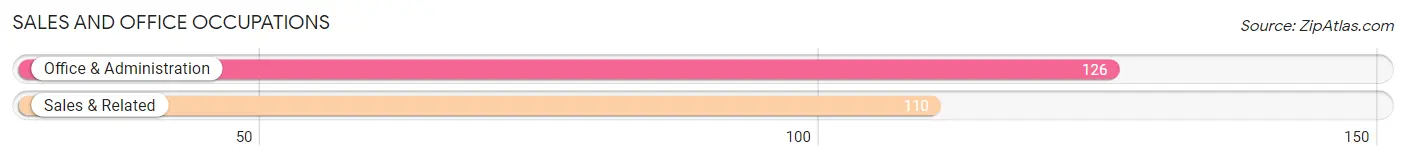
Sales and Office Occupations
The most common Sales and Office occupations in Phoenix Lake are Office & Administration (126 | 7.6%), and Sales & Related (110 | 6.7%).
Sales and Office Occupations by Sex
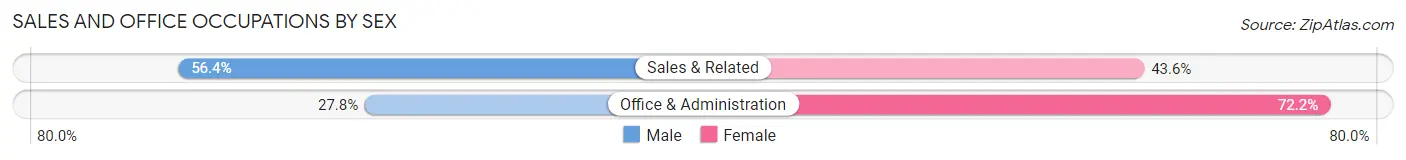
| Occupation | Male | Female |
| Sales & Related | 62 (56.4%) | 48 (43.6%) |
| Office & Administration | 35 (27.8%) | 91 (72.2%) |
| Total (Category) | 97 (41.1%) | 139 (58.9%) |
| Total (Overall) | 821 (49.7%) | 832 (50.3%) |
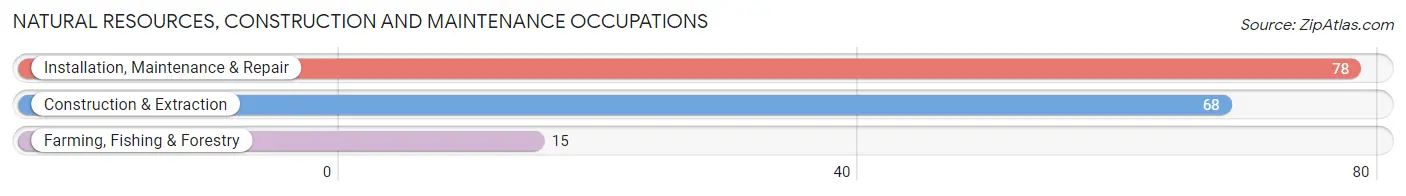
Natural Resources, Construction and Maintenance Occupations
The most common Natural Resources, Construction and Maintenance occupations in Phoenix Lake are Installation, Maintenance & Repair (78 | 4.7%), Construction & Extraction (68 | 4.1%), and Farming, Fishing & Forestry (15 | 0.9%).
Natural Resources, Construction and Maintenance Occupations by Sex
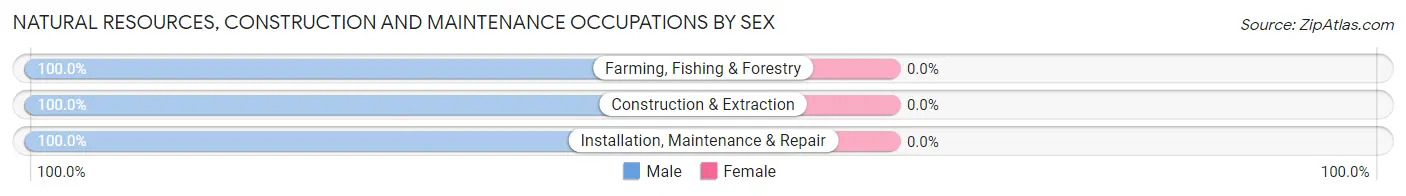
| Occupation | Male | Female |
| Farming, Fishing & Forestry | 15 (100.0%) | 0 (0.0%) |
| Construction & Extraction | 68 (100.0%) | 0 (0.0%) |
| Installation, Maintenance & Repair | 78 (100.0%) | 0 (0.0%) |
| Total (Category) | 161 (100.0%) | 0 (0.0%) |
| Total (Overall) | 821 (49.7%) | 832 (50.3%) |
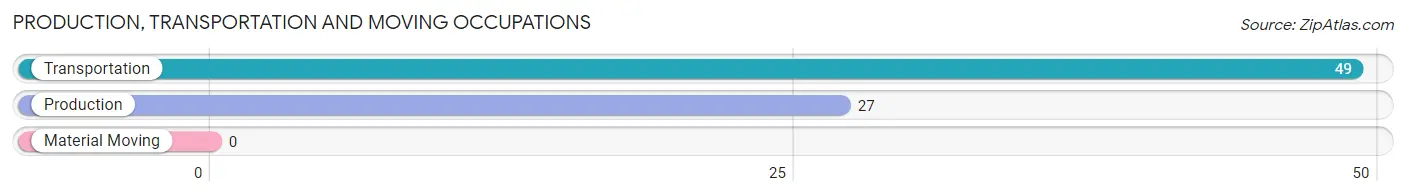
Production, Transportation and Moving Occupations
The most common Production, Transportation and Moving occupations in Phoenix Lake are Transportation (49 | 3.0%), and Production (27 | 1.6%).
Production, Transportation and Moving Occupations by Sex
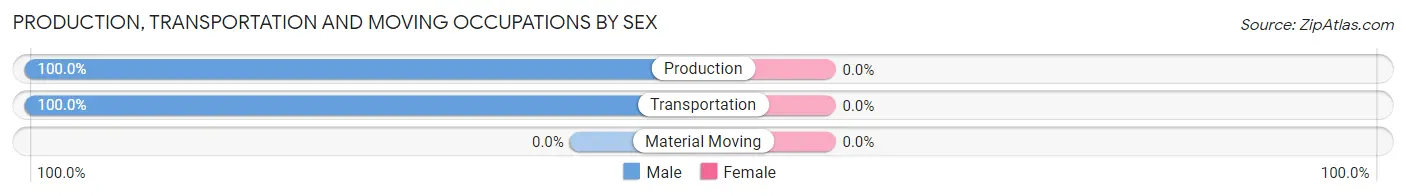
| Occupation | Male | Female |
| Production | 27 (100.0%) | 0 (0.0%) |
| Transportation | 49 (100.0%) | 0 (0.0%) |
| Material Moving | 0 (0.0%) | 0 (0.0%) |
| Total (Category) | 76 (100.0%) | 0 (0.0%) |
| Total (Overall) | 821 (49.7%) | 832 (50.3%) |
Employment Industries by Sex in Phoenix Lake
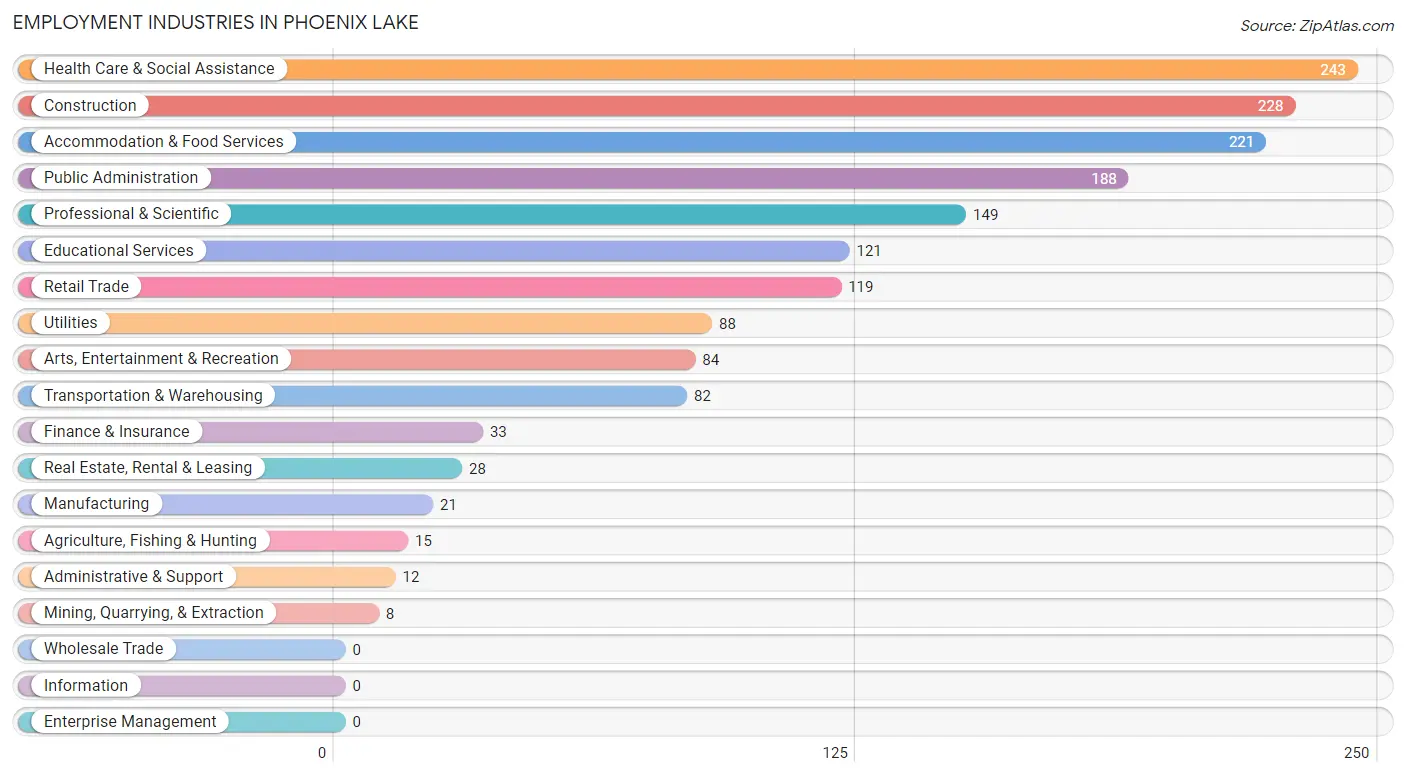
Employment Industries in Phoenix Lake
The major employment industries in Phoenix Lake include Health Care & Social Assistance (243 | 14.7%), Construction (228 | 13.8%), Accommodation & Food Services (221 | 13.4%), Public Administration (188 | 11.4%), and Professional & Scientific (149 | 9.0%).
Employment Industries by Sex in Phoenix Lake
The Phoenix Lake industries that see more men than women are Agriculture, Fishing & Hunting (100.0%), Mining, Quarrying, & Extraction (100.0%), and Finance & Insurance (100.0%), whereas the industries that tend to have a higher number of women are Professional & Scientific (91.9%), Accommodation & Food Services (83.7%), and Educational Services (82.6%).
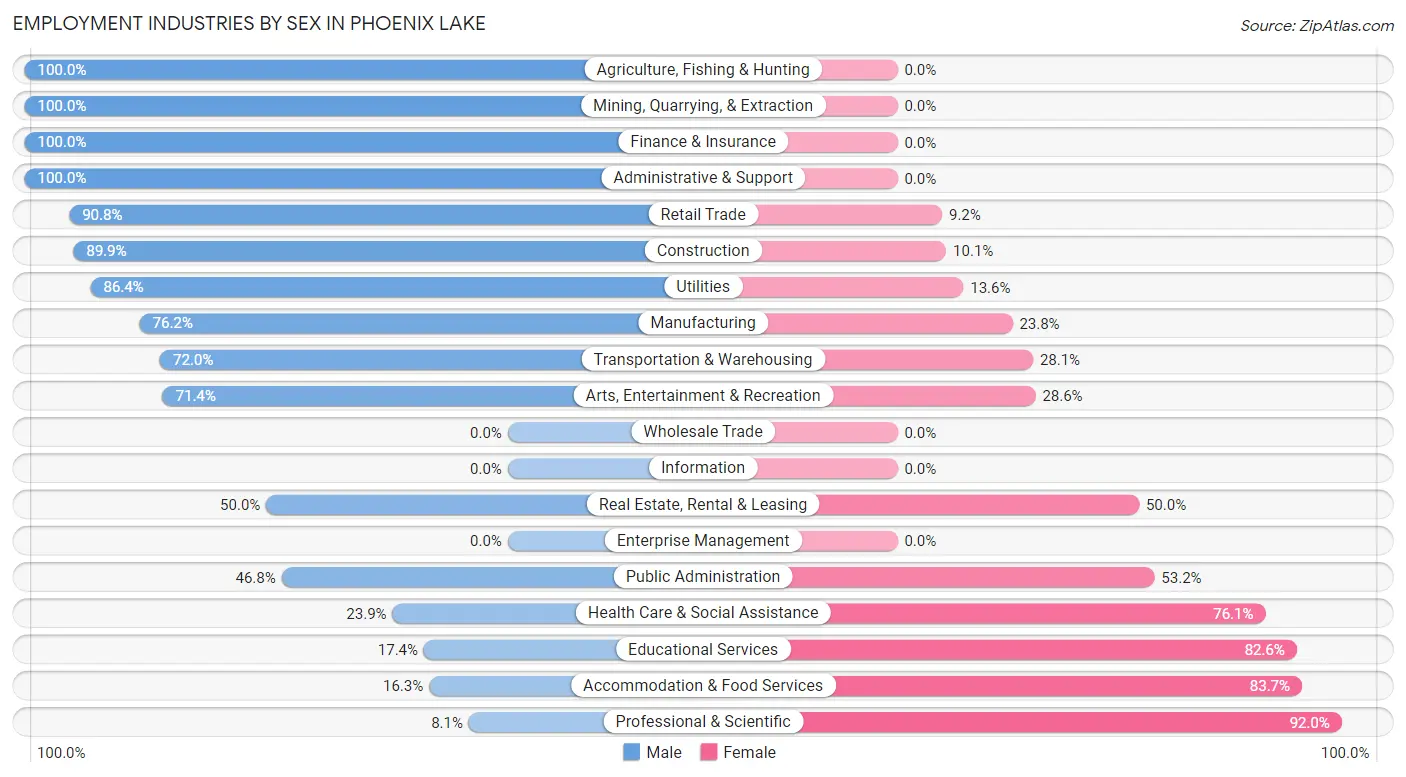
| Industry | Male | Female |
| Agriculture, Fishing & Hunting | 15 (100.0%) | 0 (0.0%) |
| Mining, Quarrying, & Extraction | 8 (100.0%) | 0 (0.0%) |
| Construction | 205 (89.9%) | 23 (10.1%) |
| Manufacturing | 16 (76.2%) | 5 (23.8%) |
| Wholesale Trade | 0 (0.0%) | 0 (0.0%) |
| Retail Trade | 108 (90.8%) | 11 (9.2%) |
| Transportation & Warehousing | 59 (72.0%) | 23 (28.1%) |
| Utilities | 76 (86.4%) | 12 (13.6%) |
| Information | 0 (0.0%) | 0 (0.0%) |
| Finance & Insurance | 33 (100.0%) | 0 (0.0%) |
| Real Estate, Rental & Leasing | 14 (50.0%) | 14 (50.0%) |
| Professional & Scientific | 12 (8.1%) | 137 (91.9%) |
| Enterprise Management | 0 (0.0%) | 0 (0.0%) |
| Administrative & Support | 12 (100.0%) | 0 (0.0%) |
| Educational Services | 21 (17.4%) | 100 (82.6%) |
| Health Care & Social Assistance | 58 (23.9%) | 185 (76.1%) |
| Arts, Entertainment & Recreation | 60 (71.4%) | 24 (28.6%) |
| Accommodation & Food Services | 36 (16.3%) | 185 (83.7%) |
| Public Administration | 88 (46.8%) | 100 (53.2%) |
| Total | 821 (49.7%) | 832 (50.3%) |
Education in Phoenix Lake
School Enrollment in Phoenix Lake
The most common levels of schooling among the 652 students in Phoenix Lake are college / undergraduate (253 | 38.8%), high school (178 | 27.3%), and elementary school (102 | 15.6%).
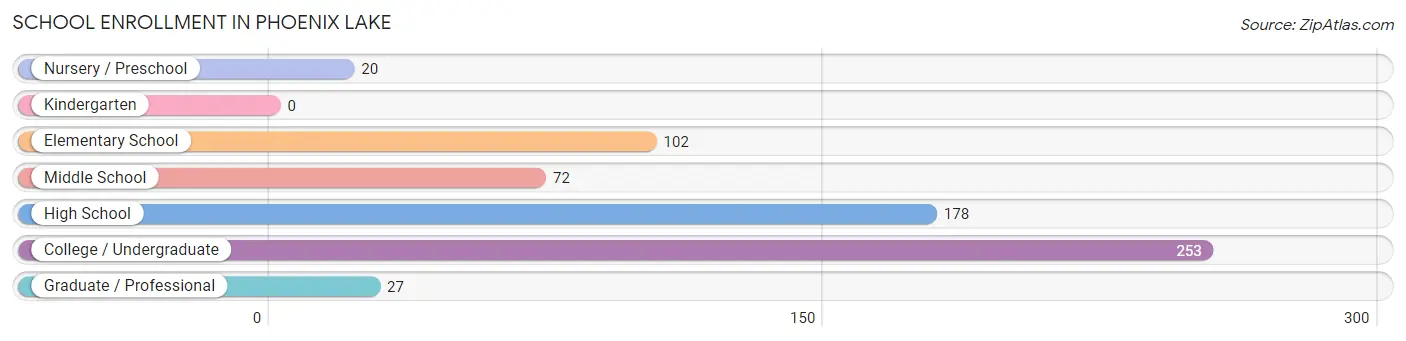
| School Level | # Students | % Students |
| Nursery / Preschool | 20 | 3.1% |
| Kindergarten | 0 | 0.0% |
| Elementary School | 102 | 15.6% |
| Middle School | 72 | 11.0% |
| High School | 178 | 27.3% |
| College / Undergraduate | 253 | 38.8% |
| Graduate / Professional | 27 | 4.1% |
| Total | 652 | 100.0% |
School Enrollment by Age by Funding Source in Phoenix Lake
Out of a total of 652 students who are enrolled in schools in Phoenix Lake, 102 (15.6%) attend a private institution, while the remaining 550 (84.4%) are enrolled in public schools. The age group of 10 to 14 year olds has the highest likelihood of being enrolled in private schools, with 59 (31.2% in the age bracket) enrolled. Conversely, the age group of 18 to 19 year olds has the lowest likelihood of being enrolled in a private school, with 22 (100.0% in the age bracket) attending a public institution.
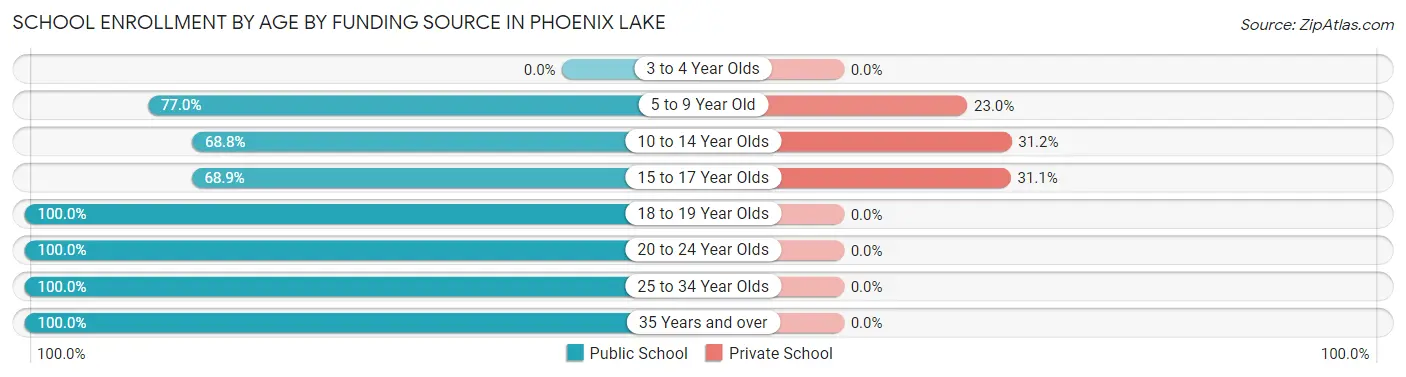
| Age Bracket | Public School | Private School |
| 3 to 4 Year Olds | 0 (0.0%) | 0 (0.0%) |
| 5 to 9 Year Old | 67 (77.0%) | 20 (23.0%) |
| 10 to 14 Year Olds | 130 (68.8%) | 59 (31.2%) |
| 15 to 17 Year Olds | 51 (68.9%) | 23 (31.1%) |
| 18 to 19 Year Olds | 22 (100.0%) | 0 (0.0%) |
| 20 to 24 Year Olds | 216 (100.0%) | 0 (0.0%) |
| 25 to 34 Year Olds | 26 (100.0%) | 0 (0.0%) |
| 35 Years and over | 38 (100.0%) | 0 (0.0%) |
| Total | 550 (84.4%) | 102 (15.6%) |
Educational Attainment by Field of Study in Phoenix Lake
Science & technology (190 | 19.8%), engineering (153 | 15.9%), business (121 | 12.6%), liberal arts & history (112 | 11.7%), and bio, nature & agricultural (72 | 7.5%) are the most common fields of study among 960 individuals in Phoenix Lake who have obtained a bachelor's degree or higher.
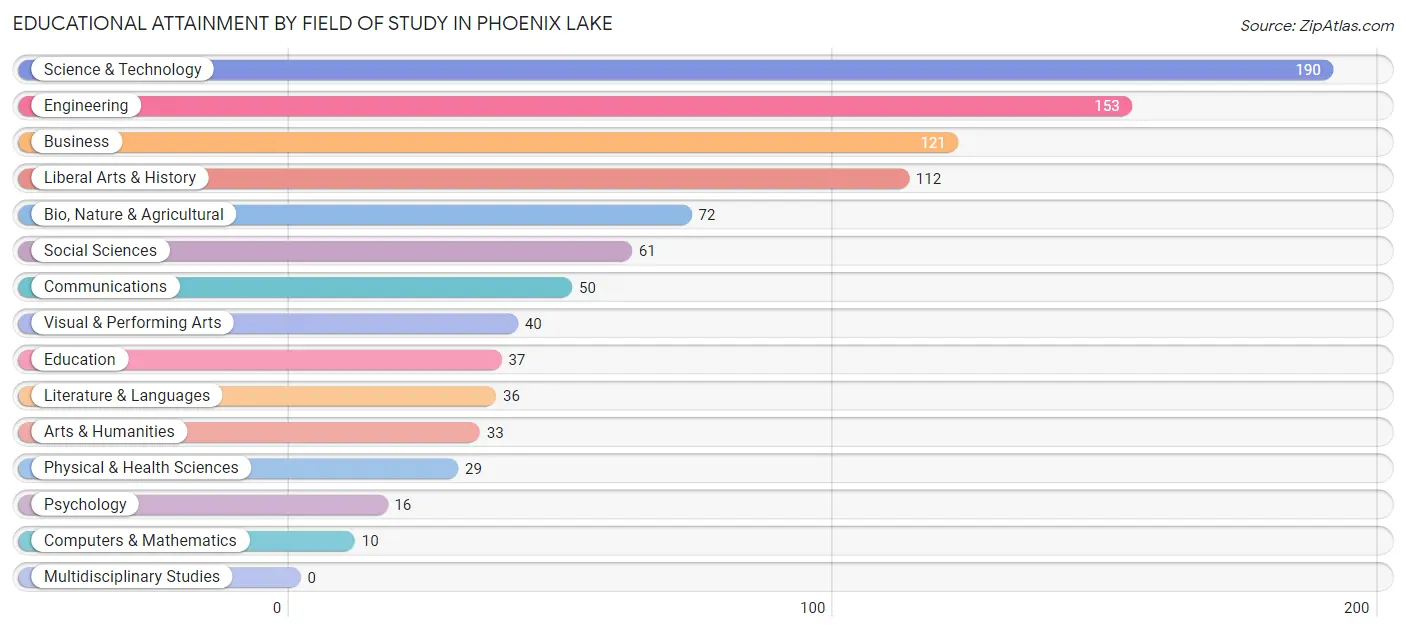
| Field of Study | # Graduates | % Graduates |
| Computers & Mathematics | 10 | 1.0% |
| Bio, Nature & Agricultural | 72 | 7.5% |
| Physical & Health Sciences | 29 | 3.0% |
| Psychology | 16 | 1.7% |
| Social Sciences | 61 | 6.4% |
| Engineering | 153 | 15.9% |
| Multidisciplinary Studies | 0 | 0.0% |
| Science & Technology | 190 | 19.8% |
| Business | 121 | 12.6% |
| Education | 37 | 3.8% |
| Literature & Languages | 36 | 3.7% |
| Liberal Arts & History | 112 | 11.7% |
| Visual & Performing Arts | 40 | 4.2% |
| Communications | 50 | 5.2% |
| Arts & Humanities | 33 | 3.4% |
| Total | 960 | 100.0% |
Transportation & Commute in Phoenix Lake
Vehicle Availability by Sex in Phoenix Lake
The most prevalent vehicle ownership categories in Phoenix Lake are males with 2 vehicles (310, accounting for 40.7%) and females with 2 vehicles (307, making up 38.8%).
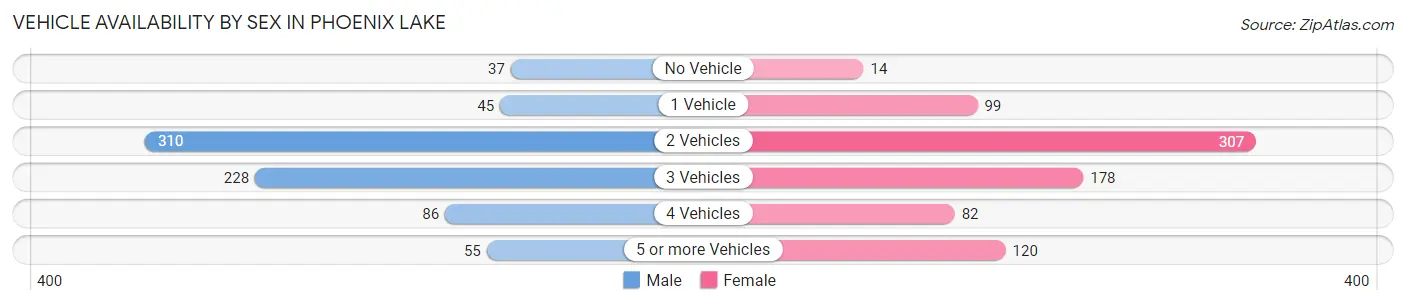
| Vehicles Available | Male | Female |
| No Vehicle | 37 (4.9%) | 14 (1.8%) |
| 1 Vehicle | 45 (5.9%) | 99 (12.4%) |
| 2 Vehicles | 310 (40.7%) | 307 (38.4%) |
| 3 Vehicles | 228 (30.0%) | 178 (22.3%) |
| 4 Vehicles | 86 (11.3%) | 82 (10.2%) |
| 5 or more Vehicles | 55 (7.2%) | 120 (15.0%) |
| Total | 761 (100.0%) | 800 (100.0%) |
Commute Time in Phoenix Lake
The most frequently occuring commute durations in Phoenix Lake are 15 to 19 minutes (390 commuters, 30.3%), 10 to 14 minutes (219 commuters, 17.0%), and 20 to 24 minutes (176 commuters, 13.7%).
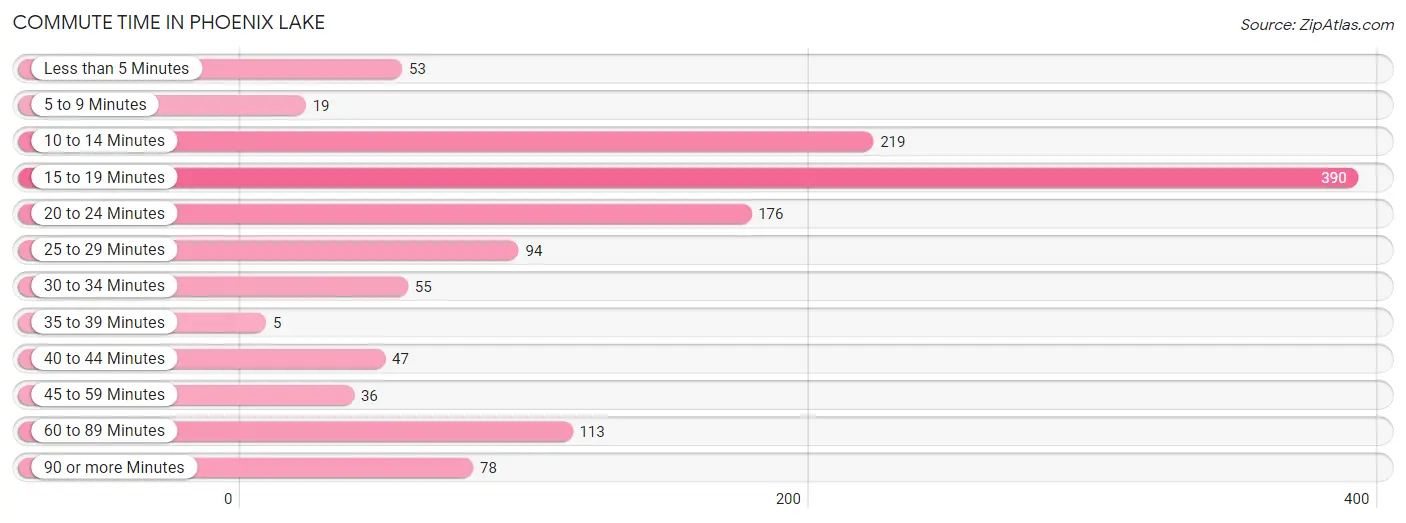
| Commute Time | # Commuters | % Commuters |
| Less than 5 Minutes | 53 | 4.1% |
| 5 to 9 Minutes | 19 | 1.5% |
| 10 to 14 Minutes | 219 | 17.0% |
| 15 to 19 Minutes | 390 | 30.3% |
| 20 to 24 Minutes | 176 | 13.7% |
| 25 to 29 Minutes | 94 | 7.3% |
| 30 to 34 Minutes | 55 | 4.3% |
| 35 to 39 Minutes | 5 | 0.4% |
| 40 to 44 Minutes | 47 | 3.7% |
| 45 to 59 Minutes | 36 | 2.8% |
| 60 to 89 Minutes | 113 | 8.8% |
| 90 or more Minutes | 78 | 6.1% |
Commute Time by Sex in Phoenix Lake
The most common commute times in Phoenix Lake are 15 to 19 minutes (121 commuters, 20.0%) for males and 15 to 19 minutes (269 commuters, 39.5%) for females.
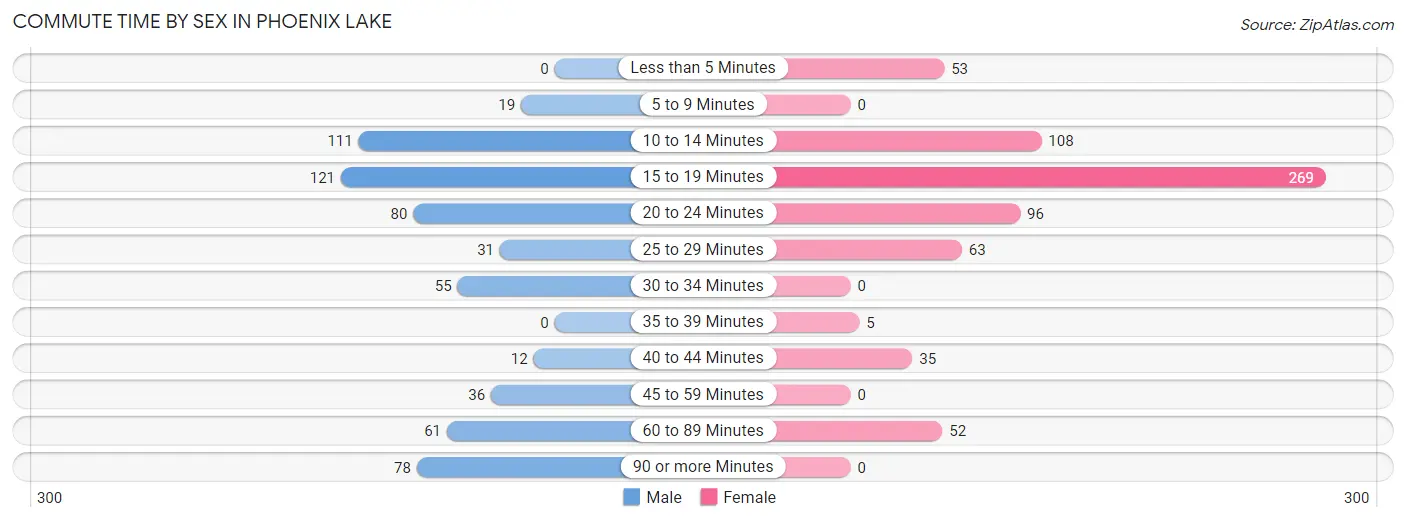
| Commute Time | Male | Female |
| Less than 5 Minutes | 0 (0.0%) | 53 (7.8%) |
| 5 to 9 Minutes | 19 (3.2%) | 0 (0.0%) |
| 10 to 14 Minutes | 111 (18.4%) | 108 (15.9%) |
| 15 to 19 Minutes | 121 (20.0%) | 269 (39.5%) |
| 20 to 24 Minutes | 80 (13.3%) | 96 (14.1%) |
| 25 to 29 Minutes | 31 (5.1%) | 63 (9.2%) |
| 30 to 34 Minutes | 55 (9.1%) | 0 (0.0%) |
| 35 to 39 Minutes | 0 (0.0%) | 5 (0.7%) |
| 40 to 44 Minutes | 12 (2.0%) | 35 (5.1%) |
| 45 to 59 Minutes | 36 (6.0%) | 0 (0.0%) |
| 60 to 89 Minutes | 61 (10.1%) | 52 (7.6%) |
| 90 or more Minutes | 78 (12.9%) | 0 (0.0%) |
Time of Departure to Work by Sex in Phoenix Lake
The most frequent times of departure to work in Phoenix Lake are 6:30 AM to 6:59 AM (113, 18.7%) for males and 8:00 AM to 8:29 AM (174, 25.6%) for females.
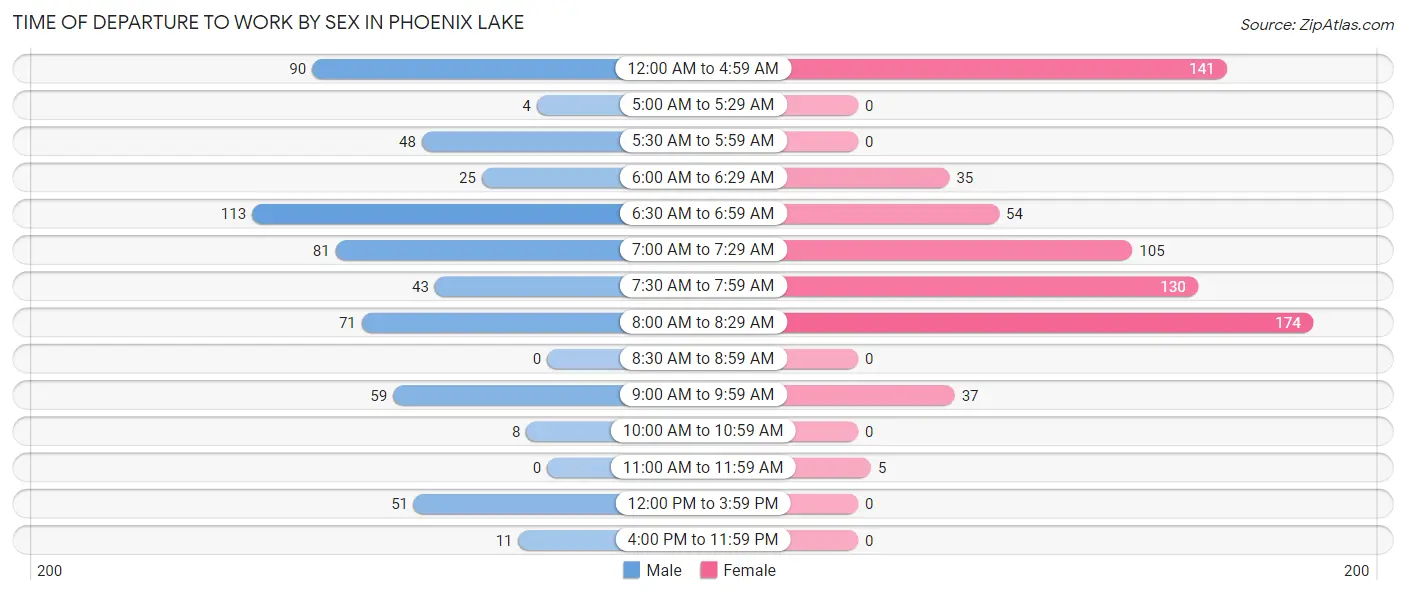
| Time of Departure | Male | Female |
| 12:00 AM to 4:59 AM | 90 (14.9%) | 141 (20.7%) |
| 5:00 AM to 5:29 AM | 4 (0.7%) | 0 (0.0%) |
| 5:30 AM to 5:59 AM | 48 (8.0%) | 0 (0.0%) |
| 6:00 AM to 6:29 AM | 25 (4.1%) | 35 (5.1%) |
| 6:30 AM to 6:59 AM | 113 (18.7%) | 54 (7.9%) |
| 7:00 AM to 7:29 AM | 81 (13.4%) | 105 (15.4%) |
| 7:30 AM to 7:59 AM | 43 (7.1%) | 130 (19.1%) |
| 8:00 AM to 8:29 AM | 71 (11.7%) | 174 (25.6%) |
| 8:30 AM to 8:59 AM | 0 (0.0%) | 0 (0.0%) |
| 9:00 AM to 9:59 AM | 59 (9.8%) | 37 (5.4%) |
| 10:00 AM to 10:59 AM | 8 (1.3%) | 0 (0.0%) |
| 11:00 AM to 11:59 AM | 0 (0.0%) | 5 (0.7%) |
| 12:00 PM to 3:59 PM | 51 (8.4%) | 0 (0.0%) |
| 4:00 PM to 11:59 PM | 11 (1.8%) | 0 (0.0%) |
| Total | 604 (100.0%) | 681 (100.0%) |
Housing Occupancy in Phoenix Lake
Occupancy by Ownership in Phoenix Lake
Of the total 2,010 dwellings in Phoenix Lake, owner-occupied units account for 1,743 (86.7%), while renter-occupied units make up 267 (13.3%).
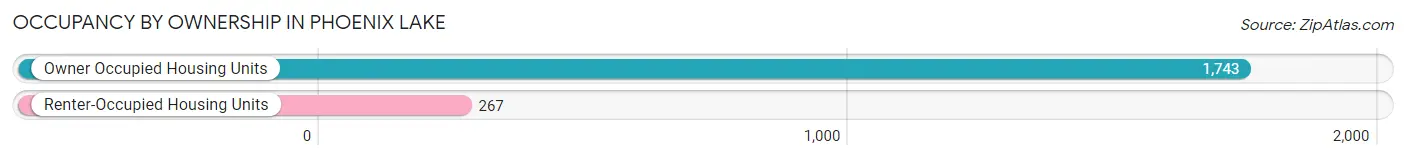
| Occupancy | # Housing Units | % Housing Units |
| Owner Occupied Housing Units | 1,743 | 86.7% |
| Renter-Occupied Housing Units | 267 | 13.3% |
| Total Occupied Housing Units | 2,010 | 100.0% |
Occupancy by Household Size in Phoenix Lake
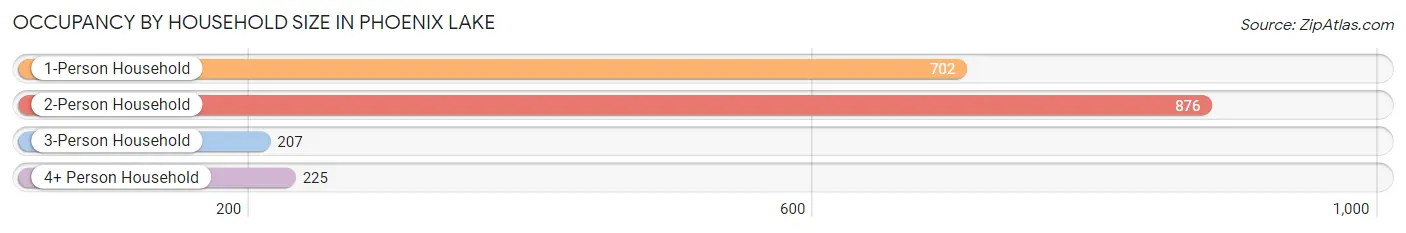
| Household Size | # Housing Units | % Housing Units |
| 1-Person Household | 702 | 34.9% |
| 2-Person Household | 876 | 43.6% |
| 3-Person Household | 207 | 10.3% |
| 4+ Person Household | 225 | 11.2% |
| Total Housing Units | 2,010 | 100.0% |
Occupancy by Ownership by Household Size in Phoenix Lake
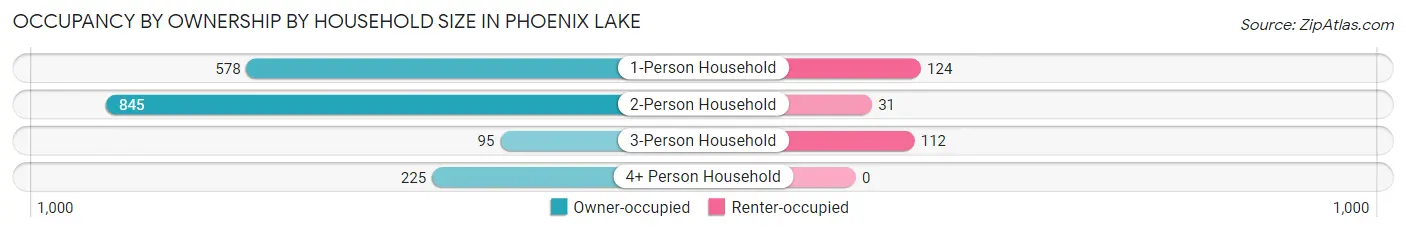
| Household Size | Owner-occupied | Renter-occupied |
| 1-Person Household | 578 (82.3%) | 124 (17.7%) |
| 2-Person Household | 845 (96.5%) | 31 (3.5%) |
| 3-Person Household | 95 (45.9%) | 112 (54.1%) |
| 4+ Person Household | 225 (100.0%) | 0 (0.0%) |
| Total Housing Units | 1,743 (86.7%) | 267 (13.3%) |
Occupancy by Educational Attainment in Phoenix Lake
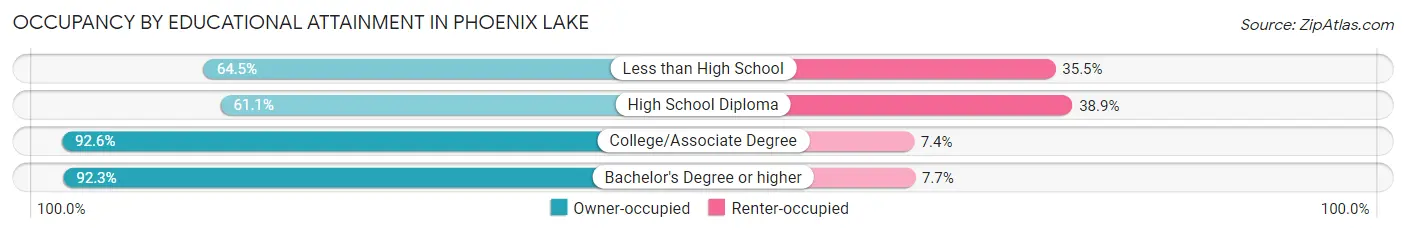
| Household Size | Owner-occupied | Renter-occupied |
| Less than High School | 49 (64.5%) | 27 (35.5%) |
| High School Diploma | 184 (61.1%) | 117 (38.9%) |
| College/Associate Degree | 970 (92.6%) | 78 (7.4%) |
| Bachelor's Degree or higher | 540 (92.3%) | 45 (7.7%) |
Occupancy by Age of Householder in Phoenix Lake
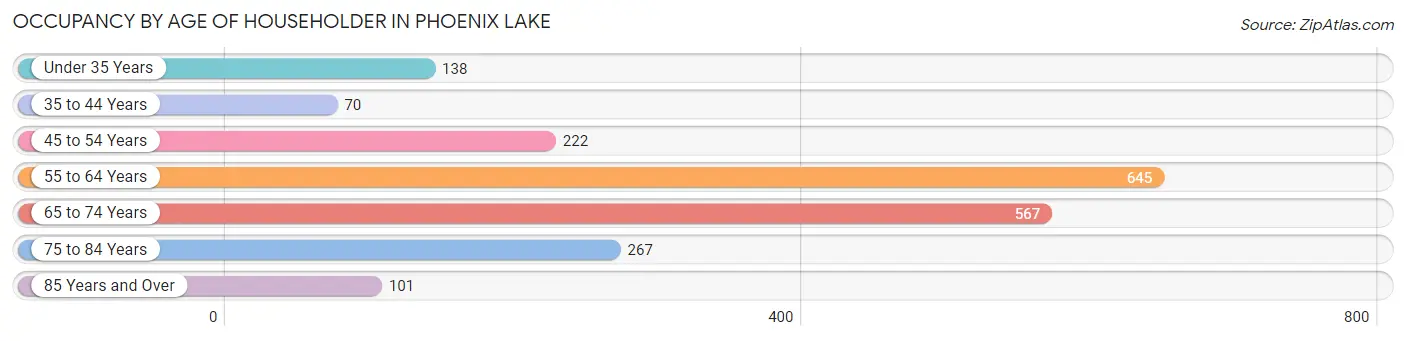
| Age Bracket | # Households | % Households |
| Under 35 Years | 138 | 6.9% |
| 35 to 44 Years | 70 | 3.5% |
| 45 to 54 Years | 222 | 11.0% |
| 55 to 64 Years | 645 | 32.1% |
| 65 to 74 Years | 567 | 28.2% |
| 75 to 84 Years | 267 | 13.3% |
| 85 Years and Over | 101 | 5.0% |
| Total | 2,010 | 100.0% |
Housing Finances in Phoenix Lake
Median Income by Occupancy in Phoenix Lake
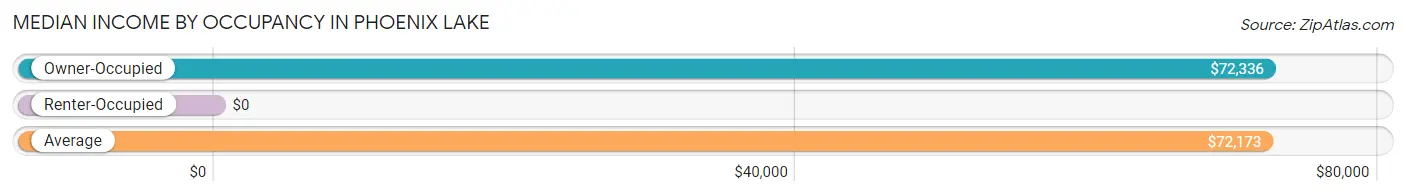
| Occupancy Type | # Households | Median Income |
| Owner-Occupied | 1,743 (86.7%) | $72,336 |
| Renter-Occupied | 267 (13.3%) | $0 |
| Average | 2,010 (100.0%) | $72,173 |
Occupancy by Householder Income Bracket in Phoenix Lake
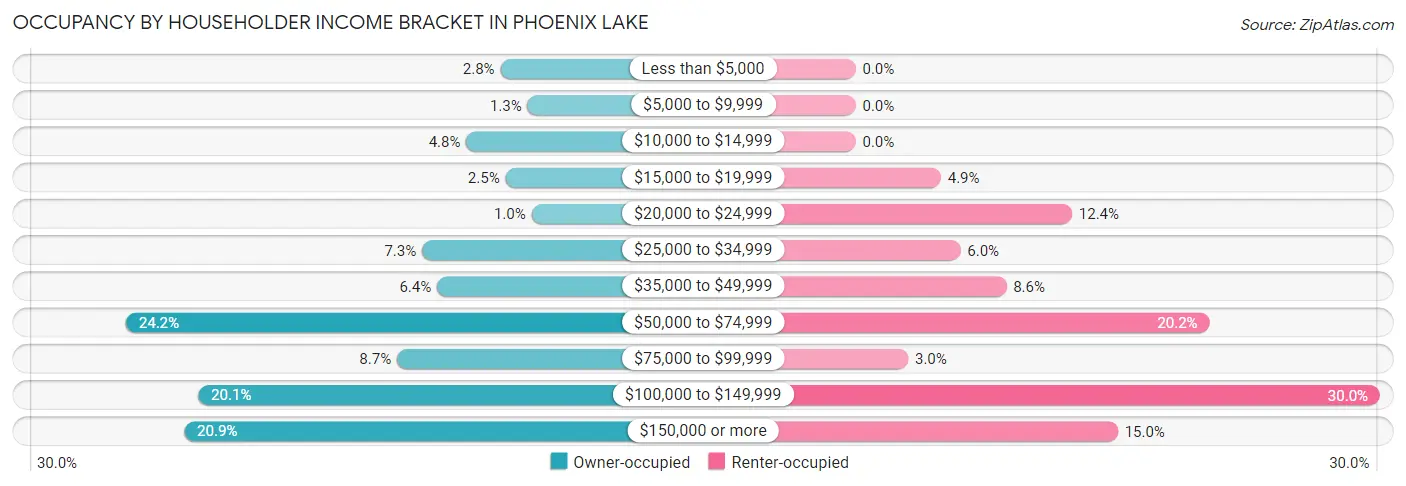
| Income Bracket | Owner-occupied | Renter-occupied |
| Less than $5,000 | 49 (2.8%) | 0 (0.0%) |
| $5,000 to $9,999 | 22 (1.3%) | 0 (0.0%) |
| $10,000 to $14,999 | 83 (4.8%) | 0 (0.0%) |
| $15,000 to $19,999 | 44 (2.5%) | 13 (4.9%) |
| $20,000 to $24,999 | 18 (1.0%) | 33 (12.4%) |
| $25,000 to $34,999 | 127 (7.3%) | 16 (6.0%) |
| $35,000 to $49,999 | 112 (6.4%) | 23 (8.6%) |
| $50,000 to $74,999 | 422 (24.2%) | 54 (20.2%) |
| $75,000 to $99,999 | 152 (8.7%) | 8 (3.0%) |
| $100,000 to $149,999 | 350 (20.1%) | 80 (30.0%) |
| $150,000 or more | 364 (20.9%) | 40 (15.0%) |
| Total | 1,743 (100.0%) | 267 (100.0%) |
Monthly Housing Cost Tiers in Phoenix Lake
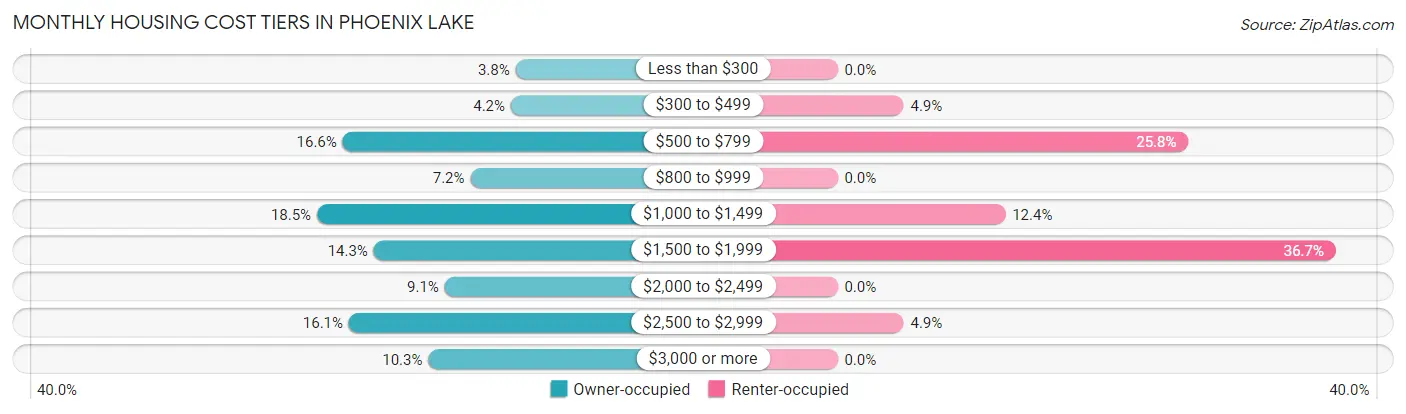
| Monthly Cost | Owner-occupied | Renter-occupied |
| Less than $300 | 67 (3.8%) | 0 (0.0%) |
| $300 to $499 | 73 (4.2%) | 13 (4.9%) |
| $500 to $799 | 289 (16.6%) | 69 (25.8%) |
| $800 to $999 | 125 (7.2%) | 0 (0.0%) |
| $1,000 to $1,499 | 322 (18.5%) | 33 (12.4%) |
| $1,500 to $1,999 | 249 (14.3%) | 98 (36.7%) |
| $2,000 to $2,499 | 158 (9.1%) | 0 (0.0%) |
| $2,500 to $2,999 | 281 (16.1%) | 13 (4.9%) |
| $3,000 or more | 179 (10.3%) | 0 (0.0%) |
| Total | 1,743 (100.0%) | 267 (100.0%) |
Physical Housing Characteristics in Phoenix Lake
Housing Structures in Phoenix Lake
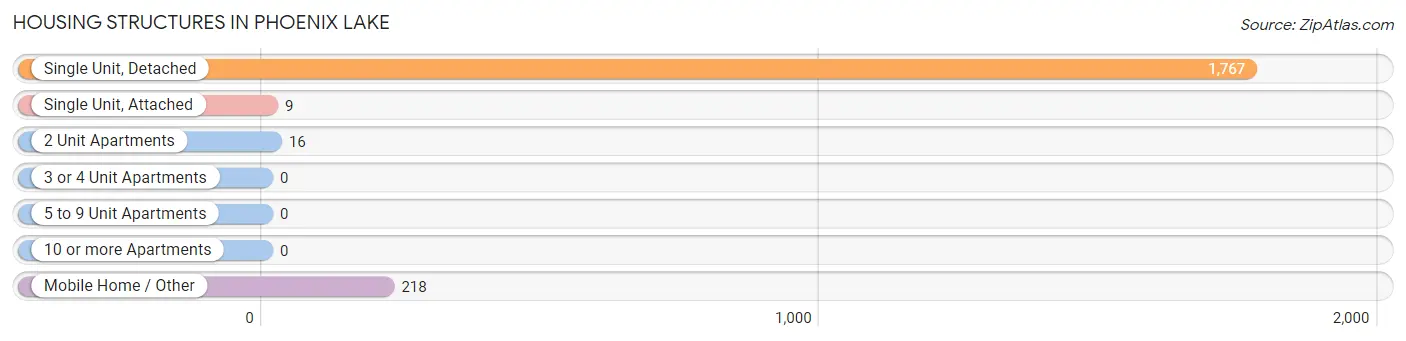
| Structure Type | # Housing Units | % Housing Units |
| Single Unit, Detached | 1,767 | 87.9% |
| Single Unit, Attached | 9 | 0.4% |
| 2 Unit Apartments | 16 | 0.8% |
| 3 or 4 Unit Apartments | 0 | 0.0% |
| 5 to 9 Unit Apartments | 0 | 0.0% |
| 10 or more Apartments | 0 | 0.0% |
| Mobile Home / Other | 218 | 10.8% |
| Total | 2,010 | 100.0% |
Housing Structures by Occupancy in Phoenix Lake
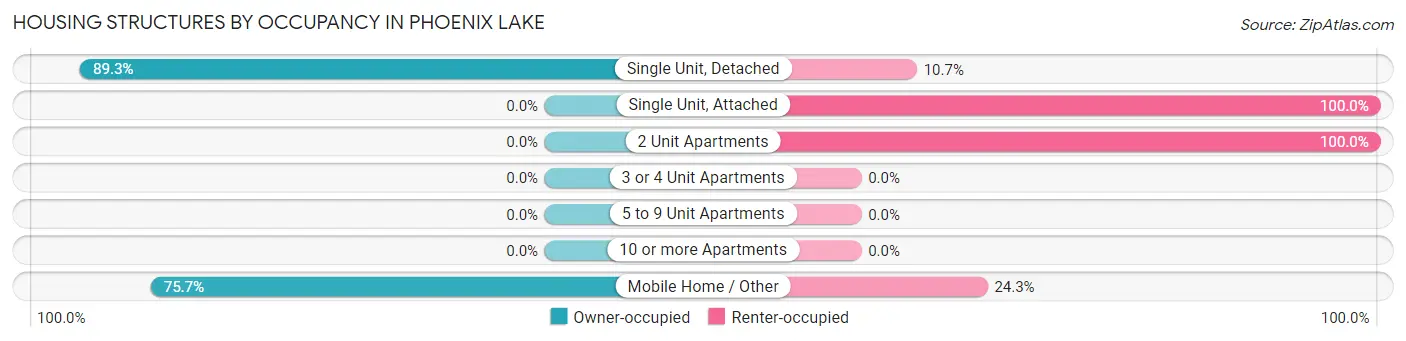
| Structure Type | Owner-occupied | Renter-occupied |
| Single Unit, Detached | 1,578 (89.3%) | 189 (10.7%) |
| Single Unit, Attached | 0 (0.0%) | 9 (100.0%) |
| 2 Unit Apartments | 0 (0.0%) | 16 (100.0%) |
| 3 or 4 Unit Apartments | 0 (0.0%) | 0 (0.0%) |
| 5 to 9 Unit Apartments | 0 (0.0%) | 0 (0.0%) |
| 10 or more Apartments | 0 (0.0%) | 0 (0.0%) |
| Mobile Home / Other | 165 (75.7%) | 53 (24.3%) |
| Total | 1,743 (86.7%) | 267 (13.3%) |
Housing Structures by Number of Rooms in Phoenix Lake
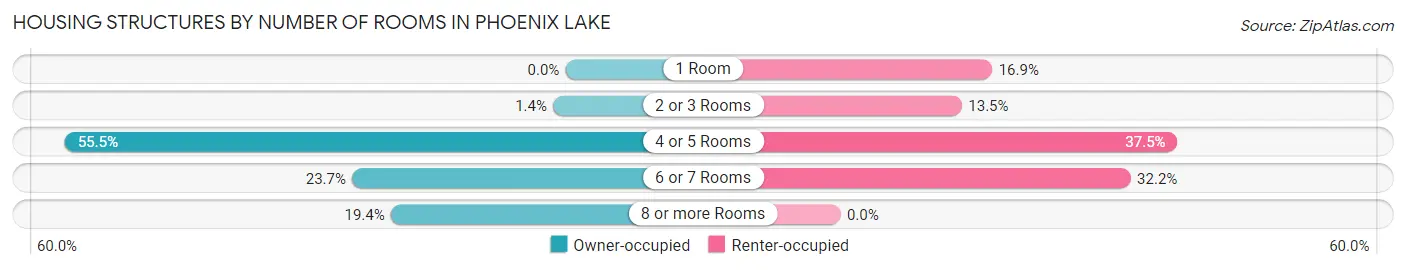
| Number of Rooms | Owner-occupied | Renter-occupied |
| 1 Room | 0 (0.0%) | 45 (16.9%) |
| 2 or 3 Rooms | 24 (1.4%) | 36 (13.5%) |
| 4 or 5 Rooms | 968 (55.5%) | 100 (37.4%) |
| 6 or 7 Rooms | 413 (23.7%) | 86 (32.2%) |
| 8 or more Rooms | 338 (19.4%) | 0 (0.0%) |
| Total | 1,743 (100.0%) | 267 (100.0%) |
Housing Structure by Heating Type in Phoenix Lake
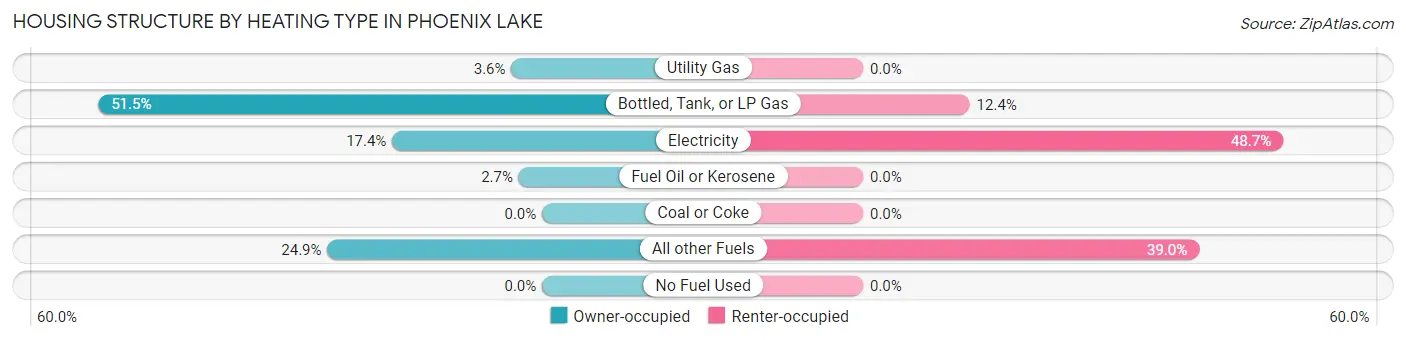
| Heating Type | Owner-occupied | Renter-occupied |
| Utility Gas | 62 (3.6%) | 0 (0.0%) |
| Bottled, Tank, or LP Gas | 897 (51.5%) | 33 (12.4%) |
| Electricity | 303 (17.4%) | 130 (48.7%) |
| Fuel Oil or Kerosene | 47 (2.7%) | 0 (0.0%) |
| Coal or Coke | 0 (0.0%) | 0 (0.0%) |
| All other Fuels | 434 (24.9%) | 104 (39.0%) |
| No Fuel Used | 0 (0.0%) | 0 (0.0%) |
| Total | 1,743 (100.0%) | 267 (100.0%) |
Household Vehicle Usage in Phoenix Lake
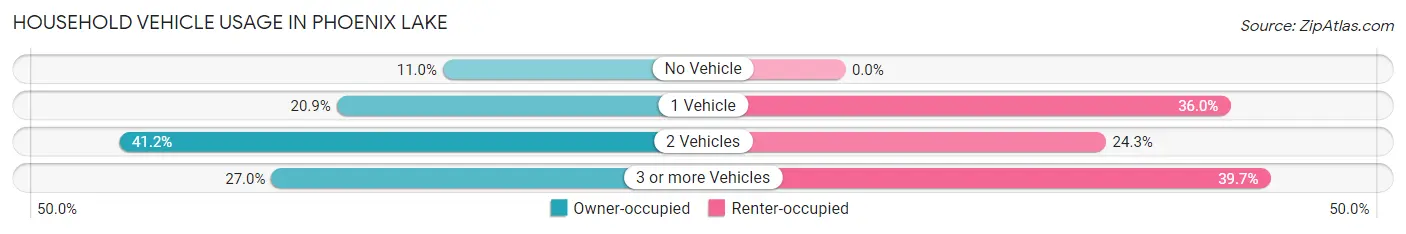
| Vehicles per Household | Owner-occupied | Renter-occupied |
| No Vehicle | 191 (11.0%) | 0 (0.0%) |
| 1 Vehicle | 364 (20.9%) | 96 (36.0%) |
| 2 Vehicles | 718 (41.2%) | 65 (24.3%) |
| 3 or more Vehicles | 470 (27.0%) | 106 (39.7%) |
| Total | 1,743 (100.0%) | 267 (100.0%) |
Real Estate & Mortgages in Phoenix Lake
Real Estate and Mortgage Overview in Phoenix Lake
| Characteristic | Without Mortgage | With Mortgage |
| Housing Units | 872 | 871 |
| Median Property Value | $400,000 | $425,700 |
| Median Household Income | $56,269 | $318 |
| Monthly Housing Costs | $816 | $179 |
| Real Estate Taxes | $2,581 | $0 |
Property Value by Mortgage Status in Phoenix Lake
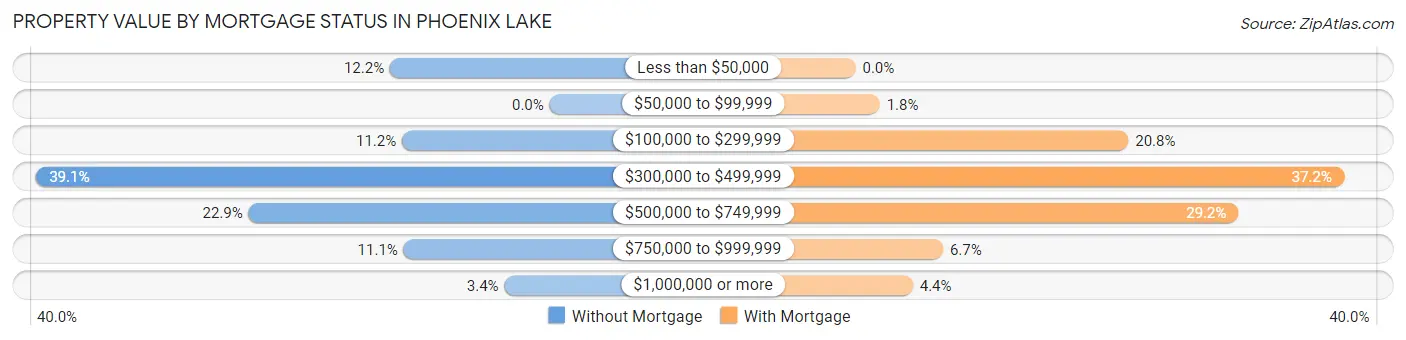
| Property Value | Without Mortgage | With Mortgage |
| Less than $50,000 | 106 (12.2%) | 0 (0.0%) |
| $50,000 to $99,999 | 0 (0.0%) | 16 (1.8%) |
| $100,000 to $299,999 | 98 (11.2%) | 181 (20.8%) |
| $300,000 to $499,999 | 341 (39.1%) | 324 (37.2%) |
| $500,000 to $749,999 | 200 (22.9%) | 254 (29.2%) |
| $750,000 to $999,999 | 97 (11.1%) | 58 (6.7%) |
| $1,000,000 or more | 30 (3.4%) | 38 (4.4%) |
| Total | 872 (100.0%) | 871 (100.0%) |
Household Income by Mortgage Status in Phoenix Lake
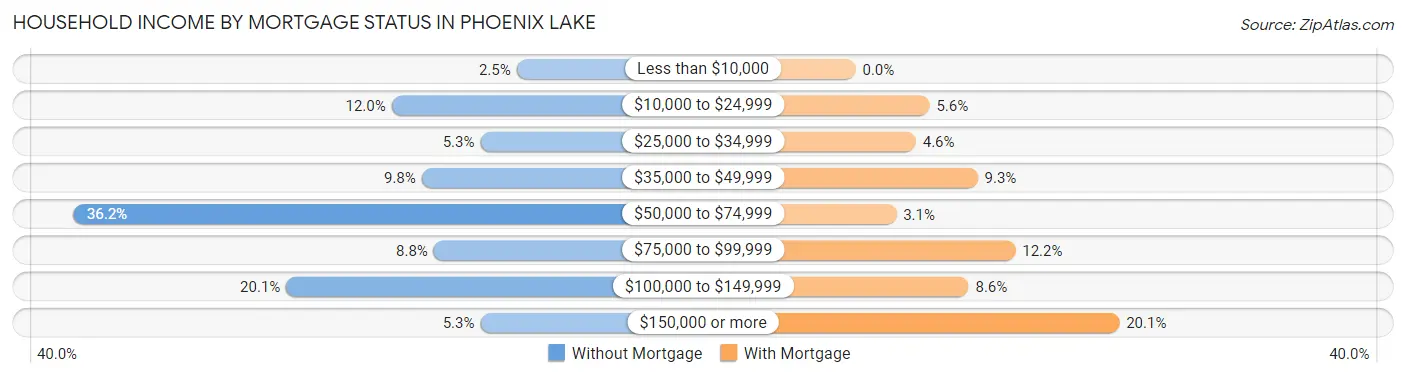
| Household Income | Without Mortgage | With Mortgage |
| Less than $10,000 | 22 (2.5%) | 0 (0.0%) |
| $10,000 to $24,999 | 105 (12.0%) | 49 (5.6%) |
| $25,000 to $34,999 | 46 (5.3%) | 40 (4.6%) |
| $35,000 to $49,999 | 85 (9.8%) | 81 (9.3%) |
| $50,000 to $74,999 | 316 (36.2%) | 27 (3.1%) |
| $75,000 to $99,999 | 77 (8.8%) | 106 (12.2%) |
| $100,000 to $149,999 | 175 (20.1%) | 75 (8.6%) |
| $150,000 or more | 46 (5.3%) | 175 (20.1%) |
| Total | 872 (100.0%) | 871 (100.0%) |
Property Value to Household Income Ratio in Phoenix Lake
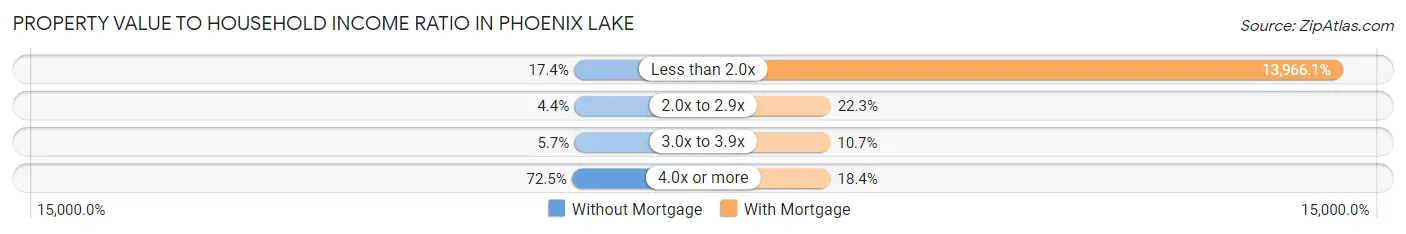
| Value-to-Income Ratio | Without Mortgage | With Mortgage |
| Less than 2.0x | 152 (17.4%) | 121,645 (13,966.1%) |
| 2.0x to 2.9x | 38 (4.4%) | 194 (22.3%) |
| 3.0x to 3.9x | 50 (5.7%) | 93 (10.7%) |
| 4.0x or more | 632 (72.5%) | 160 (18.4%) |
| Total | 872 (100.0%) | 871 (100.0%) |
Real Estate Taxes by Mortgage Status in Phoenix Lake
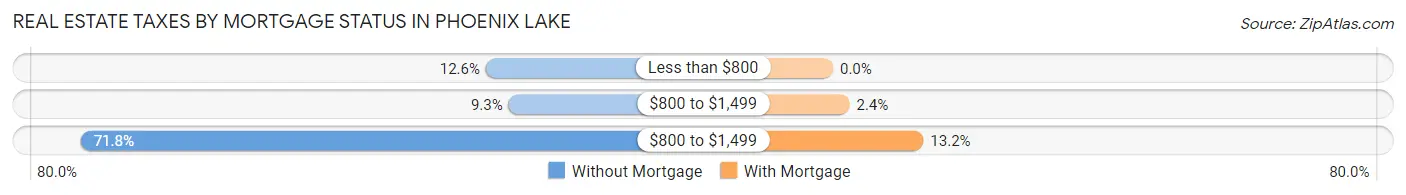
| Property Taxes | Without Mortgage | With Mortgage |
| Less than $800 | 110 (12.6%) | 0 (0.0%) |
| $800 to $1,499 | 81 (9.3%) | 21 (2.4%) |
| $800 to $1,499 | 626 (71.8%) | 115 (13.2%) |
| Total | 872 (100.0%) | 871 (100.0%) |
Health & Disability in Phoenix Lake
Health Insurance Coverage by Age in Phoenix Lake
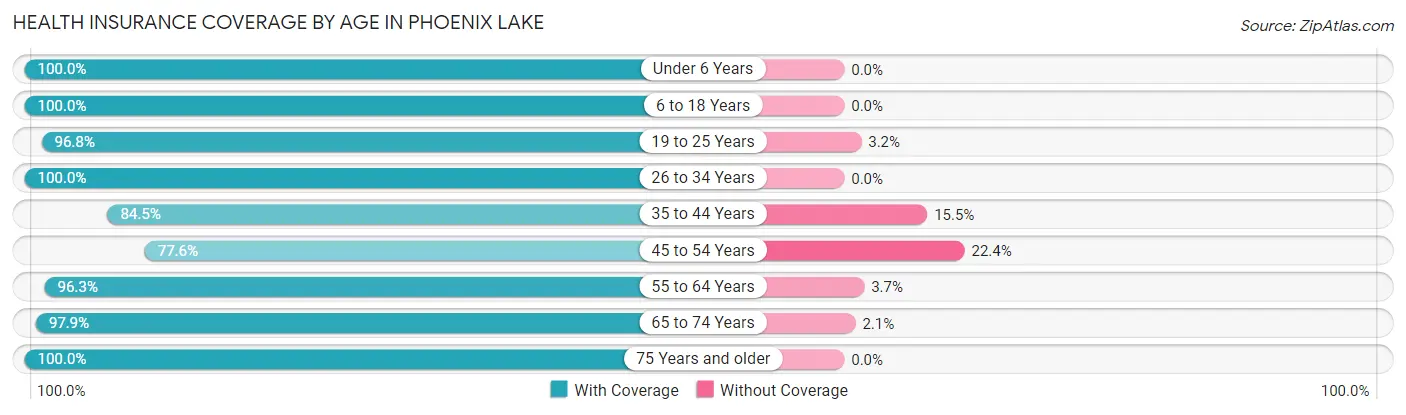
| Age Bracket | With Coverage | Without Coverage |
| Under 6 Years | 182 (100.0%) | 0 (0.0%) |
| 6 to 18 Years | 352 (100.0%) | 0 (0.0%) |
| 19 to 25 Years | 428 (96.8%) | 14 (3.2%) |
| 26 to 34 Years | 259 (100.0%) | 0 (0.0%) |
| 35 to 44 Years | 164 (84.5%) | 30 (15.5%) |
| 45 to 54 Years | 391 (77.6%) | 113 (22.4%) |
| 55 to 64 Years | 879 (96.3%) | 34 (3.7%) |
| 65 to 74 Years | 842 (97.9%) | 18 (2.1%) |
| 75 Years and older | 671 (100.0%) | 0 (0.0%) |
| Total | 4,168 (95.2%) | 209 (4.8%) |
Health Insurance Coverage by Citizenship Status in Phoenix Lake
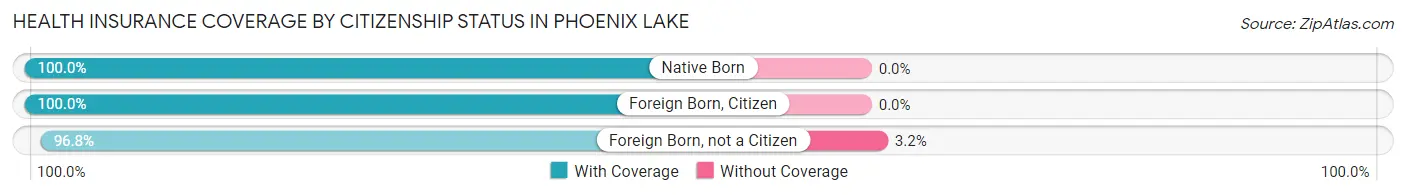
| Citizenship Status | With Coverage | Without Coverage |
| Native Born | 182 (100.0%) | 0 (0.0%) |
| Foreign Born, Citizen | 352 (100.0%) | 0 (0.0%) |
| Foreign Born, not a Citizen | 428 (96.8%) | 14 (3.2%) |
Health Insurance Coverage by Household Income in Phoenix Lake
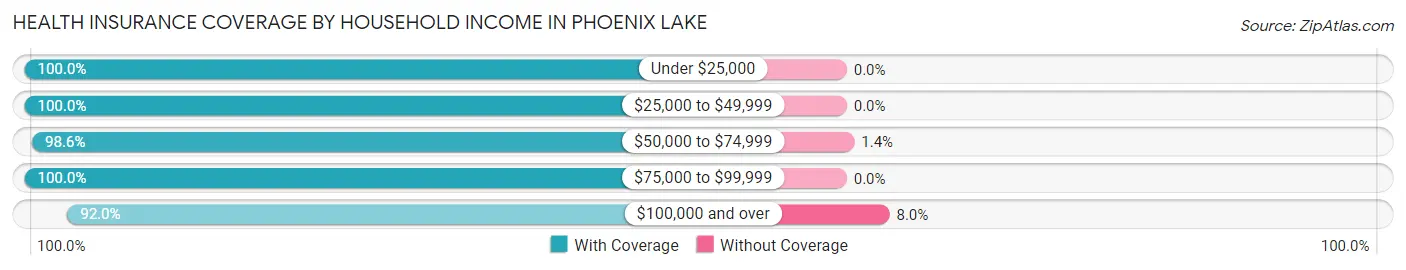
| Household Income | With Coverage | Without Coverage |
| Under $25,000 | 407 (100.0%) | 0 (0.0%) |
| $25,000 to $49,999 | 430 (100.0%) | 0 (0.0%) |
| $50,000 to $74,999 | 630 (98.6%) | 9 (1.4%) |
| $75,000 to $99,999 | 405 (100.0%) | 0 (0.0%) |
| $100,000 and over | 2,296 (92.0%) | 200 (8.0%) |
Public vs Private Health Insurance Coverage by Age in Phoenix Lake
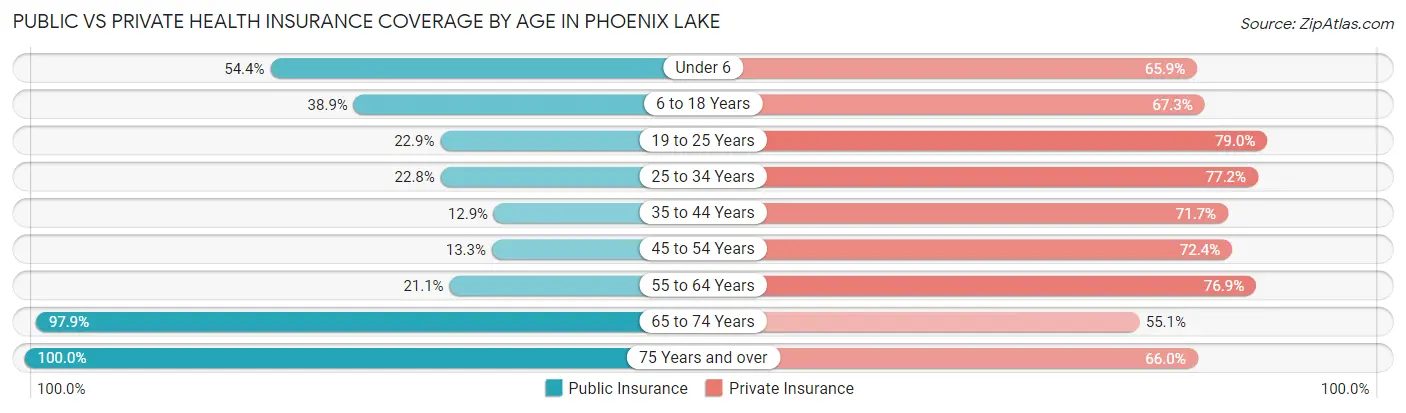
| Age Bracket | Public Insurance | Private Insurance |
| Under 6 | 99 (54.4%) | 120 (65.9%) |
| 6 to 18 Years | 137 (38.9%) | 237 (67.3%) |
| 19 to 25 Years | 101 (22.9%) | 349 (79.0%) |
| 25 to 34 Years | 59 (22.8%) | 200 (77.2%) |
| 35 to 44 Years | 25 (12.9%) | 139 (71.7%) |
| 45 to 54 Years | 67 (13.3%) | 365 (72.4%) |
| 55 to 64 Years | 193 (21.1%) | 702 (76.9%) |
| 65 to 74 Years | 842 (97.9%) | 474 (55.1%) |
| 75 Years and over | 671 (100.0%) | 443 (66.0%) |
| Total | 2,194 (50.1%) | 3,029 (69.2%) |
Disability Status by Sex by Age in Phoenix Lake
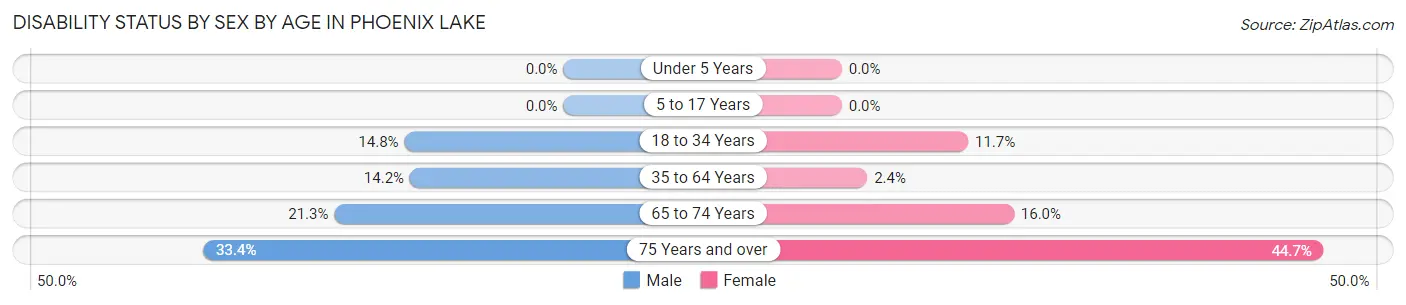
| Age Bracket | Male | Female |
| Under 5 Years | 0 (0.0%) | 0 (0.0%) |
| 5 to 17 Years | 0 (0.0%) | 0 (0.0%) |
| 18 to 34 Years | 45 (14.7%) | 49 (11.7%) |
| 35 to 64 Years | 133 (14.2%) | 16 (2.4%) |
| 65 to 74 Years | 71 (21.3%) | 84 (16.0%) |
| 75 Years and over | 104 (33.4%) | 161 (44.7%) |
Disability Class by Sex by Age in Phoenix Lake
Disability Class: Hearing Difficulty
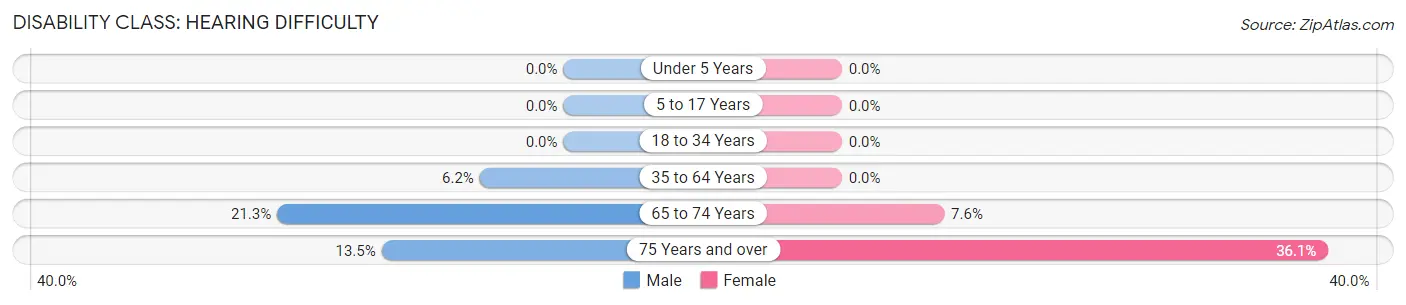
| Age Bracket | Male | Female |
| Under 5 Years | 0 (0.0%) | 0 (0.0%) |
| 5 to 17 Years | 0 (0.0%) | 0 (0.0%) |
| 18 to 34 Years | 0 (0.0%) | 0 (0.0%) |
| 35 to 64 Years | 58 (6.2%) | 0 (0.0%) |
| 65 to 74 Years | 71 (21.3%) | 40 (7.6%) |
| 75 Years and over | 42 (13.5%) | 130 (36.1%) |
Disability Class: Vision Difficulty
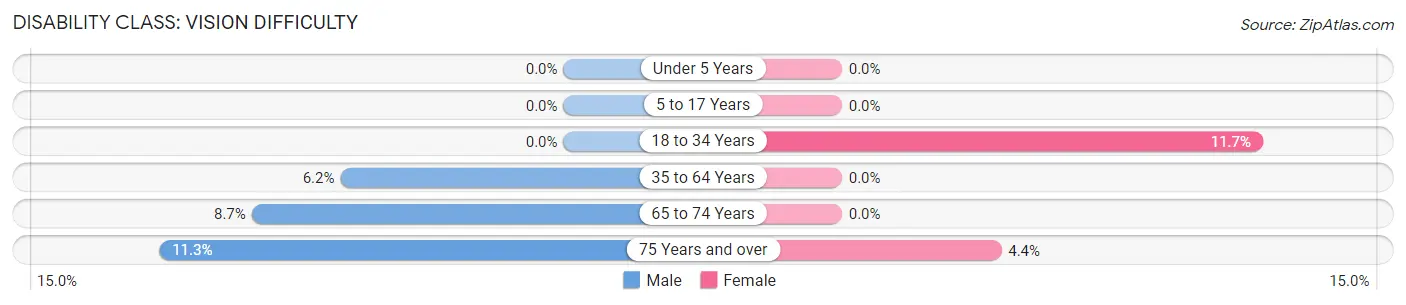
| Age Bracket | Male | Female |
| Under 5 Years | 0 (0.0%) | 0 (0.0%) |
| 5 to 17 Years | 0 (0.0%) | 0 (0.0%) |
| 18 to 34 Years | 0 (0.0%) | 49 (11.7%) |
| 35 to 64 Years | 58 (6.2%) | 0 (0.0%) |
| 65 to 74 Years | 29 (8.7%) | 0 (0.0%) |
| 75 Years and over | 35 (11.3%) | 16 (4.4%) |
Disability Class: Cognitive Difficulty
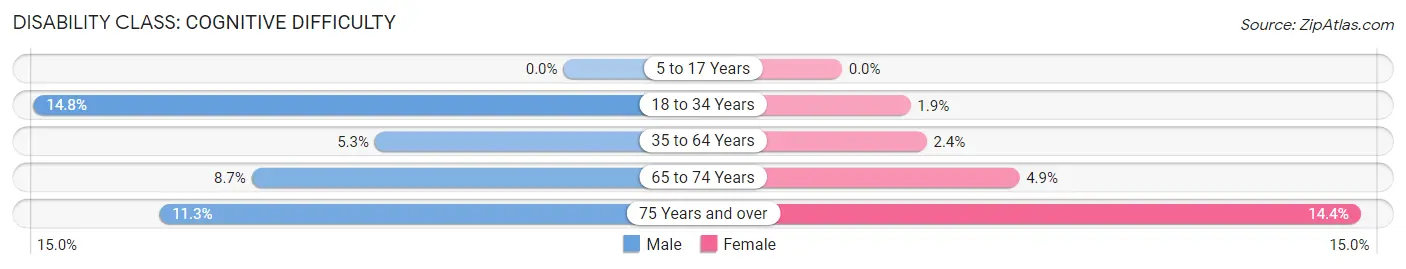
| Age Bracket | Male | Female |
| 5 to 17 Years | 0 (0.0%) | 0 (0.0%) |
| 18 to 34 Years | 45 (14.7%) | 8 (1.9%) |
| 35 to 64 Years | 49 (5.2%) | 16 (2.4%) |
| 65 to 74 Years | 29 (8.7%) | 26 (4.9%) |
| 75 Years and over | 35 (11.3%) | 52 (14.4%) |
Disability Class: Ambulatory Difficulty
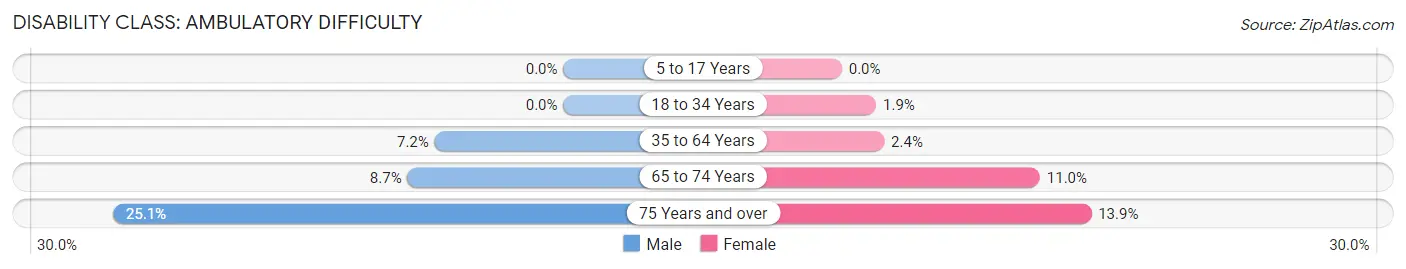
| Age Bracket | Male | Female |
| 5 to 17 Years | 0 (0.0%) | 0 (0.0%) |
| 18 to 34 Years | 0 (0.0%) | 8 (1.9%) |
| 35 to 64 Years | 67 (7.2%) | 16 (2.4%) |
| 65 to 74 Years | 29 (8.7%) | 58 (11.0%) |
| 75 Years and over | 78 (25.1%) | 50 (13.9%) |
Disability Class: Self-Care Difficulty
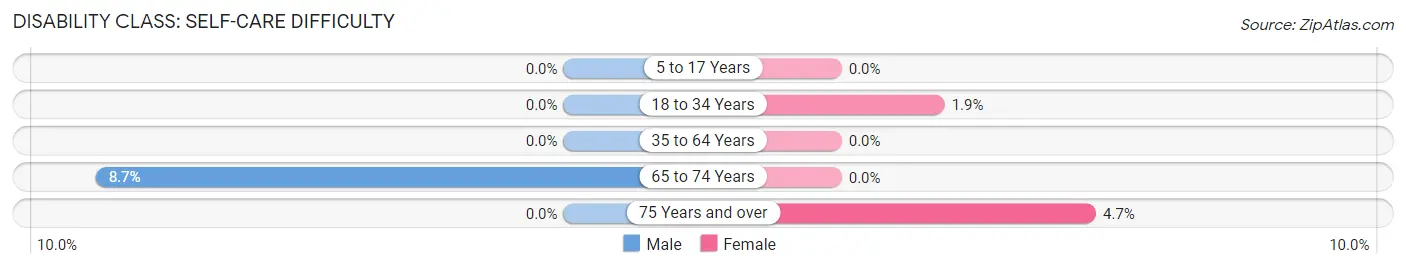
| Age Bracket | Male | Female |
| 5 to 17 Years | 0 (0.0%) | 0 (0.0%) |
| 18 to 34 Years | 0 (0.0%) | 8 (1.9%) |
| 35 to 64 Years | 0 (0.0%) | 0 (0.0%) |
| 65 to 74 Years | 29 (8.7%) | 0 (0.0%) |
| 75 Years and over | 0 (0.0%) | 17 (4.7%) |
Technology Access in Phoenix Lake
Computing Device Access in Phoenix Lake
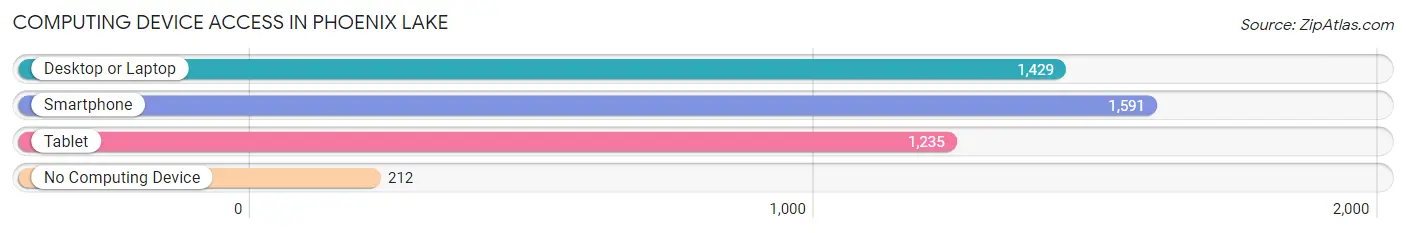
| Device Type | # Households | % Households |
| Desktop or Laptop | 1,429 | 71.1% |
| Smartphone | 1,591 | 79.1% |
| Tablet | 1,235 | 61.4% |
| No Computing Device | 212 | 10.5% |
| Total | 2,010 | 100.0% |
Internet Access in Phoenix Lake
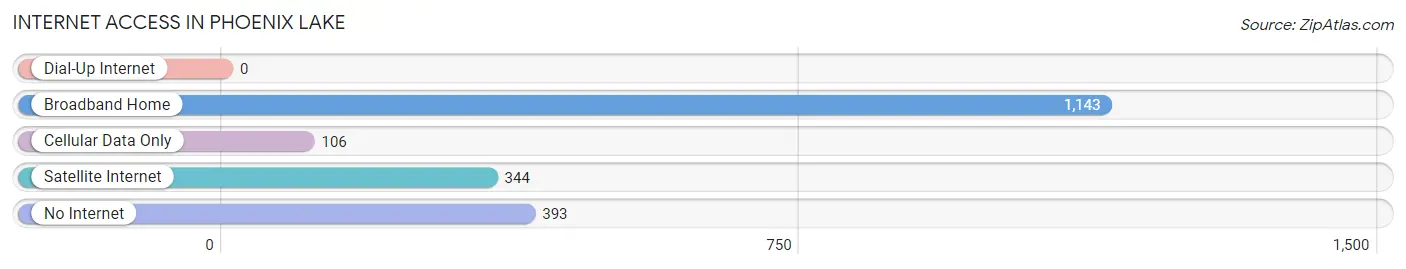
| Internet Type | # Households | % Households |
| Dial-Up Internet | 0 | 0.0% |
| Broadband Home | 1,143 | 56.9% |
| Cellular Data Only | 106 | 5.3% |
| Satellite Internet | 344 | 17.1% |
| No Internet | 393 | 19.6% |
| Total | 2,010 | 100.0% |
Phoenix Lake Summary
Lake Tahoe is a large freshwater lake located in the Sierra Nevada mountain range in California and Nevada. It is the second deepest lake in the United States and the largest alpine lake in North America. The lake is known for its crystal clear waters and stunning views of the surrounding mountains. It is a popular destination for tourists and locals alike, offering a variety of recreational activities such as swimming, boating, fishing, and skiing.
The lake is fed by 63 tributaries, including the Truckee River, which flows from the lake into Pyramid Lake in Nevada. The lake is also fed by the Carson River, which flows from the lake into the Carson Sink in Nevada. The lake is home to several species of fish, including the Lahontan cutthroat trout, which is the state fish of Nevada.
The lake is surrounded by several small towns, including South Lake Tahoe, Tahoe City, and Kings Beach. The lake is also home to several ski resorts, including Heavenly Mountain Resort, Squaw Valley, and Northstar California.
The lake is located in the Lake Tahoe Basin, which is a National Forest. The basin is home to several species of wildlife, including black bears, mountain lions, and bald eagles. The basin is also home to several species of plants, including the whitebark pine, which is the state tree of California.
The lake is also home to several Native American tribes, including the Washoe, Paiute, and Shoshone. The Washoe tribe has lived in the area for thousands of years and is known for its basket weaving and traditional songs.
The lake is also home to several resorts, including the Hyatt Regency Lake Tahoe, the Ritz-Carlton Lake Tahoe, and the Edgewood Tahoe. The lake is also home to several casinos, including the Harrah's Lake Tahoe and the Montbleu Resort Casino & Spa.
The lake is also home to several parks, including the Emerald Bay State Park, the D.L. Bliss State Park, and the Van Sickle Bi-State Park. The lake is also home to several beaches, including the Sand Harbor Beach, the Kings Beach State Recreation Area, and the Zephyr Cove Beach.
The lake is also home to several marinas, including the Tahoe Keys Marina, the Tahoe Yacht Club, and the Tahoe Paradise Marina. The lake is also home to several boat launches, including the Cave Rock Boat Launch, the Tahoe Keys Boat Launch, and the Tahoe Vista Boat Launch.
The lake is also home to several golf courses, including the Edgewood Tahoe Golf Course, the Tahoe Paradise Golf Course, and the Tahoe Donner Golf Course. The lake is also home to several ski resorts, including the Heavenly Mountain Resort, the Squaw Valley Ski Resort, and the Northstar California Ski Resort.
The lake is also home to several museums, including the Gatekeeper's Museum, the Tahoe Maritime Museum, and the Tahoe Historical Society Museum. The lake is also home to several art galleries, including the Tahoe Art League, the Tahoe Art Gallery, and the Tahoe Artisans Gallery.
The lake is also home to several restaurants, including the Lone Eagle Grille, the Wolfdale's Cuisine Unique, and the Tahoe Biltmore. The lake is also home to several bars, including the Tahoe Tap Room, the Tahoe Tavern, and the Tahoe Saloon.
The lake is also home to several shopping centers, including the Tahoe City Shopping Center, the Tahoe Keys Shopping Center, and the Tahoe Vista Shopping Center. The lake is also home to several movie theaters, including the Tahoe Cinema, the Tahoe Drive-In, and the Tahoe Twin Cinemas.
The lake is also home to several parks, including the Tahoe National Forest, the Desolation Wilderness, and the Lake Tahoe State Park. The lake is also home to several campgrounds, including the Fallen Leaf Campground, the Meeks Bay Campground, and the Tahoe Meadows Campground.
The lake is also home to several ski resorts, including the Heavenly Mountain Resort, the Squaw Valley Ski Resort, and the Northstar California Ski Resort. The lake is also home to several golf courses, including the Edgewood Tahoe Golf Course, the Tahoe Paradise Golf Course, and the Tahoe Donner Golf Course.
The lake is also home to several marinas, including the Tahoe Keys Marina, the Tahoe Yacht Club, and the Tahoe Paradise Marina. The lake is also home to several boat launches, including the Cave Rock Boat Launch, the Tahoe Keys Boat Launch, and the Tahoe Vista Boat Launch.
The lake is also home to several beaches, including the Sand Harbor Beach, the Kings Beach State Recreation Area, and the Zephyr Cove Beach. The lake is also home to several parks, including the Emerald Bay State Park, the D.L. Bliss State Park, and the Van Sickle Bi-State Park.
The lake is also home to several Native American tribes, including the Washoe, Paiute, and Shoshone. The lake is also home to several resorts, including the Hyatt Regency Lake Tahoe, the Ritz-Carlton Lake Tahoe, and the Edgewood Tahoe. The lake is also home to several casinos, including the Harrah's Lake Tahoe and the Montbleu Resort Casino & Spa.
The lake is also home to several museums, including the Gatekeeper's Museum, the Tahoe Maritime Museum, and the Tahoe Historical Society Museum. The lake is also home to several art galleries, including the Tahoe Art League, the Tahoe Art Gallery, and the Tahoe Artisans Gallery.
The lake is also home to several restaurants, including the Lone Eagle Grille, the Wolfdale's Cuisine Unique, and the Tahoe Biltmore. The lake is also home to several bars, including the Tahoe Tap Room, the Tahoe Tavern, and the Tahoe Saloon.
The
Common Questions
What is Per Capita Income in Phoenix Lake?
Per Capita income in Phoenix Lake is $50,265.
What is the Median Family Income in Phoenix Lake?
Median Family Income in Phoenix Lake is $108,191.
What is the Median Household income in Phoenix Lake?
Median Household Income in Phoenix Lake is $72,173.
What is Income or Wage Gap in Phoenix Lake?
Income or Wage Gap in Phoenix Lake is 37.0%.
Women in Phoenix Lake earn 63.0 cents for every dollar earned by a man.
What is Inequality or Gini Index in Phoenix Lake?
Inequality or Gini Index in Phoenix Lake is 0.45.
What is the Total Population of Phoenix Lake?
Total Population of Phoenix Lake is 4,377.
What is the Total Male Population of Phoenix Lake?
Total Male Population of Phoenix Lake is 2,162.
What is the Total Female Population of Phoenix Lake?
Total Female Population of Phoenix Lake is 2,215.
What is the Ratio of Males per 100 Females in Phoenix Lake?
There are 97.61 Males per 100 Females in Phoenix Lake.
What is the Ratio of Females per 100 Males in Phoenix Lake?
There are 102.45 Females per 100 Males in Phoenix Lake.
What is the Median Population Age in Phoenix Lake?
Median Population Age in Phoenix Lake is 58.5 Years.
What is the Average Family Size in Phoenix Lake
Average Family Size in Phoenix Lake is 2.7 People.
What is the Average Household Size in Phoenix Lake
Average Household Size in Phoenix Lake is 2.2 People.
How Large is the Labor Force in Phoenix Lake?
There are 1,753 People in the Labor Forcein in Phoenix Lake.
What is the Percentage of People in the Labor Force in Phoenix Lake?
45.3% of People are in the Labor Force in Phoenix Lake.
What is the Unemployment Rate in Phoenix Lake?
Unemployment Rate in Phoenix Lake is 5.8%.