Old Fig Garden, CA Map & Demographics
Old Fig Garden Map
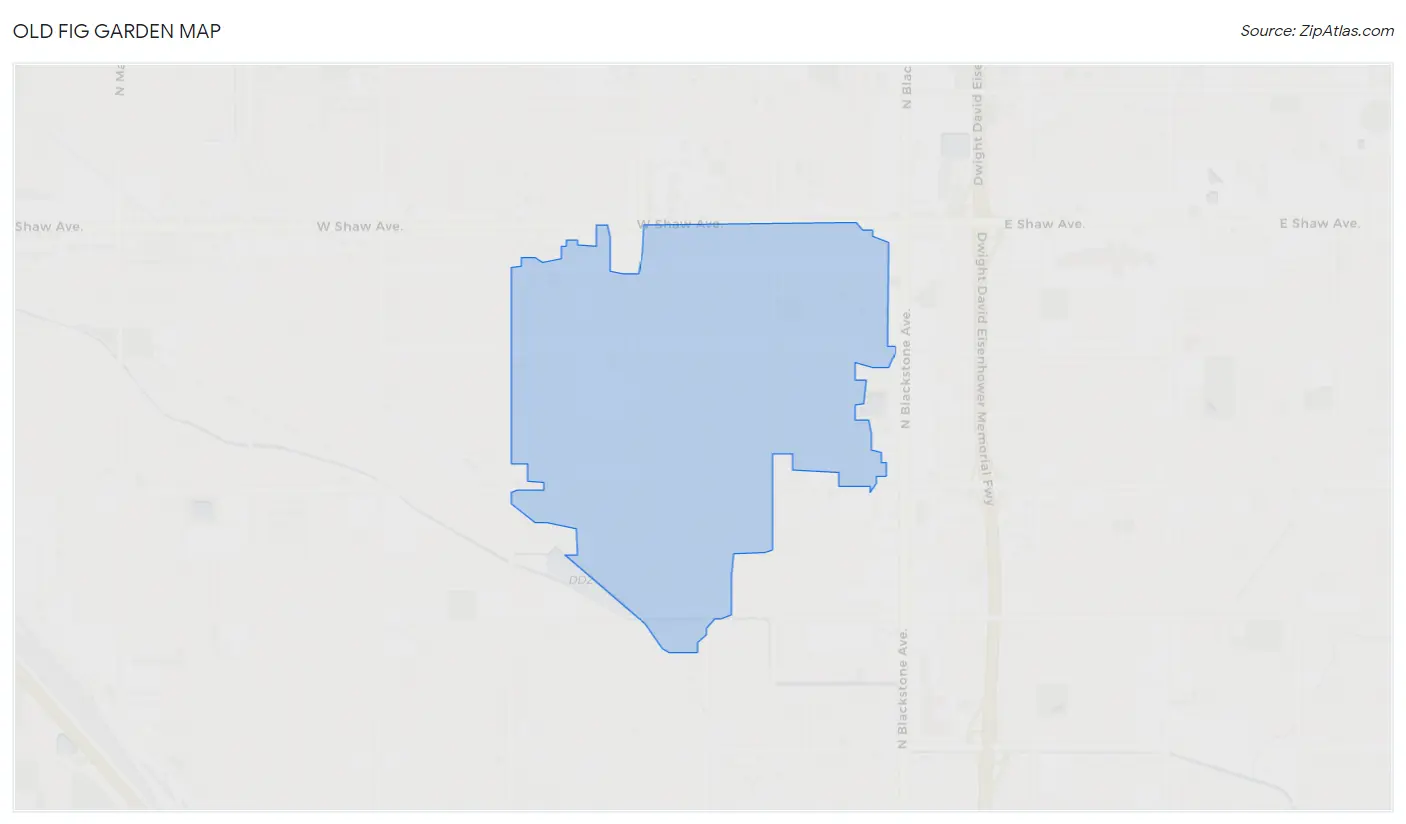
Old Fig Garden Overview
$50,676
PER CAPITA INCOME
$136,875
AVG FAMILY INCOME
$105,648
AVG HOUSEHOLD INCOME
20.8%
WAGE / INCOME GAP [ % ]
79.2¢/ $1
WAGE / INCOME GAP [ $ ]
0.46
INEQUALITY / GINI INDEX
5,156
TOTAL POPULATION
2,631
MALE POPULATION
2,525
FEMALE POPULATION
104.20
MALES / 100 FEMALES
95.97
FEMALES / 100 MALES
40.9
MEDIAN AGE
3.3
AVG FAMILY SIZE
2.7
AVG HOUSEHOLD SIZE
2,622
LABOR FORCE [ PEOPLE ]
66.3%
PERCENT IN LABOR FORCE
7.8%
UNEMPLOYMENT RATE
Income in Old Fig Garden
Income Overview in Old Fig Garden
Per Capita Income in Old Fig Garden is $50,676, while median incomes of families and households are $136,875 and $105,648 respectively.
| Characteristic | Number | Measure |
| Per Capita Income | 5,156 | $50,676 |
| Median Family Income | 1,258 | $136,875 |
| Mean Family Income | 1,258 | $158,435 |
| Median Household Income | 1,904 | $105,648 |
| Mean Household Income | 1,904 | $135,138 |
| Income Deficit | 1,258 | $0 |
| Wage / Income Gap (%) | 5,156 | 20.83% |
| Wage / Income Gap ($) | 5,156 | 79.17¢ per $1 |
| Gini / Inequality Index | 5,156 | 0.46 |
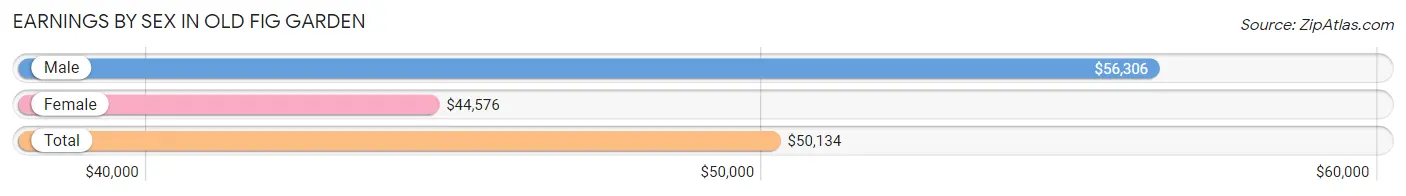
Earnings by Sex in Old Fig Garden
Average Earnings in Old Fig Garden are $50,134, $56,306 for men and $44,576 for women, a difference of 20.8%.
| Sex | Number | Average Earnings |
| Male | 1,277 (48.8%) | $56,306 |
| Female | 1,340 (51.2%) | $44,576 |
| Total | 2,617 (100.0%) | $50,134 |
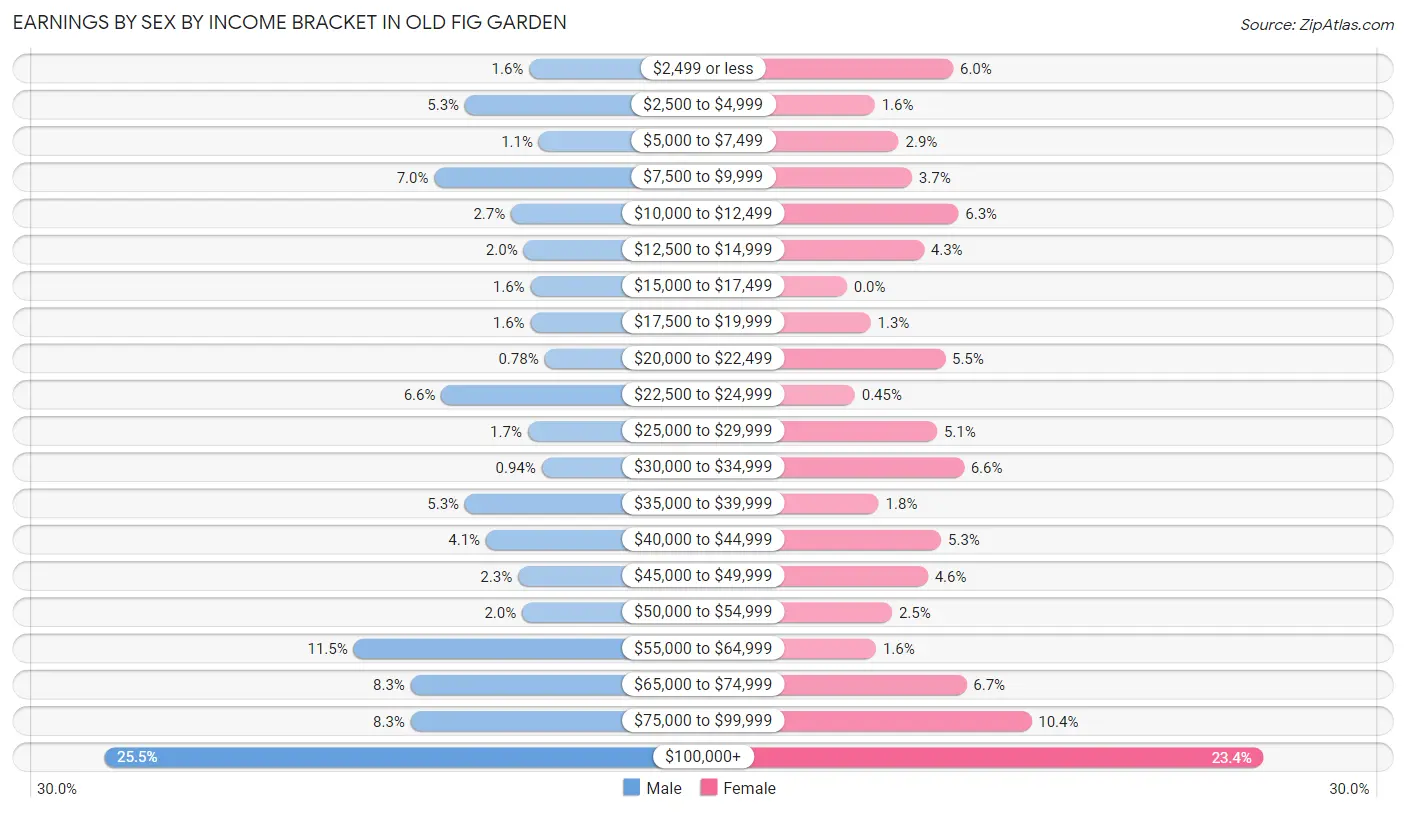
Earnings by Sex by Income Bracket in Old Fig Garden
The most common earnings brackets in Old Fig Garden are $100,000+ for men (326 | 25.5%) and $100,000+ for women (314 | 23.4%).
| Income | Male | Female |
| $2,499 or less | 21 (1.6%) | 80 (6.0%) |
| $2,500 to $4,999 | 67 (5.2%) | 21 (1.6%) |
| $5,000 to $7,499 | 14 (1.1%) | 39 (2.9%) |
| $7,500 to $9,999 | 89 (7.0%) | 49 (3.7%) |
| $10,000 to $12,499 | 34 (2.7%) | 84 (6.3%) |
| $12,500 to $14,999 | 25 (2.0%) | 58 (4.3%) |
| $15,000 to $17,499 | 20 (1.6%) | 0 (0.0%) |
| $17,500 to $19,999 | 20 (1.6%) | 18 (1.3%) |
| $20,000 to $22,499 | 10 (0.8%) | 74 (5.5%) |
| $22,500 to $24,999 | 84 (6.6%) | 6 (0.4%) |
| $25,000 to $29,999 | 22 (1.7%) | 68 (5.1%) |
| $30,000 to $34,999 | 12 (0.9%) | 88 (6.6%) |
| $35,000 to $39,999 | 67 (5.2%) | 24 (1.8%) |
| $40,000 to $44,999 | 52 (4.1%) | 71 (5.3%) |
| $45,000 to $49,999 | 29 (2.3%) | 61 (4.5%) |
| $50,000 to $54,999 | 26 (2.0%) | 34 (2.5%) |
| $55,000 to $64,999 | 147 (11.5%) | 22 (1.6%) |
| $65,000 to $74,999 | 106 (8.3%) | 90 (6.7%) |
| $75,000 to $99,999 | 106 (8.3%) | 139 (10.4%) |
| $100,000+ | 326 (25.5%) | 314 (23.4%) |
| Total | 1,277 (100.0%) | 1,340 (100.0%) |
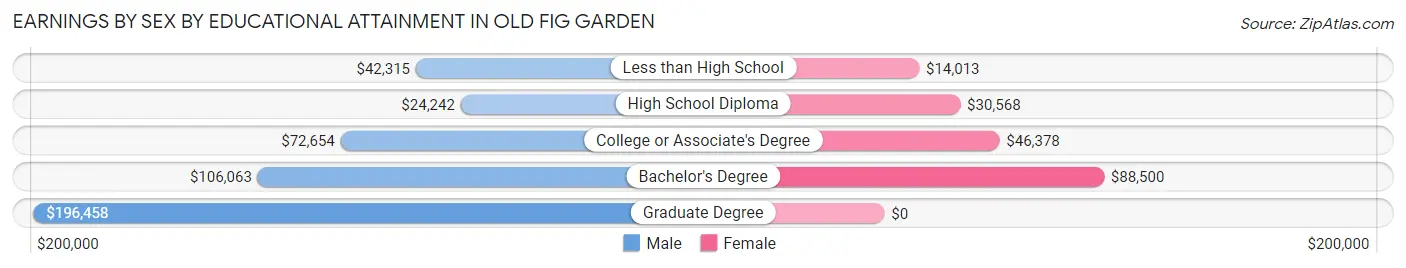
Earnings by Sex by Educational Attainment in Old Fig Garden
Average earnings in Old Fig Garden are $63,793 for men and $47,275 for women, a difference of 25.9%. Men with an educational attainment of graduate degree enjoy the highest average annual earnings of $196,458, while those with high school diploma education earn the least with $24,242. Women with an educational attainment of bachelor's degree earn the most with the average annual earnings of $88,500, while those with less than high school education have the smallest earnings of $14,013.
| Educational Attainment | Male Income | Female Income |
| Less than High School | $42,315 | $14,013 |
| High School Diploma | $24,242 | $30,568 |
| College or Associate's Degree | $72,654 | $46,378 |
| Bachelor's Degree | $106,063 | $88,500 |
| Graduate Degree | $196,458 | $0 |
| Total | $63,793 | $47,275 |
Family Income in Old Fig Garden
Family Income Brackets in Old Fig Garden
According to the Old Fig Garden family income data, there are 387 families falling into the $200,000+ income range, which is the most common income bracket and makes up 30.8% of all families. Conversely, the $25,000 to $34,999 income bracket is the least frequent group with only 15 families (1.2%) belonging to this category.
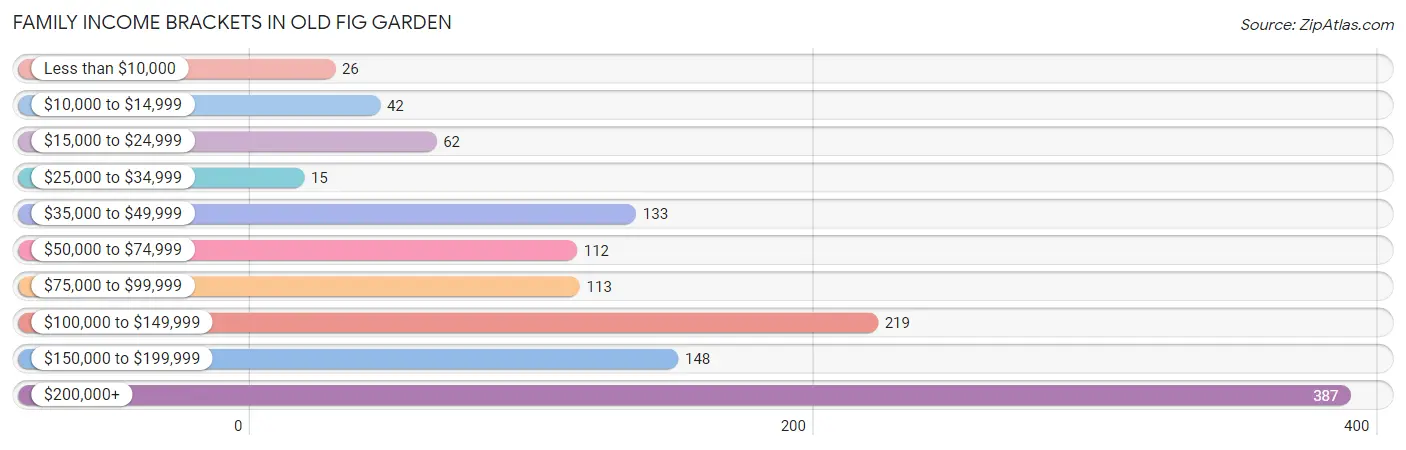
| Income Bracket | # Families | % Families |
| Less than $10,000 | 26 | 2.1% |
| $10,000 to $14,999 | 42 | 3.3% |
| $15,000 to $24,999 | 62 | 4.9% |
| $25,000 to $34,999 | 15 | 1.2% |
| $35,000 to $49,999 | 133 | 10.6% |
| $50,000 to $74,999 | 112 | 8.9% |
| $75,000 to $99,999 | 113 | 9.0% |
| $100,000 to $149,999 | 219 | 17.4% |
| $150,000 to $199,999 | 148 | 11.8% |
| $200,000+ | 387 | 30.8% |
Family Income by Famaliy Size in Old Fig Garden
5-person families (149 | 11.8%) account for the highest median family income in Old Fig Garden with $248,785 per family, while 2-person families (646 | 51.3%) have the highest median income of $70,834 per family member.
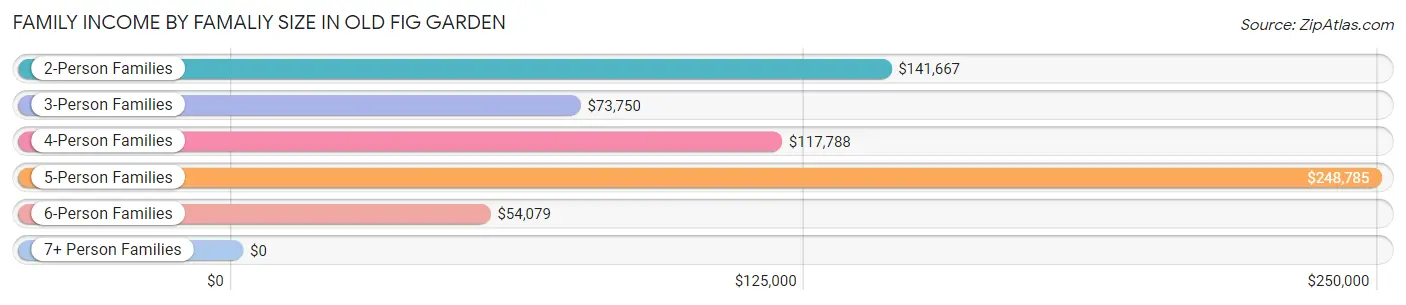
| Income Bracket | # Families | Median Income |
| 2-Person Families | 646 (51.3%) | $141,667 |
| 3-Person Families | 246 (19.6%) | $73,750 |
| 4-Person Families | 148 (11.8%) | $117,788 |
| 5-Person Families | 149 (11.8%) | $248,785 |
| 6-Person Families | 48 (3.8%) | $54,079 |
| 7+ Person Families | 21 (1.7%) | $0 |
| Total | 1,258 (100.0%) | $136,875 |
Family Income by Number of Earners in Old Fig Garden
The median family income in Old Fig Garden is $136,875, with families comprising 2 earners (600) having the highest median family income of $160,811, while families with no earners (158) have the lowest median family income of $65,833, accounting for 47.7% and 12.6% of families, respectively.
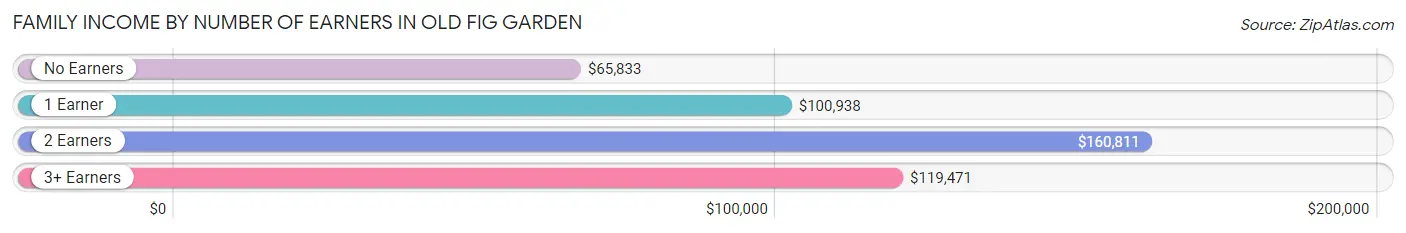
| Number of Earners | # Families | Median Income |
| No Earners | 158 (12.6%) | $65,833 |
| 1 Earner | 431 (34.3%) | $100,938 |
| 2 Earners | 600 (47.7%) | $160,811 |
| 3+ Earners | 69 (5.5%) | $119,471 |
| Total | 1,258 (100.0%) | $136,875 |
Household Income in Old Fig Garden
Household Income Brackets in Old Fig Garden
With 453 households falling in the category, the $200,000+ income range is the most frequent in Old Fig Garden, accounting for 23.8% of all households. In contrast, only 50 households (2.6%) fall into the $10,000 to $14,999 income bracket, making it the least populous group.
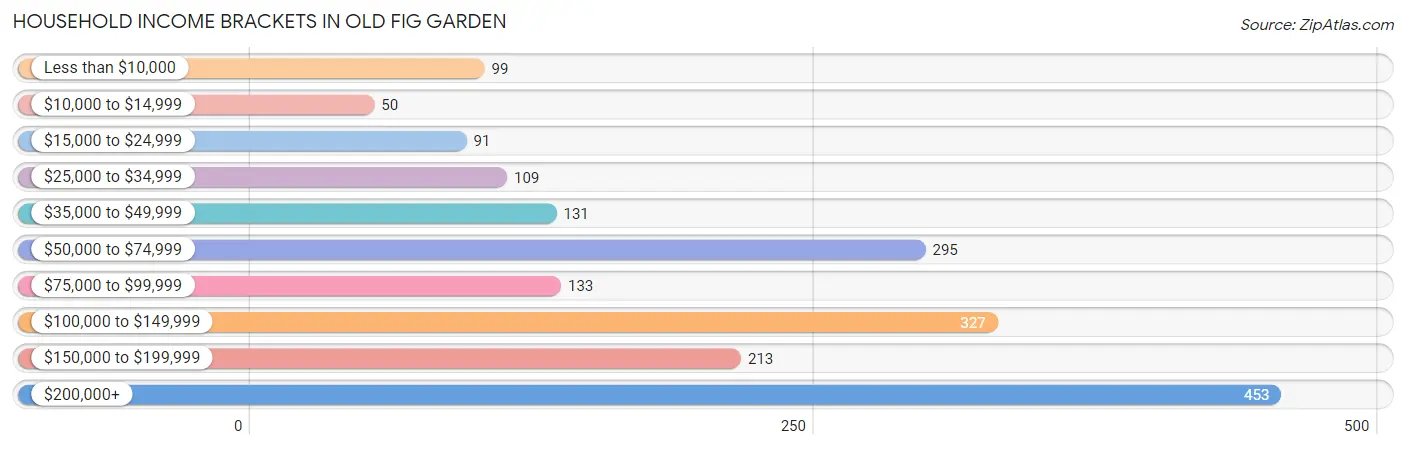
| Income Bracket | # Households | % Households |
| Less than $10,000 | 99 | 5.2% |
| $10,000 to $14,999 | 50 | 2.6% |
| $15,000 to $24,999 | 91 | 4.8% |
| $25,000 to $34,999 | 109 | 5.7% |
| $35,000 to $49,999 | 131 | 6.9% |
| $50,000 to $74,999 | 295 | 15.5% |
| $75,000 to $99,999 | 133 | 7.0% |
| $100,000 to $149,999 | 327 | 17.2% |
| $150,000 to $199,999 | 213 | 11.2% |
| $200,000+ | 453 | 23.8% |
Household Income by Householder Age in Old Fig Garden
The median household income in Old Fig Garden is $105,648, with the highest median household income of $124,881 found in the 45 to 64 years age bracket for the primary householder. A total of 652 households (34.2%) fall into this category. Meanwhile, the 15 to 24 years age bracket for the primary householder has the lowest median household income of $0, with 75 households (3.9%) in this group.
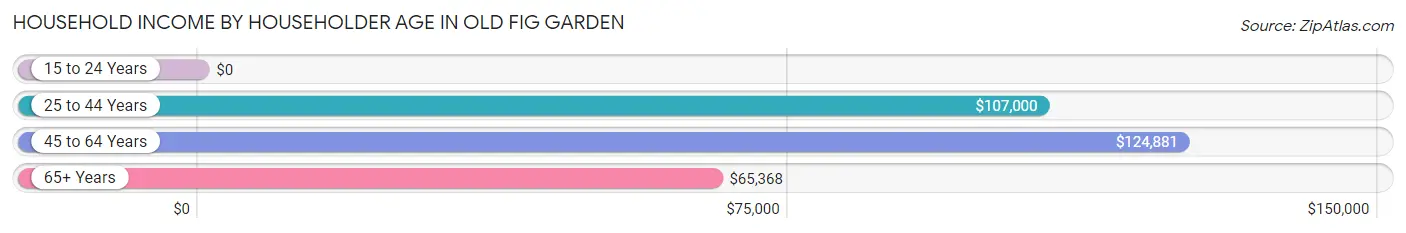
| Income Bracket | # Households | Median Income |
| 15 to 24 Years | 75 (3.9%) | $0 |
| 25 to 44 Years | 544 (28.6%) | $107,000 |
| 45 to 64 Years | 652 (34.2%) | $124,881 |
| 65+ Years | 633 (33.3%) | $65,368 |
| Total | 1,904 (100.0%) | $105,648 |
Poverty in Old Fig Garden
Income Below Poverty by Sex and Age in Old Fig Garden
With 11.5% poverty level for males and 11.5% for females among the residents of Old Fig Garden, 15 year old males and 18 to 24 year old females are the most vulnerable to poverty, with 26 males (100.0%) and 48 females (24.2%) in their respective age groups living below the poverty level.
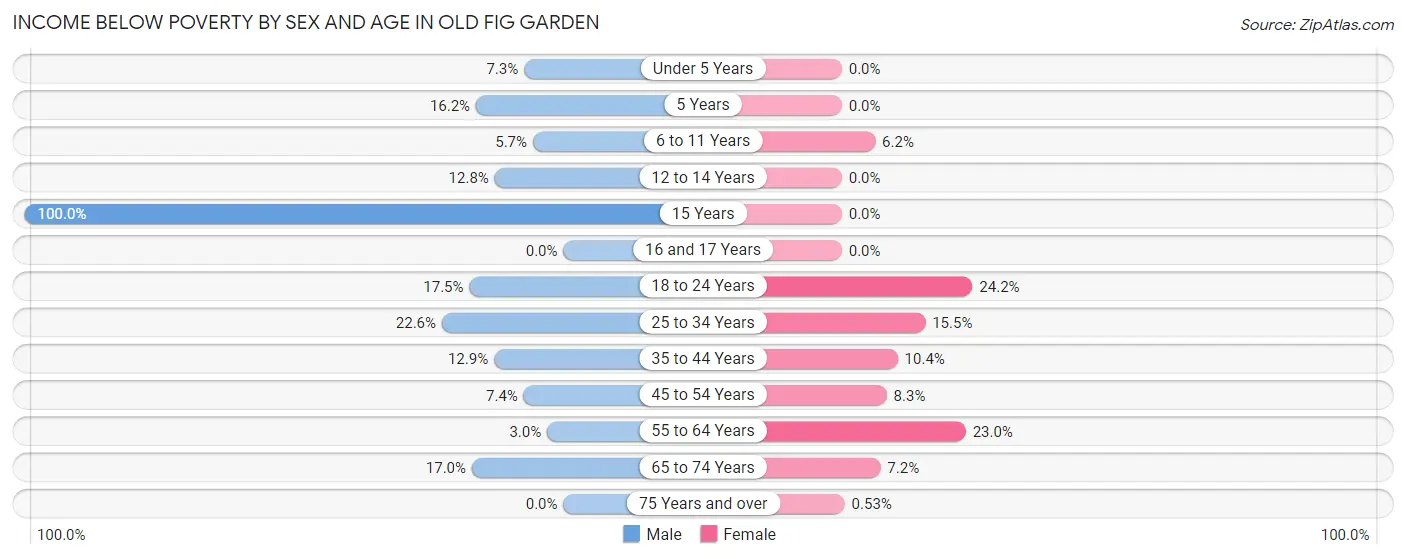
| Age Bracket | Male | Female |
| Under 5 Years | 7 (7.3%) | 0 (0.0%) |
| 5 Years | 6 (16.2%) | 0 (0.0%) |
| 6 to 11 Years | 28 (5.7%) | 13 (6.2%) |
| 12 to 14 Years | 13 (12.8%) | 0 (0.0%) |
| 15 Years | 26 (100.0%) | 0 (0.0%) |
| 16 and 17 Years | 0 (0.0%) | 0 (0.0%) |
| 18 to 24 Years | 26 (17.4%) | 48 (24.2%) |
| 25 to 34 Years | 85 (22.6%) | 55 (15.5%) |
| 35 to 44 Years | 39 (12.9%) | 25 (10.4%) |
| 45 to 54 Years | 17 (7.4%) | 31 (8.3%) |
| 55 to 64 Years | 10 (3.0%) | 95 (23.0%) |
| 65 to 74 Years | 45 (17.0%) | 21 (7.2%) |
| 75 Years and over | 0 (0.0%) | 1 (0.5%) |
| Total | 302 (11.5%) | 289 (11.5%) |
Income Above Poverty by Sex and Age in Old Fig Garden
According to the poverty statistics in Old Fig Garden, males aged 16 and 17 years and females aged under 5 years are the age groups that are most secure financially, with 100.0% of males and 100.0% of females in these age groups living above the poverty line.
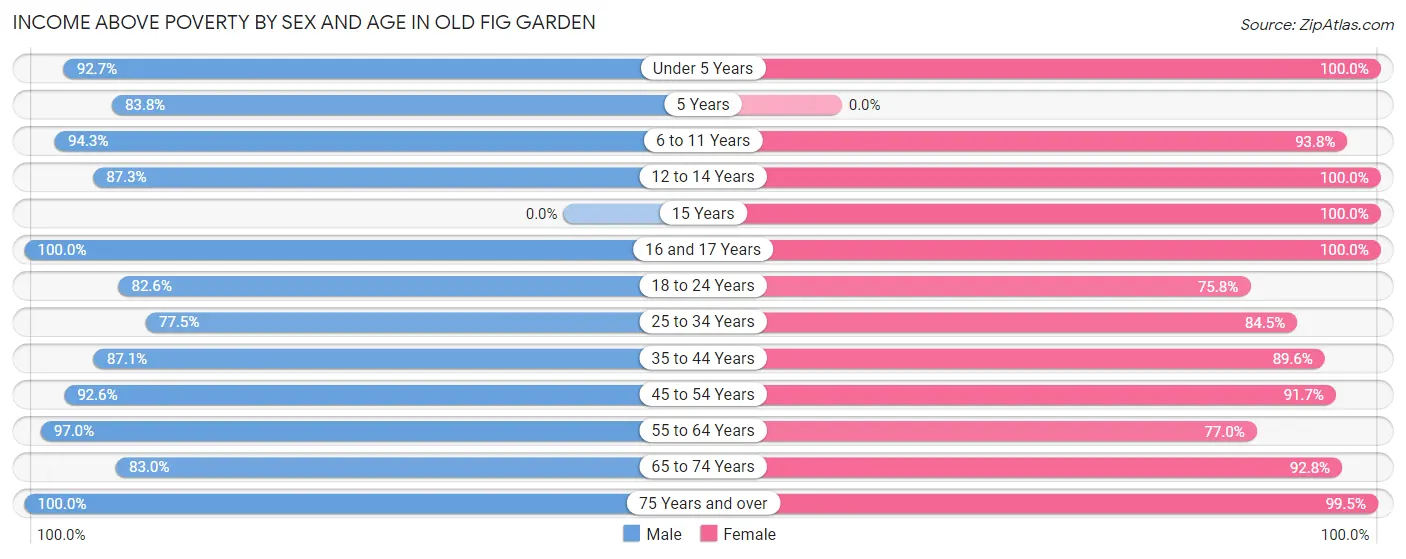
| Age Bracket | Male | Female |
| Under 5 Years | 89 (92.7%) | 149 (100.0%) |
| 5 Years | 31 (83.8%) | 0 (0.0%) |
| 6 to 11 Years | 467 (94.3%) | 197 (93.8%) |
| 12 to 14 Years | 89 (87.3%) | 54 (100.0%) |
| 15 Years | 0 (0.0%) | 17 (100.0%) |
| 16 and 17 Years | 54 (100.0%) | 18 (100.0%) |
| 18 to 24 Years | 123 (82.6%) | 150 (75.8%) |
| 25 to 34 Years | 292 (77.4%) | 300 (84.5%) |
| 35 to 44 Years | 264 (87.1%) | 216 (89.6%) |
| 45 to 54 Years | 214 (92.6%) | 341 (91.7%) |
| 55 to 64 Years | 320 (97.0%) | 318 (77.0%) |
| 65 to 74 Years | 220 (83.0%) | 272 (92.8%) |
| 75 Years and over | 166 (100.0%) | 189 (99.5%) |
| Total | 2,329 (88.5%) | 2,221 (88.5%) |
Income Below Poverty Among Married-Couple Families in Old Fig Garden
The poverty statistics for married-couple families in Old Fig Garden show that 5.6% or 55 of the total 985 families live below the poverty line. Families with no children have the highest poverty rate of 7.4%, comprising of 44 families. On the other hand, families with 3 or 4 children have the lowest poverty rate of 0.0%, which includes 0 families.
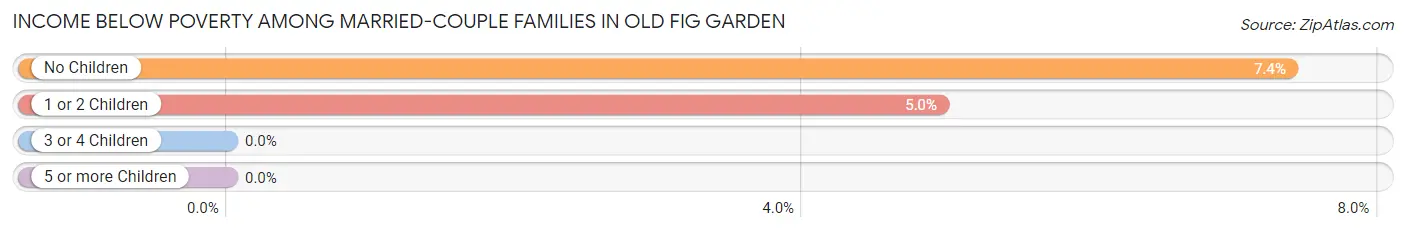
| Children | Above Poverty | Below Poverty |
| No Children | 552 (92.6%) | 44 (7.4%) |
| 1 or 2 Children | 211 (95.1%) | 11 (5.0%) |
| 3 or 4 Children | 159 (100.0%) | 0 (0.0%) |
| 5 or more Children | 8 (100.0%) | 0 (0.0%) |
| Total | 930 (94.4%) | 55 (5.6%) |
Income Below Poverty Among Single-Parent Households in Old Fig Garden
According to the poverty data in Old Fig Garden, 2.8% or 3 single-father households and 38.6% or 64 single-mother households are living below the poverty line. Among single-father households, those with no children have the highest poverty rate, with 3 households (6.2%) experiencing poverty. Likewise, among single-mother households, those with 1 or 2 children have the highest poverty rate, with 64 households (62.7%) falling below the poverty line.
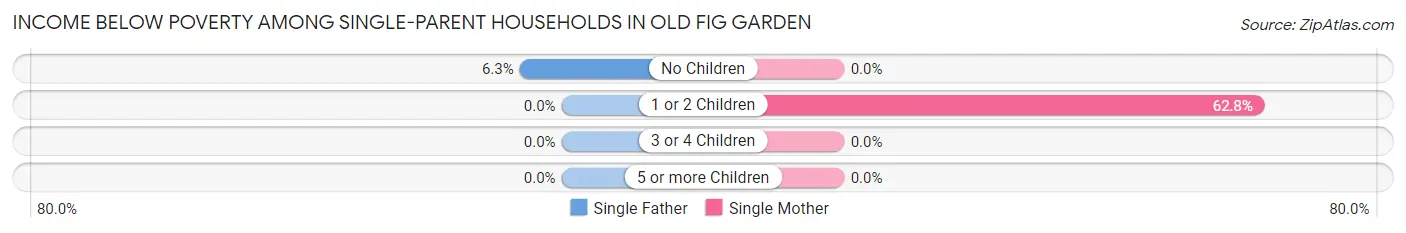
| Children | Single Father | Single Mother |
| No Children | 3 (6.2%) | 0 (0.0%) |
| 1 or 2 Children | 0 (0.0%) | 64 (62.7%) |
| 3 or 4 Children | 0 (0.0%) | 0 (0.0%) |
| 5 or more Children | 0 (0.0%) | 0 (0.0%) |
| Total | 3 (2.8%) | 64 (38.6%) |
Income Below Poverty Among Married-Couple vs Single-Parent Households in Old Fig Garden
The poverty data for Old Fig Garden shows that 55 of the married-couple family households (5.6%) and 67 of the single-parent households (24.5%) are living below the poverty level. Within the married-couple family households, those with no children have the highest poverty rate, with 44 households (7.4%) falling below the poverty line. Among the single-parent households, those with 1 or 2 children have the highest poverty rate, with 64 household (39.8%) living below poverty.
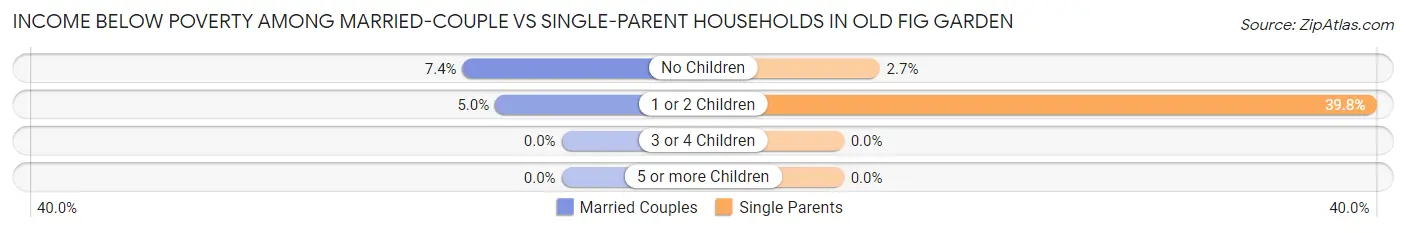
| Children | Married-Couple Families | Single-Parent Households |
| No Children | 44 (7.4%) | 3 (2.7%) |
| 1 or 2 Children | 11 (5.0%) | 64 (39.8%) |
| 3 or 4 Children | 0 (0.0%) | 0 (0.0%) |
| 5 or more Children | 0 (0.0%) | 0 (0.0%) |
| Total | 55 (5.6%) | 67 (24.5%) |
Race in Old Fig Garden
The most populous races in Old Fig Garden are White / Caucasian (2,612 | 50.7%), Hispanic or Latino (2,455 | 47.6%), and Two or more Races (1,588 | 30.8%).
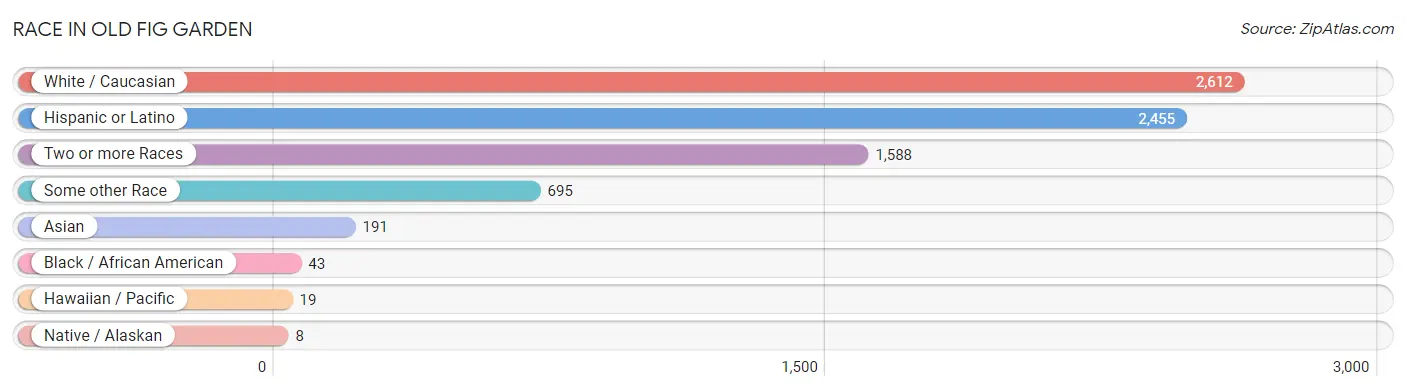
| Race | # Population | % Population |
| Asian | 191 | 3.7% |
| Black / African American | 43 | 0.8% |
| Hawaiian / Pacific | 19 | 0.4% |
| Hispanic or Latino | 2,455 | 47.6% |
| Native / Alaskan | 8 | 0.2% |
| White / Caucasian | 2,612 | 50.7% |
| Two or more Races | 1,588 | 30.8% |
| Some other Race | 695 | 13.5% |
| Total | 5,156 | 100.0% |
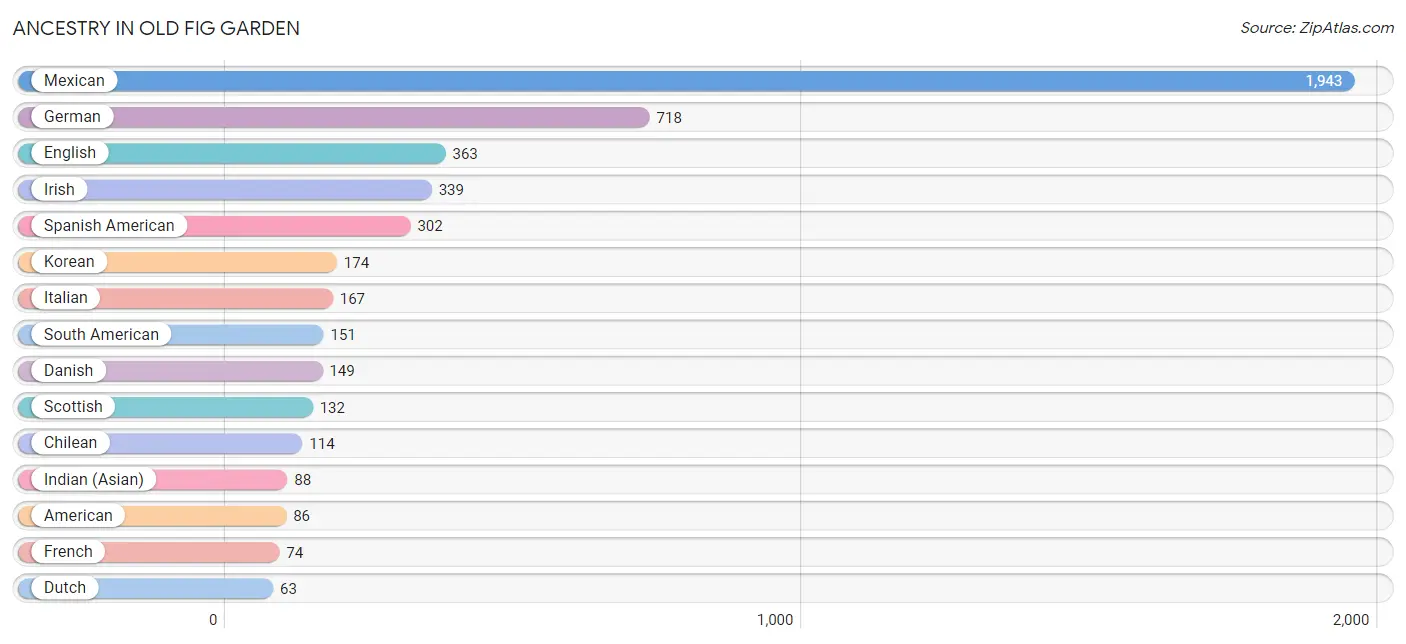
Ancestry in Old Fig Garden
The most populous ancestries reported in Old Fig Garden are Mexican (1,943 | 37.7%), German (718 | 13.9%), English (363 | 7.0%), Irish (339 | 6.6%), and Spanish American (302 | 5.9%), together accounting for 71.1% of all Old Fig Garden residents.
| Ancestry | # Population | % Population |
| Albanian | 6 | 0.1% |
| American | 86 | 1.7% |
| Apache | 12 | 0.2% |
| Arab | 4 | 0.1% |
| Argentinean | 9 | 0.2% |
| Armenian | 33 | 0.6% |
| Bangladeshi | 44 | 0.9% |
| Bhutanese | 27 | 0.5% |
| British | 37 | 0.7% |
| Burmese | 9 | 0.2% |
| Central American | 33 | 0.6% |
| Chilean | 114 | 2.2% |
| Colombian | 28 | 0.5% |
| Croatian | 4 | 0.1% |
| Danish | 149 | 2.9% |
| Dutch | 63 | 1.2% |
| Eastern European | 11 | 0.2% |
| English | 363 | 7.0% |
| European | 38 | 0.7% |
| French | 74 | 1.4% |
| German | 718 | 13.9% |
| Guatemalan | 13 | 0.3% |
| Indian (Asian) | 88 | 1.7% |
| Iranian | 28 | 0.5% |
| Irish | 339 | 6.6% |
| Italian | 167 | 3.2% |
| Korean | 174 | 3.4% |
| Malaysian | 21 | 0.4% |
| Mexican | 1,943 | 37.7% |
| Mexican American Indian | 19 | 0.4% |
| Native Hawaiian | 17 | 0.3% |
| Navajo | 14 | 0.3% |
| Northern European | 22 | 0.4% |
| Norwegian | 49 | 0.9% |
| Polish | 15 | 0.3% |
| Portuguese | 40 | 0.8% |
| Pueblo | 10 | 0.2% |
| Russian | 53 | 1.0% |
| Salvadoran | 20 | 0.4% |
| Samoan | 44 | 0.9% |
| Scandinavian | 25 | 0.5% |
| Scotch-Irish | 38 | 0.7% |
| Scottish | 132 | 2.6% |
| South American | 151 | 2.9% |
| Spaniard | 22 | 0.4% |
| Spanish American | 302 | 5.9% |
| Subsaharan African | 8 | 0.2% |
| Swedish | 59 | 1.1% |
| Swiss | 16 | 0.3% |
| Ukrainian | 6 | 0.1% |
| Welsh | 5 | 0.1% |
| Yaqui | 14 | 0.3% | View All 52 Rows |
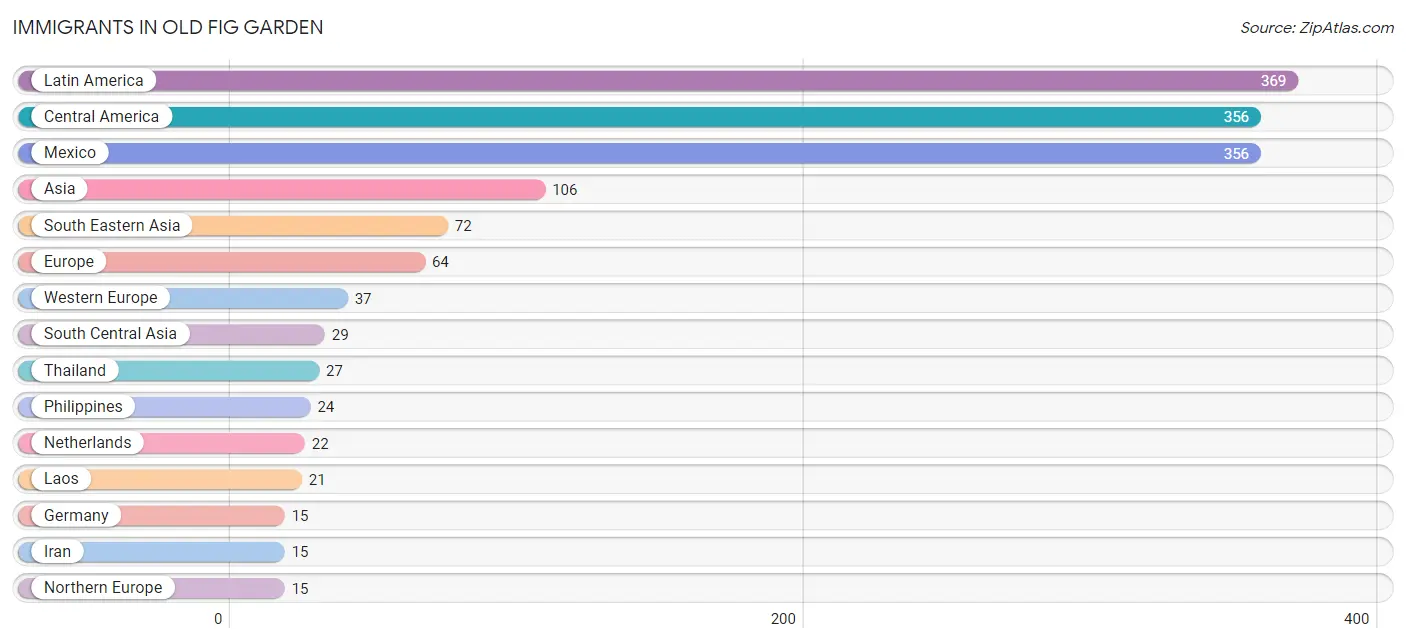
Immigrants in Old Fig Garden
The most numerous immigrant groups reported in Old Fig Garden came from Latin America (369 | 7.2%), Central America (356 | 6.9%), Mexico (356 | 6.9%), Asia (106 | 2.1%), and South Eastern Asia (72 | 1.4%), together accounting for 24.4% of all Old Fig Garden residents.
| Immigration Origin | # Population | % Population |
| Albania | 6 | 0.1% |
| Argentina | 6 | 0.1% |
| Asia | 106 | 2.1% |
| Central America | 356 | 6.9% |
| Colombia | 7 | 0.1% |
| Eastern Asia | 5 | 0.1% |
| Eastern Europe | 6 | 0.1% |
| England | 9 | 0.2% |
| Europe | 64 | 1.2% |
| Germany | 15 | 0.3% |
| India | 14 | 0.3% |
| Iran | 15 | 0.3% |
| Korea | 5 | 0.1% |
| Laos | 21 | 0.4% |
| Latin America | 369 | 7.2% |
| Mexico | 356 | 6.9% |
| Micronesia | 12 | 0.2% |
| Netherlands | 22 | 0.4% |
| Northern Europe | 15 | 0.3% |
| Oceania | 12 | 0.2% |
| Philippines | 24 | 0.5% |
| South America | 13 | 0.3% |
| South Central Asia | 29 | 0.6% |
| South Eastern Asia | 72 | 1.4% |
| Southern Europe | 6 | 0.1% |
| Spain | 6 | 0.1% |
| Sweden | 6 | 0.1% |
| Thailand | 27 | 0.5% |
| Western Europe | 37 | 0.7% | View All 29 Rows |
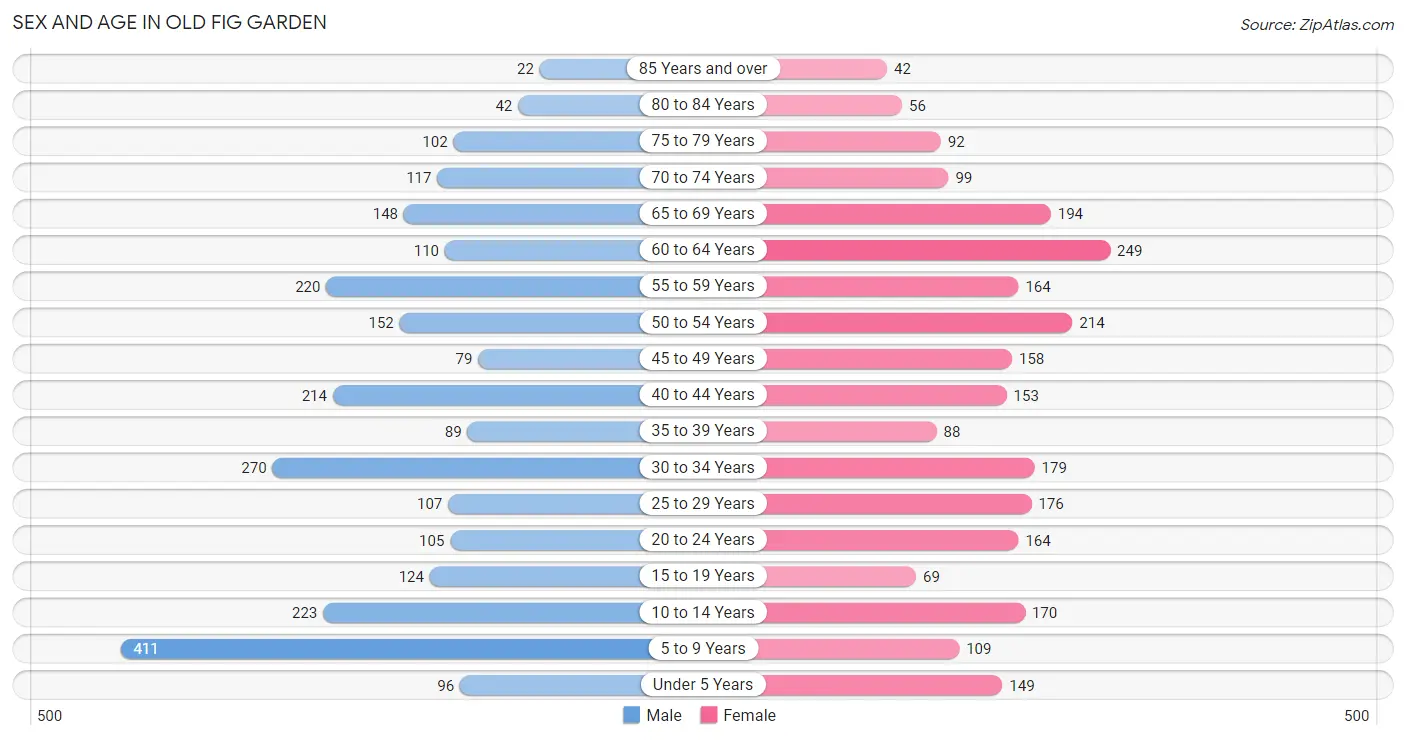
Sex and Age in Old Fig Garden
Sex and Age in Old Fig Garden
The most populous age groups in Old Fig Garden are 5 to 9 Years (411 | 15.6%) for men and 60 to 64 Years (249 | 9.9%) for women.
| Age Bracket | Male | Female |
| Under 5 Years | 96 (3.6%) | 149 (5.9%) |
| 5 to 9 Years | 411 (15.6%) | 109 (4.3%) |
| 10 to 14 Years | 223 (8.5%) | 170 (6.7%) |
| 15 to 19 Years | 124 (4.7%) | 69 (2.7%) |
| 20 to 24 Years | 105 (4.0%) | 164 (6.5%) |
| 25 to 29 Years | 107 (4.1%) | 176 (7.0%) |
| 30 to 34 Years | 270 (10.3%) | 179 (7.1%) |
| 35 to 39 Years | 89 (3.4%) | 88 (3.5%) |
| 40 to 44 Years | 214 (8.1%) | 153 (6.1%) |
| 45 to 49 Years | 79 (3.0%) | 158 (6.3%) |
| 50 to 54 Years | 152 (5.8%) | 214 (8.5%) |
| 55 to 59 Years | 220 (8.4%) | 164 (6.5%) |
| 60 to 64 Years | 110 (4.2%) | 249 (9.9%) |
| 65 to 69 Years | 148 (5.6%) | 194 (7.7%) |
| 70 to 74 Years | 117 (4.4%) | 99 (3.9%) |
| 75 to 79 Years | 102 (3.9%) | 92 (3.6%) |
| 80 to 84 Years | 42 (1.6%) | 56 (2.2%) |
| 85 Years and over | 22 (0.8%) | 42 (1.7%) |
| Total | 2,631 (100.0%) | 2,525 (100.0%) |
Families and Households in Old Fig Garden
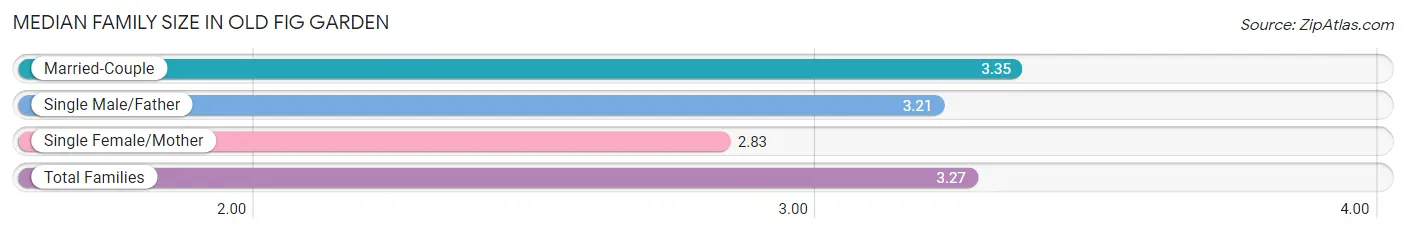
Median Family Size in Old Fig Garden
The median family size in Old Fig Garden is 3.27 persons per family, with married-couple families (985 | 78.3%) accounting for the largest median family size of 3.35 persons per family. On the other hand, single female/mother families (166 | 13.2%) represent the smallest median family size with 2.83 persons per family.
| Family Type | # Families | Family Size |
| Married-Couple | 985 (78.3%) | 3.35 |
| Single Male/Father | 107 (8.5%) | 3.21 |
| Single Female/Mother | 166 (13.2%) | 2.83 |
| Total Families | 1,258 (100.0%) | 3.27 |
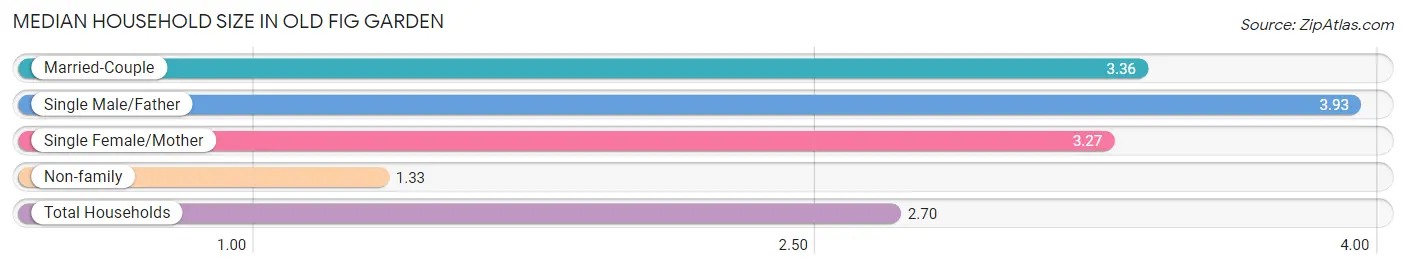
Median Household Size in Old Fig Garden
The median household size in Old Fig Garden is 2.70 persons per household, with single male/father households (107 | 5.6%) accounting for the largest median household size of 3.93 persons per household. non-family households (646 | 33.9%) represent the smallest median household size with 1.33 persons per household.
| Household Type | # Households | Household Size |
| Married-Couple | 985 (51.7%) | 3.36 |
| Single Male/Father | 107 (5.6%) | 3.93 |
| Single Female/Mother | 166 (8.7%) | 3.27 |
| Non-family | 646 (33.9%) | 1.33 |
| Total Households | 1,904 (100.0%) | 2.70 |
Household Size by Marriage Status in Old Fig Garden
Out of a total of 1,904 households in Old Fig Garden, 1,258 (66.1%) are family households, while 646 (33.9%) are nonfamily households. The most numerous type of family households are 2-person households, comprising 603, and the most common type of nonfamily households are 1-person households, comprising 502.
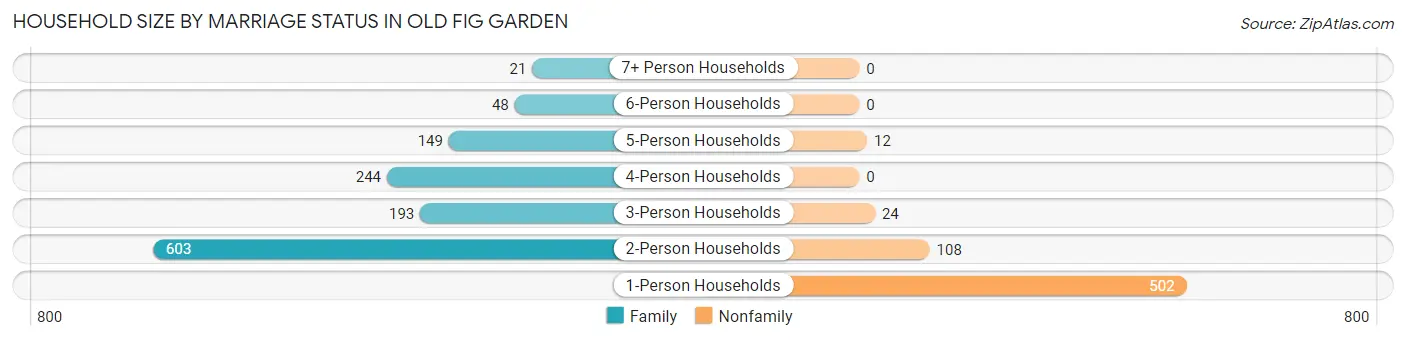
| Household Size | Family Households | Nonfamily Households |
| 1-Person Households | - | 502 (26.4%) |
| 2-Person Households | 603 (31.7%) | 108 (5.7%) |
| 3-Person Households | 193 (10.1%) | 24 (1.3%) |
| 4-Person Households | 244 (12.8%) | 0 (0.0%) |
| 5-Person Households | 149 (7.8%) | 12 (0.6%) |
| 6-Person Households | 48 (2.5%) | 0 (0.0%) |
| 7+ Person Households | 21 (1.1%) | 0 (0.0%) |
| Total | 1,258 (66.1%) | 646 (33.9%) |
Female Fertility in Old Fig Garden
Fertility by Age in Old Fig Garden
Average fertility rate in Old Fig Garden is 83.0 births per 1,000 women. Women in the age bracket of 20 to 34 years have the highest fertility rate with 112.0 births per 1,000 women. Women in the age bracket of 20 to 34 years acount for 66.7% of all women with births.
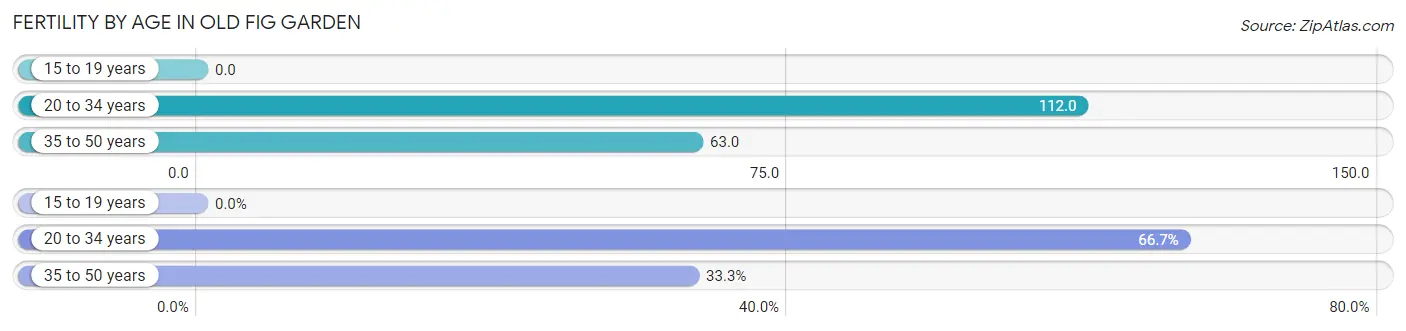
| Age Bracket | Women with Births | Births / 1,000 Women |
| 15 to 19 years | 0 (0.0%) | 0.0 |
| 20 to 34 years | 58 (66.7%) | 112.0 |
| 35 to 50 years | 29 (33.3%) | 63.0 |
| Total | 87 (100.0%) | 83.0 |
Fertility by Age by Marriage Status in Old Fig Garden
47.1% of women with births (87) in Old Fig Garden are married. The highest percentage of unmarried women with births falls into 20 to 34 years age bracket with 79.3% of them unmarried at the time of birth, while the lowest percentage of unmarried women with births belong to 35 to 50 years age bracket with 0.0% of them unmarried.
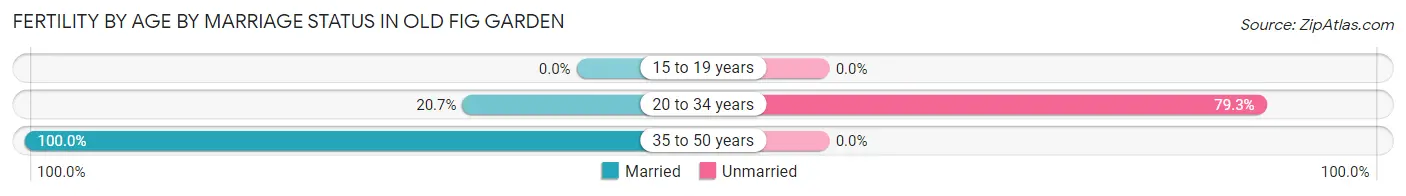
| Age Bracket | Married | Unmarried |
| 15 to 19 years | 0 (0.0%) | 0 (0.0%) |
| 20 to 34 years | 12 (20.7%) | 46 (79.3%) |
| 35 to 50 years | 29 (100.0%) | 0 (0.0%) |
| Total | 41 (47.1%) | 46 (52.9%) |
Fertility by Education in Old Fig Garden
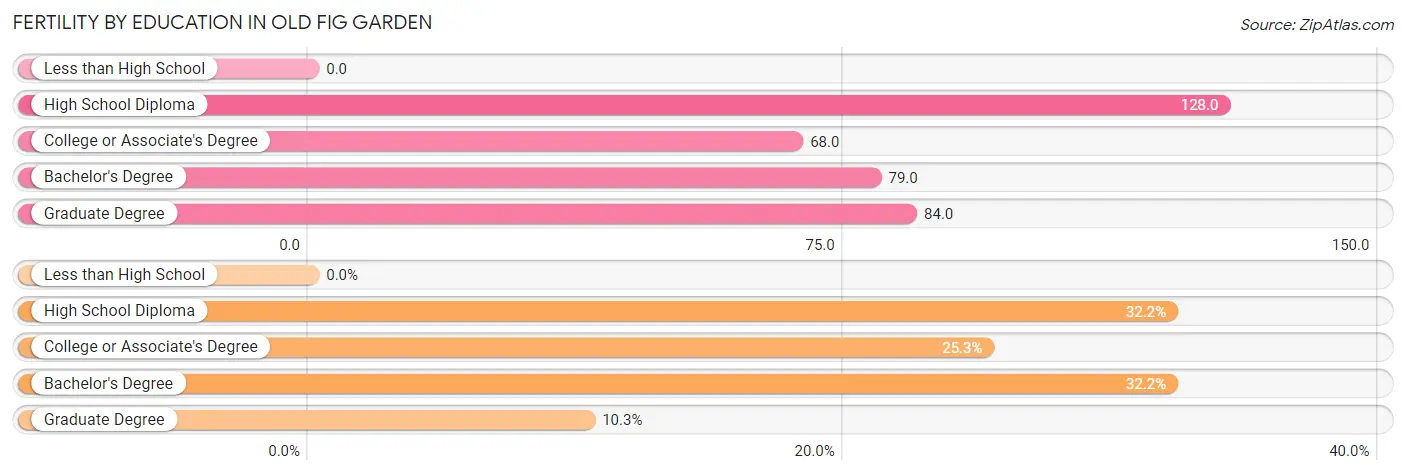
| Educational Attainment | Women with Births | Births / 1,000 Women |
| Less than High School | 0 (0.0%) | 0.0 |
| High School Diploma | 28 (32.2%) | 128.0 |
| College or Associate's Degree | 22 (25.3%) | 68.0 |
| Bachelor's Degree | 28 (32.2%) | 79.0 |
| Graduate Degree | 9 (10.3%) | 84.0 |
| Total | 87 (100.0%) | 83.0 |
Fertility by Education by Marriage Status in Old Fig Garden
52.9% of women with births in Old Fig Garden are unmarried. Women with the educational attainment of college or associate's degree are most likely to be married with 100.0% of them married at childbirth, while women with the educational attainment of high school diploma are least likely to be married with 100.0% of them unmarried at childbirth.
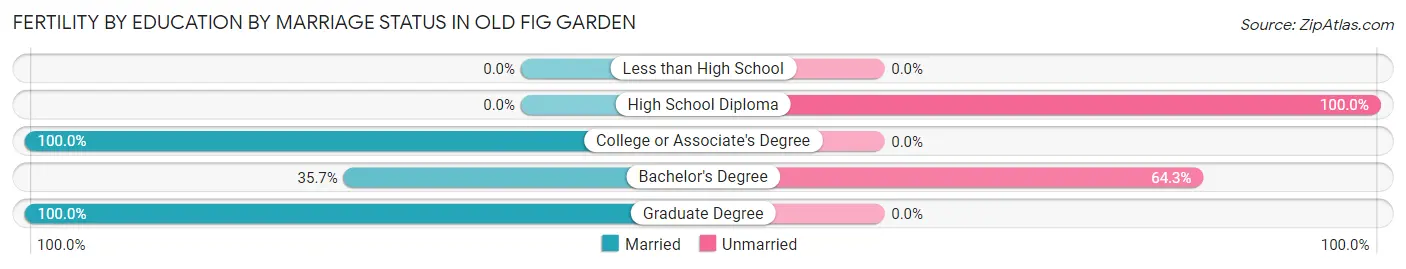
| Educational Attainment | Married | Unmarried |
| Less than High School | 0 (0.0%) | 0 (0.0%) |
| High School Diploma | 0 (0.0%) | 28 (100.0%) |
| College or Associate's Degree | 22 (100.0%) | 0 (0.0%) |
| Bachelor's Degree | 10 (35.7%) | 18 (64.3%) |
| Graduate Degree | 9 (100.0%) | 0 (0.0%) |
| Total | 41 (47.1%) | 46 (52.9%) |
Employment Characteristics in Old Fig Garden
Employment by Class of Employer in Old Fig Garden
Among the 2,382 employed individuals in Old Fig Garden, private company employees (1,304 | 54.7%), self-employed (not incorporated) (357 | 15.0%), and local government employees (221 | 9.3%) make up the most common classes of employment.
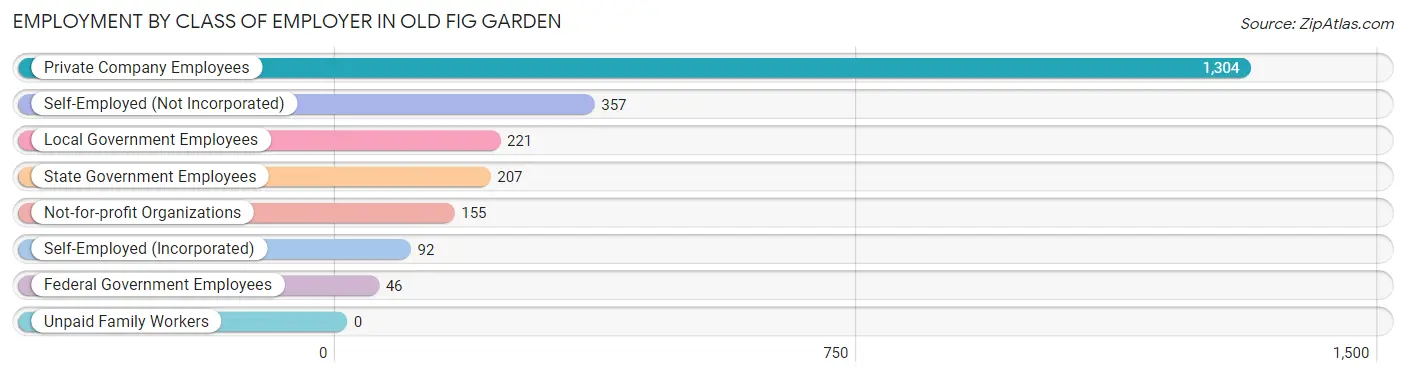
| Employer Class | # Employees | % Employees |
| Private Company Employees | 1,304 | 54.7% |
| Self-Employed (Incorporated) | 92 | 3.9% |
| Self-Employed (Not Incorporated) | 357 | 15.0% |
| Not-for-profit Organizations | 155 | 6.5% |
| Local Government Employees | 221 | 9.3% |
| State Government Employees | 207 | 8.7% |
| Federal Government Employees | 46 | 1.9% |
| Unpaid Family Workers | 0 | 0.0% |
| Total | 2,382 | 100.0% |
Employment Status by Age in Old Fig Garden
According to the labor force statistics for Old Fig Garden, out of the total population over 16 years of age (3,955), 66.3% or 2,622 individuals are in the labor force, with 7.8% or 205 of them unemployed. The age group with the highest labor force participation rate is 25 to 29 years, with 94.0% or 266 individuals in the labor force. Within the labor force, the 20 to 24 years age range has the highest percentage of unemployed individuals, with 24.9% or 59 of them being unemployed.
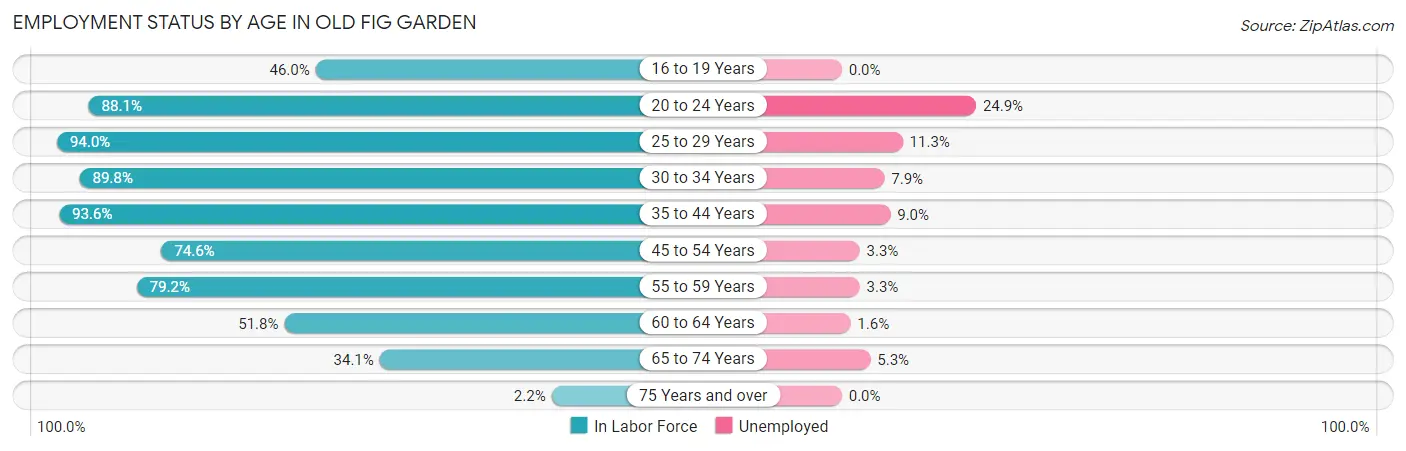
| Age Bracket | In Labor Force | Unemployed |
| 16 to 19 Years | 69 (46.0%) | 0 (0.0%) |
| 20 to 24 Years | 237 (88.1%) | 59 (24.9%) |
| 25 to 29 Years | 266 (94.0%) | 30 (11.3%) |
| 30 to 34 Years | 403 (89.8%) | 32 (7.9%) |
| 35 to 44 Years | 509 (93.6%) | 46 (9.0%) |
| 45 to 54 Years | 450 (74.6%) | 15 (3.3%) |
| 55 to 59 Years | 304 (79.2%) | 10 (3.3%) |
| 60 to 64 Years | 186 (51.8%) | 3 (1.6%) |
| 65 to 74 Years | 190 (34.1%) | 10 (5.3%) |
| 75 Years and over | 8 (2.2%) | 0 (0.0%) |
| Total | 2,622 (66.3%) | 205 (7.8%) |
Employment Status by Educational Attainment in Old Fig Garden
According to labor force statistics for Old Fig Garden, 80.8% of individuals (2,119) out of the total population between 25 and 64 years of age (2,622) are in the labor force, with 6.4% or 136 of them being unemployed. The group with the highest labor force participation rate are those with the educational attainment of less than high school, with 89.1% or 271 individuals in the labor force. Within the labor force, individuals with high school diploma education have the highest percentage of unemployment, with 17.4% or 55 of them being unemployed.
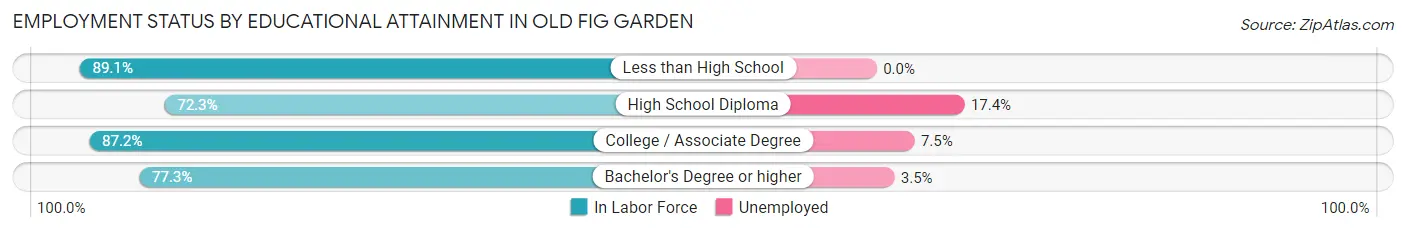
| Educational Attainment | In Labor Force | Unemployed |
| Less than High School | 271 (89.1%) | 0 (0.0%) |
| High School Diploma | 316 (72.3%) | 76 (17.4%) |
| College / Associate Degree | 676 (87.2%) | 58 (7.5%) |
| Bachelor's Degree or higher | 855 (77.3%) | 39 (3.5%) |
| Total | 2,119 (80.8%) | 168 (6.4%) |
Employment Occupations by Sex in Old Fig Garden
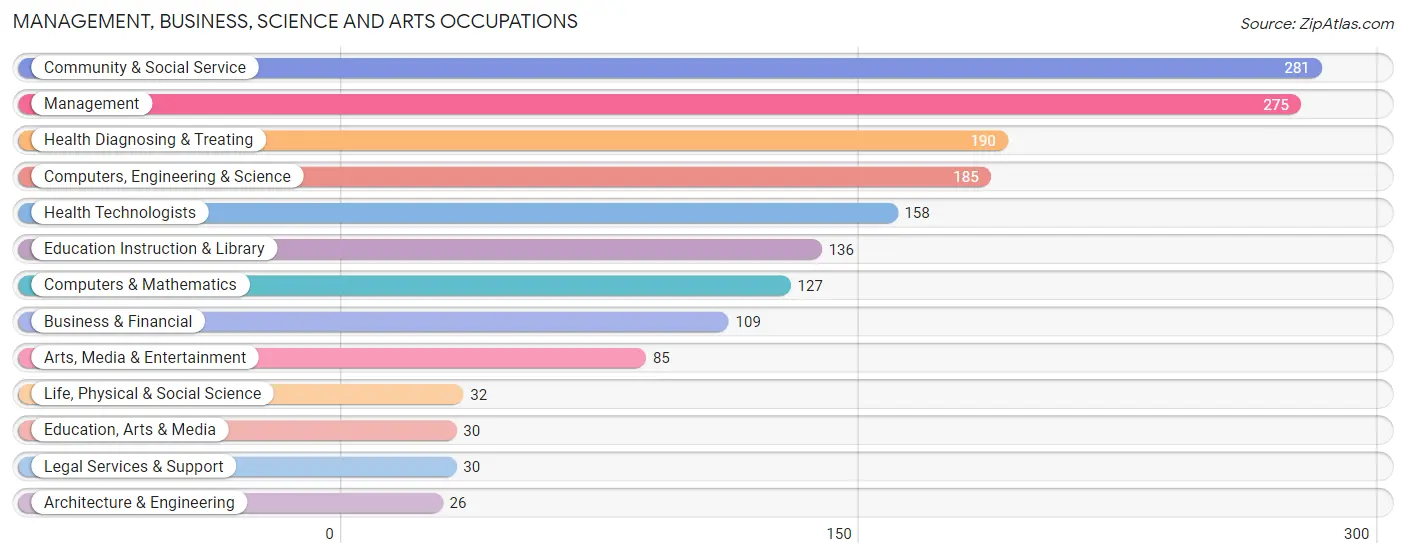
Management, Business, Science and Arts Occupations
The most common Management, Business, Science and Arts occupations in Old Fig Garden are Community & Social Service (281 | 11.6%), Management (275 | 11.4%), Health Diagnosing & Treating (190 | 7.9%), Computers, Engineering & Science (185 | 7.6%), and Health Technologists (158 | 6.5%).
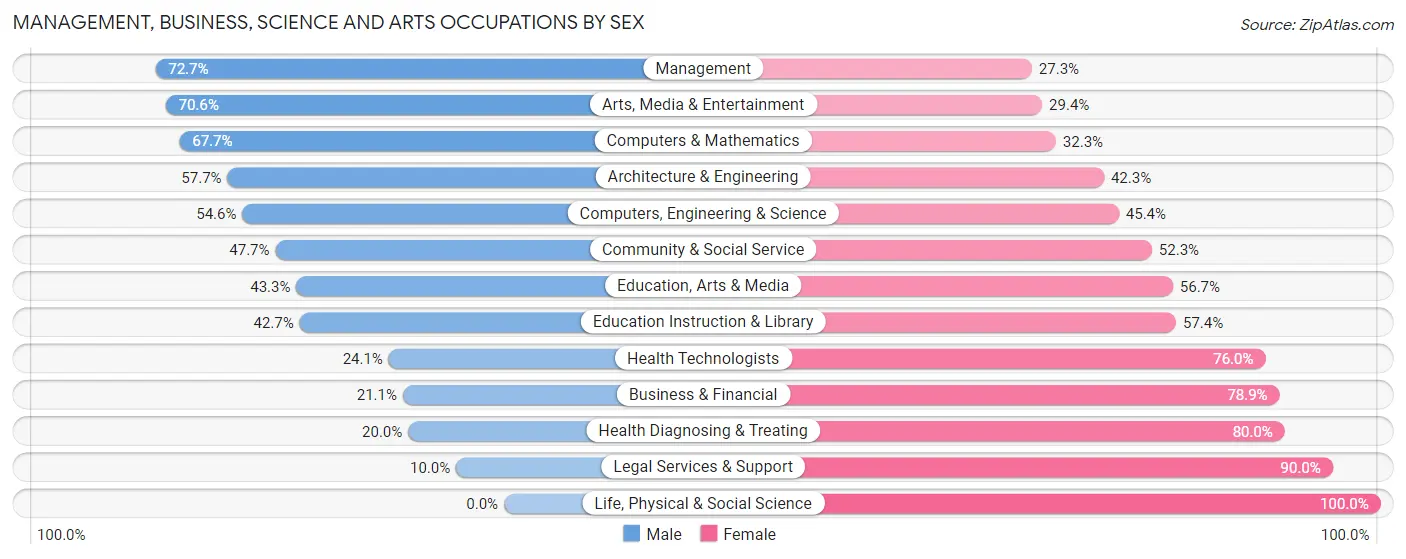
Management, Business, Science and Arts Occupations by Sex
Within the Management, Business, Science and Arts occupations in Old Fig Garden, the most male-oriented occupations are Management (72.7%), Arts, Media & Entertainment (70.6%), and Computers & Mathematics (67.7%), while the most female-oriented occupations are Life, Physical & Social Science (100.0%), Legal Services & Support (90.0%), and Health Diagnosing & Treating (80.0%).
| Occupation | Male | Female |
| Management | 200 (72.7%) | 75 (27.3%) |
| Business & Financial | 23 (21.1%) | 86 (78.9%) |
| Computers, Engineering & Science | 101 (54.6%) | 84 (45.4%) |
| Computers & Mathematics | 86 (67.7%) | 41 (32.3%) |
| Architecture & Engineering | 15 (57.7%) | 11 (42.3%) |
| Life, Physical & Social Science | 0 (0.0%) | 32 (100.0%) |
| Community & Social Service | 134 (47.7%) | 147 (52.3%) |
| Education, Arts & Media | 13 (43.3%) | 17 (56.7%) |
| Legal Services & Support | 3 (10.0%) | 27 (90.0%) |
| Education Instruction & Library | 58 (42.6%) | 78 (57.4%) |
| Arts, Media & Entertainment | 60 (70.6%) | 25 (29.4%) |
| Health Diagnosing & Treating | 38 (20.0%) | 152 (80.0%) |
| Health Technologists | 38 (24.0%) | 120 (75.9%) |
| Total (Category) | 496 (47.7%) | 544 (52.3%) |
| Total (Overall) | 1,214 (50.2%) | 1,203 (49.8%) |
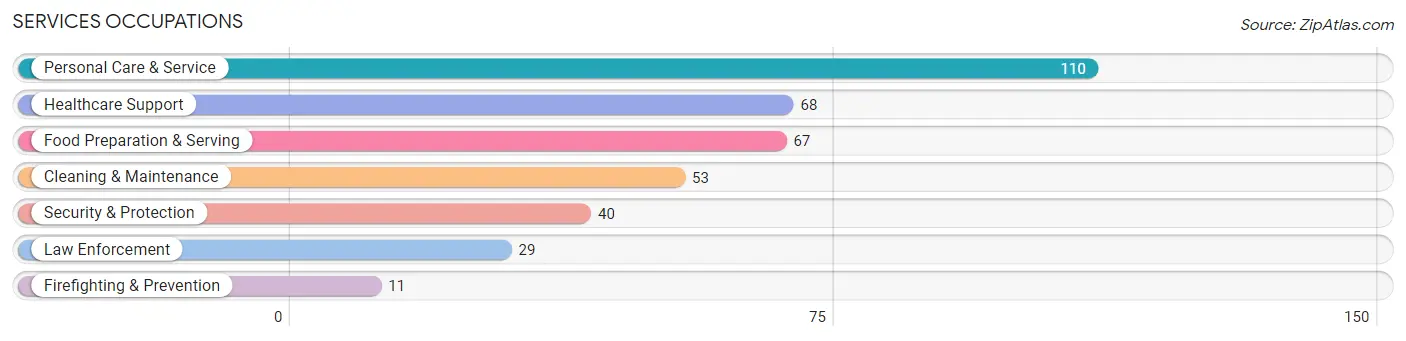
Services Occupations
The most common Services occupations in Old Fig Garden are Personal Care & Service (110 | 4.5%), Healthcare Support (68 | 2.8%), Food Preparation & Serving (67 | 2.8%), Cleaning & Maintenance (53 | 2.2%), and Security & Protection (40 | 1.7%).
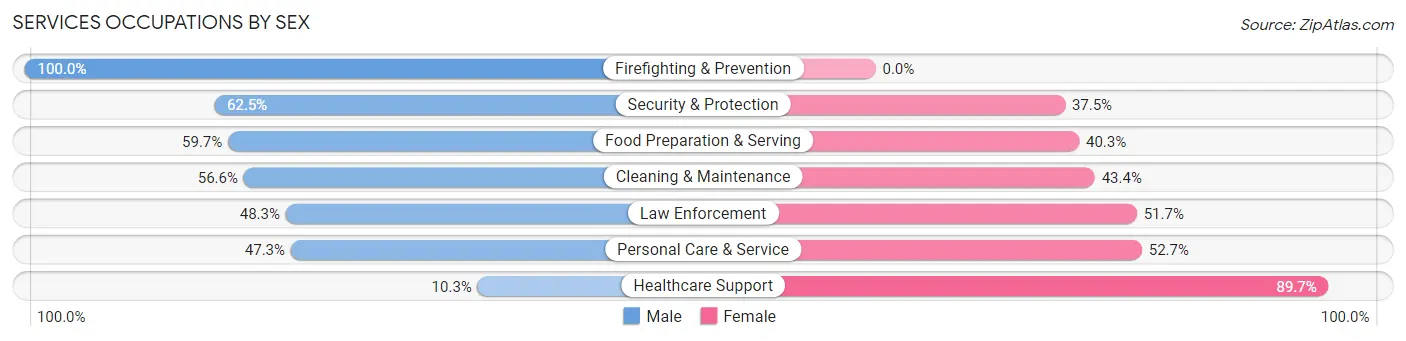
Services Occupations by Sex
Within the Services occupations in Old Fig Garden, the most male-oriented occupations are Firefighting & Prevention (100.0%), Security & Protection (62.5%), and Food Preparation & Serving (59.7%), while the most female-oriented occupations are Healthcare Support (89.7%), Personal Care & Service (52.7%), and Law Enforcement (51.7%).
| Occupation | Male | Female |
| Healthcare Support | 7 (10.3%) | 61 (89.7%) |
| Security & Protection | 25 (62.5%) | 15 (37.5%) |
| Firefighting & Prevention | 11 (100.0%) | 0 (0.0%) |
| Law Enforcement | 14 (48.3%) | 15 (51.7%) |
| Food Preparation & Serving | 40 (59.7%) | 27 (40.3%) |
| Cleaning & Maintenance | 30 (56.6%) | 23 (43.4%) |
| Personal Care & Service | 52 (47.3%) | 58 (52.7%) |
| Total (Category) | 154 (45.6%) | 184 (54.4%) |
| Total (Overall) | 1,214 (50.2%) | 1,203 (49.8%) |
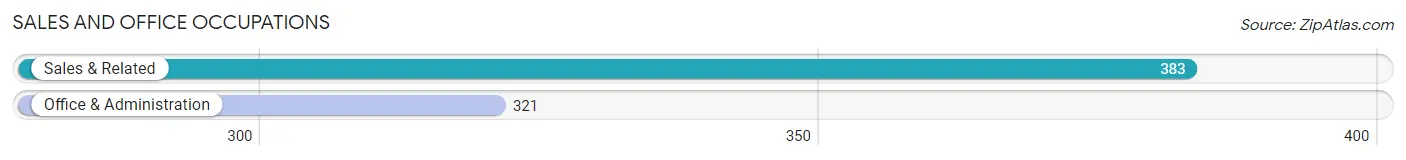
Sales and Office Occupations
The most common Sales and Office occupations in Old Fig Garden are Sales & Related (383 | 15.9%), and Office & Administration (321 | 13.3%).
Sales and Office Occupations by Sex
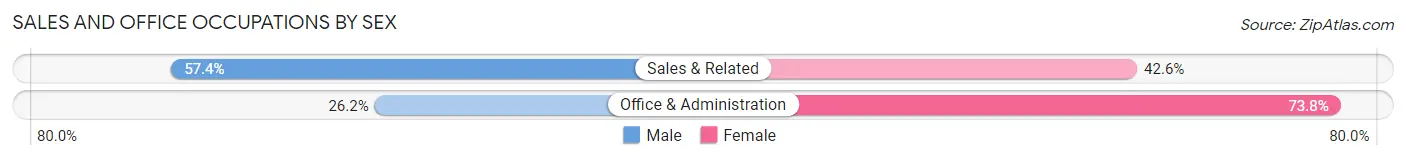
| Occupation | Male | Female |
| Sales & Related | 220 (57.4%) | 163 (42.6%) |
| Office & Administration | 84 (26.2%) | 237 (73.8%) |
| Total (Category) | 304 (43.2%) | 400 (56.8%) |
| Total (Overall) | 1,214 (50.2%) | 1,203 (49.8%) |
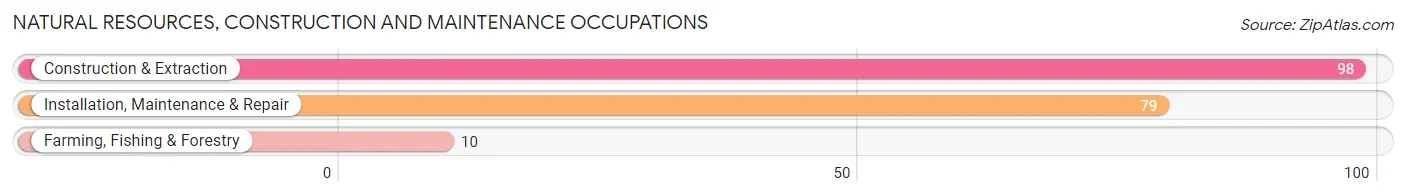
Natural Resources, Construction and Maintenance Occupations
The most common Natural Resources, Construction and Maintenance occupations in Old Fig Garden are Construction & Extraction (98 | 4.1%), Installation, Maintenance & Repair (79 | 3.3%), and Farming, Fishing & Forestry (10 | 0.4%).
Natural Resources, Construction and Maintenance Occupations by Sex
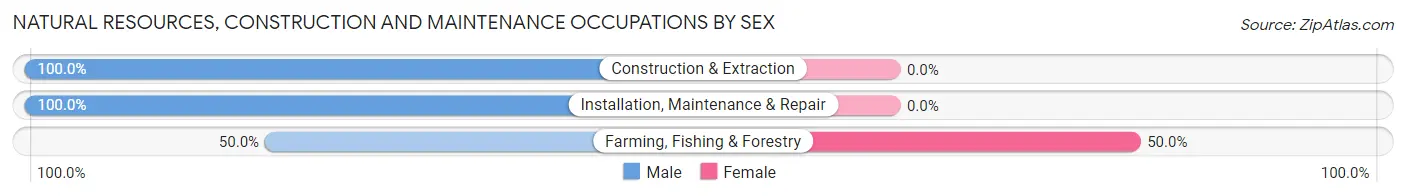
| Occupation | Male | Female |
| Farming, Fishing & Forestry | 5 (50.0%) | 5 (50.0%) |
| Construction & Extraction | 98 (100.0%) | 0 (0.0%) |
| Installation, Maintenance & Repair | 79 (100.0%) | 0 (0.0%) |
| Total (Category) | 182 (97.3%) | 5 (2.7%) |
| Total (Overall) | 1,214 (50.2%) | 1,203 (49.8%) |
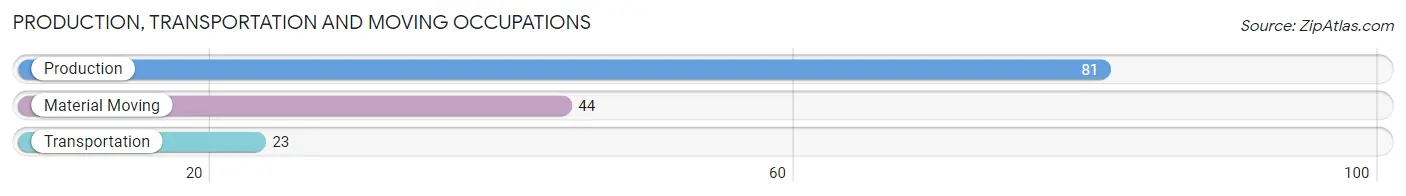
Production, Transportation and Moving Occupations
The most common Production, Transportation and Moving occupations in Old Fig Garden are Production (81 | 3.4%), Material Moving (44 | 1.8%), and Transportation (23 | 0.9%).
Production, Transportation and Moving Occupations by Sex
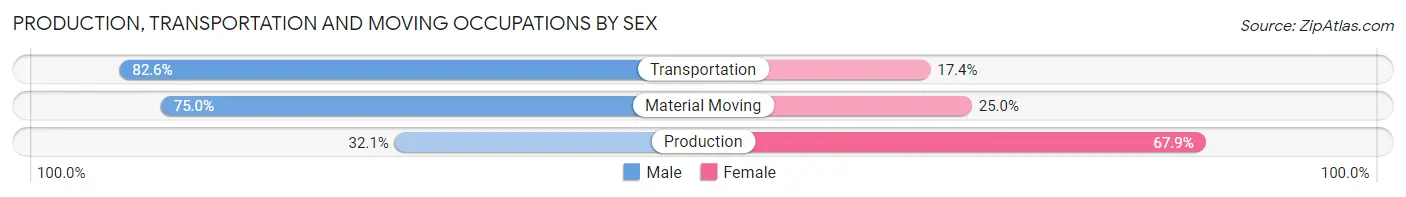
| Occupation | Male | Female |
| Production | 26 (32.1%) | 55 (67.9%) |
| Transportation | 19 (82.6%) | 4 (17.4%) |
| Material Moving | 33 (75.0%) | 11 (25.0%) |
| Total (Category) | 78 (52.7%) | 70 (47.3%) |
| Total (Overall) | 1,214 (50.2%) | 1,203 (49.8%) |
Employment Industries by Sex in Old Fig Garden
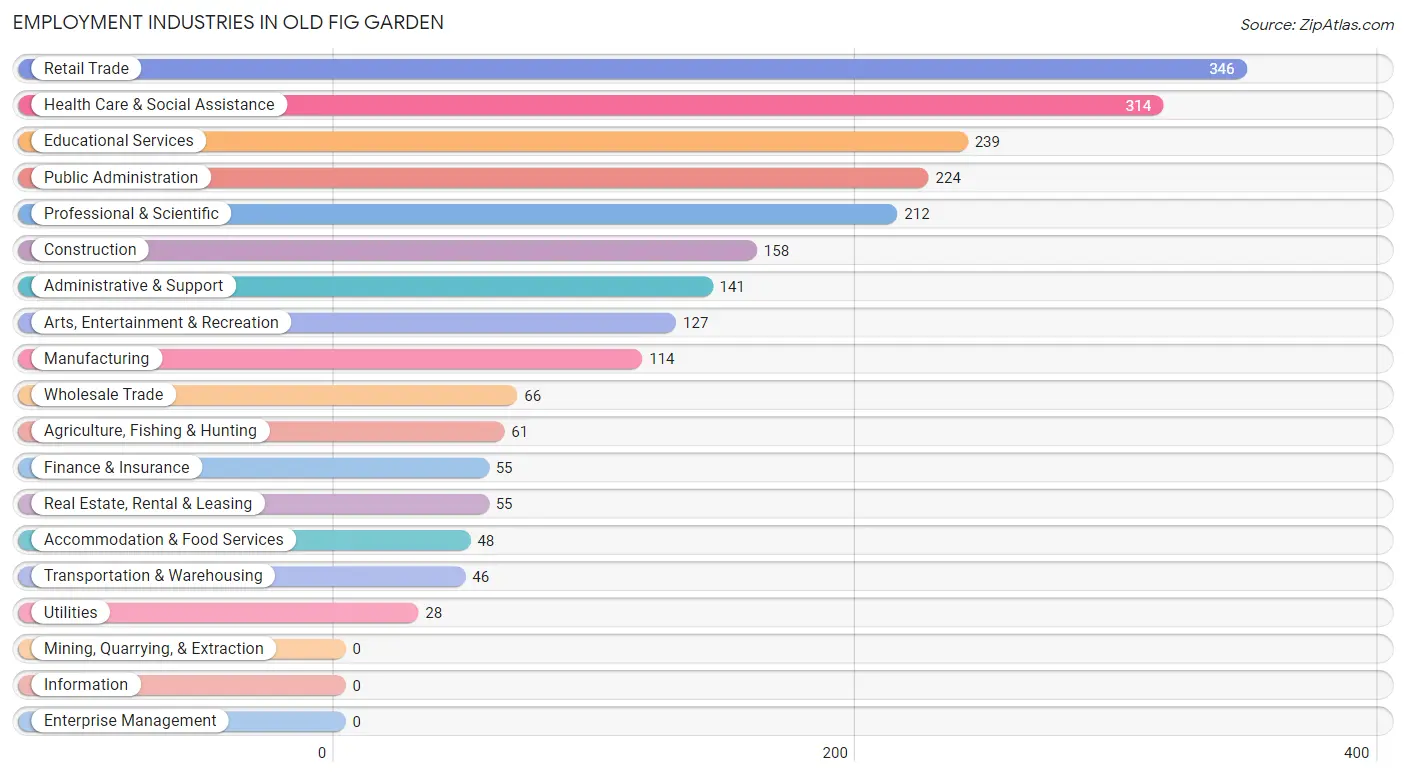
Employment Industries in Old Fig Garden
The major employment industries in Old Fig Garden include Retail Trade (346 | 14.3%), Health Care & Social Assistance (314 | 13.0%), Educational Services (239 | 9.9%), Public Administration (224 | 9.3%), and Professional & Scientific (212 | 8.8%).
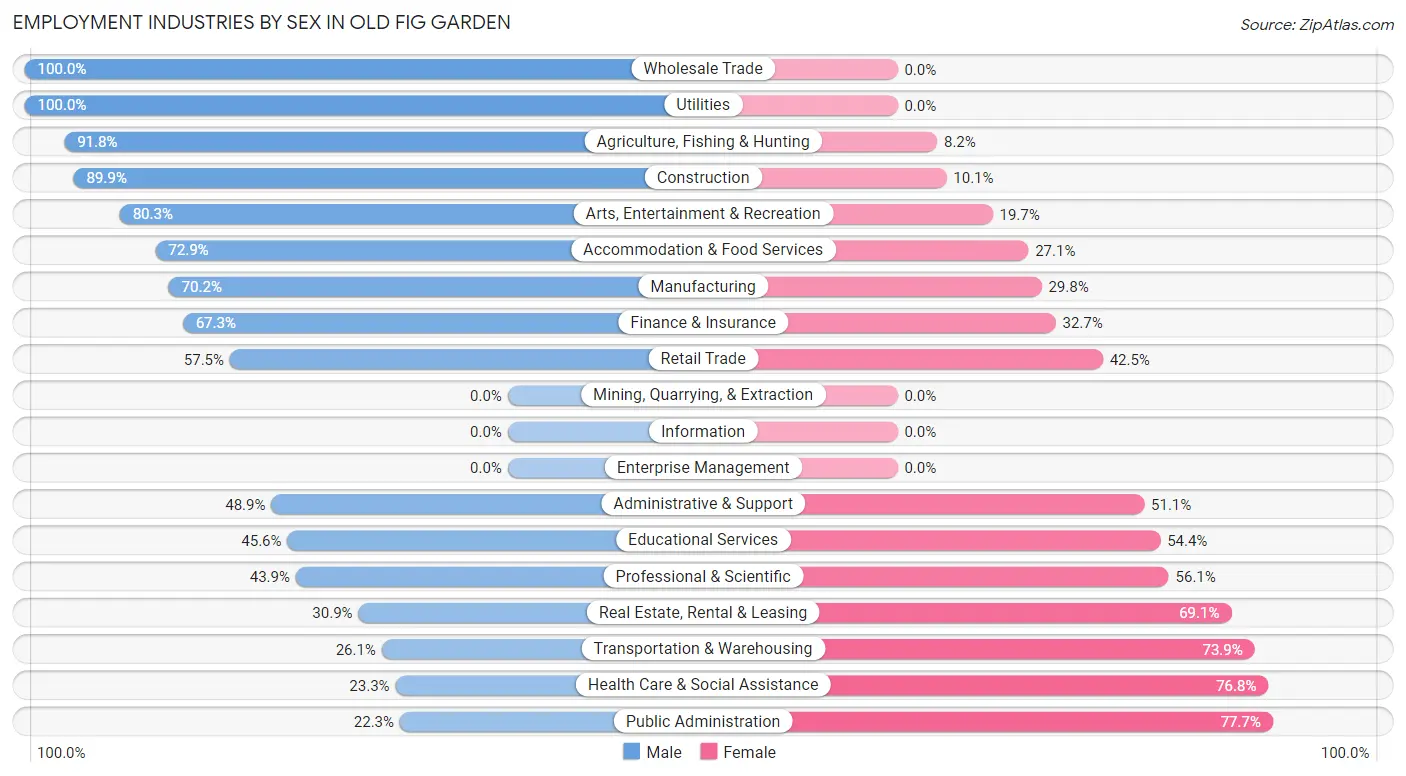
Employment Industries by Sex in Old Fig Garden
The Old Fig Garden industries that see more men than women are Wholesale Trade (100.0%), Utilities (100.0%), and Agriculture, Fishing & Hunting (91.8%), whereas the industries that tend to have a higher number of women are Public Administration (77.7%), Health Care & Social Assistance (76.7%), and Transportation & Warehousing (73.9%).
| Industry | Male | Female |
| Agriculture, Fishing & Hunting | 56 (91.8%) | 5 (8.2%) |
| Mining, Quarrying, & Extraction | 0 (0.0%) | 0 (0.0%) |
| Construction | 142 (89.9%) | 16 (10.1%) |
| Manufacturing | 80 (70.2%) | 34 (29.8%) |
| Wholesale Trade | 66 (100.0%) | 0 (0.0%) |
| Retail Trade | 199 (57.5%) | 147 (42.5%) |
| Transportation & Warehousing | 12 (26.1%) | 34 (73.9%) |
| Utilities | 28 (100.0%) | 0 (0.0%) |
| Information | 0 (0.0%) | 0 (0.0%) |
| Finance & Insurance | 37 (67.3%) | 18 (32.7%) |
| Real Estate, Rental & Leasing | 17 (30.9%) | 38 (69.1%) |
| Professional & Scientific | 93 (43.9%) | 119 (56.1%) |
| Enterprise Management | 0 (0.0%) | 0 (0.0%) |
| Administrative & Support | 69 (48.9%) | 72 (51.1%) |
| Educational Services | 109 (45.6%) | 130 (54.4%) |
| Health Care & Social Assistance | 73 (23.3%) | 241 (76.7%) |
| Arts, Entertainment & Recreation | 102 (80.3%) | 25 (19.7%) |
| Accommodation & Food Services | 35 (72.9%) | 13 (27.1%) |
| Public Administration | 50 (22.3%) | 174 (77.7%) |
| Total | 1,214 (50.2%) | 1,203 (49.8%) |
Education in Old Fig Garden
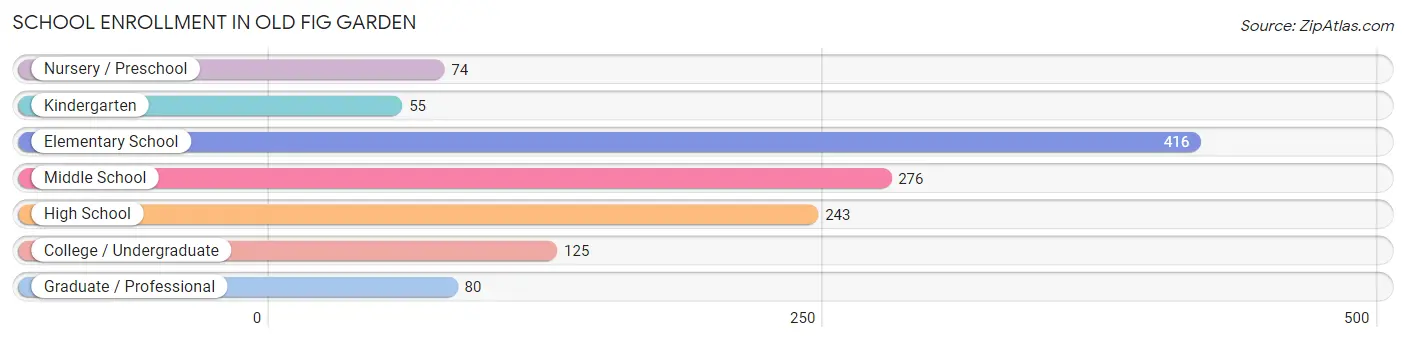
School Enrollment in Old Fig Garden
The most common levels of schooling among the 1,269 students in Old Fig Garden are elementary school (416 | 32.8%), middle school (276 | 21.7%), and high school (243 | 19.2%).
| School Level | # Students | % Students |
| Nursery / Preschool | 74 | 5.8% |
| Kindergarten | 55 | 4.3% |
| Elementary School | 416 | 32.8% |
| Middle School | 276 | 21.7% |
| High School | 243 | 19.2% |
| College / Undergraduate | 125 | 9.9% |
| Graduate / Professional | 80 | 6.3% |
| Total | 1,269 | 100.0% |
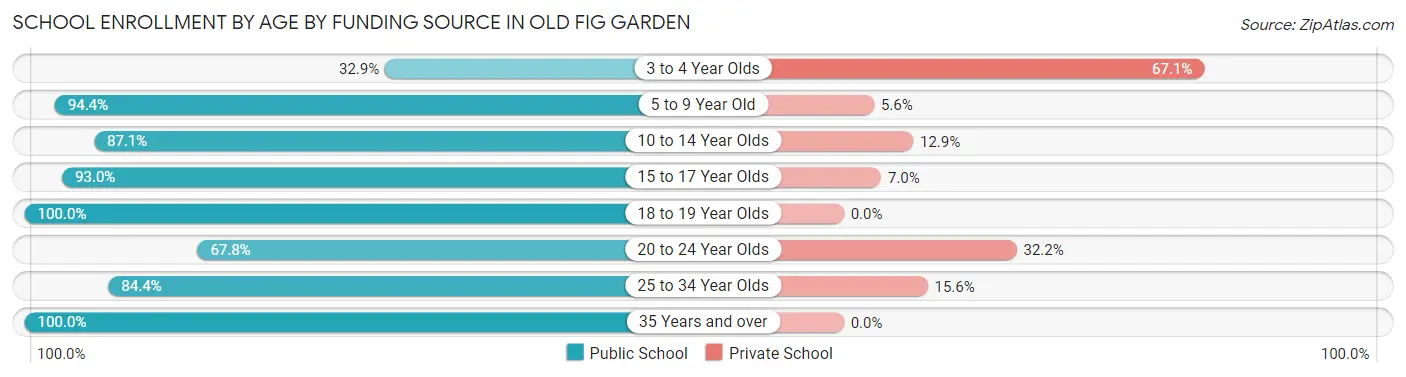
School Enrollment by Age by Funding Source in Old Fig Garden
Out of a total of 1,269 students who are enrolled in schools in Old Fig Garden, 164 (12.9%) attend a private institution, while the remaining 1,105 (87.1%) are enrolled in public schools. The age group of 3 to 4 year olds has the highest likelihood of being enrolled in private schools, with 47 (67.1% in the age bracket) enrolled. Conversely, the age group of 18 to 19 year olds has the lowest likelihood of being enrolled in a private school, with 71 (100.0% in the age bracket) attending a public institution.
| Age Bracket | Public School | Private School |
| 3 to 4 Year Olds | 23 (32.9%) | 47 (67.1%) |
| 5 to 9 Year Old | 418 (94.4%) | 25 (5.6%) |
| 10 to 14 Year Olds | 337 (87.1%) | 50 (12.9%) |
| 15 to 17 Year Olds | 107 (93.0%) | 8 (7.0%) |
| 18 to 19 Year Olds | 71 (100.0%) | 0 (0.0%) |
| 20 to 24 Year Olds | 40 (67.8%) | 19 (32.2%) |
| 25 to 34 Year Olds | 81 (84.4%) | 15 (15.6%) |
| 35 Years and over | 28 (100.0%) | 0 (0.0%) |
| Total | 1,105 (87.1%) | 164 (12.9%) |
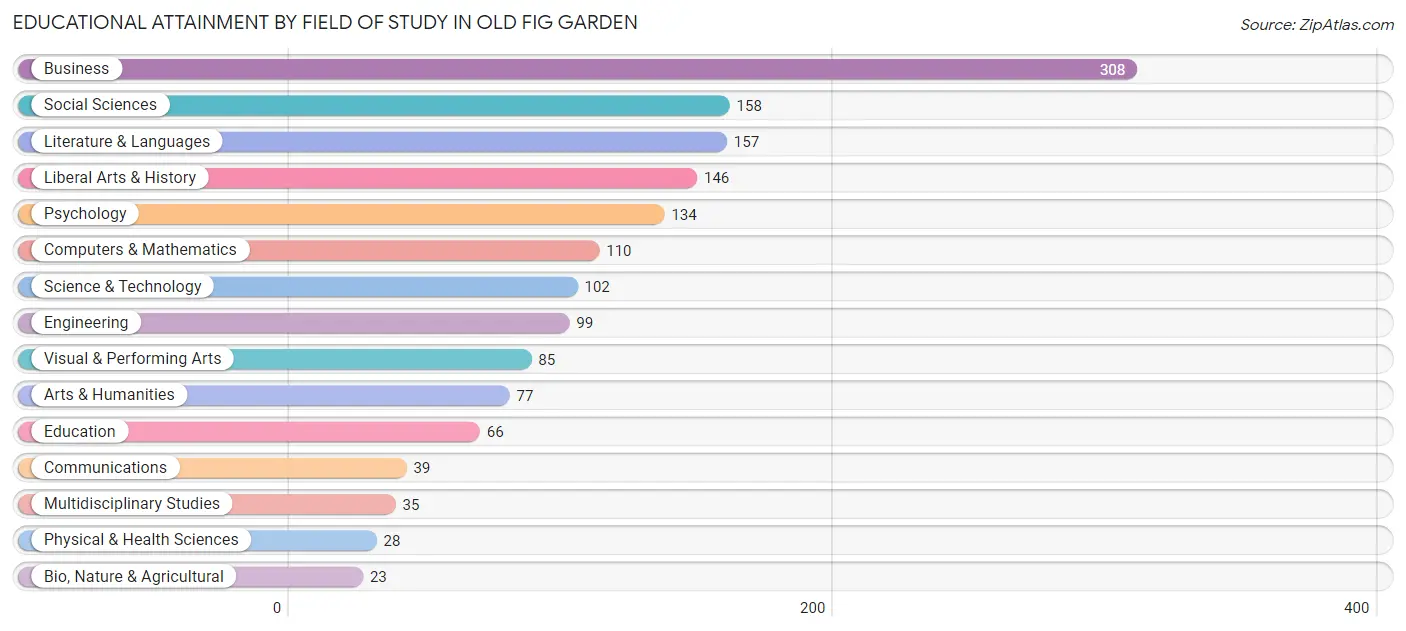
Educational Attainment by Field of Study in Old Fig Garden
Business (308 | 19.7%), social sciences (158 | 10.1%), literature & languages (157 | 10.0%), liberal arts & history (146 | 9.3%), and psychology (134 | 8.6%) are the most common fields of study among 1,567 individuals in Old Fig Garden who have obtained a bachelor's degree or higher.
| Field of Study | # Graduates | % Graduates |
| Computers & Mathematics | 110 | 7.0% |
| Bio, Nature & Agricultural | 23 | 1.5% |
| Physical & Health Sciences | 28 | 1.8% |
| Psychology | 134 | 8.6% |
| Social Sciences | 158 | 10.1% |
| Engineering | 99 | 6.3% |
| Multidisciplinary Studies | 35 | 2.2% |
| Science & Technology | 102 | 6.5% |
| Business | 308 | 19.7% |
| Education | 66 | 4.2% |
| Literature & Languages | 157 | 10.0% |
| Liberal Arts & History | 146 | 9.3% |
| Visual & Performing Arts | 85 | 5.4% |
| Communications | 39 | 2.5% |
| Arts & Humanities | 77 | 4.9% |
| Total | 1,567 | 100.0% |
Transportation & Commute in Old Fig Garden
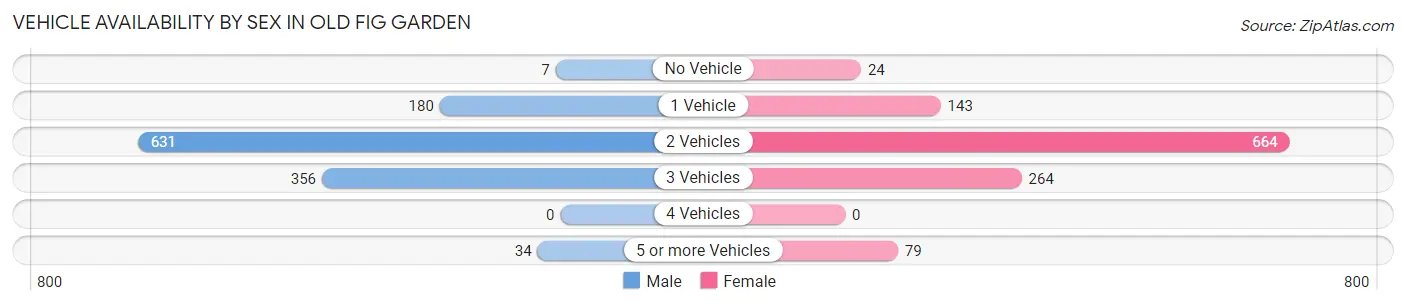
Vehicle Availability by Sex in Old Fig Garden
The most prevalent vehicle ownership categories in Old Fig Garden are males with 2 vehicles (631, accounting for 52.2%) and females with 2 vehicles (664, making up 53.7%).
| Vehicles Available | Male | Female |
| No Vehicle | 7 (0.6%) | 24 (2.0%) |
| 1 Vehicle | 180 (14.9%) | 143 (12.2%) |
| 2 Vehicles | 631 (52.2%) | 664 (56.6%) |
| 3 Vehicles | 356 (29.5%) | 264 (22.5%) |
| 4 Vehicles | 0 (0.0%) | 0 (0.0%) |
| 5 or more Vehicles | 34 (2.8%) | 79 (6.7%) |
| Total | 1,208 (100.0%) | 1,174 (100.0%) |
Commute Time in Old Fig Garden
The most frequently occuring commute durations in Old Fig Garden are 15 to 19 minutes (426 commuters, 23.0%), 20 to 24 minutes (412 commuters, 22.3%), and 10 to 14 minutes (320 commuters, 17.3%).
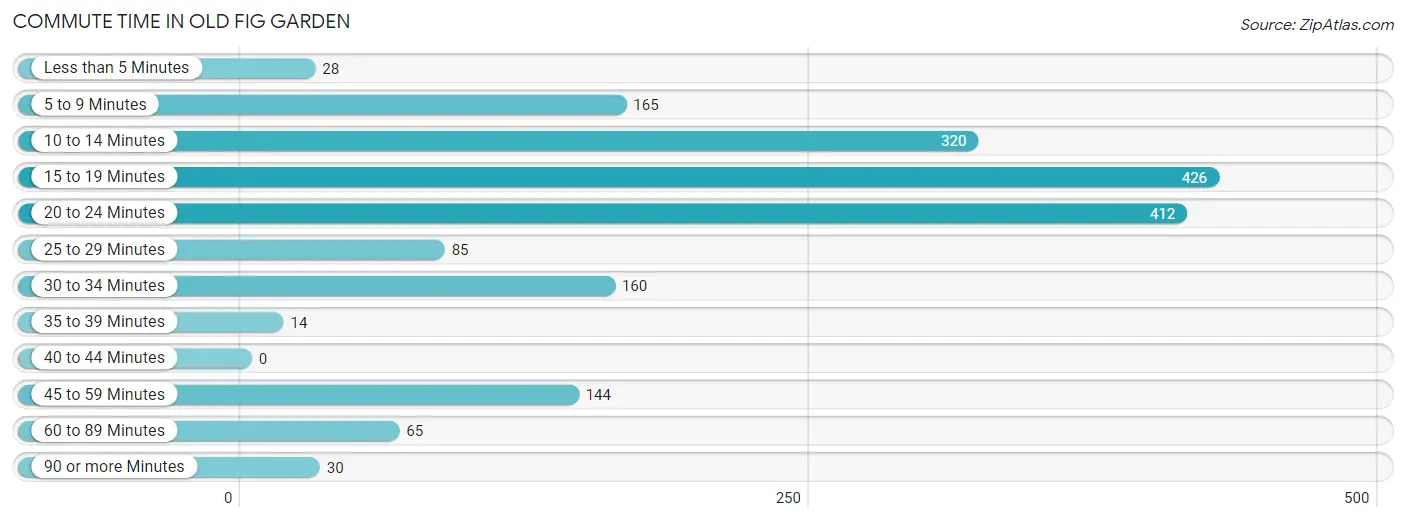
| Commute Time | # Commuters | % Commuters |
| Less than 5 Minutes | 28 | 1.5% |
| 5 to 9 Minutes | 165 | 8.9% |
| 10 to 14 Minutes | 320 | 17.3% |
| 15 to 19 Minutes | 426 | 23.0% |
| 20 to 24 Minutes | 412 | 22.3% |
| 25 to 29 Minutes | 85 | 4.6% |
| 30 to 34 Minutes | 160 | 8.6% |
| 35 to 39 Minutes | 14 | 0.8% |
| 40 to 44 Minutes | 0 | 0.0% |
| 45 to 59 Minutes | 144 | 7.8% |
| 60 to 89 Minutes | 65 | 3.5% |
| 90 or more Minutes | 30 | 1.6% |
Commute Time by Sex in Old Fig Garden
The most common commute times in Old Fig Garden are 10 to 14 minutes (185 commuters, 20.2%) for males and 15 to 19 minutes (247 commuters, 26.5%) for females.
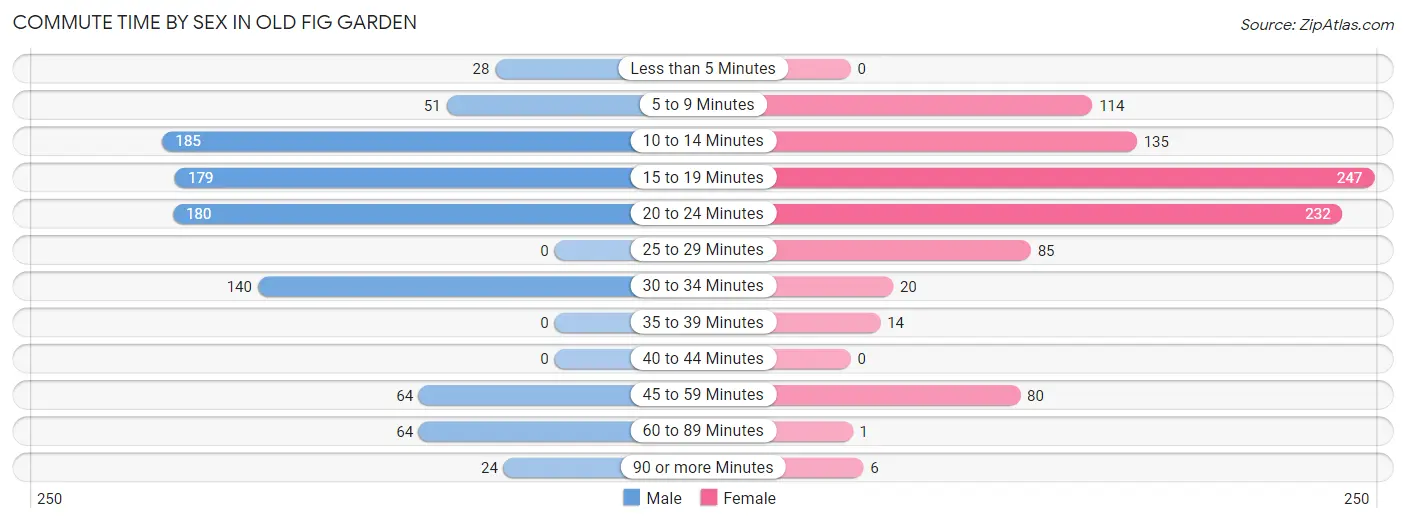
| Commute Time | Male | Female |
| Less than 5 Minutes | 28 (3.1%) | 0 (0.0%) |
| 5 to 9 Minutes | 51 (5.6%) | 114 (12.2%) |
| 10 to 14 Minutes | 185 (20.2%) | 135 (14.4%) |
| 15 to 19 Minutes | 179 (19.6%) | 247 (26.5%) |
| 20 to 24 Minutes | 180 (19.7%) | 232 (24.8%) |
| 25 to 29 Minutes | 0 (0.0%) | 85 (9.1%) |
| 30 to 34 Minutes | 140 (15.3%) | 20 (2.1%) |
| 35 to 39 Minutes | 0 (0.0%) | 14 (1.5%) |
| 40 to 44 Minutes | 0 (0.0%) | 0 (0.0%) |
| 45 to 59 Minutes | 64 (7.0%) | 80 (8.6%) |
| 60 to 89 Minutes | 64 (7.0%) | 1 (0.1%) |
| 90 or more Minutes | 24 (2.6%) | 6 (0.6%) |
Time of Departure to Work by Sex in Old Fig Garden
The most frequent times of departure to work in Old Fig Garden are 12:00 AM to 4:59 AM (137, 15.0%) for males and 7:00 AM to 7:29 AM (192, 20.6%) for females.
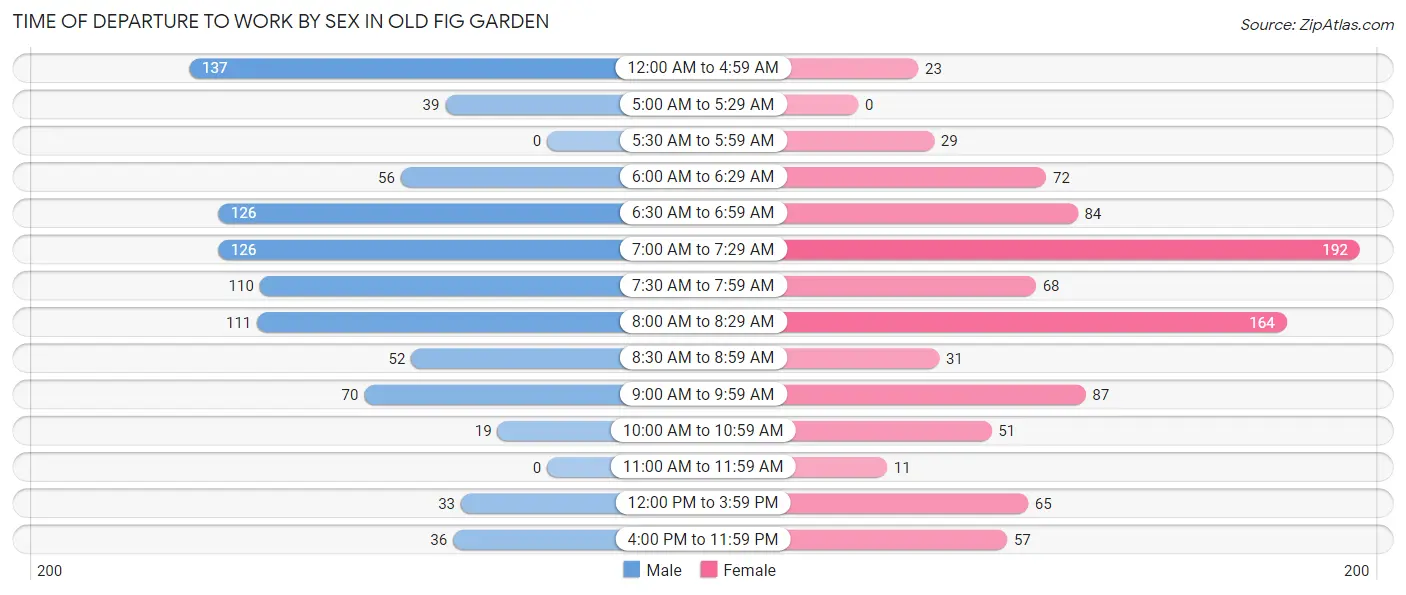
| Time of Departure | Male | Female |
| 12:00 AM to 4:59 AM | 137 (15.0%) | 23 (2.5%) |
| 5:00 AM to 5:29 AM | 39 (4.3%) | 0 (0.0%) |
| 5:30 AM to 5:59 AM | 0 (0.0%) | 29 (3.1%) |
| 6:00 AM to 6:29 AM | 56 (6.1%) | 72 (7.7%) |
| 6:30 AM to 6:59 AM | 126 (13.8%) | 84 (9.0%) |
| 7:00 AM to 7:29 AM | 126 (13.8%) | 192 (20.6%) |
| 7:30 AM to 7:59 AM | 110 (12.0%) | 68 (7.3%) |
| 8:00 AM to 8:29 AM | 111 (12.1%) | 164 (17.6%) |
| 8:30 AM to 8:59 AM | 52 (5.7%) | 31 (3.3%) |
| 9:00 AM to 9:59 AM | 70 (7.6%) | 87 (9.3%) |
| 10:00 AM to 10:59 AM | 19 (2.1%) | 51 (5.5%) |
| 11:00 AM to 11:59 AM | 0 (0.0%) | 11 (1.2%) |
| 12:00 PM to 3:59 PM | 33 (3.6%) | 65 (7.0%) |
| 4:00 PM to 11:59 PM | 36 (3.9%) | 57 (6.1%) |
| Total | 915 (100.0%) | 934 (100.0%) |
Housing Occupancy in Old Fig Garden
Occupancy by Ownership in Old Fig Garden
Of the total 1,904 dwellings in Old Fig Garden, owner-occupied units account for 1,408 (74.0%), while renter-occupied units make up 496 (26.1%).
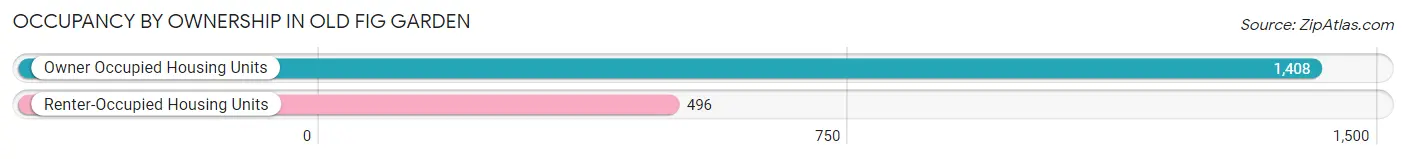
| Occupancy | # Housing Units | % Housing Units |
| Owner Occupied Housing Units | 1,408 | 74.0% |
| Renter-Occupied Housing Units | 496 | 26.1% |
| Total Occupied Housing Units | 1,904 | 100.0% |
Occupancy by Household Size in Old Fig Garden
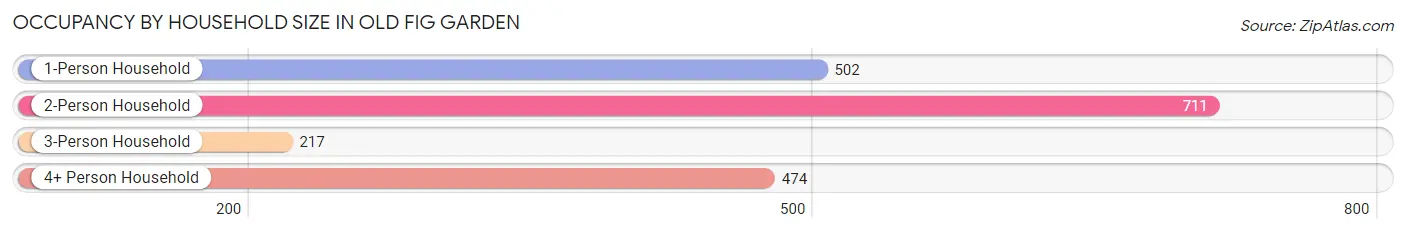
| Household Size | # Housing Units | % Housing Units |
| 1-Person Household | 502 | 26.4% |
| 2-Person Household | 711 | 37.3% |
| 3-Person Household | 217 | 11.4% |
| 4+ Person Household | 474 | 24.9% |
| Total Housing Units | 1,904 | 100.0% |
Occupancy by Ownership by Household Size in Old Fig Garden
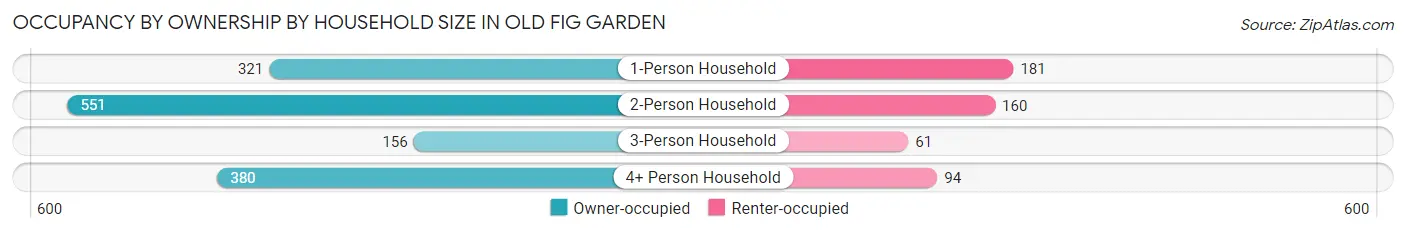
| Household Size | Owner-occupied | Renter-occupied |
| 1-Person Household | 321 (63.9%) | 181 (36.1%) |
| 2-Person Household | 551 (77.5%) | 160 (22.5%) |
| 3-Person Household | 156 (71.9%) | 61 (28.1%) |
| 4+ Person Household | 380 (80.2%) | 94 (19.8%) |
| Total Housing Units | 1,408 (74.0%) | 496 (26.1%) |
Occupancy by Educational Attainment in Old Fig Garden
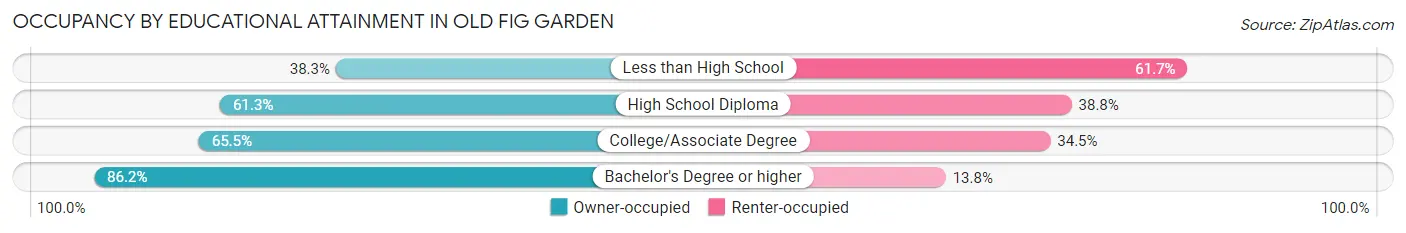
| Household Size | Owner-occupied | Renter-occupied |
| Less than High School | 36 (38.3%) | 58 (61.7%) |
| High School Diploma | 166 (61.3%) | 105 (38.8%) |
| College/Associate Degree | 381 (65.5%) | 201 (34.5%) |
| Bachelor's Degree or higher | 825 (86.2%) | 132 (13.8%) |
Occupancy by Age of Householder in Old Fig Garden
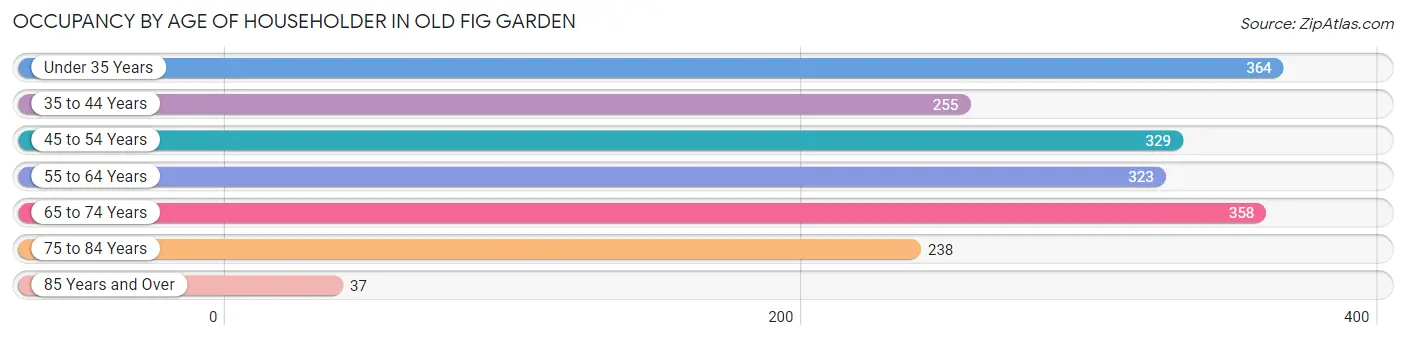
| Age Bracket | # Households | % Households |
| Under 35 Years | 364 | 19.1% |
| 35 to 44 Years | 255 | 13.4% |
| 45 to 54 Years | 329 | 17.3% |
| 55 to 64 Years | 323 | 17.0% |
| 65 to 74 Years | 358 | 18.8% |
| 75 to 84 Years | 238 | 12.5% |
| 85 Years and Over | 37 | 1.9% |
| Total | 1,904 | 100.0% |
Housing Finances in Old Fig Garden
Median Income by Occupancy in Old Fig Garden
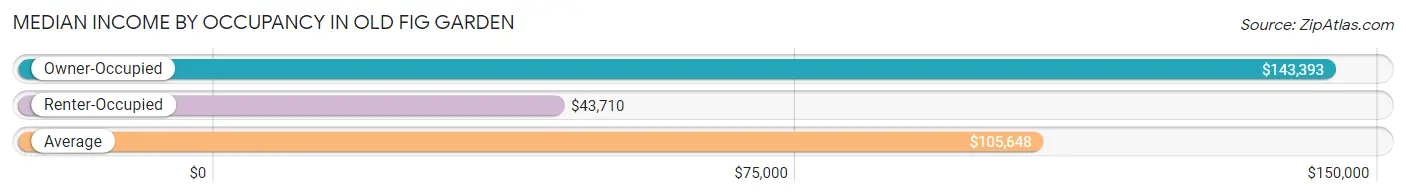
| Occupancy Type | # Households | Median Income |
| Owner-Occupied | 1,408 (74.0%) | $143,393 |
| Renter-Occupied | 496 (26.1%) | $43,710 |
| Average | 1,904 (100.0%) | $105,648 |
Occupancy by Householder Income Bracket in Old Fig Garden
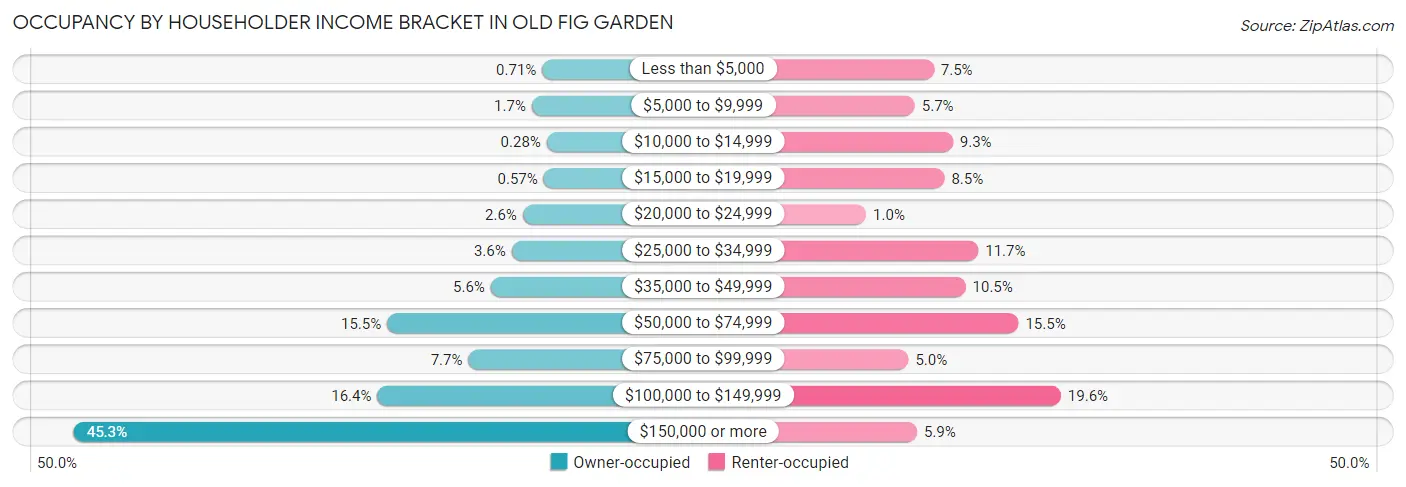
| Income Bracket | Owner-occupied | Renter-occupied |
| Less than $5,000 | 10 (0.7%) | 37 (7.5%) |
| $5,000 to $9,999 | 24 (1.7%) | 28 (5.7%) |
| $10,000 to $14,999 | 4 (0.3%) | 46 (9.3%) |
| $15,000 to $19,999 | 8 (0.6%) | 42 (8.5%) |
| $20,000 to $24,999 | 36 (2.6%) | 5 (1.0%) |
| $25,000 to $34,999 | 51 (3.6%) | 58 (11.7%) |
| $35,000 to $49,999 | 79 (5.6%) | 52 (10.5%) |
| $50,000 to $74,999 | 218 (15.5%) | 77 (15.5%) |
| $75,000 to $99,999 | 109 (7.7%) | 25 (5.0%) |
| $100,000 to $149,999 | 231 (16.4%) | 97 (19.6%) |
| $150,000 or more | 638 (45.3%) | 29 (5.9%) |
| Total | 1,408 (100.0%) | 496 (100.0%) |
Monthly Housing Cost Tiers in Old Fig Garden
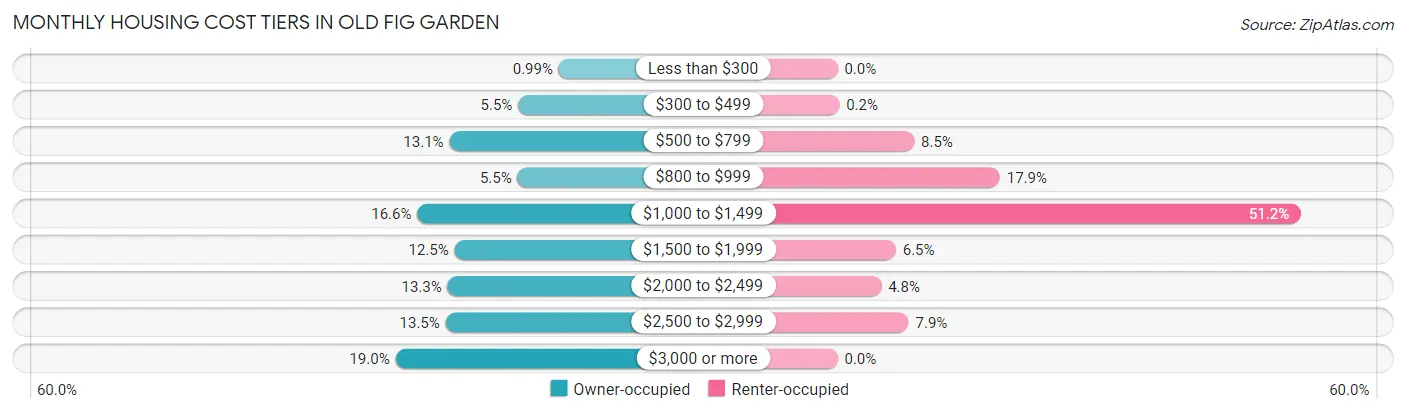
| Monthly Cost | Owner-occupied | Renter-occupied |
| Less than $300 | 14 (1.0%) | 0 (0.0%) |
| $300 to $499 | 77 (5.5%) | 1 (0.2%) |
| $500 to $799 | 184 (13.1%) | 42 (8.5%) |
| $800 to $999 | 78 (5.5%) | 89 (17.9%) |
| $1,000 to $1,499 | 234 (16.6%) | 254 (51.2%) |
| $1,500 to $1,999 | 176 (12.5%) | 32 (6.5%) |
| $2,000 to $2,499 | 187 (13.3%) | 24 (4.8%) |
| $2,500 to $2,999 | 190 (13.5%) | 39 (7.9%) |
| $3,000 or more | 268 (19.0%) | 0 (0.0%) |
| Total | 1,408 (100.0%) | 496 (100.0%) |
Physical Housing Characteristics in Old Fig Garden
Housing Structures in Old Fig Garden
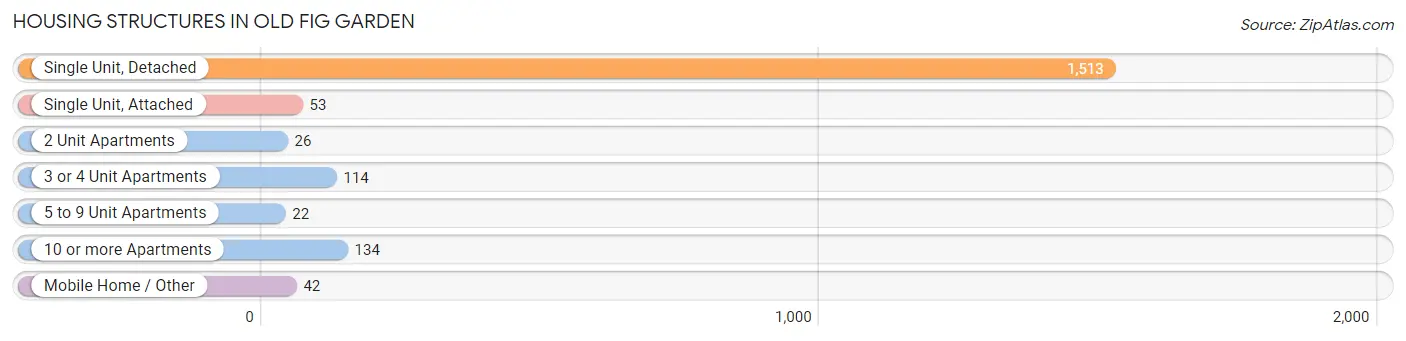
| Structure Type | # Housing Units | % Housing Units |
| Single Unit, Detached | 1,513 | 79.5% |
| Single Unit, Attached | 53 | 2.8% |
| 2 Unit Apartments | 26 | 1.4% |
| 3 or 4 Unit Apartments | 114 | 6.0% |
| 5 to 9 Unit Apartments | 22 | 1.2% |
| 10 or more Apartments | 134 | 7.0% |
| Mobile Home / Other | 42 | 2.2% |
| Total | 1,904 | 100.0% |
Housing Structures by Occupancy in Old Fig Garden
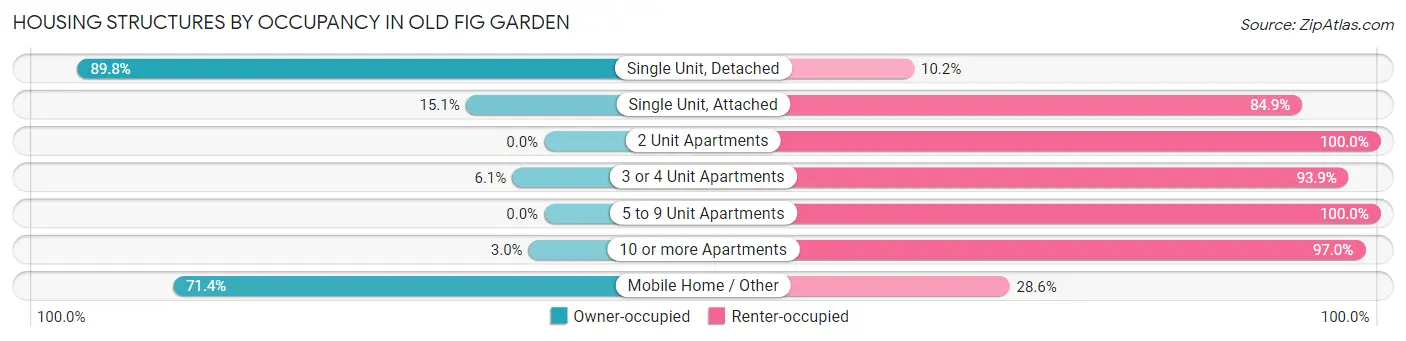
| Structure Type | Owner-occupied | Renter-occupied |
| Single Unit, Detached | 1,359 (89.8%) | 154 (10.2%) |
| Single Unit, Attached | 8 (15.1%) | 45 (84.9%) |
| 2 Unit Apartments | 0 (0.0%) | 26 (100.0%) |
| 3 or 4 Unit Apartments | 7 (6.1%) | 107 (93.9%) |
| 5 to 9 Unit Apartments | 0 (0.0%) | 22 (100.0%) |
| 10 or more Apartments | 4 (3.0%) | 130 (97.0%) |
| Mobile Home / Other | 30 (71.4%) | 12 (28.6%) |
| Total | 1,408 (74.0%) | 496 (26.1%) |
Housing Structures by Number of Rooms in Old Fig Garden
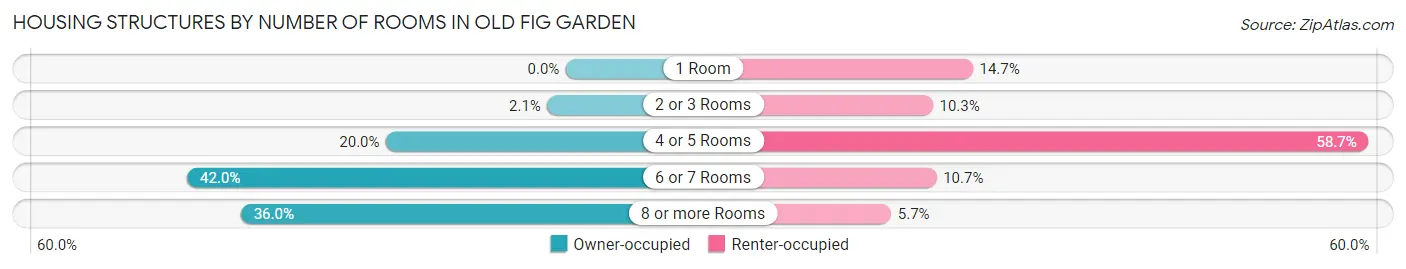
| Number of Rooms | Owner-occupied | Renter-occupied |
| 1 Room | 0 (0.0%) | 73 (14.7%) |
| 2 or 3 Rooms | 29 (2.1%) | 51 (10.3%) |
| 4 or 5 Rooms | 281 (20.0%) | 291 (58.7%) |
| 6 or 7 Rooms | 591 (42.0%) | 53 (10.7%) |
| 8 or more Rooms | 507 (36.0%) | 28 (5.7%) |
| Total | 1,408 (100.0%) | 496 (100.0%) |
Housing Structure by Heating Type in Old Fig Garden
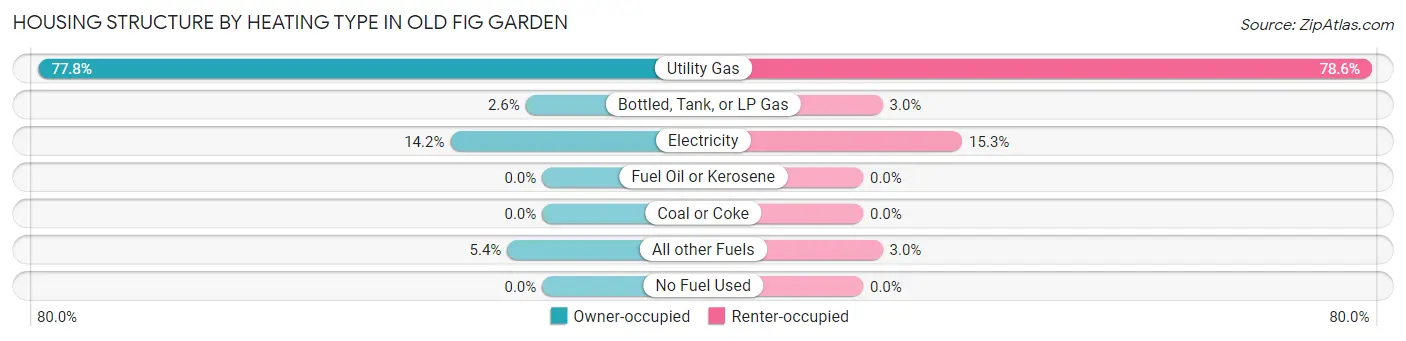
| Heating Type | Owner-occupied | Renter-occupied |
| Utility Gas | 1,096 (77.8%) | 390 (78.6%) |
| Bottled, Tank, or LP Gas | 36 (2.6%) | 15 (3.0%) |
| Electricity | 200 (14.2%) | 76 (15.3%) |
| Fuel Oil or Kerosene | 0 (0.0%) | 0 (0.0%) |
| Coal or Coke | 0 (0.0%) | 0 (0.0%) |
| All other Fuels | 76 (5.4%) | 15 (3.0%) |
| No Fuel Used | 0 (0.0%) | 0 (0.0%) |
| Total | 1,408 (100.0%) | 496 (100.0%) |
Household Vehicle Usage in Old Fig Garden
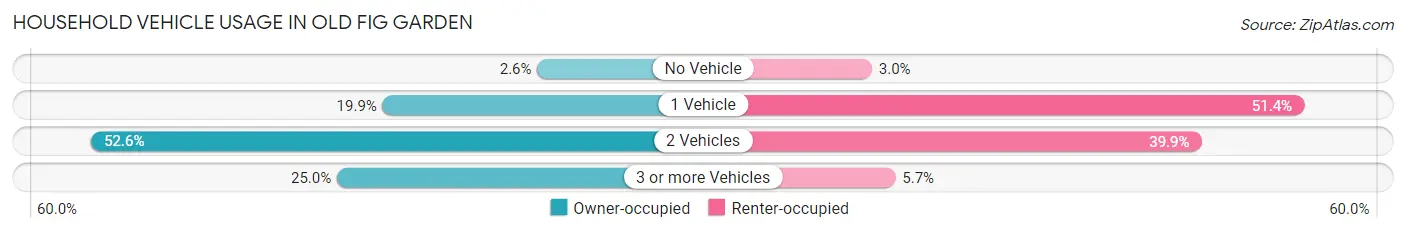
| Vehicles per Household | Owner-occupied | Renter-occupied |
| No Vehicle | 36 (2.6%) | 15 (3.0%) |
| 1 Vehicle | 280 (19.9%) | 255 (51.4%) |
| 2 Vehicles | 740 (52.6%) | 198 (39.9%) |
| 3 or more Vehicles | 352 (25.0%) | 28 (5.7%) |
| Total | 1,408 (100.0%) | 496 (100.0%) |
Real Estate & Mortgages in Old Fig Garden
Real Estate and Mortgage Overview in Old Fig Garden
| Characteristic | Without Mortgage | With Mortgage |
| Housing Units | 434 | 974 |
| Median Property Value | $380,000 | $470,100 |
| Median Household Income | $100,833 | $481 |
| Monthly Housing Costs | $682 | $268 |
| Real Estate Taxes | $2,825 | $0 |
Property Value by Mortgage Status in Old Fig Garden
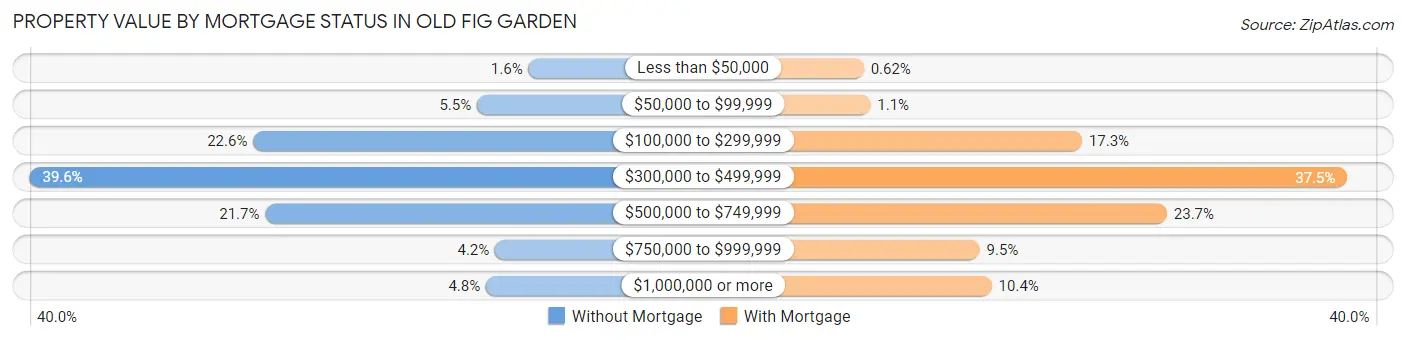
| Property Value | Without Mortgage | With Mortgage |
| Less than $50,000 | 7 (1.6%) | 6 (0.6%) |
| $50,000 to $99,999 | 24 (5.5%) | 11 (1.1%) |
| $100,000 to $299,999 | 98 (22.6%) | 168 (17.2%) |
| $300,000 to $499,999 | 172 (39.6%) | 365 (37.5%) |
| $500,000 to $749,999 | 94 (21.7%) | 231 (23.7%) |
| $750,000 to $999,999 | 18 (4.2%) | 92 (9.5%) |
| $1,000,000 or more | 21 (4.8%) | 101 (10.4%) |
| Total | 434 (100.0%) | 974 (100.0%) |
Household Income by Mortgage Status in Old Fig Garden
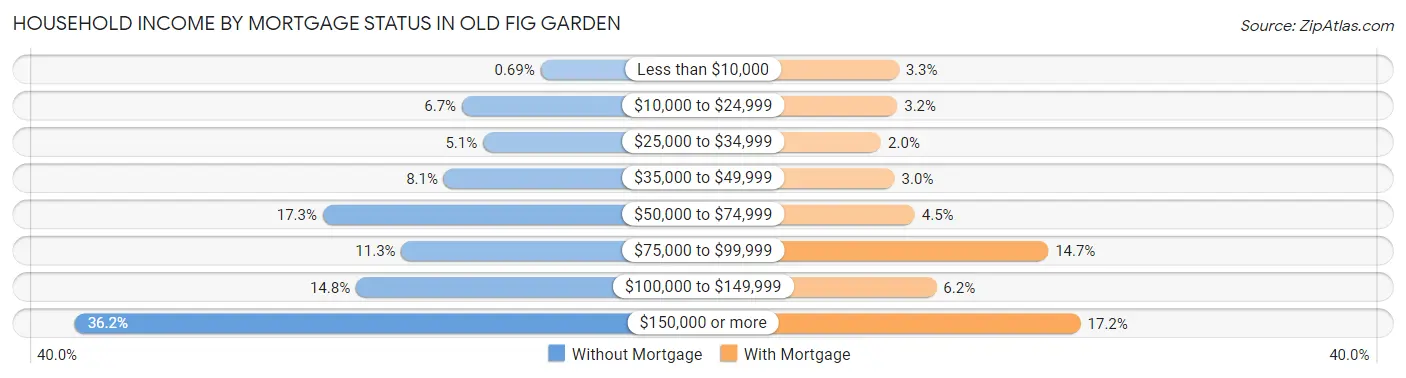
| Household Income | Without Mortgage | With Mortgage |
| Less than $10,000 | 3 (0.7%) | 32 (3.3%) |
| $10,000 to $24,999 | 29 (6.7%) | 31 (3.2%) |
| $25,000 to $34,999 | 22 (5.1%) | 19 (1.9%) |
| $35,000 to $49,999 | 35 (8.1%) | 29 (3.0%) |
| $50,000 to $74,999 | 75 (17.3%) | 44 (4.5%) |
| $75,000 to $99,999 | 49 (11.3%) | 143 (14.7%) |
| $100,000 to $149,999 | 64 (14.7%) | 60 (6.2%) |
| $150,000 or more | 157 (36.2%) | 167 (17.2%) |
| Total | 434 (100.0%) | 974 (100.0%) |
Property Value to Household Income Ratio in Old Fig Garden
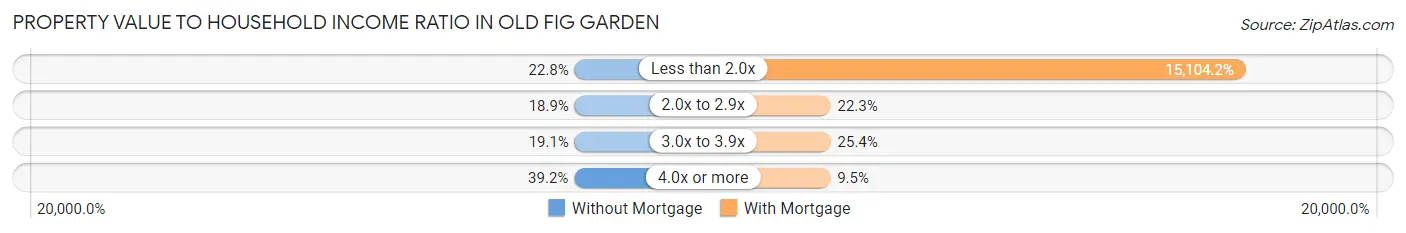
| Value-to-Income Ratio | Without Mortgage | With Mortgage |
| Less than 2.0x | 99 (22.8%) | 147,115 (15,104.2%) |
| 2.0x to 2.9x | 82 (18.9%) | 217 (22.3%) |
| 3.0x to 3.9x | 83 (19.1%) | 247 (25.4%) |
| 4.0x or more | 170 (39.2%) | 92 (9.5%) |
| Total | 434 (100.0%) | 974 (100.0%) |
Real Estate Taxes by Mortgage Status in Old Fig Garden
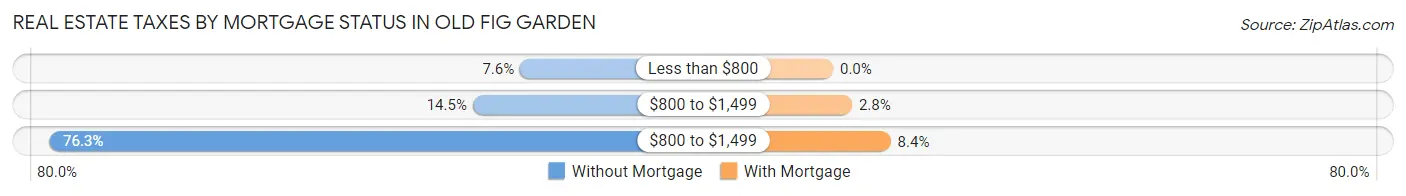
| Property Taxes | Without Mortgage | With Mortgage |
| Less than $800 | 33 (7.6%) | 0 (0.0%) |
| $800 to $1,499 | 63 (14.5%) | 27 (2.8%) |
| $800 to $1,499 | 331 (76.3%) | 82 (8.4%) |
| Total | 434 (100.0%) | 974 (100.0%) |
Health & Disability in Old Fig Garden
Health Insurance Coverage by Age in Old Fig Garden
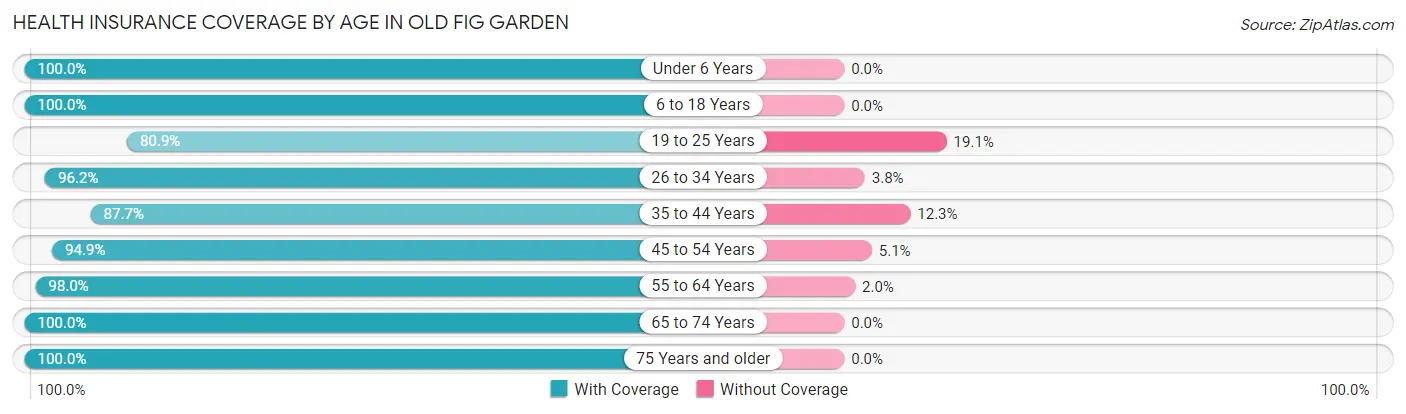
| Age Bracket | With Coverage | Without Coverage |
| Under 6 Years | 297 (100.0%) | 0 (0.0%) |
| 6 to 18 Years | 1,014 (100.0%) | 0 (0.0%) |
| 19 to 25 Years | 250 (80.9%) | 59 (19.1%) |
| 26 to 34 Years | 704 (96.2%) | 28 (3.8%) |
| 35 to 44 Years | 477 (87.7%) | 67 (12.3%) |
| 45 to 54 Years | 572 (94.9%) | 31 (5.1%) |
| 55 to 64 Years | 728 (98.0%) | 15 (2.0%) |
| 65 to 74 Years | 558 (100.0%) | 0 (0.0%) |
| 75 Years and older | 356 (100.0%) | 0 (0.0%) |
| Total | 4,956 (96.1%) | 200 (3.9%) |
Health Insurance Coverage by Citizenship Status in Old Fig Garden
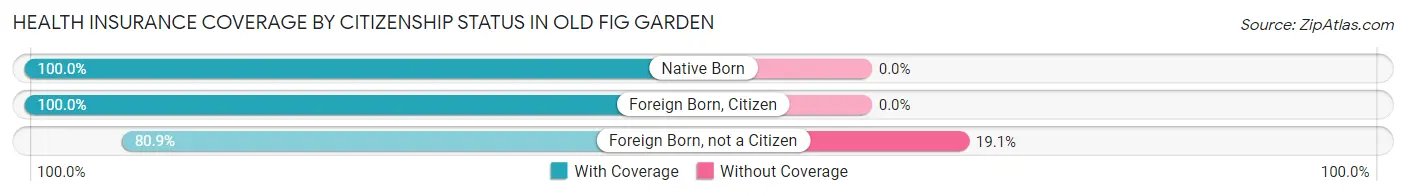
| Citizenship Status | With Coverage | Without Coverage |
| Native Born | 297 (100.0%) | 0 (0.0%) |
| Foreign Born, Citizen | 1,014 (100.0%) | 0 (0.0%) |
| Foreign Born, not a Citizen | 250 (80.9%) | 59 (19.1%) |
Health Insurance Coverage by Household Income in Old Fig Garden
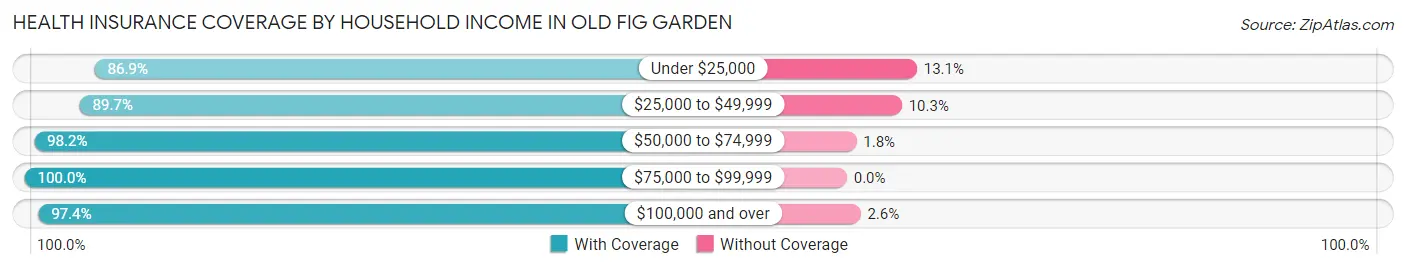
| Household Income | With Coverage | Without Coverage |
| Under $25,000 | 384 (86.9%) | 58 (13.1%) |
| $25,000 to $49,999 | 436 (89.7%) | 50 (10.3%) |
| $50,000 to $74,999 | 824 (98.2%) | 15 (1.8%) |
| $75,000 to $99,999 | 361 (100.0%) | 0 (0.0%) |
| $100,000 and over | 2,928 (97.4%) | 77 (2.6%) |
Public vs Private Health Insurance Coverage by Age in Old Fig Garden
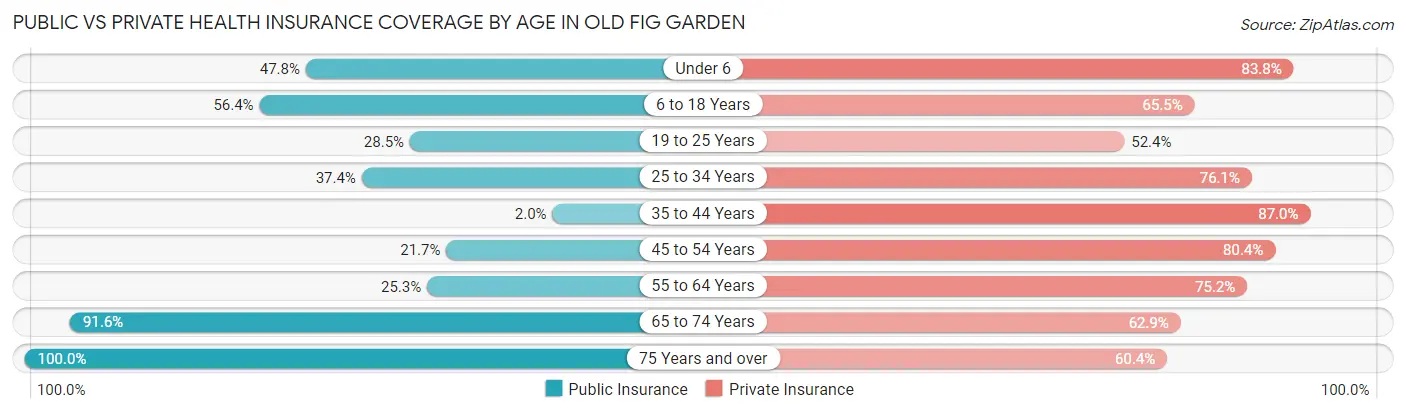
| Age Bracket | Public Insurance | Private Insurance |
| Under 6 | 142 (47.8%) | 249 (83.8%) |
| 6 to 18 Years | 572 (56.4%) | 664 (65.5%) |
| 19 to 25 Years | 88 (28.5%) | 162 (52.4%) |
| 25 to 34 Years | 274 (37.4%) | 557 (76.1%) |
| 35 to 44 Years | 11 (2.0%) | 473 (87.0%) |
| 45 to 54 Years | 131 (21.7%) | 485 (80.4%) |
| 55 to 64 Years | 188 (25.3%) | 559 (75.2%) |
| 65 to 74 Years | 511 (91.6%) | 351 (62.9%) |
| 75 Years and over | 356 (100.0%) | 215 (60.4%) |
| Total | 2,273 (44.1%) | 3,715 (72.1%) |
Disability Status by Sex by Age in Old Fig Garden
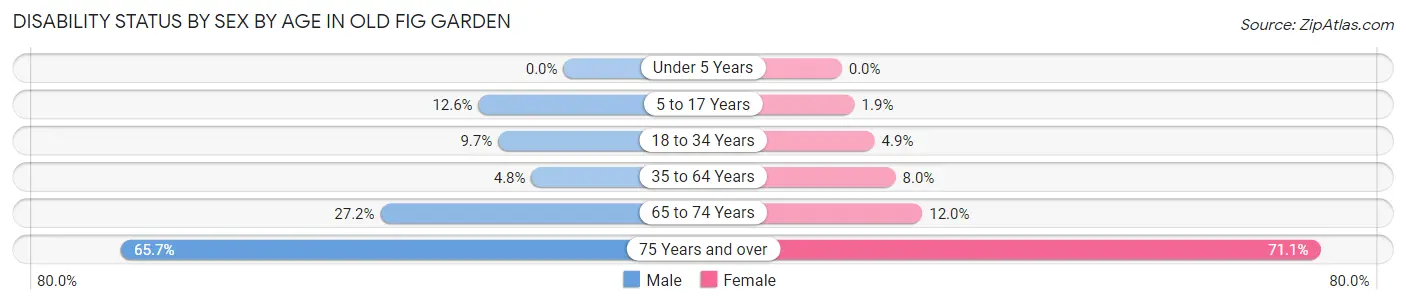
| Age Bracket | Male | Female |
| Under 5 Years | 0 (0.0%) | 0 (0.0%) |
| 5 to 17 Years | 90 (12.6%) | 6 (1.9%) |
| 18 to 34 Years | 51 (9.7%) | 27 (4.9%) |
| 35 to 64 Years | 41 (4.8%) | 82 (8.0%) |
| 65 to 74 Years | 72 (27.2%) | 35 (11.9%) |
| 75 Years and over | 109 (65.7%) | 135 (71.1%) |
Disability Class by Sex by Age in Old Fig Garden
Disability Class: Hearing Difficulty
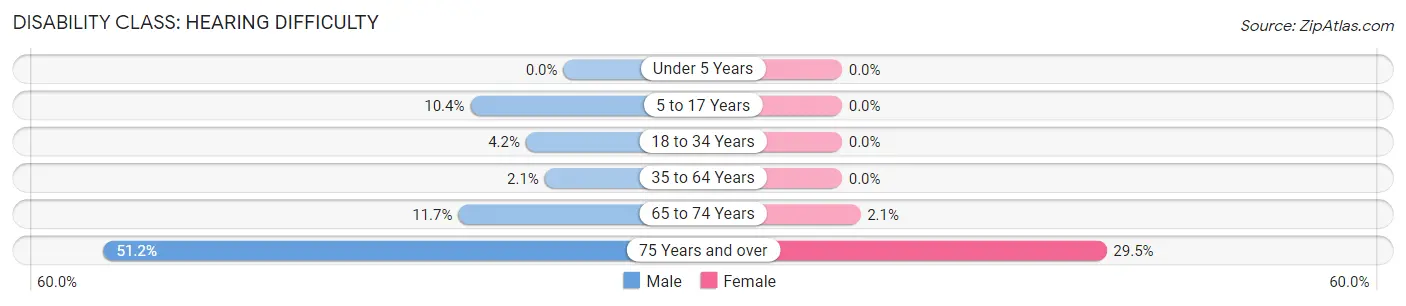
| Age Bracket | Male | Female |
| Under 5 Years | 0 (0.0%) | 0 (0.0%) |
| 5 to 17 Years | 74 (10.4%) | 0 (0.0%) |
| 18 to 34 Years | 22 (4.2%) | 0 (0.0%) |
| 35 to 64 Years | 18 (2.1%) | 0 (0.0%) |
| 65 to 74 Years | 31 (11.7%) | 6 (2.1%) |
| 75 Years and over | 85 (51.2%) | 56 (29.5%) |
Disability Class: Vision Difficulty
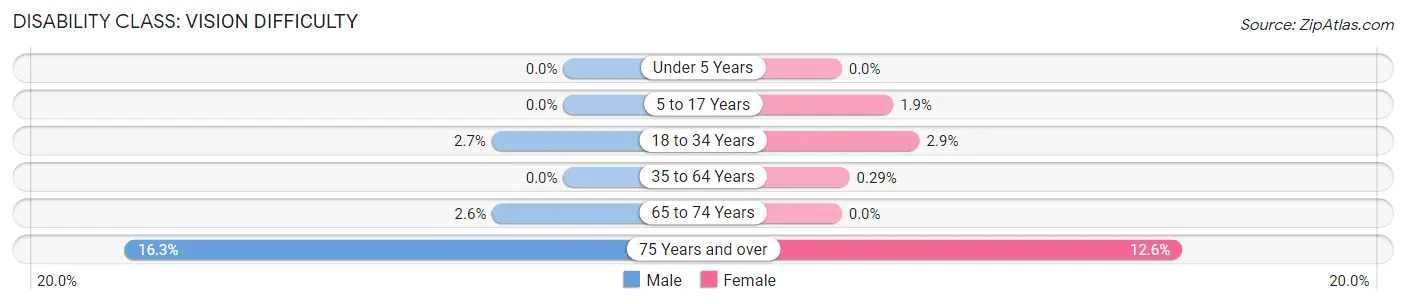
| Age Bracket | Male | Female |
| Under 5 Years | 0 (0.0%) | 0 (0.0%) |
| 5 to 17 Years | 0 (0.0%) | 6 (1.9%) |
| 18 to 34 Years | 14 (2.7%) | 16 (2.9%) |
| 35 to 64 Years | 0 (0.0%) | 3 (0.3%) |
| 65 to 74 Years | 7 (2.6%) | 0 (0.0%) |
| 75 Years and over | 27 (16.3%) | 24 (12.6%) |
Disability Class: Cognitive Difficulty
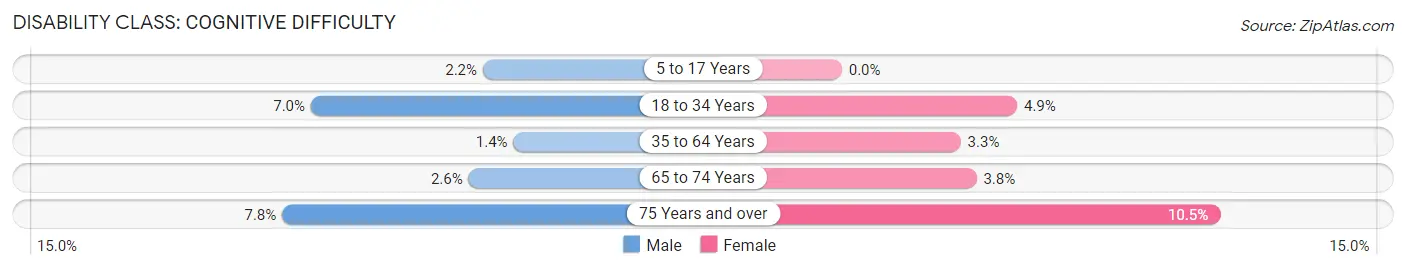
| Age Bracket | Male | Female |
| 5 to 17 Years | 16 (2.2%) | 0 (0.0%) |
| 18 to 34 Years | 37 (7.0%) | 27 (4.9%) |
| 35 to 64 Years | 12 (1.4%) | 34 (3.3%) |
| 65 to 74 Years | 7 (2.6%) | 11 (3.7%) |
| 75 Years and over | 13 (7.8%) | 20 (10.5%) |
Disability Class: Ambulatory Difficulty
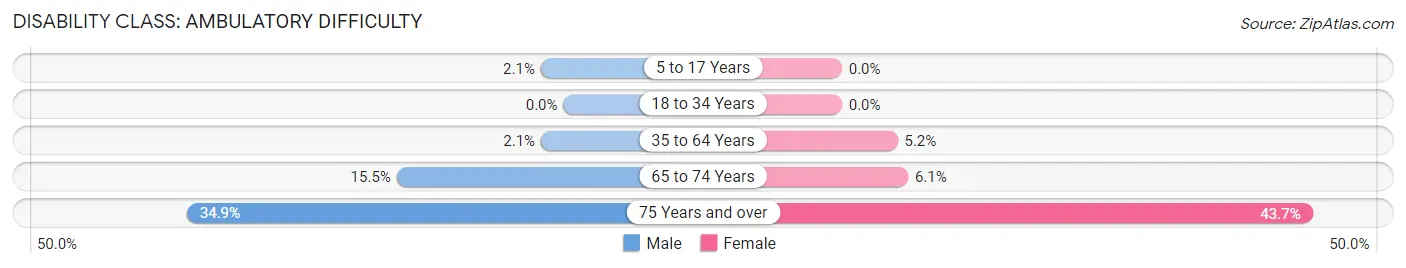
| Age Bracket | Male | Female |
| 5 to 17 Years | 15 (2.1%) | 0 (0.0%) |
| 18 to 34 Years | 0 (0.0%) | 0 (0.0%) |
| 35 to 64 Years | 18 (2.1%) | 53 (5.2%) |
| 65 to 74 Years | 41 (15.5%) | 18 (6.1%) |
| 75 Years and over | 58 (34.9%) | 83 (43.7%) |
Disability Class: Self-Care Difficulty
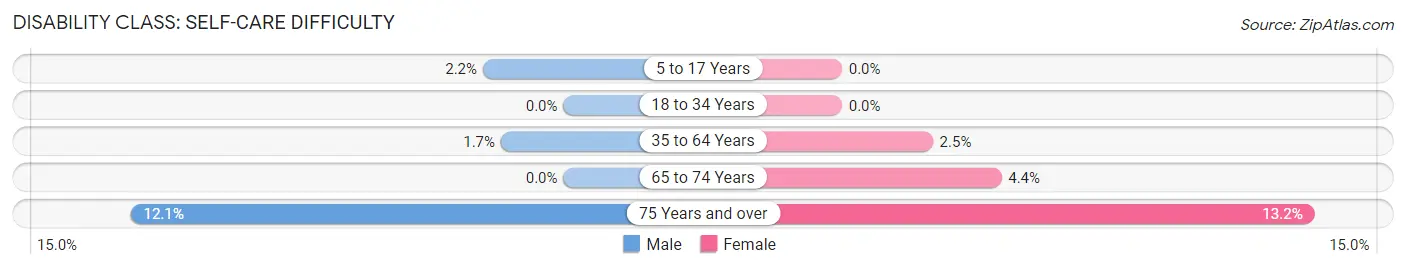
| Age Bracket | Male | Female |
| 5 to 17 Years | 16 (2.2%) | 0 (0.0%) |
| 18 to 34 Years | 0 (0.0%) | 0 (0.0%) |
| 35 to 64 Years | 15 (1.7%) | 26 (2.5%) |
| 65 to 74 Years | 0 (0.0%) | 13 (4.4%) |
| 75 Years and over | 20 (12.0%) | 25 (13.2%) |
Technology Access in Old Fig Garden
Computing Device Access in Old Fig Garden
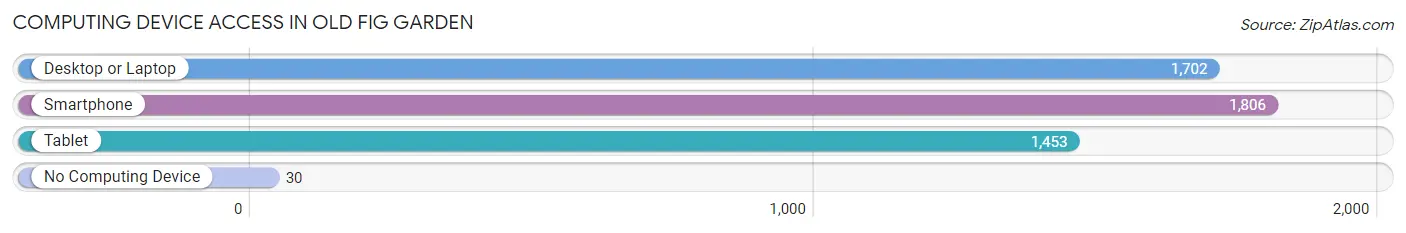
| Device Type | # Households | % Households |
| Desktop or Laptop | 1,702 | 89.4% |
| Smartphone | 1,806 | 94.9% |
| Tablet | 1,453 | 76.3% |
| No Computing Device | 30 | 1.6% |
| Total | 1,904 | 100.0% |
Internet Access in Old Fig Garden
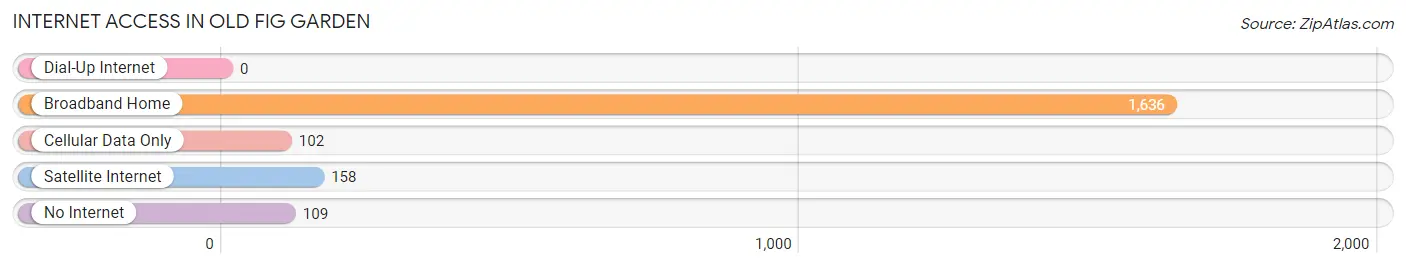
| Internet Type | # Households | % Households |
| Dial-Up Internet | 0 | 0.0% |
| Broadband Home | 1,636 | 85.9% |
| Cellular Data Only | 102 | 5.4% |
| Satellite Internet | 158 | 8.3% |
| No Internet | 109 | 5.7% |
| Total | 1,904 | 100.0% |
Old Fig Garden Summary
Fig Garden is a census-designated place (CDP) located in Fresno County, California, United States. The population was 4,919 at the 2010 census, up from 4,717 at the 2000 census. It is a residential neighborhood located in the northwest corner of Fresno, California.
History
Fig Garden was founded in the early 1900s by the Fresno Land and Water Company, which was owned by the influential Chandler family. The Chandlers had purchased the land from the railroad in the late 1800s and developed it into a residential area. The name Fig Garden was derived from the many fig trees that were planted in the area.
The Fig Garden area was annexed to the City of Fresno in the 1950s. The area has since become a popular residential neighborhood, with many homes built in the 1950s and 1960s.
Geography
Fig Garden is located at 36 45 25 North 119 48 17 West 36 756944 119 804722
According to the United States Census Bureau, the CDP has a total area of 2.2 square miles (5.7 km2), all of it land.
Economy
Fig Garden is primarily a residential neighborhood, with no major employers located in the area. However, there are several small businesses located in the area, including restaurants, retail stores, and professional services.
Demographics
As of the census of 2000, there were 4,717 people, 1,845 households, and 1,323 families residing in the CDP. The population density was 2,093.3 people per square mile (807.7/km2). There were 1,919 housing units at an average density of 854.3 per square mile (329.3/km2). The racial makeup of the CDP was 68.2% White, 2.2% African American, 1.2% Native American, 1.7% Asian, 0.2% Pacific Islander, 22.7% from other races, and 4.8% from two or more races. Hispanic or Latino of any race were 37.2% of the population.
There were 1,845 households, out of which 33.2% had children under the age of 18 living with them, 53.2% were married couples living together, 12.2% had a female householder with no husband present, and 29.2% were non-families. 24.2% of all households were made up of individuals, and 9.2% had someone living alone who was 65 years of age or older. The average household size was 2.56 and the average family size was 3.06.
In the CDP, the population was spread out, with 25.7% under the age of 18, 8.7% from 18 to 24, 28.2% from 25 to 44, 23.2% from 45 to 64, and 14.2% who were 65 years of age or older. The median age was 37 years. For every 100 females, there were 94.2 males. For every 100 females age 18 and over, there were 91.2 males.
The median income for a household in the CDP was $41,944, and the median income for a family was $48,958. Males had a median income of $35,938 versus $27,917 for females. The per capita income for the CDP was $20,945. About 8.2% of families and 11.2% of the population were below the poverty line, including 14.2% of those under age 18 and 6.2% of those age 65 or over.
Common Questions
What is Per Capita Income in Old Fig Garden?
Per Capita income in Old Fig Garden is $50,676.
What is the Median Family Income in Old Fig Garden?
Median Family Income in Old Fig Garden is $136,875.
What is the Median Household income in Old Fig Garden?
Median Household Income in Old Fig Garden is $105,648.
What is Income or Wage Gap in Old Fig Garden?
Income or Wage Gap in Old Fig Garden is 20.8%.
Women in Old Fig Garden earn 79.2 cents for every dollar earned by a man.
What is Inequality or Gini Index in Old Fig Garden?
Inequality or Gini Index in Old Fig Garden is 0.46.
What is the Total Population of Old Fig Garden?
Total Population of Old Fig Garden is 5,156.
What is the Total Male Population of Old Fig Garden?
Total Male Population of Old Fig Garden is 2,631.
What is the Total Female Population of Old Fig Garden?
Total Female Population of Old Fig Garden is 2,525.
What is the Ratio of Males per 100 Females in Old Fig Garden?
There are 104.20 Males per 100 Females in Old Fig Garden.
What is the Ratio of Females per 100 Males in Old Fig Garden?
There are 95.97 Females per 100 Males in Old Fig Garden.
What is the Median Population Age in Old Fig Garden?
Median Population Age in Old Fig Garden is 40.9 Years.
What is the Average Family Size in Old Fig Garden
Average Family Size in Old Fig Garden is 3.3 People.
What is the Average Household Size in Old Fig Garden
Average Household Size in Old Fig Garden is 2.7 People.
How Large is the Labor Force in Old Fig Garden?
There are 2,622 People in the Labor Forcein in Old Fig Garden.
What is the Percentage of People in the Labor Force in Old Fig Garden?
66.3% of People are in the Labor Force in Old Fig Garden.
What is the Unemployment Rate in Old Fig Garden?
Unemployment Rate in Old Fig Garden is 7.8%.