West Athens, CA Map & Demographics
West Athens Map
West Athens Overview
$31,991
PER CAPITA INCOME
$85,612
AVG FAMILY INCOME
$67,552
AVG HOUSEHOLD INCOME
28.7%
WAGE / INCOME GAP [ % ]
71.3¢/ $1
WAGE / INCOME GAP [ $ ]
0.47
INEQUALITY / GINI INDEX
9,131
TOTAL POPULATION
4,055
MALE POPULATION
5,076
FEMALE POPULATION
79.89
MALES / 100 FEMALES
125.18
FEMALES / 100 MALES
34.4
MEDIAN AGE
3.9
AVG FAMILY SIZE
3.3
AVG HOUSEHOLD SIZE
4,570
LABOR FORCE [ PEOPLE ]
65.8%
PERCENT IN LABOR FORCE
11.6%
UNEMPLOYMENT RATE
Income in West Athens
Income Overview in West Athens
Per Capita Income in West Athens is $31,991, while median incomes of families and households are $85,612 and $67,552 respectively.
| Characteristic | Number | Measure |
| Per Capita Income | 9,131 | $31,991 |
| Median Family Income | 2,061 | $85,612 |
| Mean Family Income | 2,061 | $115,274 |
| Median Household Income | 2,719 | $67,552 |
| Mean Household Income | 2,719 | $102,510 |
| Income Deficit | 2,061 | $0 |
| Wage / Income Gap (%) | 9,131 | 28.68% |
| Wage / Income Gap ($) | 9,131 | 71.32¢ per $1 |
| Gini / Inequality Index | 9,131 | 0.47 |
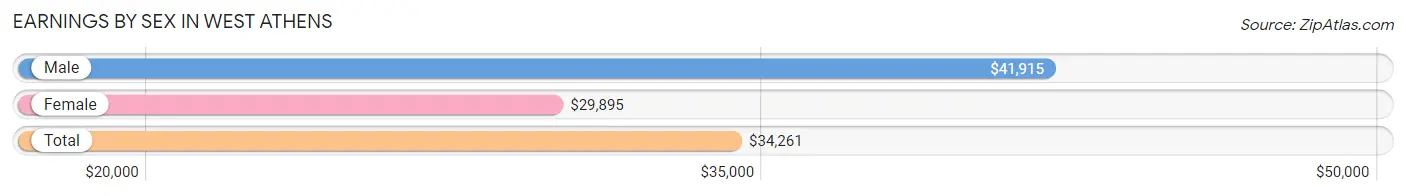
Earnings by Sex in West Athens
Average Earnings in West Athens are $34,261, $41,915 for men and $29,895 for women, a difference of 28.7%.
| Sex | Number | Average Earnings |
| Male | 1,809 (40.6%) | $41,915 |
| Female | 2,644 (59.4%) | $29,895 |
| Total | 4,453 (100.0%) | $34,261 |
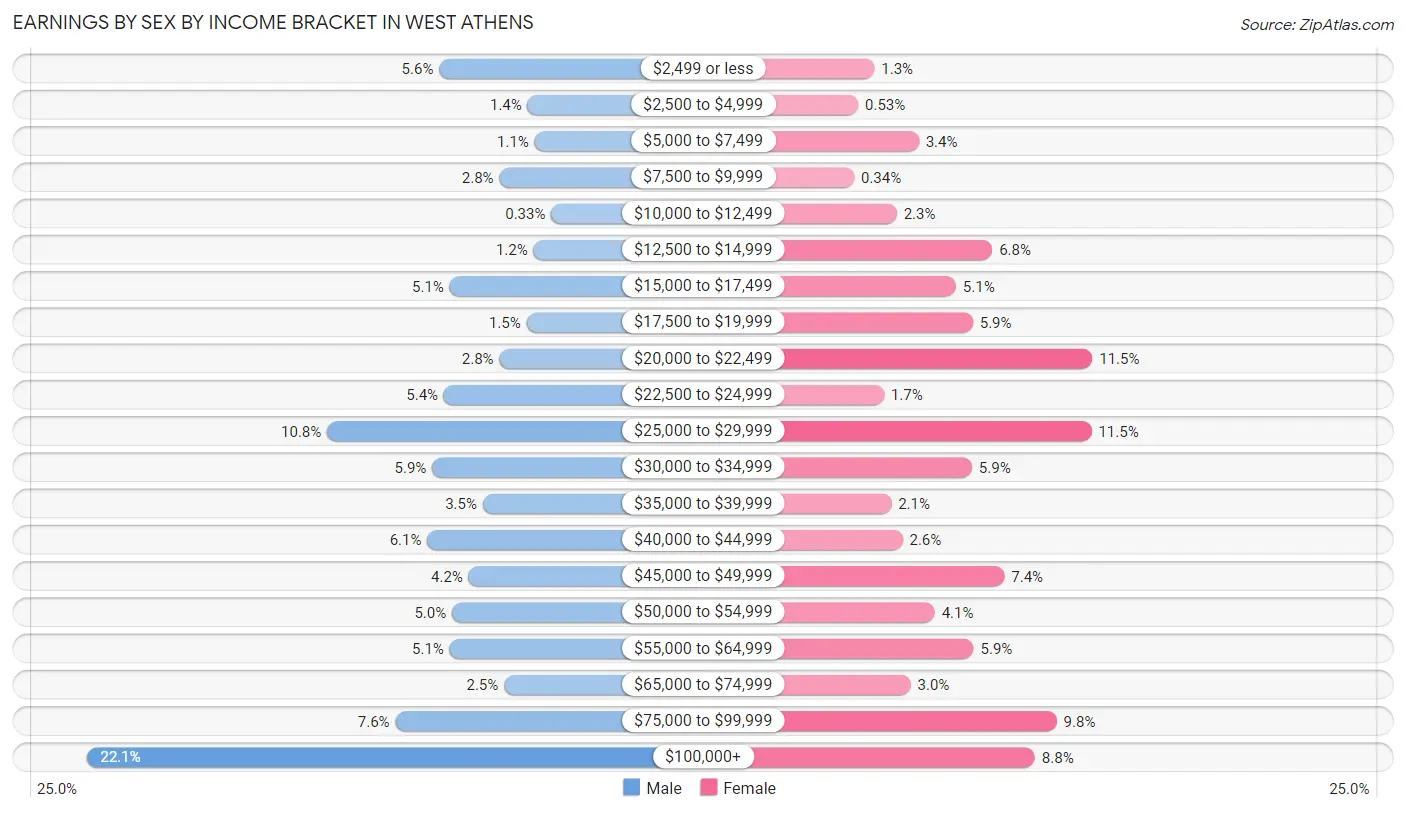
Earnings by Sex by Income Bracket in West Athens
The most common earnings brackets in West Athens are $100,000+ for men (399 | 22.1%) and $20,000 to $22,499 for women (304 | 11.5%).
| Income | Male | Female |
| $2,499 or less | 101 (5.6%) | 34 (1.3%) |
| $2,500 to $4,999 | 26 (1.4%) | 14 (0.5%) |
| $5,000 to $7,499 | 20 (1.1%) | 89 (3.4%) |
| $7,500 to $9,999 | 50 (2.8%) | 9 (0.3%) |
| $10,000 to $12,499 | 6 (0.3%) | 62 (2.3%) |
| $12,500 to $14,999 | 21 (1.2%) | 180 (6.8%) |
| $15,000 to $17,499 | 92 (5.1%) | 135 (5.1%) |
| $17,500 to $19,999 | 27 (1.5%) | 156 (5.9%) |
| $20,000 to $22,499 | 50 (2.8%) | 304 (11.5%) |
| $22,500 to $24,999 | 97 (5.4%) | 46 (1.7%) |
| $25,000 to $29,999 | 196 (10.8%) | 303 (11.5%) |
| $30,000 to $34,999 | 107 (5.9%) | 155 (5.9%) |
| $35,000 to $39,999 | 64 (3.5%) | 55 (2.1%) |
| $40,000 to $44,999 | 111 (6.1%) | 69 (2.6%) |
| $45,000 to $49,999 | 76 (4.2%) | 195 (7.4%) |
| $50,000 to $54,999 | 90 (5.0%) | 109 (4.1%) |
| $55,000 to $64,999 | 92 (5.1%) | 157 (5.9%) |
| $65,000 to $74,999 | 46 (2.5%) | 79 (3.0%) |
| $75,000 to $99,999 | 138 (7.6%) | 260 (9.8%) |
| $100,000+ | 399 (22.1%) | 233 (8.8%) |
| Total | 1,809 (100.0%) | 2,644 (100.0%) |
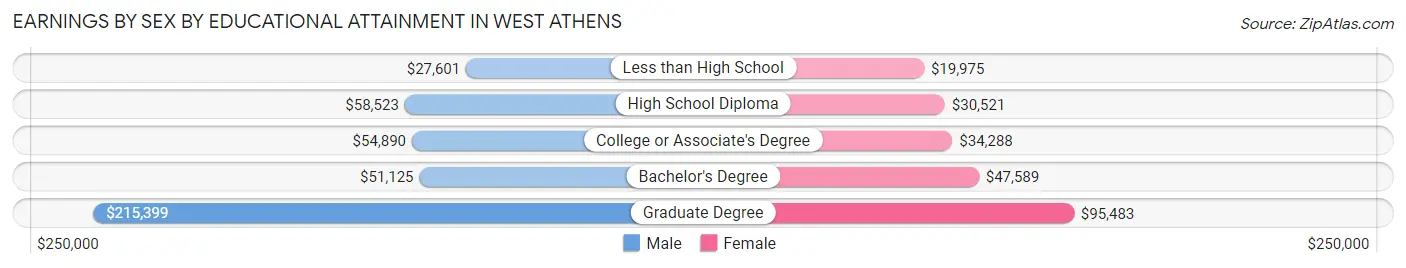
Earnings by Sex by Educational Attainment in West Athens
Average earnings in West Athens are $46,392 for men and $39,073 for women, a difference of 15.8%. Men with an educational attainment of graduate degree enjoy the highest average annual earnings of $215,399, while those with less than high school education earn the least with $27,601. Women with an educational attainment of graduate degree earn the most with the average annual earnings of $95,483, while those with less than high school education have the smallest earnings of $19,975.
| Educational Attainment | Male Income | Female Income |
| Less than High School | $27,601 | $19,975 |
| High School Diploma | $58,523 | $30,521 |
| College or Associate's Degree | $54,890 | $34,288 |
| Bachelor's Degree | $51,125 | $47,589 |
| Graduate Degree | $215,399 | $95,483 |
| Total | $46,392 | $39,073 |
Family Income in West Athens
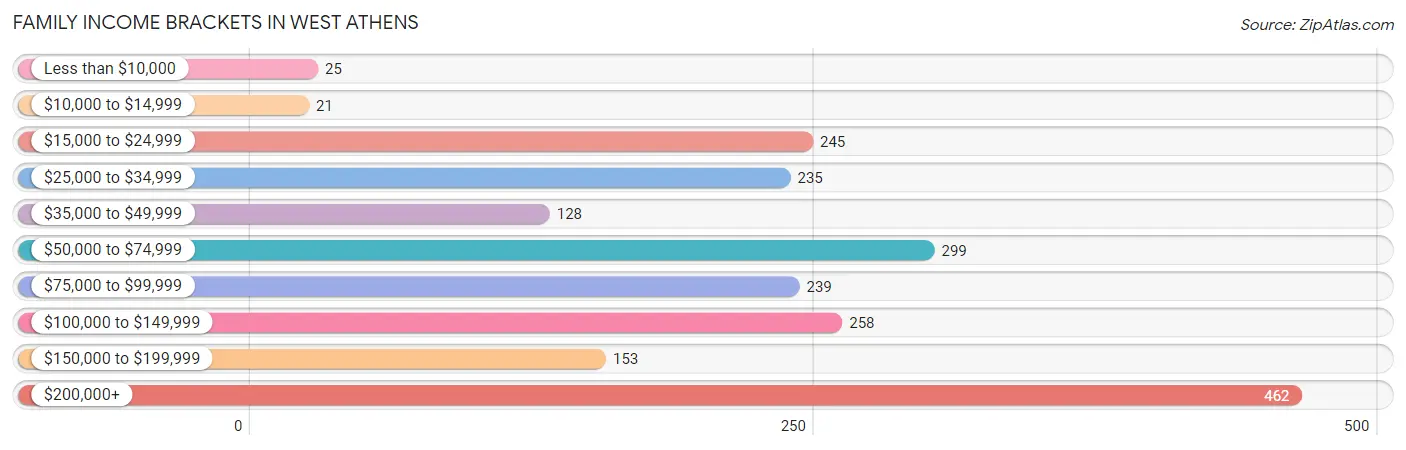
Family Income Brackets in West Athens
According to the West Athens family income data, there are 462 families falling into the $200,000+ income range, which is the most common income bracket and makes up 22.4% of all families. Conversely, the $10,000 to $14,999 income bracket is the least frequent group with only 21 families (1.0%) belonging to this category.
| Income Bracket | # Families | % Families |
| Less than $10,000 | 25 | 1.2% |
| $10,000 to $14,999 | 21 | 1.0% |
| $15,000 to $24,999 | 245 | 11.9% |
| $25,000 to $34,999 | 235 | 11.4% |
| $35,000 to $49,999 | 128 | 6.2% |
| $50,000 to $74,999 | 299 | 14.5% |
| $75,000 to $99,999 | 239 | 11.6% |
| $100,000 to $149,999 | 258 | 12.5% |
| $150,000 to $199,999 | 153 | 7.4% |
| $200,000+ | 462 | 22.4% |
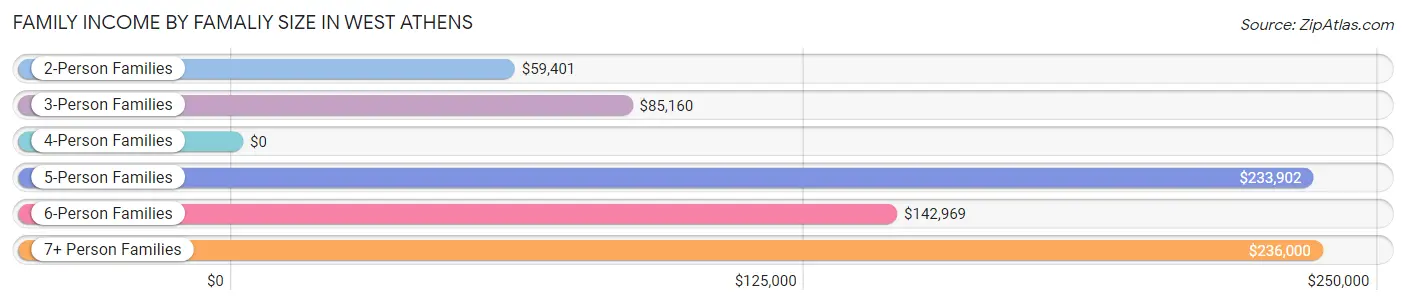
Family Income by Famaliy Size in West Athens
7+ person families (82 | 4.0%) account for the highest median family income in West Athens with $236,000 per family, while 5-person families (213 | 10.3%) have the highest median income of $46,780 per family member.
| Income Bracket | # Families | Median Income |
| 2-Person Families | 678 (32.9%) | $59,401 |
| 3-Person Families | 380 (18.4%) | $85,160 |
| 4-Person Families | 489 (23.7%) | $0 |
| 5-Person Families | 213 (10.3%) | $233,902 |
| 6-Person Families | 219 (10.6%) | $142,969 |
| 7+ Person Families | 82 (4.0%) | $236,000 |
| Total | 2,061 (100.0%) | $85,612 |
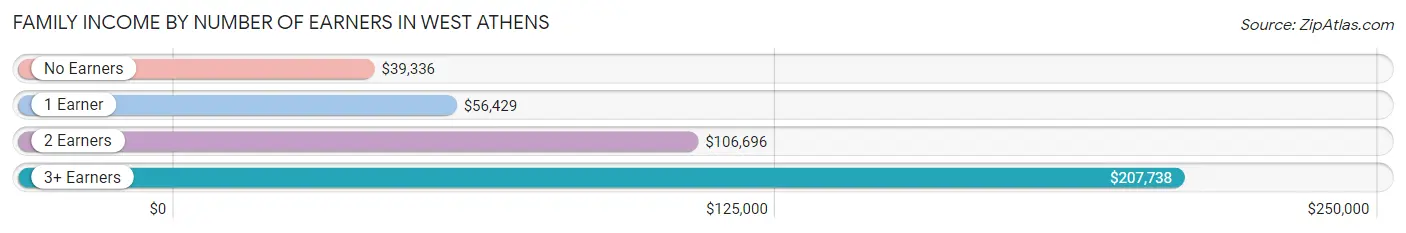
Family Income by Number of Earners in West Athens
The median family income in West Athens is $85,612, with families comprising 3+ earners (436) having the highest median family income of $207,738, while families with no earners (185) have the lowest median family income of $39,336, accounting for 21.1% and 9.0% of families, respectively.
| Number of Earners | # Families | Median Income |
| No Earners | 185 (9.0%) | $39,336 |
| 1 Earner | 964 (46.8%) | $56,429 |
| 2 Earners | 476 (23.1%) | $106,696 |
| 3+ Earners | 436 (21.1%) | $207,738 |
| Total | 2,061 (100.0%) | $85,612 |
Household Income in West Athens
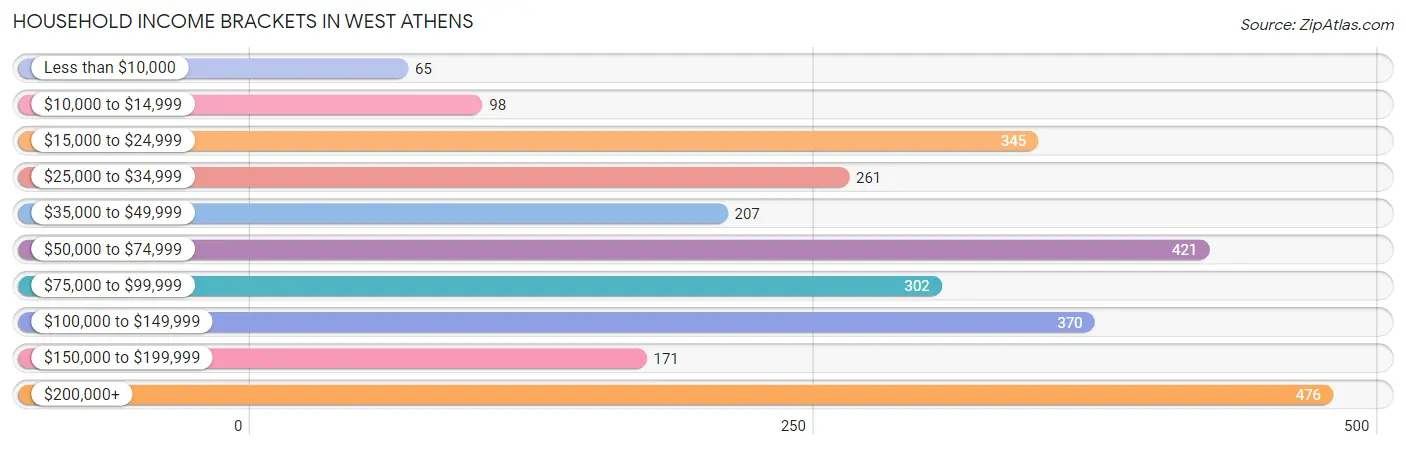
Household Income Brackets in West Athens
With 476 households falling in the category, the $200,000+ income range is the most frequent in West Athens, accounting for 17.5% of all households. In contrast, only 65 households (2.4%) fall into the less than $10,000 income bracket, making it the least populous group.
| Income Bracket | # Households | % Households |
| Less than $10,000 | 65 | 2.4% |
| $10,000 to $14,999 | 98 | 3.6% |
| $15,000 to $24,999 | 345 | 12.7% |
| $25,000 to $34,999 | 261 | 9.6% |
| $35,000 to $49,999 | 207 | 7.6% |
| $50,000 to $74,999 | 421 | 15.5% |
| $75,000 to $99,999 | 302 | 11.1% |
| $100,000 to $149,999 | 370 | 13.6% |
| $150,000 to $199,999 | 171 | 6.3% |
| $200,000+ | 476 | 17.5% |
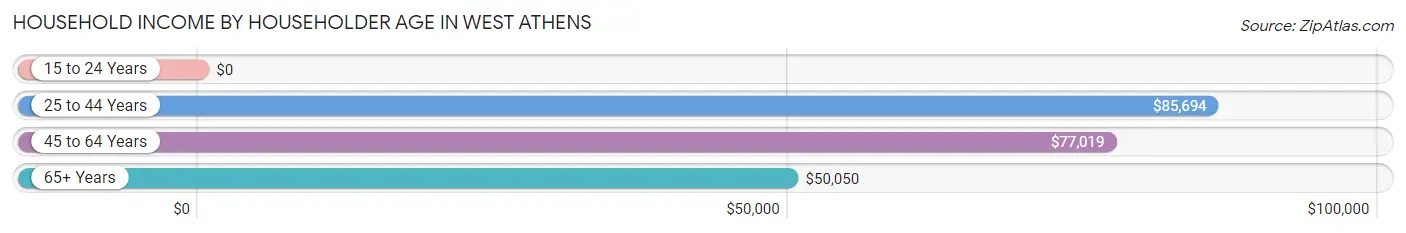
Household Income by Householder Age in West Athens
The median household income in West Athens is $67,552, with the highest median household income of $85,694 found in the 25 to 44 years age bracket for the primary householder. A total of 745 households (27.4%) fall into this category.
| Income Bracket | # Households | Median Income |
| 15 to 24 Years | 0 (0.0%) | $0 |
| 25 to 44 Years | 745 (27.4%) | $85,694 |
| 45 to 64 Years | 1,231 (45.3%) | $77,019 |
| 65+ Years | 743 (27.3%) | $50,050 |
| Total | 2,719 (100.0%) | $67,552 |
Poverty in West Athens
Income Below Poverty by Sex and Age in West Athens
With 14.8% poverty level for males and 12.9% for females among the residents of West Athens, under 5 year old males and 5 year old females are the most vulnerable to poverty, with 200 males (50.4%) and 16 females (100.0%) in their respective age groups living below the poverty level.
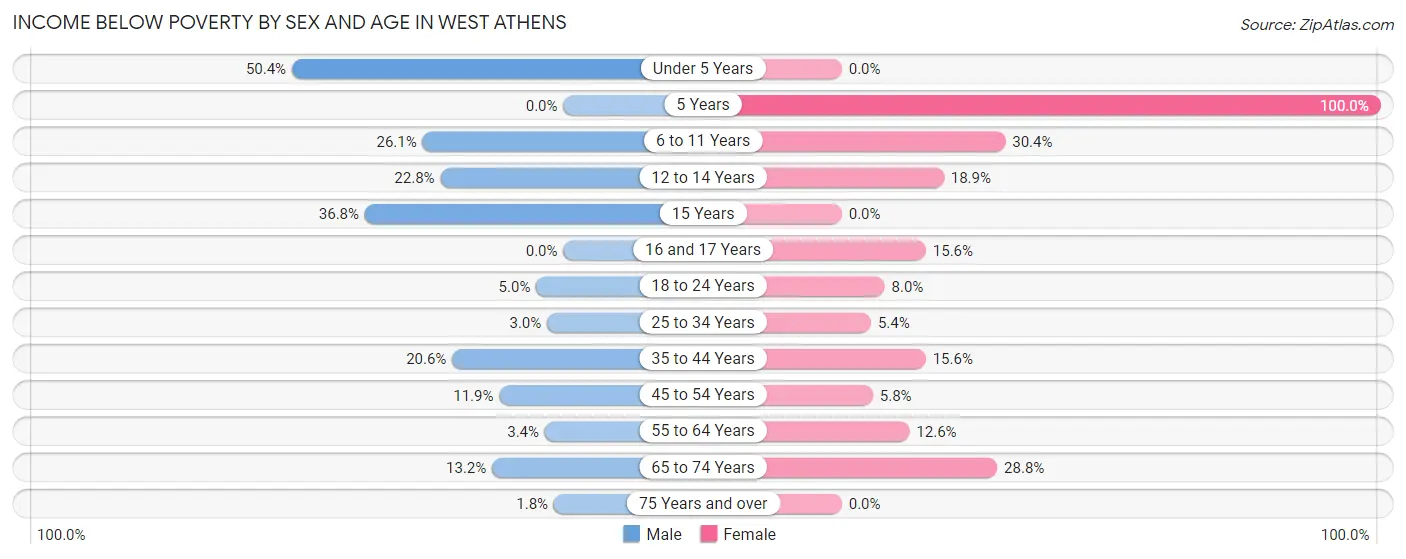
| Age Bracket | Male | Female |
| Under 5 Years | 200 (50.4%) | 0 (0.0%) |
| 5 Years | 0 (0.0%) | 16 (100.0%) |
| 6 to 11 Years | 110 (26.1%) | 139 (30.3%) |
| 12 to 14 Years | 47 (22.8%) | 53 (18.9%) |
| 15 Years | 28 (36.8%) | 0 (0.0%) |
| 16 and 17 Years | 0 (0.0%) | 22 (15.6%) |
| 18 to 24 Years | 17 (5.0%) | 41 (8.0%) |
| 25 to 34 Years | 16 (3.0%) | 39 (5.4%) |
| 35 to 44 Years | 79 (20.6%) | 88 (15.6%) |
| 45 to 54 Years | 44 (11.9%) | 29 (5.8%) |
| 55 to 64 Years | 25 (3.4%) | 93 (12.6%) |
| 65 to 74 Years | 32 (13.2%) | 137 (28.8%) |
| 75 Years and over | 2 (1.8%) | 0 (0.0%) |
| Total | 600 (14.8%) | 657 (12.9%) |
Income Above Poverty by Sex and Age in West Athens
According to the poverty statistics in West Athens, males aged 5 years and females aged under 5 years are the age groups that are most secure financially, with 100.0% of males and 100.0% of females in these age groups living above the poverty line.
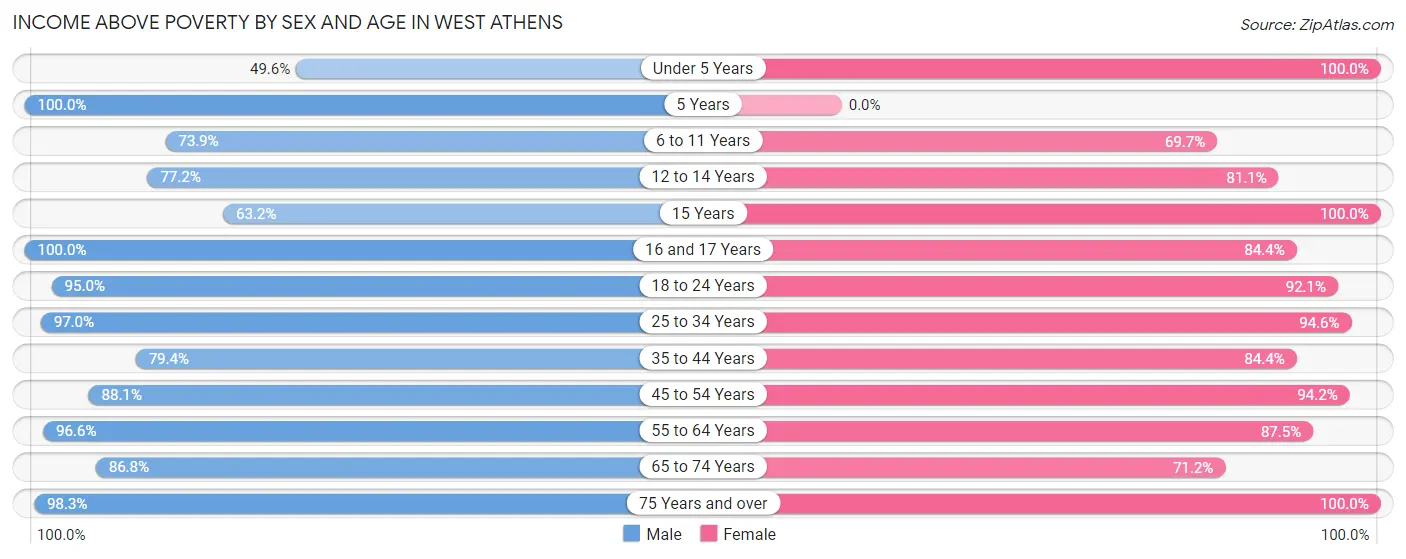
| Age Bracket | Male | Female |
| Under 5 Years | 197 (49.6%) | 261 (100.0%) |
| 5 Years | 28 (100.0%) | 0 (0.0%) |
| 6 to 11 Years | 311 (73.9%) | 319 (69.7%) |
| 12 to 14 Years | 159 (77.2%) | 227 (81.1%) |
| 15 Years | 48 (63.2%) | 41 (100.0%) |
| 16 and 17 Years | 217 (100.0%) | 119 (84.4%) |
| 18 to 24 Years | 321 (95.0%) | 475 (92.0%) |
| 25 to 34 Years | 515 (97.0%) | 681 (94.6%) |
| 35 to 44 Years | 304 (79.4%) | 477 (84.4%) |
| 45 to 54 Years | 326 (88.1%) | 474 (94.2%) |
| 55 to 64 Years | 704 (96.6%) | 648 (87.5%) |
| 65 to 74 Years | 210 (86.8%) | 338 (71.2%) |
| 75 Years and over | 112 (98.3%) | 359 (100.0%) |
| Total | 3,452 (85.2%) | 4,419 (87.1%) |
Income Below Poverty Among Married-Couple Families in West Athens
The poverty statistics for married-couple families in West Athens show that 3.2% or 28 of the total 874 families live below the poverty line. Families with no children have the highest poverty rate of 4.6%, comprising of 21 families. On the other hand, families with 3 or 4 children have the lowest poverty rate of 0.0%, which includes 0 families.
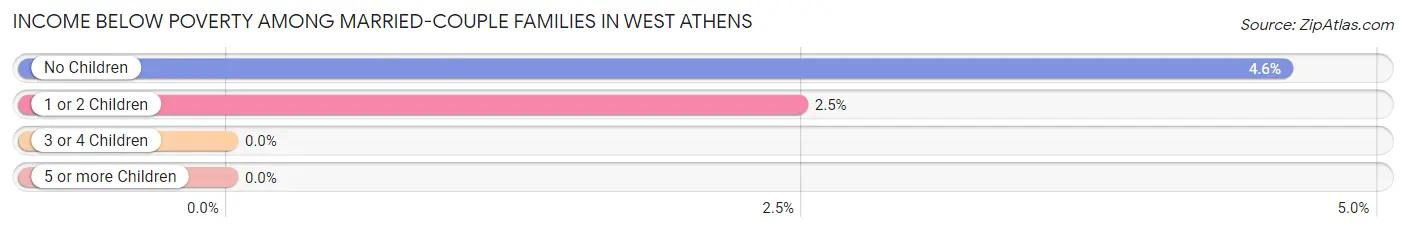
| Children | Above Poverty | Below Poverty |
| No Children | 437 (95.4%) | 21 (4.6%) |
| 1 or 2 Children | 275 (97.5%) | 7 (2.5%) |
| 3 or 4 Children | 102 (100.0%) | 0 (0.0%) |
| 5 or more Children | 32 (100.0%) | 0 (0.0%) |
| Total | 846 (96.8%) | 28 (3.2%) |
Income Below Poverty Among Single-Parent Households in West Athens
According to the poverty data in West Athens, 6.6% or 16 single-father households and 28.6% or 270 single-mother households are living below the poverty line. Among single-father households, those with 3 or 4 children have the highest poverty rate, with 16 households (100.0%) experiencing poverty. Likewise, among single-mother households, those with 3 or 4 children have the highest poverty rate, with 216 households (79.4%) falling below the poverty line.
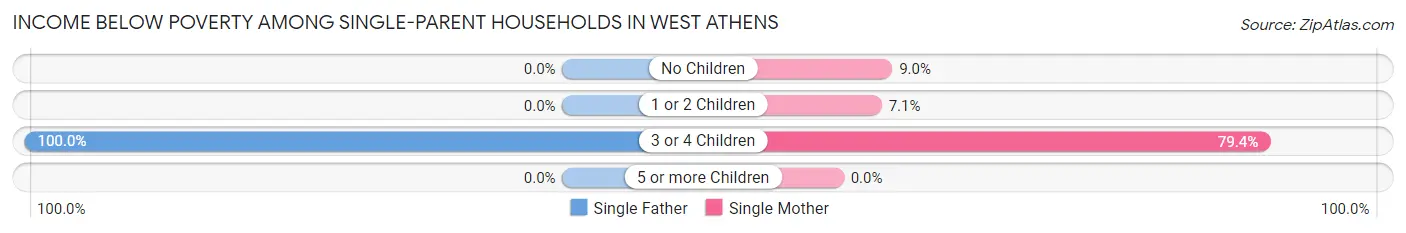
| Children | Single Father | Single Mother |
| No Children | 0 (0.0%) | 30 (9.0%) |
| 1 or 2 Children | 0 (0.0%) | 24 (7.1%) |
| 3 or 4 Children | 16 (100.0%) | 216 (79.4%) |
| 5 or more Children | 0 (0.0%) | 0 (0.0%) |
| Total | 16 (6.6%) | 270 (28.6%) |
Income Below Poverty Among Married-Couple vs Single-Parent Households in West Athens
The poverty data for West Athens shows that 28 of the married-couple family households (3.2%) and 286 of the single-parent households (24.1%) are living below the poverty level. Within the married-couple family households, those with no children have the highest poverty rate, with 21 households (4.6%) falling below the poverty line. Among the single-parent households, those with 3 or 4 children have the highest poverty rate, with 232 household (80.6%) living below poverty.
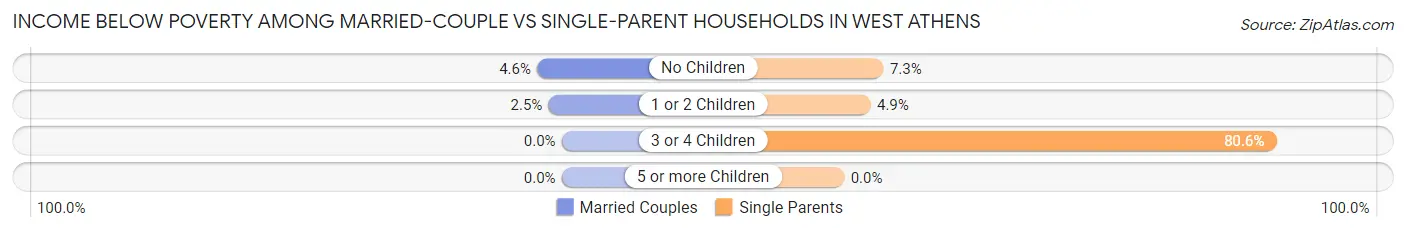
| Children | Married-Couple Families | Single-Parent Households |
| No Children | 21 (4.6%) | 30 (7.3%) |
| 1 or 2 Children | 7 (2.5%) | 24 (4.9%) |
| 3 or 4 Children | 0 (0.0%) | 232 (80.6%) |
| 5 or more Children | 0 (0.0%) | 0 (0.0%) |
| Total | 28 (3.2%) | 286 (24.1%) |
Race in West Athens
The most populous races in West Athens are Black / African American (5,057 | 55.4%), Hispanic or Latino (3,720 | 40.7%), and Some other Race (1,255 | 13.7%).
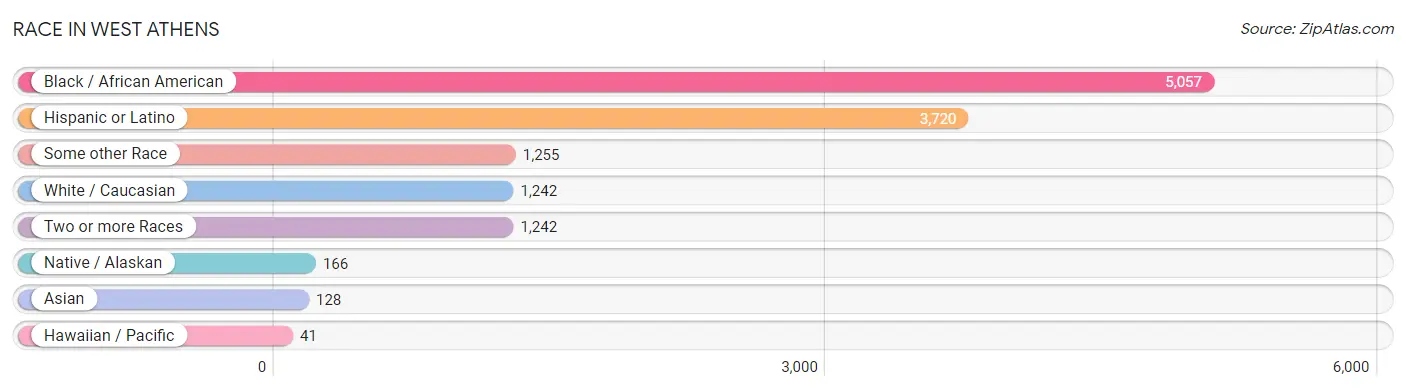
| Race | # Population | % Population |
| Asian | 128 | 1.4% |
| Black / African American | 5,057 | 55.4% |
| Hawaiian / Pacific | 41 | 0.4% |
| Hispanic or Latino | 3,720 | 40.7% |
| Native / Alaskan | 166 | 1.8% |
| White / Caucasian | 1,242 | 13.6% |
| Two or more Races | 1,242 | 13.6% |
| Some other Race | 1,255 | 13.7% |
| Total | 9,131 | 100.0% |
Ancestry in West Athens
The most populous ancestries reported in West Athens are Mexican (2,722 | 29.8%), Central American (729 | 8.0%), Guatemalan (402 | 4.4%), Subsaharan African (373 | 4.1%), and African (202 | 2.2%), together accounting for 48.5% of all West Athens residents.
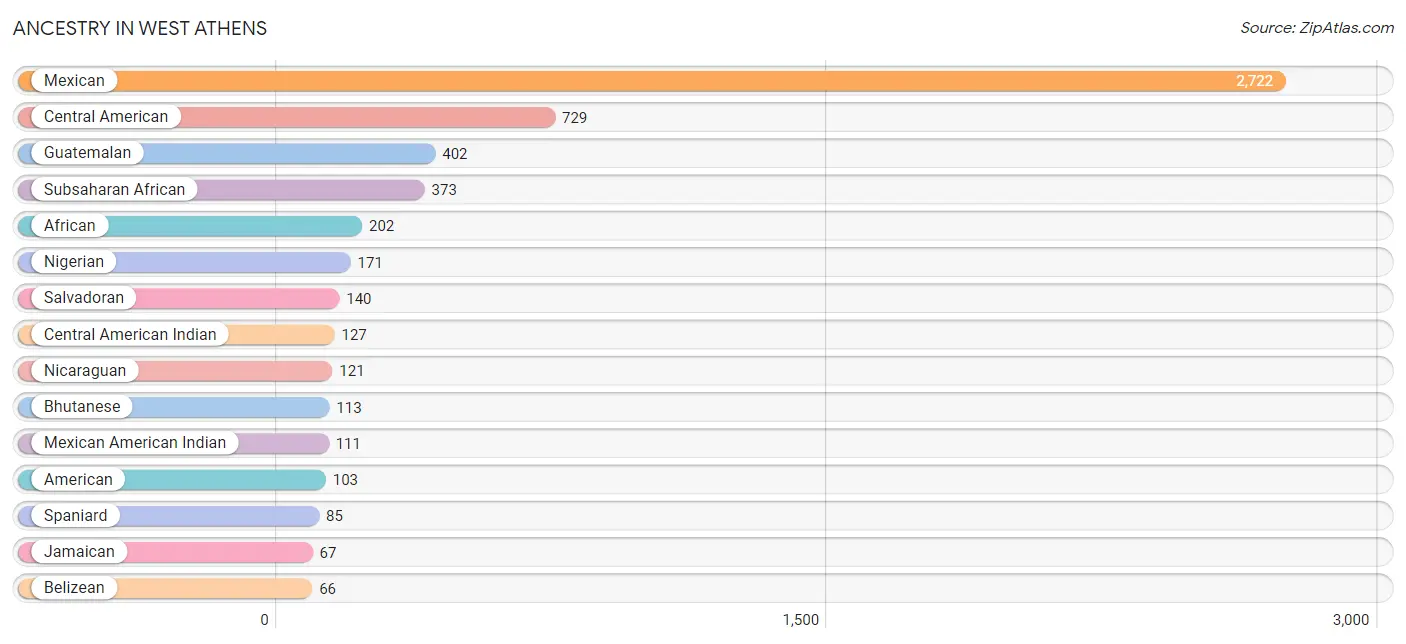
| Ancestry | # Population | % Population |
| Afghan | 34 | 0.4% |
| African | 202 | 2.2% |
| American | 103 | 1.1% |
| Belizean | 66 | 0.7% |
| Bhutanese | 113 | 1.2% |
| Central American | 729 | 8.0% |
| Central American Indian | 127 | 1.4% |
| Cherokee | 20 | 0.2% |
| Choctaw | 22 | 0.2% |
| Cuban | 14 | 0.2% |
| Danish | 14 | 0.2% |
| Dominican | 16 | 0.2% |
| French | 16 | 0.2% |
| German | 20 | 0.2% |
| Guatemalan | 402 | 4.4% |
| Honduran | 31 | 0.3% |
| Indian (Asian) | 39 | 0.4% |
| Irish | 28 | 0.3% |
| Jamaican | 67 | 0.7% |
| Mexican | 2,722 | 29.8% |
| Mexican American Indian | 111 | 1.2% |
| Native Hawaiian | 14 | 0.2% |
| Nicaraguan | 121 | 1.3% |
| Nigerian | 171 | 1.9% |
| Panamanian | 35 | 0.4% |
| Portuguese | 16 | 0.2% |
| Puerto Rican | 64 | 0.7% |
| Russian | 11 | 0.1% |
| Salvadoran | 140 | 1.5% |
| Spaniard | 85 | 0.9% |
| Sri Lankan | 29 | 0.3% |
| Subsaharan African | 373 | 4.1% | View All 32 Rows |
Immigrants in West Athens
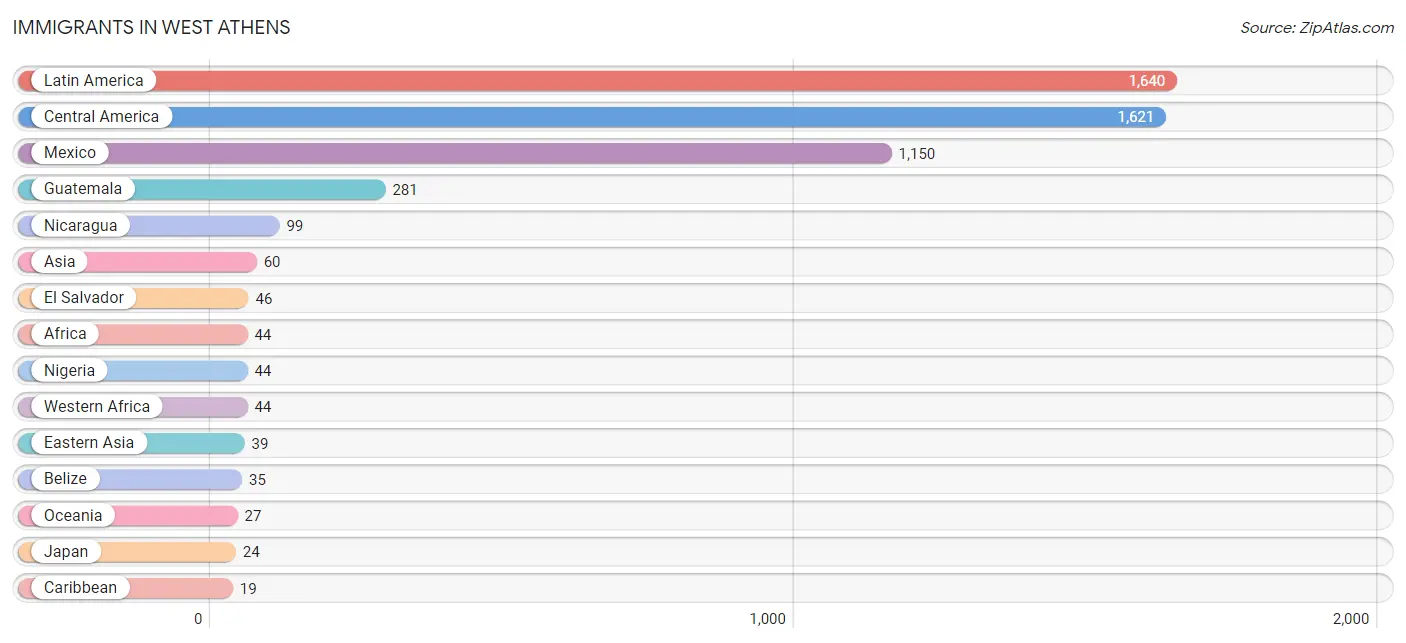
The most numerous immigrant groups reported in West Athens came from Latin America (1,640 | 18.0%), Central America (1,621 | 17.7%), Mexico (1,150 | 12.6%), Guatemala (281 | 3.1%), and Nicaragua (99 | 1.1%), together accounting for 52.5% of all West Athens residents.
| Immigration Origin | # Population | % Population |
| Afghanistan | 16 | 0.2% |
| Africa | 44 | 0.5% |
| Asia | 60 | 0.7% |
| Belize | 35 | 0.4% |
| Caribbean | 19 | 0.2% |
| Central America | 1,621 | 17.7% |
| China | 15 | 0.2% |
| Dominican Republic | 8 | 0.1% |
| Eastern Asia | 39 | 0.4% |
| El Salvador | 46 | 0.5% |
| England | 6 | 0.1% |
| Europe | 6 | 0.1% |
| Guatemala | 281 | 3.1% |
| Honduras | 10 | 0.1% |
| Jamaica | 11 | 0.1% |
| Japan | 24 | 0.3% |
| Latin America | 1,640 | 18.0% |
| Mexico | 1,150 | 12.6% |
| Nicaragua | 99 | 1.1% |
| Nigeria | 44 | 0.5% |
| Northern Europe | 6 | 0.1% |
| Oceania | 27 | 0.3% |
| South Central Asia | 16 | 0.2% |
| South Eastern Asia | 5 | 0.1% |
| Vietnam | 5 | 0.1% |
| Western Africa | 44 | 0.5% | View All 26 Rows |
Sex and Age in West Athens
Sex and Age in West Athens
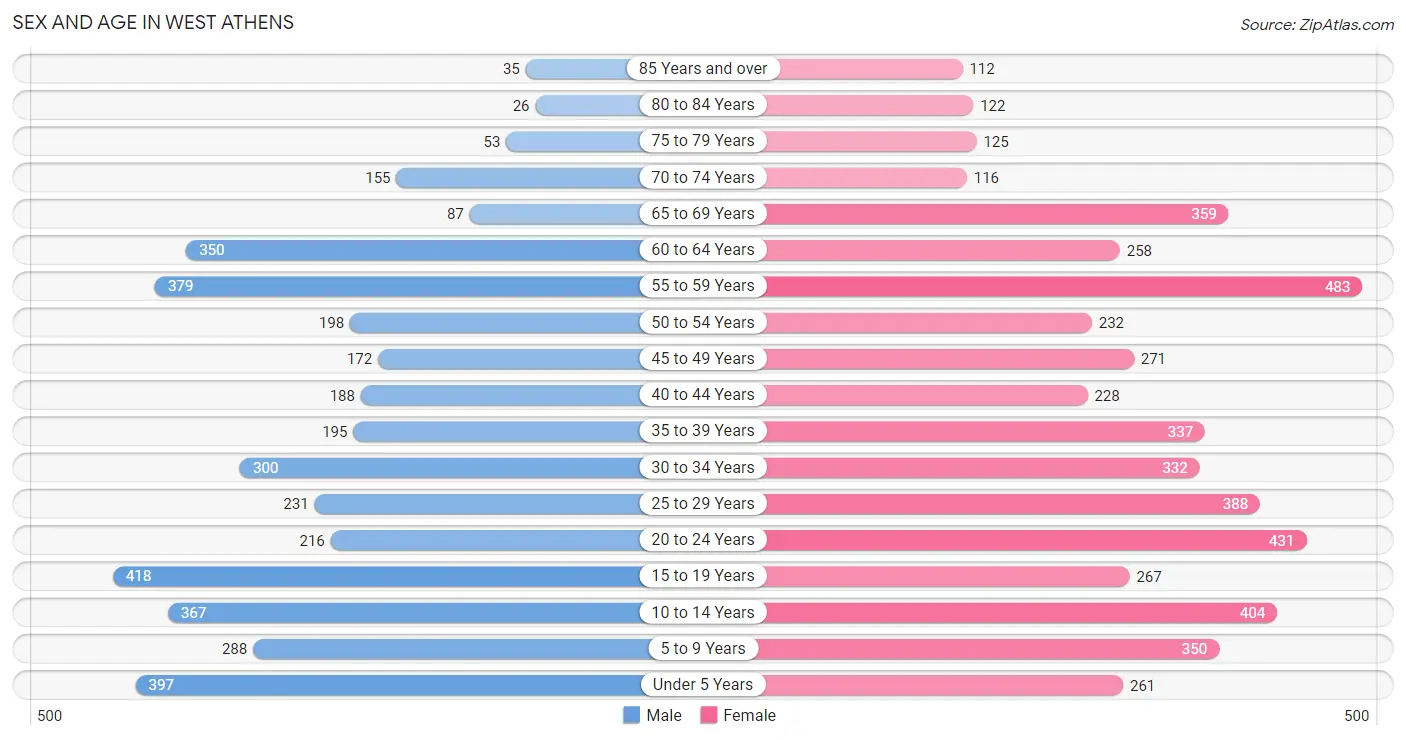
The most populous age groups in West Athens are 15 to 19 Years (418 | 10.3%) for men and 55 to 59 Years (483 | 9.5%) for women.
| Age Bracket | Male | Female |
| Under 5 Years | 397 (9.8%) | 261 (5.1%) |
| 5 to 9 Years | 288 (7.1%) | 350 (6.9%) |
| 10 to 14 Years | 367 (9.0%) | 404 (8.0%) |
| 15 to 19 Years | 418 (10.3%) | 267 (5.3%) |
| 20 to 24 Years | 216 (5.3%) | 431 (8.5%) |
| 25 to 29 Years | 231 (5.7%) | 388 (7.6%) |
| 30 to 34 Years | 300 (7.4%) | 332 (6.5%) |
| 35 to 39 Years | 195 (4.8%) | 337 (6.6%) |
| 40 to 44 Years | 188 (4.6%) | 228 (4.5%) |
| 45 to 49 Years | 172 (4.2%) | 271 (5.3%) |
| 50 to 54 Years | 198 (4.9%) | 232 (4.6%) |
| 55 to 59 Years | 379 (9.3%) | 483 (9.5%) |
| 60 to 64 Years | 350 (8.6%) | 258 (5.1%) |
| 65 to 69 Years | 87 (2.1%) | 359 (7.1%) |
| 70 to 74 Years | 155 (3.8%) | 116 (2.3%) |
| 75 to 79 Years | 53 (1.3%) | 125 (2.5%) |
| 80 to 84 Years | 26 (0.6%) | 122 (2.4%) |
| 85 Years and over | 35 (0.9%) | 112 (2.2%) |
| Total | 4,055 (100.0%) | 5,076 (100.0%) |
Families and Households in West Athens
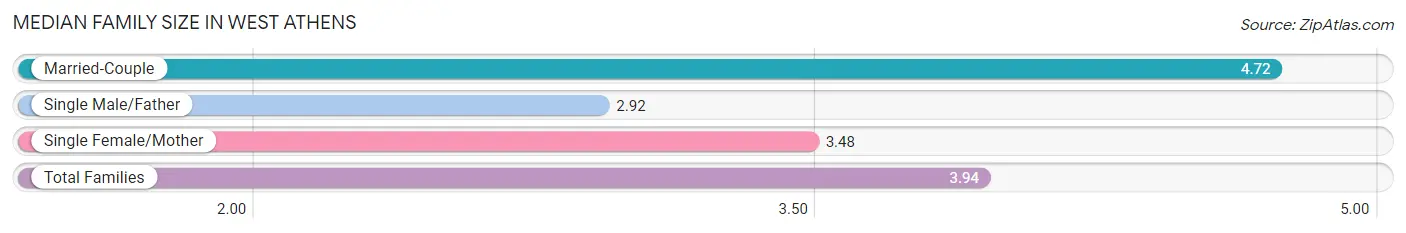
Median Family Size in West Athens
The median family size in West Athens is 3.94 persons per family, with married-couple families (874 | 42.4%) accounting for the largest median family size of 4.72 persons per family. On the other hand, single male/father families (244 | 11.8%) represent the smallest median family size with 2.92 persons per family.
| Family Type | # Families | Family Size |
| Married-Couple | 874 (42.4%) | 4.72 |
| Single Male/Father | 244 (11.8%) | 2.92 |
| Single Female/Mother | 943 (45.8%) | 3.48 |
| Total Families | 2,061 (100.0%) | 3.94 |
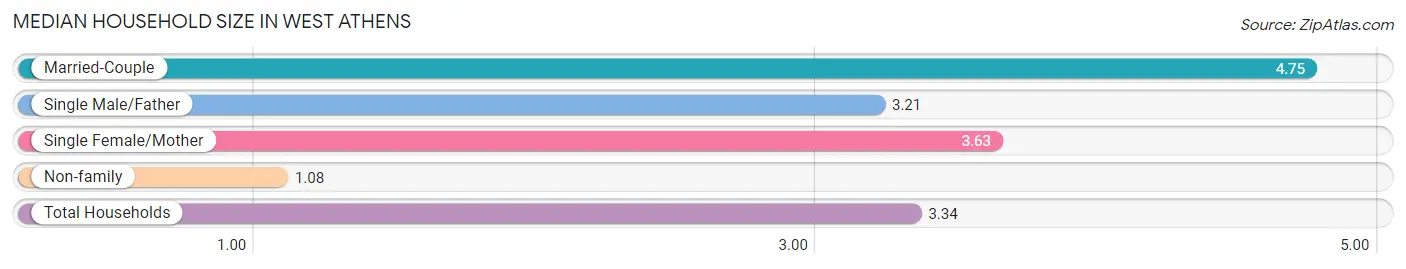
Median Household Size in West Athens
The median household size in West Athens is 3.34 persons per household, with married-couple households (874 | 32.1%) accounting for the largest median household size of 4.75 persons per household. non-family households (658 | 24.2%) represent the smallest median household size with 1.08 persons per household.
| Household Type | # Households | Household Size |
| Married-Couple | 874 (32.1%) | 4.75 |
| Single Male/Father | 244 (9.0%) | 3.21 |
| Single Female/Mother | 943 (34.7%) | 3.63 |
| Non-family | 658 (24.2%) | 1.08 |
| Total Households | 2,719 (100.0%) | 3.34 |
Household Size by Marriage Status in West Athens
Out of a total of 2,719 households in West Athens, 2,061 (75.8%) are family households, while 658 (24.2%) are nonfamily households. The most numerous type of family households are 2-person households, comprising 595, and the most common type of nonfamily households are 1-person households, comprising 621.
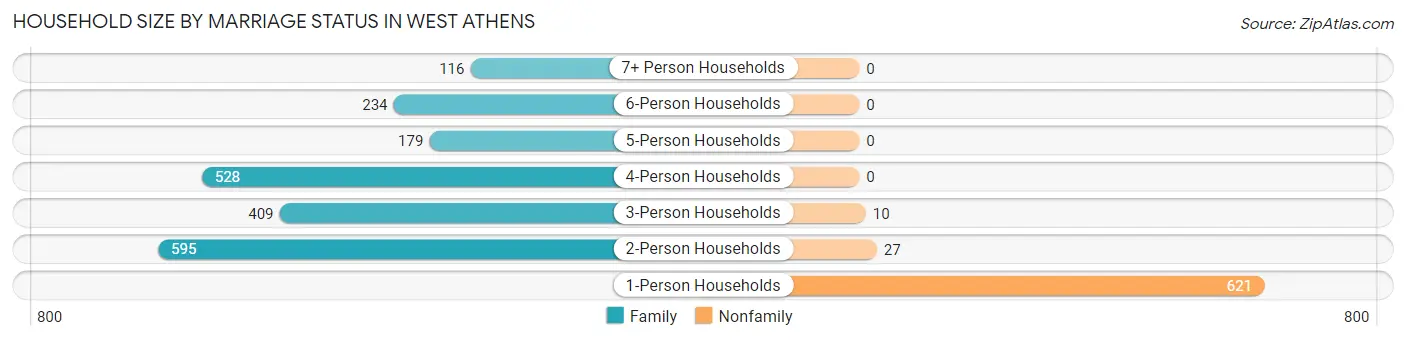
| Household Size | Family Households | Nonfamily Households |
| 1-Person Households | - | 621 (22.8%) |
| 2-Person Households | 595 (21.9%) | 27 (1.0%) |
| 3-Person Households | 409 (15.0%) | 10 (0.4%) |
| 4-Person Households | 528 (19.4%) | 0 (0.0%) |
| 5-Person Households | 179 (6.6%) | 0 (0.0%) |
| 6-Person Households | 234 (8.6%) | 0 (0.0%) |
| 7+ Person Households | 116 (4.3%) | 0 (0.0%) |
| Total | 2,061 (75.8%) | 658 (24.2%) |
Female Fertility in West Athens
Fertility by Age in West Athens
Average fertility rate in West Athens is 23.0 births per 1,000 women. Women in the age bracket of 35 to 50 years have the highest fertility rate with 41.0 births per 1,000 women. Women in the age bracket of 35 to 50 years acount for 67.9% of all women with births.
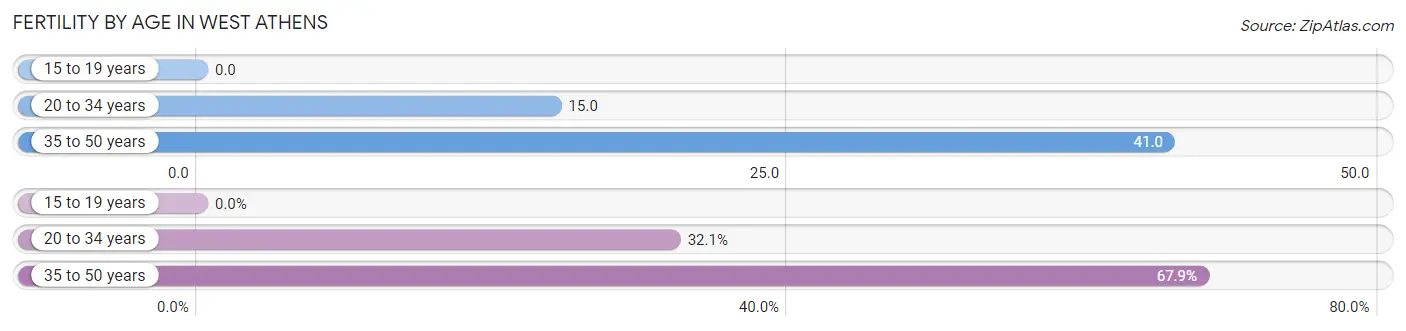
| Age Bracket | Women with Births | Births / 1,000 Women |
| 15 to 19 years | 0 (0.0%) | 0.0 |
| 20 to 34 years | 17 (32.1%) | 15.0 |
| 35 to 50 years | 36 (67.9%) | 41.0 |
| Total | 53 (100.0%) | 23.0 |
Fertility by Age by Marriage Status in West Athens
32.1% of women with births (53) in West Athens are married. The highest percentage of unmarried women with births falls into 35 to 50 years age bracket with 100.0% of them unmarried at the time of birth, while the lowest percentage of unmarried women with births belong to 20 to 34 years age bracket with 0.0% of them unmarried.
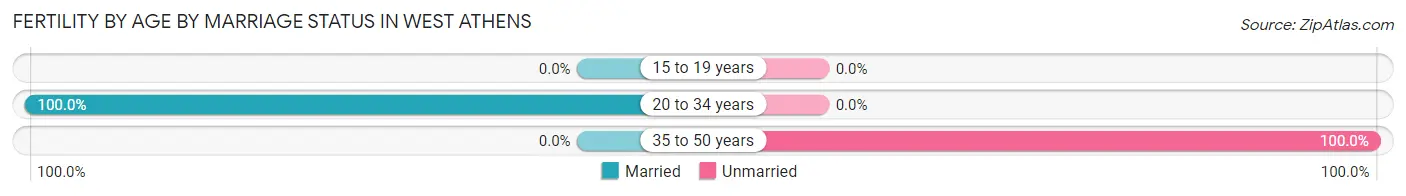
| Age Bracket | Married | Unmarried |
| 15 to 19 years | 0 (0.0%) | 0 (0.0%) |
| 20 to 34 years | 17 (100.0%) | 0 (0.0%) |
| 35 to 50 years | 0 (0.0%) | 36 (100.0%) |
| Total | 17 (32.1%) | 36 (67.9%) |
Fertility by Education in West Athens
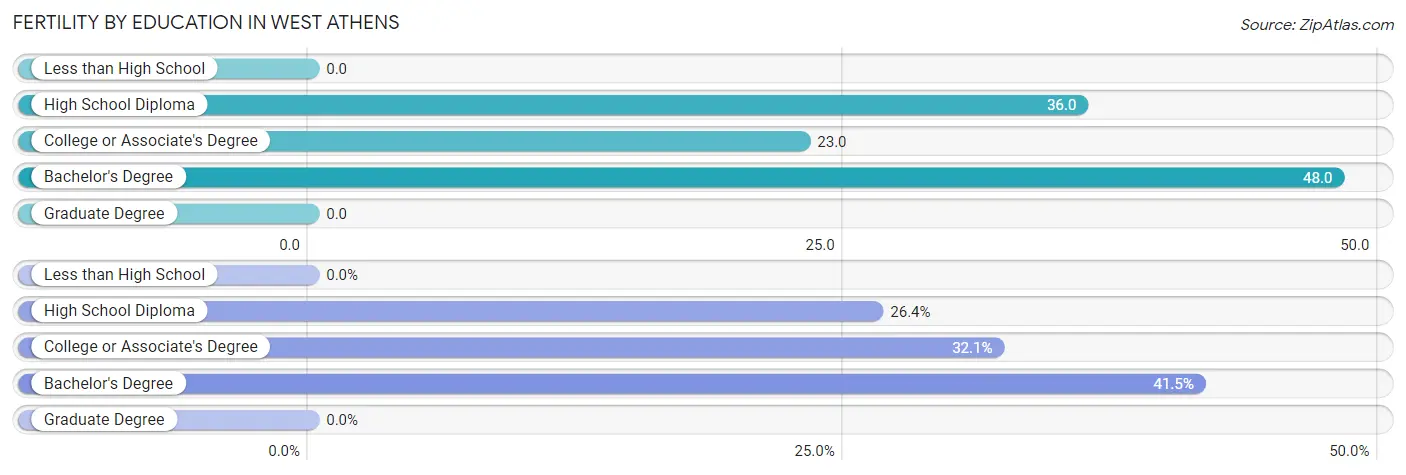
| Educational Attainment | Women with Births | Births / 1,000 Women |
| Less than High School | 0 (0.0%) | 0.0 |
| High School Diploma | 14 (26.4%) | 36.0 |
| College or Associate's Degree | 17 (32.1%) | 23.0 |
| Bachelor's Degree | 22 (41.5%) | 48.0 |
| Graduate Degree | 0 (0.0%) | 0.0 |
| Total | 53 (100.0%) | 23.0 |
Fertility by Education by Marriage Status in West Athens
67.9% of women with births in West Athens are unmarried. Women with the educational attainment of college or associate's degree are most likely to be married with 100.0% of them married at childbirth, while women with the educational attainment of high school diploma are least likely to be married with 100.0% of them unmarried at childbirth.
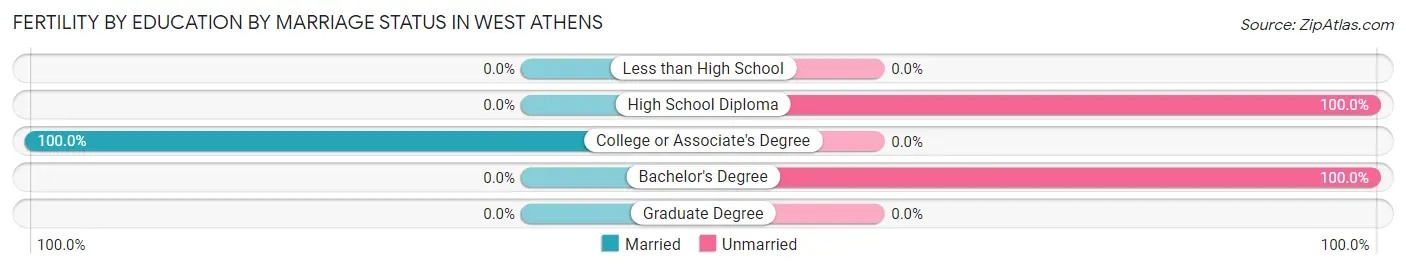
| Educational Attainment | Married | Unmarried |
| Less than High School | 0 (0.0%) | 0 (0.0%) |
| High School Diploma | 0 (0.0%) | 14 (100.0%) |
| College or Associate's Degree | 17 (100.0%) | 0 (0.0%) |
| Bachelor's Degree | 0 (0.0%) | 22 (100.0%) |
| Graduate Degree | 0 (0.0%) | 0 (0.0%) |
| Total | 17 (32.1%) | 36 (67.9%) |
Employment Characteristics in West Athens
Employment by Class of Employer in West Athens
Among the 3,843 employed individuals in West Athens, private company employees (2,541 | 66.1%), local government employees (484 | 12.6%), and not-for-profit organizations (285 | 7.4%) make up the most common classes of employment.
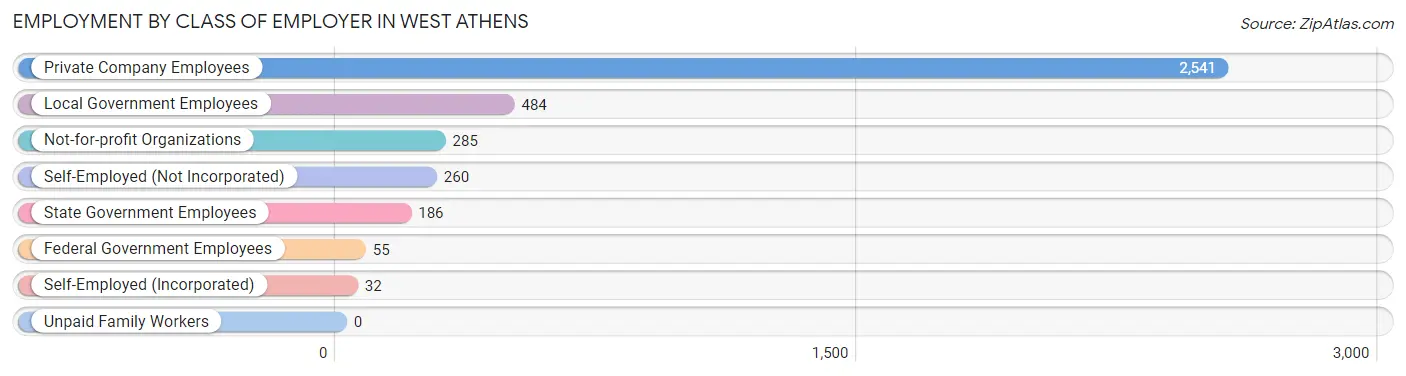
| Employer Class | # Employees | % Employees |
| Private Company Employees | 2,541 | 66.1% |
| Self-Employed (Incorporated) | 32 | 0.8% |
| Self-Employed (Not Incorporated) | 260 | 6.8% |
| Not-for-profit Organizations | 285 | 7.4% |
| Local Government Employees | 484 | 12.6% |
| State Government Employees | 186 | 4.8% |
| Federal Government Employees | 55 | 1.4% |
| Unpaid Family Workers | 0 | 0.0% |
| Total | 3,843 | 100.0% |
Employment Status by Age in West Athens
According to the labor force statistics for West Athens, out of the total population over 16 years of age (6,946), 65.8% or 4,570 individuals are in the labor force, with 11.6% or 530 of them unemployed. The age group with the highest labor force participation rate is 30 to 34 years, with 98.3% or 621 individuals in the labor force. Within the labor force, the 16 to 19 years age range has the highest percentage of unemployed individuals, with 45.4% or 83 of them being unemployed.
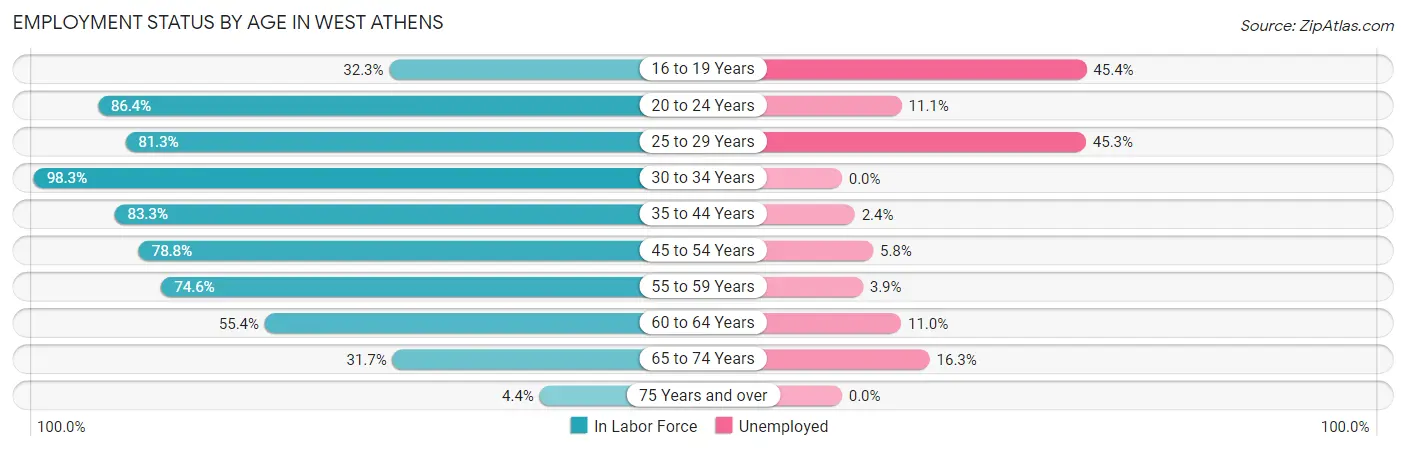
| Age Bracket | In Labor Force | Unemployed |
| 16 to 19 Years | 183 (32.3%) | 83 (45.4%) |
| 20 to 24 Years | 559 (86.4%) | 62 (11.1%) |
| 25 to 29 Years | 503 (81.3%) | 228 (45.3%) |
| 30 to 34 Years | 621 (98.3%) | 0 (0.0%) |
| 35 to 44 Years | 790 (83.3%) | 19 (2.4%) |
| 45 to 54 Years | 688 (78.8%) | 40 (5.8%) |
| 55 to 59 Years | 643 (74.6%) | 25 (3.9%) |
| 60 to 64 Years | 337 (55.4%) | 37 (11.0%) |
| 65 to 74 Years | 227 (31.7%) | 37 (16.3%) |
| 75 Years and over | 21 (4.4%) | 0 (0.0%) |
| Total | 4,570 (65.8%) | 530 (11.6%) |
Employment Status by Educational Attainment in West Athens
According to labor force statistics for West Athens, 78.9% of individuals (3,584) out of the total population between 25 and 64 years of age (4,542) are in the labor force, with 9.7% or 348 of them being unemployed. The group with the highest labor force participation rate are those with the educational attainment of bachelor's degree or higher, with 94.9% or 927 individuals in the labor force. Within the labor force, individuals with bachelor's degree or higher education have the highest percentage of unemployment, with 14.8% or 137 of them being unemployed.
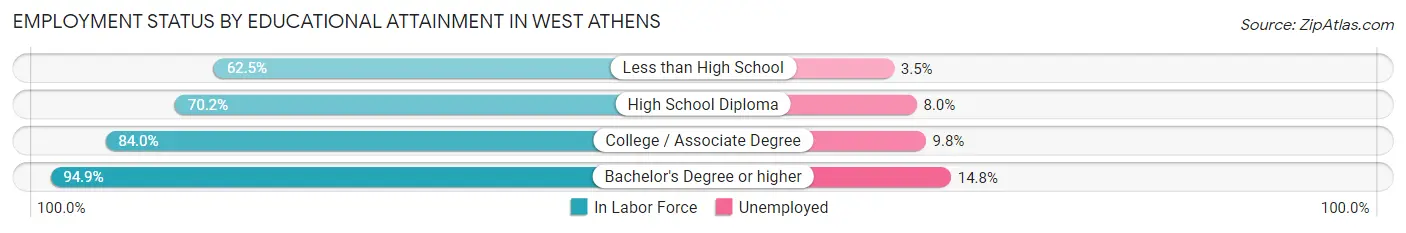
| Educational Attainment | In Labor Force | Unemployed |
| Less than High School | 545 (62.5%) | 31 (3.5%) |
| High School Diploma | 778 (70.2%) | 89 (8.0%) |
| College / Associate Degree | 1,331 (84.0%) | 155 (9.8%) |
| Bachelor's Degree or higher | 927 (94.9%) | 145 (14.8%) |
| Total | 3,584 (78.9%) | 441 (9.7%) |
Employment Occupations by Sex in West Athens
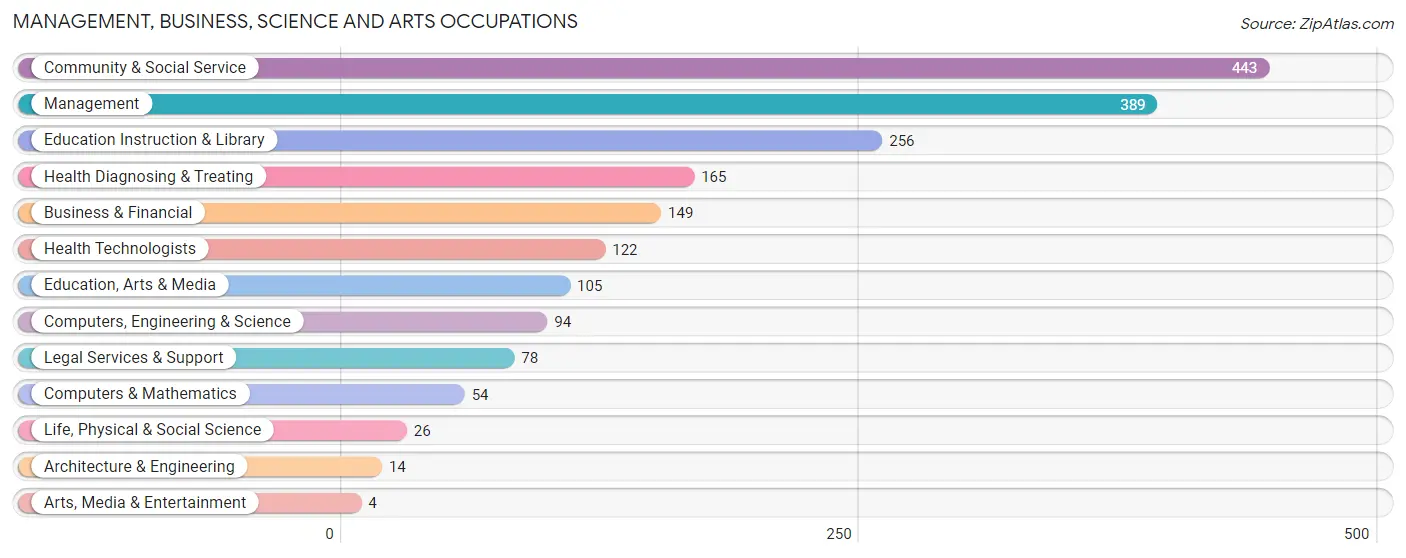
Management, Business, Science and Arts Occupations
The most common Management, Business, Science and Arts occupations in West Athens are Community & Social Service (443 | 11.0%), Management (389 | 9.6%), Education Instruction & Library (256 | 6.3%), Health Diagnosing & Treating (165 | 4.1%), and Business & Financial (149 | 3.7%).
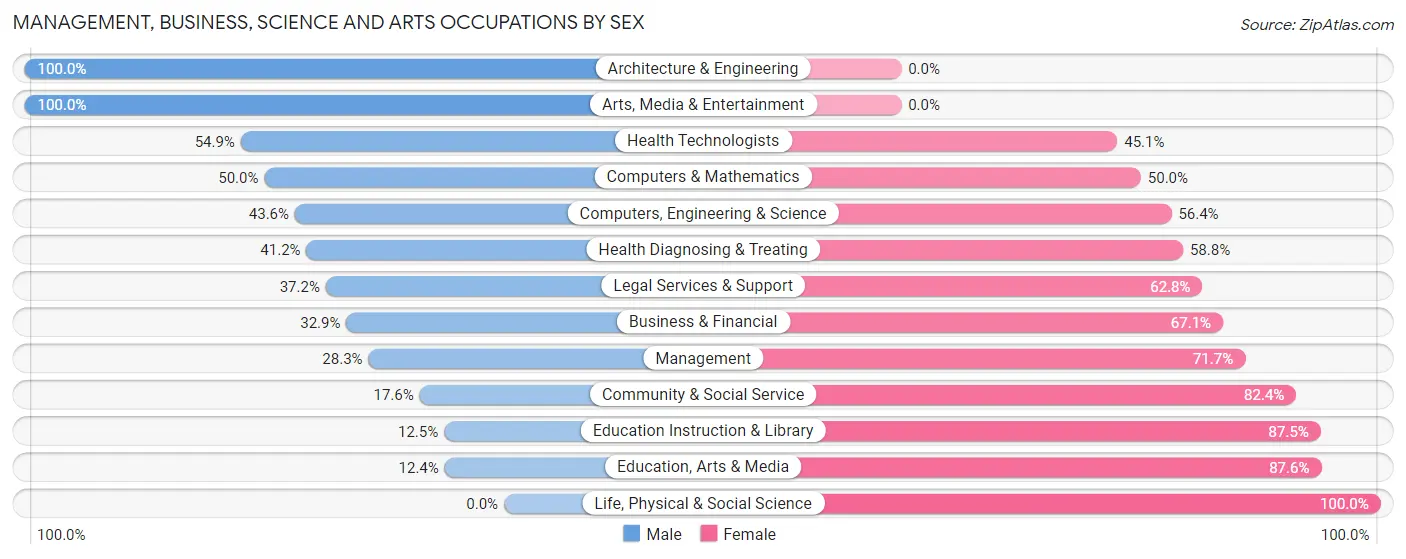
Management, Business, Science and Arts Occupations by Sex
Within the Management, Business, Science and Arts occupations in West Athens, the most male-oriented occupations are Architecture & Engineering (100.0%), Arts, Media & Entertainment (100.0%), and Health Technologists (54.9%), while the most female-oriented occupations are Life, Physical & Social Science (100.0%), Education, Arts & Media (87.6%), and Education Instruction & Library (87.5%).
| Occupation | Male | Female |
| Management | 110 (28.3%) | 279 (71.7%) |
| Business & Financial | 49 (32.9%) | 100 (67.1%) |
| Computers, Engineering & Science | 41 (43.6%) | 53 (56.4%) |
| Computers & Mathematics | 27 (50.0%) | 27 (50.0%) |
| Architecture & Engineering | 14 (100.0%) | 0 (0.0%) |
| Life, Physical & Social Science | 0 (0.0%) | 26 (100.0%) |
| Community & Social Service | 78 (17.6%) | 365 (82.4%) |
| Education, Arts & Media | 13 (12.4%) | 92 (87.6%) |
| Legal Services & Support | 29 (37.2%) | 49 (62.8%) |
| Education Instruction & Library | 32 (12.5%) | 224 (87.5%) |
| Arts, Media & Entertainment | 4 (100.0%) | 0 (0.0%) |
| Health Diagnosing & Treating | 68 (41.2%) | 97 (58.8%) |
| Health Technologists | 67 (54.9%) | 55 (45.1%) |
| Total (Category) | 346 (27.9%) | 894 (72.1%) |
| Total (Overall) | 1,609 (39.8%) | 2,432 (60.2%) |
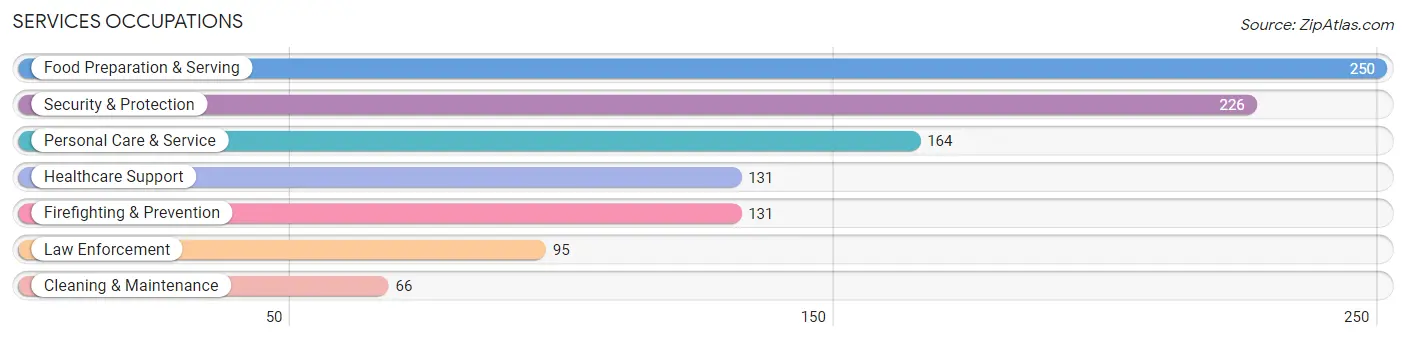
Services Occupations
The most common Services occupations in West Athens are Food Preparation & Serving (250 | 6.2%), Security & Protection (226 | 5.6%), Personal Care & Service (164 | 4.1%), Healthcare Support (131 | 3.2%), and Firefighting & Prevention (131 | 3.2%).
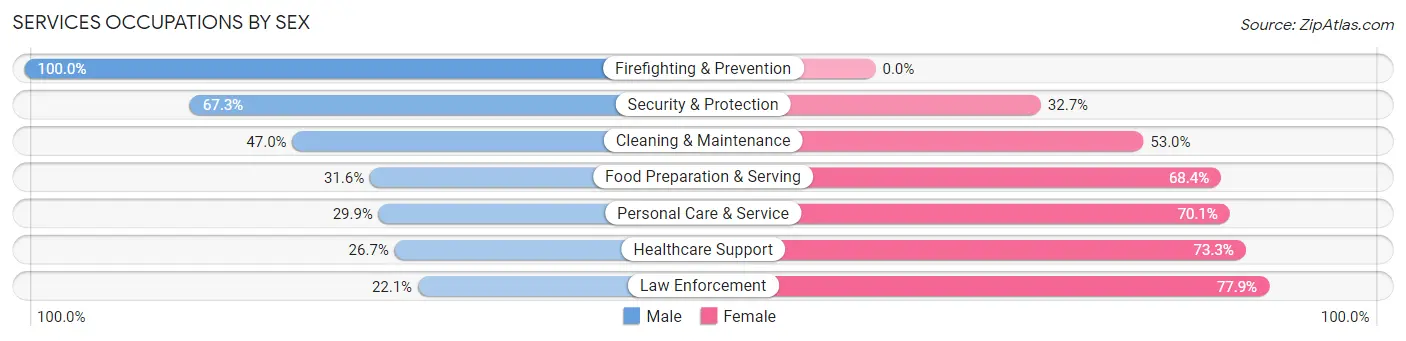
Services Occupations by Sex
Within the Services occupations in West Athens, the most male-oriented occupations are Firefighting & Prevention (100.0%), Security & Protection (67.3%), and Cleaning & Maintenance (47.0%), while the most female-oriented occupations are Law Enforcement (77.9%), Healthcare Support (73.3%), and Personal Care & Service (70.1%).
| Occupation | Male | Female |
| Healthcare Support | 35 (26.7%) | 96 (73.3%) |
| Security & Protection | 152 (67.3%) | 74 (32.7%) |
| Firefighting & Prevention | 131 (100.0%) | 0 (0.0%) |
| Law Enforcement | 21 (22.1%) | 74 (77.9%) |
| Food Preparation & Serving | 79 (31.6%) | 171 (68.4%) |
| Cleaning & Maintenance | 31 (47.0%) | 35 (53.0%) |
| Personal Care & Service | 49 (29.9%) | 115 (70.1%) |
| Total (Category) | 346 (41.3%) | 491 (58.7%) |
| Total (Overall) | 1,609 (39.8%) | 2,432 (60.2%) |
Sales and Office Occupations
The most common Sales and Office occupations in West Athens are Sales & Related (497 | 12.3%), and Office & Administration (489 | 12.1%).
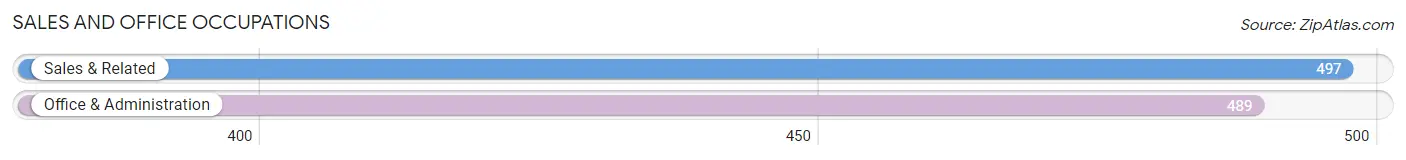
Sales and Office Occupations by Sex
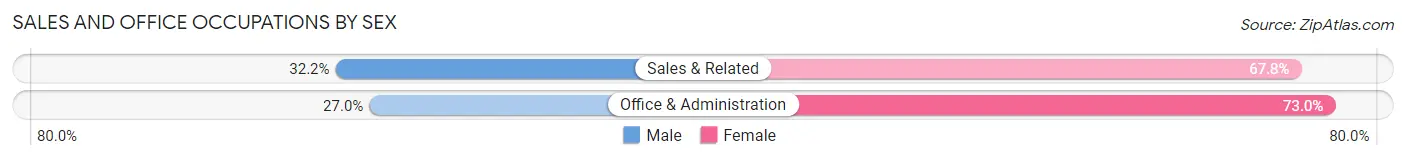
| Occupation | Male | Female |
| Sales & Related | 160 (32.2%) | 337 (67.8%) |
| Office & Administration | 132 (27.0%) | 357 (73.0%) |
| Total (Category) | 292 (29.6%) | 694 (70.4%) |
| Total (Overall) | 1,609 (39.8%) | 2,432 (60.2%) |
Natural Resources, Construction and Maintenance Occupations
The most common Natural Resources, Construction and Maintenance occupations in West Athens are Construction & Extraction (172 | 4.3%), Installation, Maintenance & Repair (69 | 1.7%), and Farming, Fishing & Forestry (17 | 0.4%).
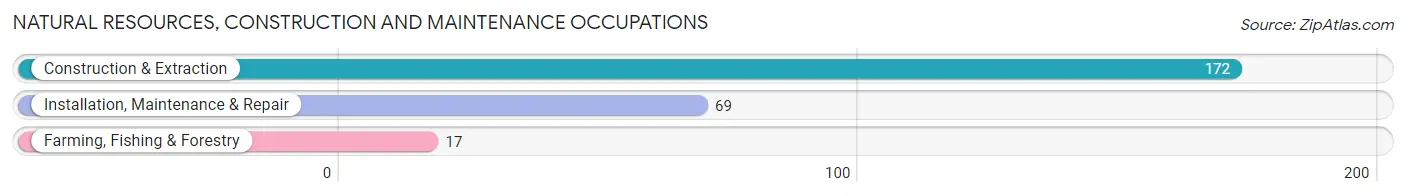
Natural Resources, Construction and Maintenance Occupations by Sex
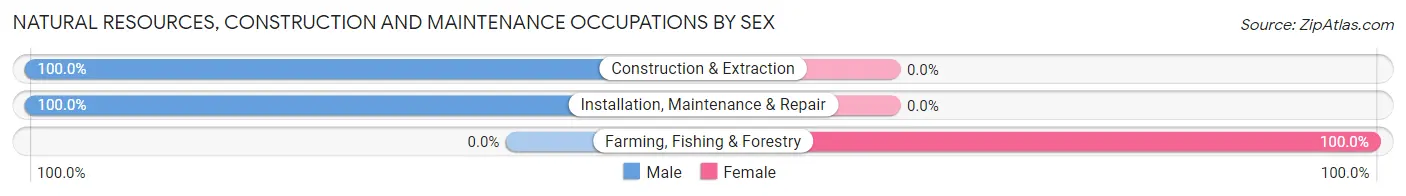
| Occupation | Male | Female |
| Farming, Fishing & Forestry | 0 (0.0%) | 17 (100.0%) |
| Construction & Extraction | 172 (100.0%) | 0 (0.0%) |
| Installation, Maintenance & Repair | 69 (100.0%) | 0 (0.0%) |
| Total (Category) | 241 (93.4%) | 17 (6.6%) |
| Total (Overall) | 1,609 (39.8%) | 2,432 (60.2%) |
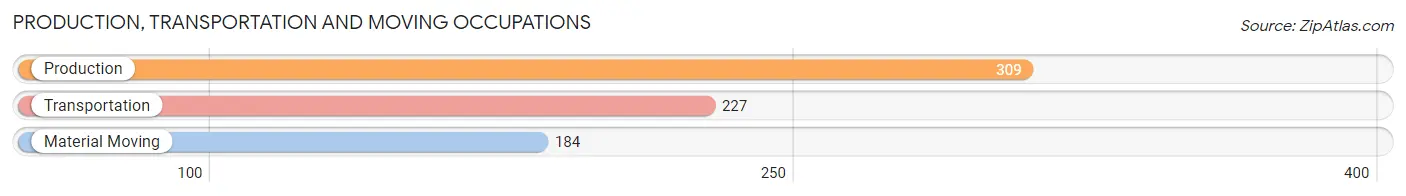
Production, Transportation and Moving Occupations
The most common Production, Transportation and Moving occupations in West Athens are Production (309 | 7.6%), Transportation (227 | 5.6%), and Material Moving (184 | 4.5%).
Production, Transportation and Moving Occupations by Sex
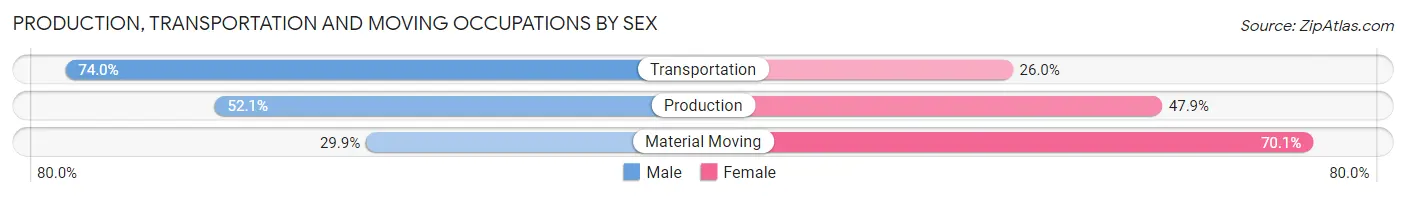
| Occupation | Male | Female |
| Production | 161 (52.1%) | 148 (47.9%) |
| Transportation | 168 (74.0%) | 59 (26.0%) |
| Material Moving | 55 (29.9%) | 129 (70.1%) |
| Total (Category) | 384 (53.3%) | 336 (46.7%) |
| Total (Overall) | 1,609 (39.8%) | 2,432 (60.2%) |
Employment Industries by Sex in West Athens
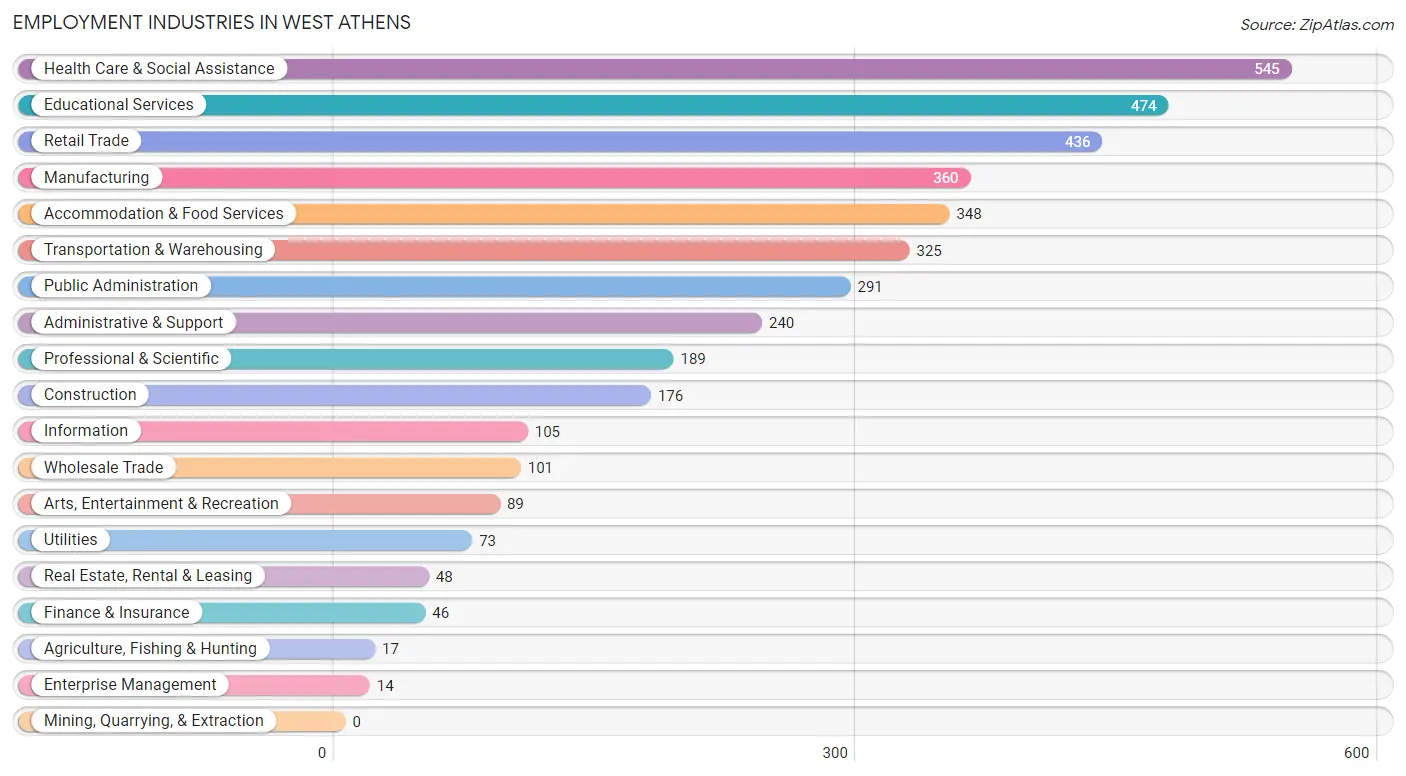
Employment Industries in West Athens
The major employment industries in West Athens include Health Care & Social Assistance (545 | 13.5%), Educational Services (474 | 11.7%), Retail Trade (436 | 10.8%), Manufacturing (360 | 8.9%), and Accommodation & Food Services (348 | 8.6%).
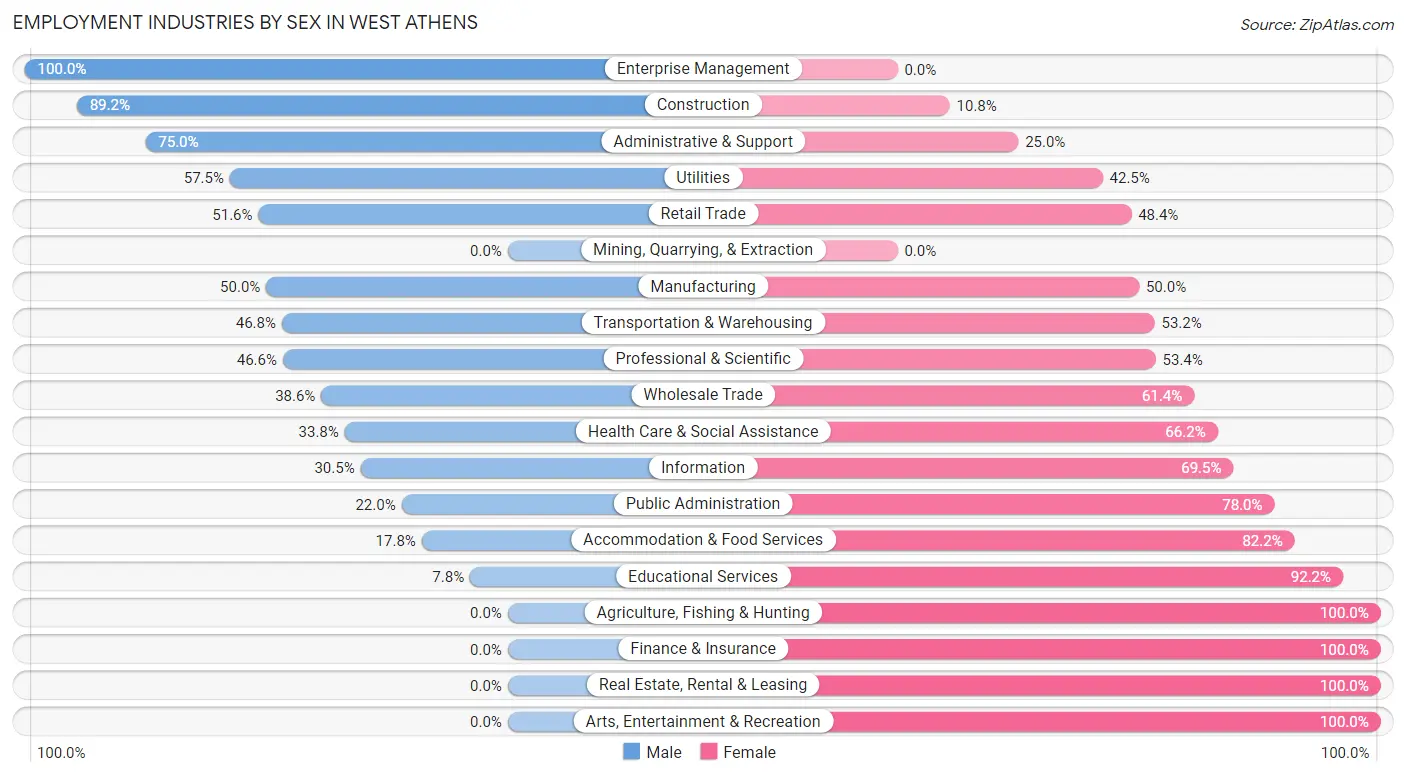
Employment Industries by Sex in West Athens
The West Athens industries that see more men than women are Enterprise Management (100.0%), Construction (89.2%), and Administrative & Support (75.0%), whereas the industries that tend to have a higher number of women are Agriculture, Fishing & Hunting (100.0%), Finance & Insurance (100.0%), and Real Estate, Rental & Leasing (100.0%).
| Industry | Male | Female |
| Agriculture, Fishing & Hunting | 0 (0.0%) | 17 (100.0%) |
| Mining, Quarrying, & Extraction | 0 (0.0%) | 0 (0.0%) |
| Construction | 157 (89.2%) | 19 (10.8%) |
| Manufacturing | 180 (50.0%) | 180 (50.0%) |
| Wholesale Trade | 39 (38.6%) | 62 (61.4%) |
| Retail Trade | 225 (51.6%) | 211 (48.4%) |
| Transportation & Warehousing | 152 (46.8%) | 173 (53.2%) |
| Utilities | 42 (57.5%) | 31 (42.5%) |
| Information | 32 (30.5%) | 73 (69.5%) |
| Finance & Insurance | 0 (0.0%) | 46 (100.0%) |
| Real Estate, Rental & Leasing | 0 (0.0%) | 48 (100.0%) |
| Professional & Scientific | 88 (46.6%) | 101 (53.4%) |
| Enterprise Management | 14 (100.0%) | 0 (0.0%) |
| Administrative & Support | 180 (75.0%) | 60 (25.0%) |
| Educational Services | 37 (7.8%) | 437 (92.2%) |
| Health Care & Social Assistance | 184 (33.8%) | 361 (66.2%) |
| Arts, Entertainment & Recreation | 0 (0.0%) | 89 (100.0%) |
| Accommodation & Food Services | 62 (17.8%) | 286 (82.2%) |
| Public Administration | 64 (22.0%) | 227 (78.0%) |
| Total | 1,609 (39.8%) | 2,432 (60.2%) |
Education in West Athens
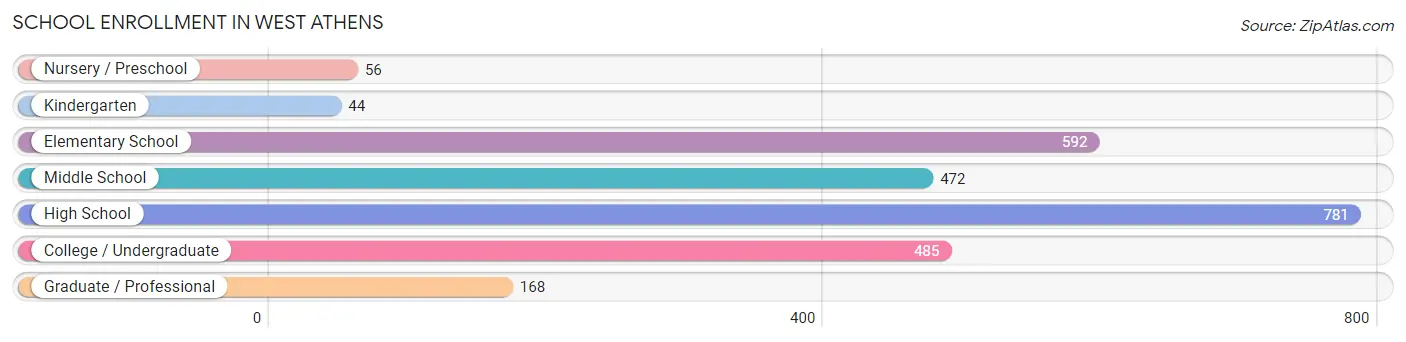
School Enrollment in West Athens
The most common levels of schooling among the 2,598 students in West Athens are high school (781 | 30.1%), elementary school (592 | 22.8%), and college / undergraduate (485 | 18.7%).
| School Level | # Students | % Students |
| Nursery / Preschool | 56 | 2.2% |
| Kindergarten | 44 | 1.7% |
| Elementary School | 592 | 22.8% |
| Middle School | 472 | 18.2% |
| High School | 781 | 30.1% |
| College / Undergraduate | 485 | 18.7% |
| Graduate / Professional | 168 | 6.5% |
| Total | 2,598 | 100.0% |
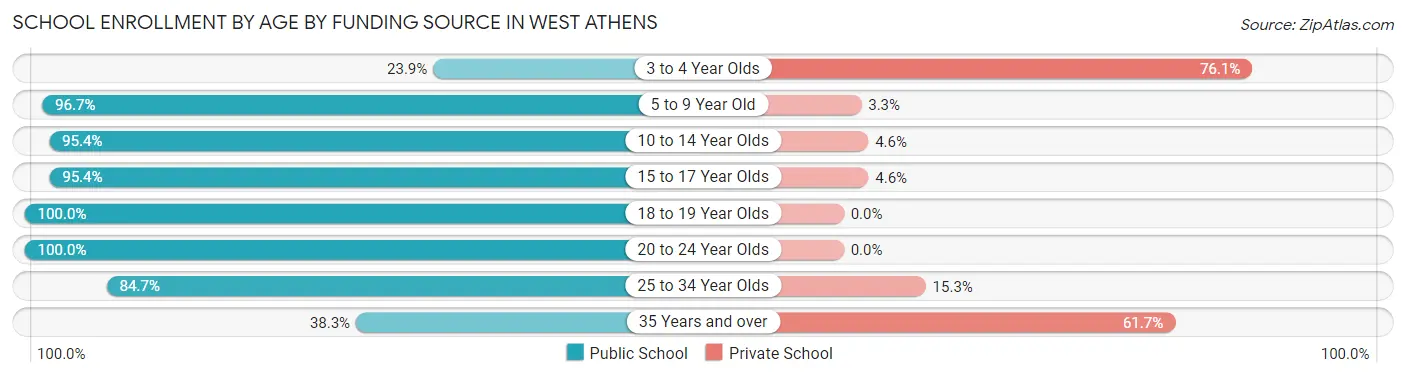
School Enrollment by Age by Funding Source in West Athens
Out of a total of 2,598 students who are enrolled in schools in West Athens, 286 (11.0%) attend a private institution, while the remaining 2,312 (89.0%) are enrolled in public schools. The age group of 3 to 4 year olds has the highest likelihood of being enrolled in private schools, with 35 (76.1% in the age bracket) enrolled. Conversely, the age group of 18 to 19 year olds has the lowest likelihood of being enrolled in a private school, with 126 (100.0% in the age bracket) attending a public institution.
| Age Bracket | Public School | Private School |
| 3 to 4 Year Olds | 11 (23.9%) | 35 (76.1%) |
| 5 to 9 Year Old | 589 (96.7%) | 20 (3.3%) |
| 10 to 14 Year Olds | 667 (95.4%) | 32 (4.6%) |
| 15 to 17 Year Olds | 456 (95.4%) | 22 (4.6%) |
| 18 to 19 Year Olds | 126 (100.0%) | 0 (0.0%) |
| 20 to 24 Year Olds | 253 (100.0%) | 0 (0.0%) |
| 25 to 34 Year Olds | 111 (84.7%) | 20 (15.3%) |
| 35 Years and over | 98 (38.3%) | 158 (61.7%) |
| Total | 2,312 (89.0%) | 286 (11.0%) |
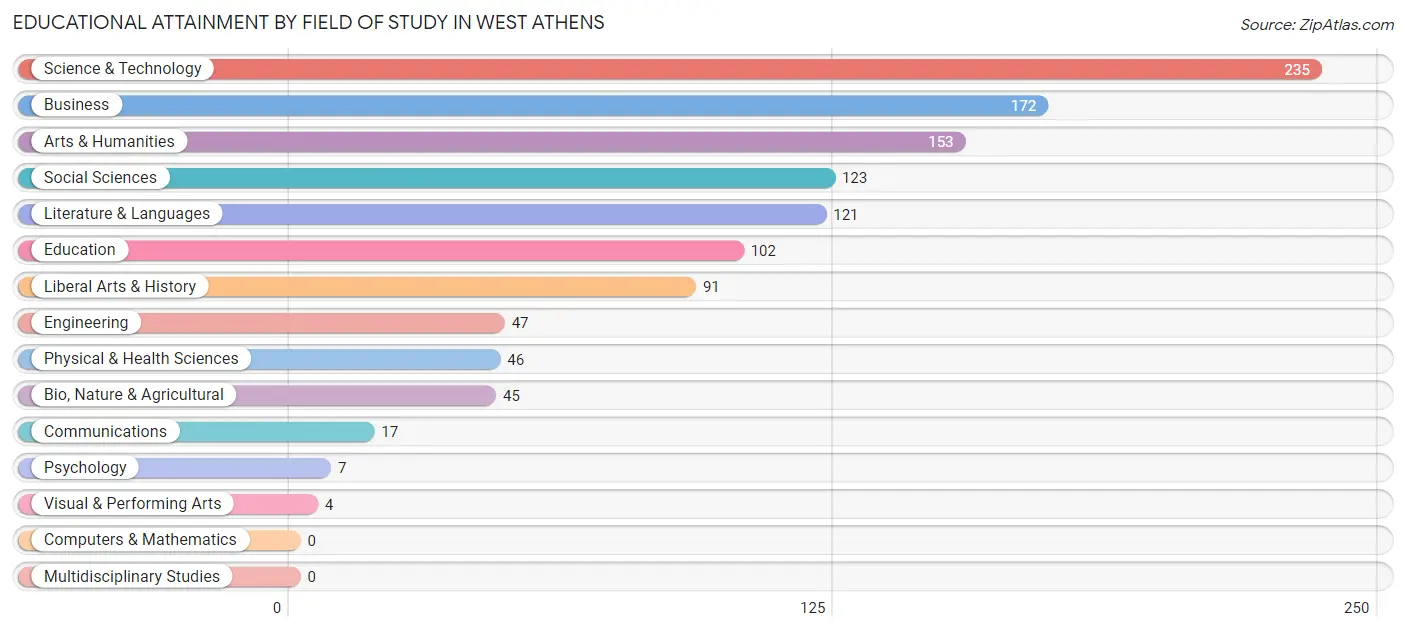
Educational Attainment by Field of Study in West Athens
Science & technology (235 | 20.2%), business (172 | 14.8%), arts & humanities (153 | 13.2%), social sciences (123 | 10.6%), and literature & languages (121 | 10.4%) are the most common fields of study among 1,163 individuals in West Athens who have obtained a bachelor's degree or higher.
| Field of Study | # Graduates | % Graduates |
| Computers & Mathematics | 0 | 0.0% |
| Bio, Nature & Agricultural | 45 | 3.9% |
| Physical & Health Sciences | 46 | 4.0% |
| Psychology | 7 | 0.6% |
| Social Sciences | 123 | 10.6% |
| Engineering | 47 | 4.0% |
| Multidisciplinary Studies | 0 | 0.0% |
| Science & Technology | 235 | 20.2% |
| Business | 172 | 14.8% |
| Education | 102 | 8.8% |
| Literature & Languages | 121 | 10.4% |
| Liberal Arts & History | 91 | 7.8% |
| Visual & Performing Arts | 4 | 0.3% |
| Communications | 17 | 1.5% |
| Arts & Humanities | 153 | 13.2% |
| Total | 1,163 | 100.0% |
Transportation & Commute in West Athens
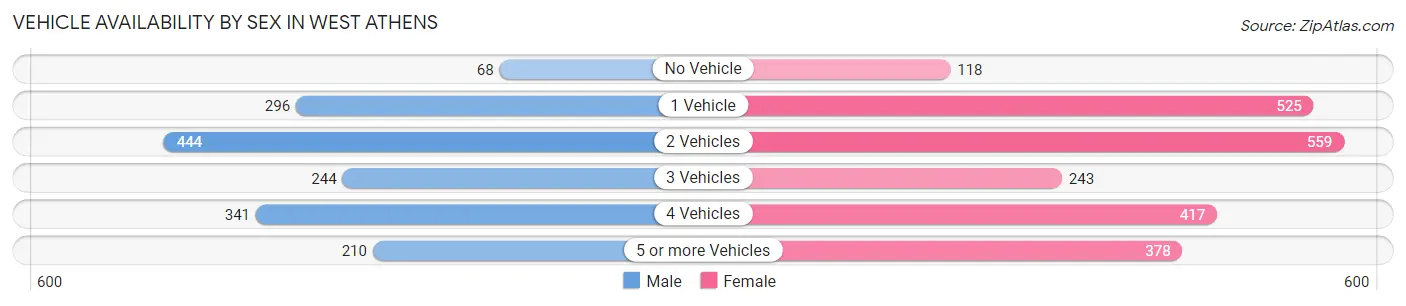
Vehicle Availability by Sex in West Athens
The most prevalent vehicle ownership categories in West Athens are males with 2 vehicles (444, accounting for 27.7%) and females with 2 vehicles (559, making up 19.8%).
| Vehicles Available | Male | Female |
| No Vehicle | 68 (4.2%) | 118 (5.3%) |
| 1 Vehicle | 296 (18.5%) | 525 (23.4%) |
| 2 Vehicles | 444 (27.7%) | 559 (25.0%) |
| 3 Vehicles | 244 (15.2%) | 243 (10.8%) |
| 4 Vehicles | 341 (21.3%) | 417 (18.6%) |
| 5 or more Vehicles | 210 (13.1%) | 378 (16.9%) |
| Total | 1,603 (100.0%) | 2,240 (100.0%) |
Commute Time in West Athens
The most frequently occuring commute durations in West Athens are 30 to 34 minutes (640 commuters, 18.7%), 20 to 24 minutes (612 commuters, 17.9%), and 10 to 14 minutes (386 commuters, 11.3%).
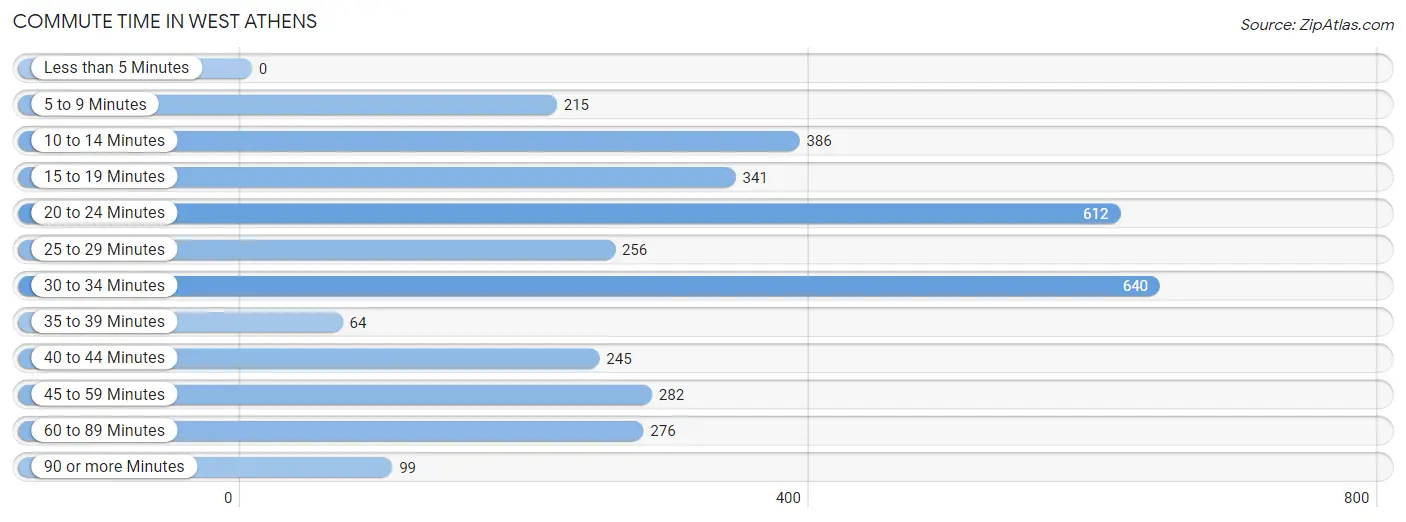
| Commute Time | # Commuters | % Commuters |
| Less than 5 Minutes | 0 | 0.0% |
| 5 to 9 Minutes | 215 | 6.3% |
| 10 to 14 Minutes | 386 | 11.3% |
| 15 to 19 Minutes | 341 | 10.0% |
| 20 to 24 Minutes | 612 | 17.9% |
| 25 to 29 Minutes | 256 | 7.5% |
| 30 to 34 Minutes | 640 | 18.7% |
| 35 to 39 Minutes | 64 | 1.9% |
| 40 to 44 Minutes | 245 | 7.2% |
| 45 to 59 Minutes | 282 | 8.3% |
| 60 to 89 Minutes | 276 | 8.1% |
| 90 or more Minutes | 99 | 2.9% |
Commute Time by Sex in West Athens
The most common commute times in West Athens are 30 to 34 minutes (439 commuters, 28.1%) for males and 20 to 24 minutes (366 commuters, 19.7%) for females.
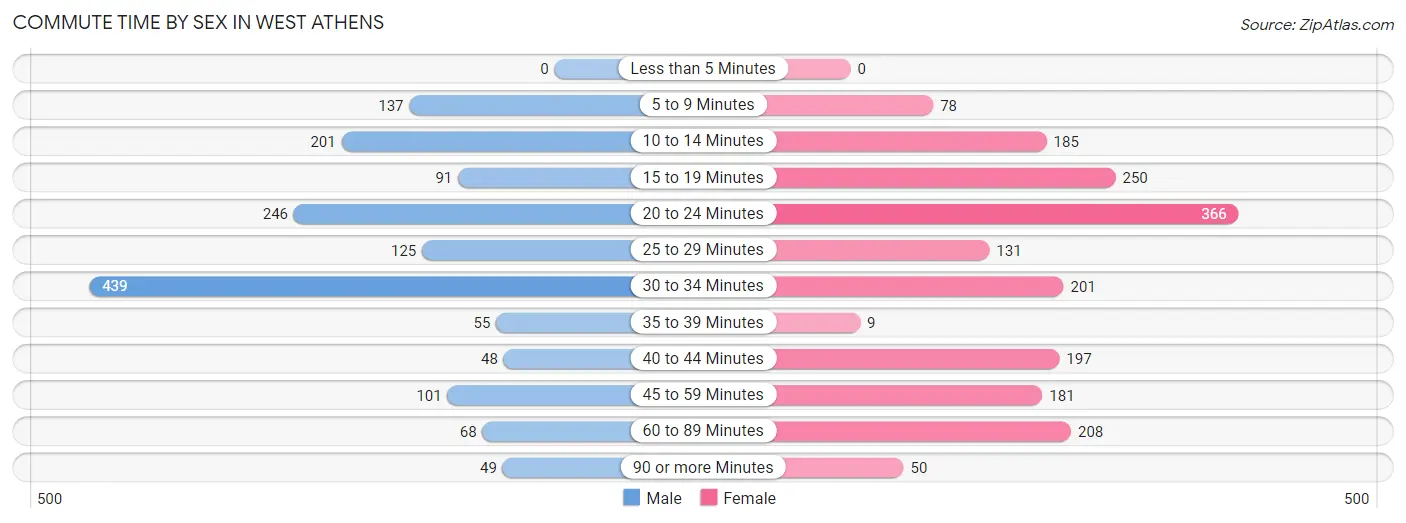
| Commute Time | Male | Female |
| Less than 5 Minutes | 0 (0.0%) | 0 (0.0%) |
| 5 to 9 Minutes | 137 (8.8%) | 78 (4.2%) |
| 10 to 14 Minutes | 201 (12.9%) | 185 (10.0%) |
| 15 to 19 Minutes | 91 (5.8%) | 250 (13.5%) |
| 20 to 24 Minutes | 246 (15.8%) | 366 (19.7%) |
| 25 to 29 Minutes | 125 (8.0%) | 131 (7.1%) |
| 30 to 34 Minutes | 439 (28.1%) | 201 (10.8%) |
| 35 to 39 Minutes | 55 (3.5%) | 9 (0.5%) |
| 40 to 44 Minutes | 48 (3.1%) | 197 (10.6%) |
| 45 to 59 Minutes | 101 (6.5%) | 181 (9.8%) |
| 60 to 89 Minutes | 68 (4.4%) | 208 (11.2%) |
| 90 or more Minutes | 49 (3.1%) | 50 (2.7%) |
Time of Departure to Work by Sex in West Athens
The most frequent times of departure to work in West Athens are 5:30 AM to 5:59 AM (246, 15.8%) for males and 7:00 AM to 7:29 AM (390, 21.0%) for females.
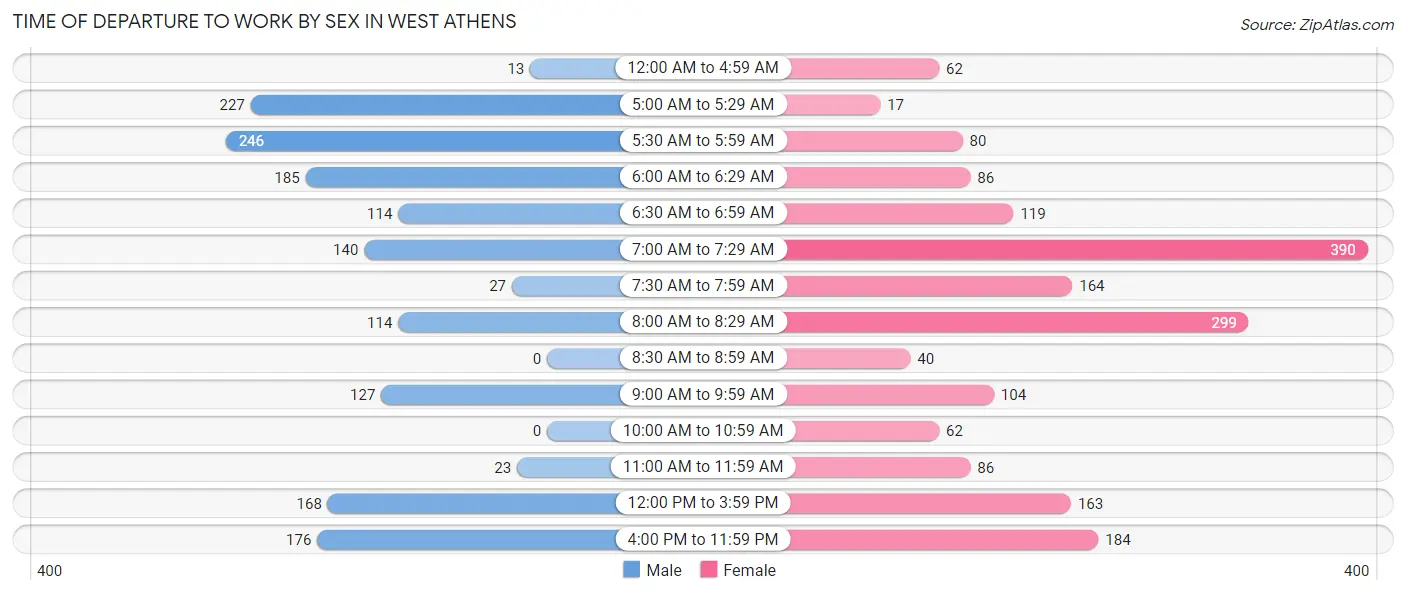
| Time of Departure | Male | Female |
| 12:00 AM to 4:59 AM | 13 (0.8%) | 62 (3.3%) |
| 5:00 AM to 5:29 AM | 227 (14.5%) | 17 (0.9%) |
| 5:30 AM to 5:59 AM | 246 (15.8%) | 80 (4.3%) |
| 6:00 AM to 6:29 AM | 185 (11.9%) | 86 (4.6%) |
| 6:30 AM to 6:59 AM | 114 (7.3%) | 119 (6.4%) |
| 7:00 AM to 7:29 AM | 140 (9.0%) | 390 (21.0%) |
| 7:30 AM to 7:59 AM | 27 (1.7%) | 164 (8.8%) |
| 8:00 AM to 8:29 AM | 114 (7.3%) | 299 (16.1%) |
| 8:30 AM to 8:59 AM | 0 (0.0%) | 40 (2.2%) |
| 9:00 AM to 9:59 AM | 127 (8.1%) | 104 (5.6%) |
| 10:00 AM to 10:59 AM | 0 (0.0%) | 62 (3.3%) |
| 11:00 AM to 11:59 AM | 23 (1.5%) | 86 (4.6%) |
| 12:00 PM to 3:59 PM | 168 (10.8%) | 163 (8.8%) |
| 4:00 PM to 11:59 PM | 176 (11.3%) | 184 (9.9%) |
| Total | 1,560 (100.0%) | 1,856 (100.0%) |
Housing Occupancy in West Athens
Occupancy by Ownership in West Athens
Of the total 2,719 dwellings in West Athens, owner-occupied units account for 1,606 (59.1%), while renter-occupied units make up 1,113 (40.9%).
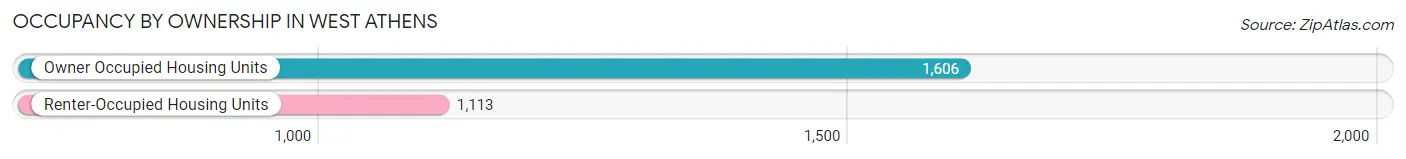
| Occupancy | # Housing Units | % Housing Units |
| Owner Occupied Housing Units | 1,606 | 59.1% |
| Renter-Occupied Housing Units | 1,113 | 40.9% |
| Total Occupied Housing Units | 2,719 | 100.0% |
Occupancy by Household Size in West Athens
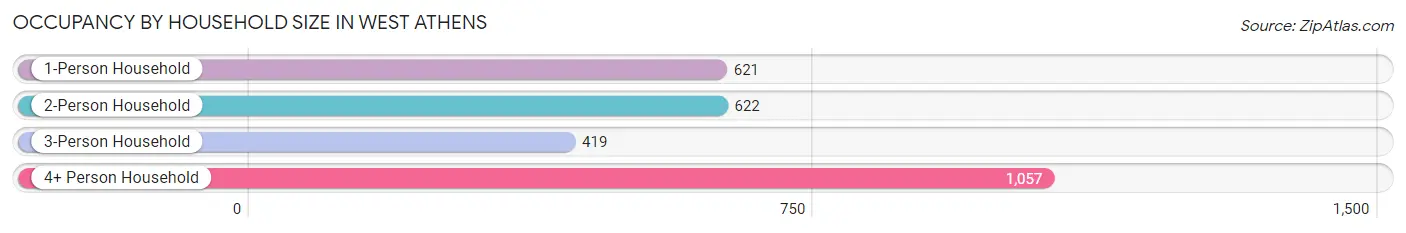
| Household Size | # Housing Units | % Housing Units |
| 1-Person Household | 621 | 22.8% |
| 2-Person Household | 622 | 22.9% |
| 3-Person Household | 419 | 15.4% |
| 4+ Person Household | 1,057 | 38.9% |
| Total Housing Units | 2,719 | 100.0% |
Occupancy by Ownership by Household Size in West Athens
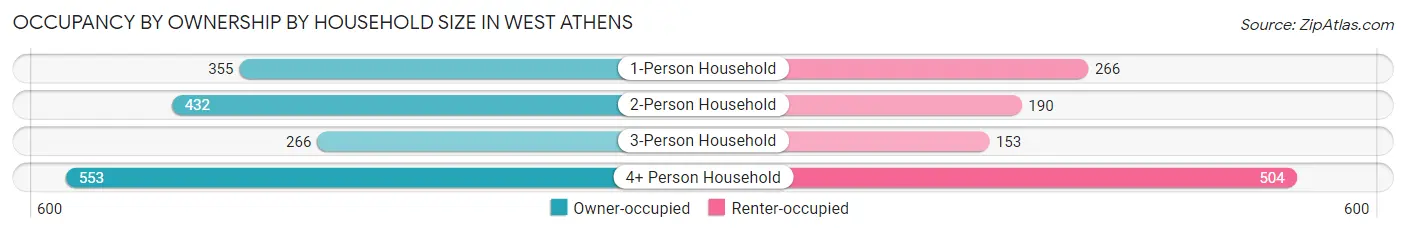
| Household Size | Owner-occupied | Renter-occupied |
| 1-Person Household | 355 (57.2%) | 266 (42.8%) |
| 2-Person Household | 432 (69.5%) | 190 (30.5%) |
| 3-Person Household | 266 (63.5%) | 153 (36.5%) |
| 4+ Person Household | 553 (52.3%) | 504 (47.7%) |
| Total Housing Units | 1,606 (59.1%) | 1,113 (40.9%) |
Occupancy by Educational Attainment in West Athens
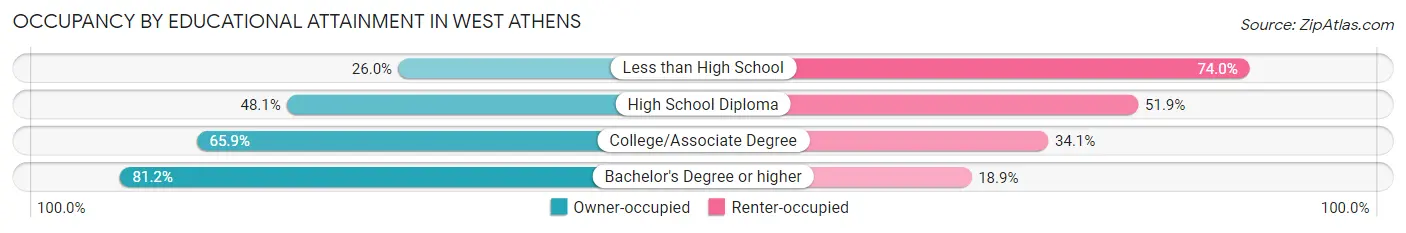
| Household Size | Owner-occupied | Renter-occupied |
| Less than High School | 131 (26.0%) | 373 (74.0%) |
| High School Diploma | 273 (48.1%) | 295 (51.9%) |
| College/Associate Degree | 582 (65.9%) | 301 (34.1%) |
| Bachelor's Degree or higher | 620 (81.1%) | 144 (18.9%) |
Occupancy by Age of Householder in West Athens
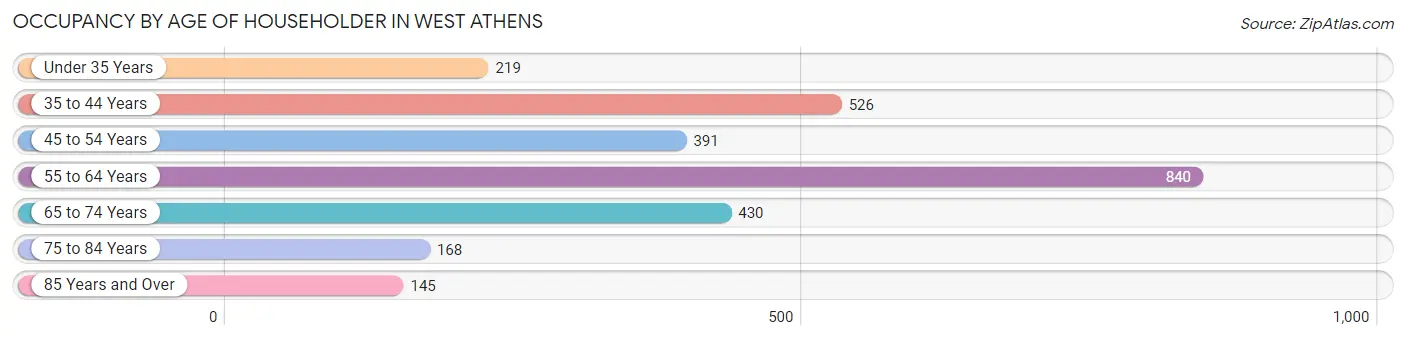
| Age Bracket | # Households | % Households |
| Under 35 Years | 219 | 8.1% |
| 35 to 44 Years | 526 | 19.4% |
| 45 to 54 Years | 391 | 14.4% |
| 55 to 64 Years | 840 | 30.9% |
| 65 to 74 Years | 430 | 15.8% |
| 75 to 84 Years | 168 | 6.2% |
| 85 Years and Over | 145 | 5.3% |
| Total | 2,719 | 100.0% |
Housing Finances in West Athens
Median Income by Occupancy in West Athens
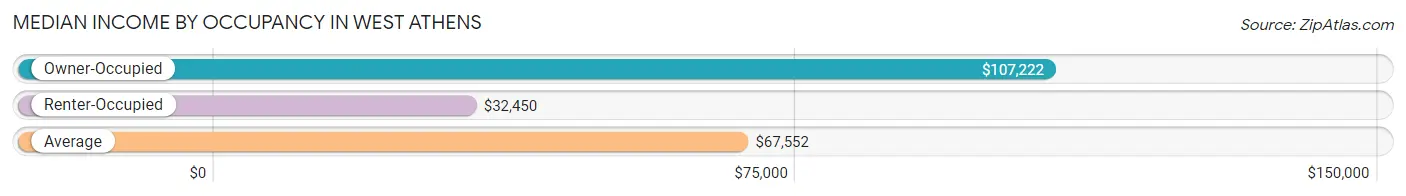
| Occupancy Type | # Households | Median Income |
| Owner-Occupied | 1,606 (59.1%) | $107,222 |
| Renter-Occupied | 1,113 (40.9%) | $32,450 |
| Average | 2,719 (100.0%) | $67,552 |
Occupancy by Householder Income Bracket in West Athens
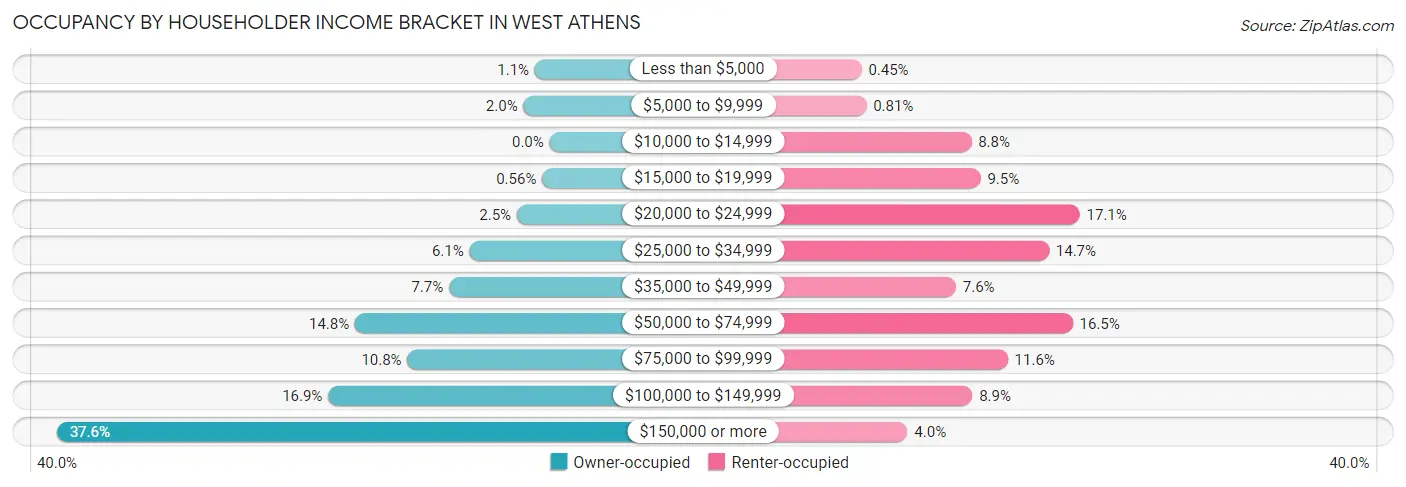
| Income Bracket | Owner-occupied | Renter-occupied |
| Less than $5,000 | 18 (1.1%) | 5 (0.4%) |
| $5,000 to $9,999 | 32 (2.0%) | 9 (0.8%) |
| $10,000 to $14,999 | 0 (0.0%) | 98 (8.8%) |
| $15,000 to $19,999 | 9 (0.6%) | 106 (9.5%) |
| $20,000 to $24,999 | 40 (2.5%) | 190 (17.1%) |
| $25,000 to $34,999 | 98 (6.1%) | 164 (14.7%) |
| $35,000 to $49,999 | 123 (7.7%) | 85 (7.6%) |
| $50,000 to $74,999 | 238 (14.8%) | 184 (16.5%) |
| $75,000 to $99,999 | 174 (10.8%) | 129 (11.6%) |
| $100,000 to $149,999 | 271 (16.9%) | 99 (8.9%) |
| $150,000 or more | 603 (37.6%) | 44 (4.0%) |
| Total | 1,606 (100.0%) | 1,113 (100.0%) |
Monthly Housing Cost Tiers in West Athens
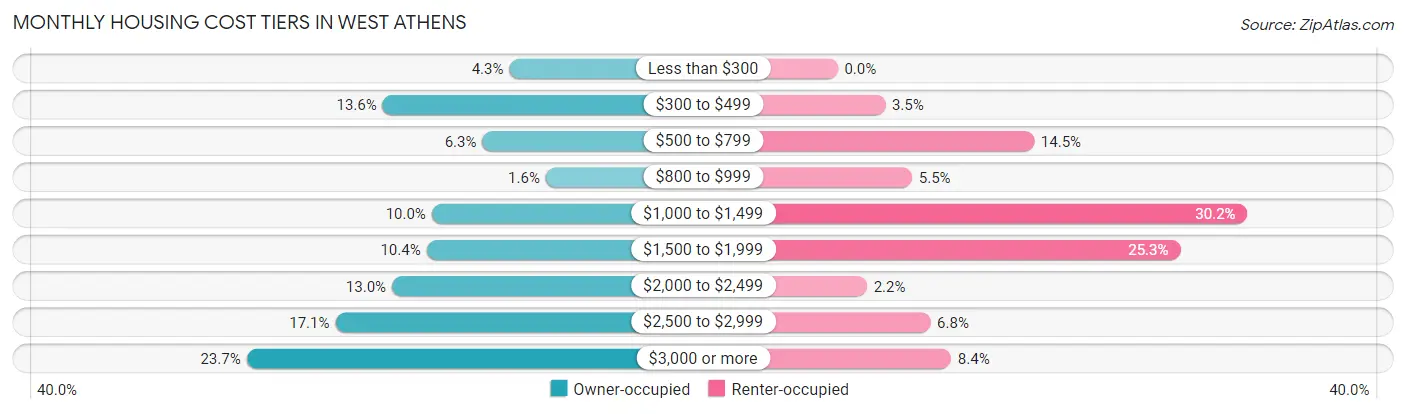
| Monthly Cost | Owner-occupied | Renter-occupied |
| Less than $300 | 69 (4.3%) | 0 (0.0%) |
| $300 to $499 | 219 (13.6%) | 39 (3.5%) |
| $500 to $799 | 101 (6.3%) | 161 (14.5%) |
| $800 to $999 | 26 (1.6%) | 61 (5.5%) |
| $1,000 to $1,499 | 161 (10.0%) | 336 (30.2%) |
| $1,500 to $1,999 | 167 (10.4%) | 281 (25.3%) |
| $2,000 to $2,499 | 208 (13.0%) | 24 (2.2%) |
| $2,500 to $2,999 | 275 (17.1%) | 76 (6.8%) |
| $3,000 or more | 380 (23.7%) | 93 (8.4%) |
| Total | 1,606 (100.0%) | 1,113 (100.0%) |
Physical Housing Characteristics in West Athens
Housing Structures in West Athens
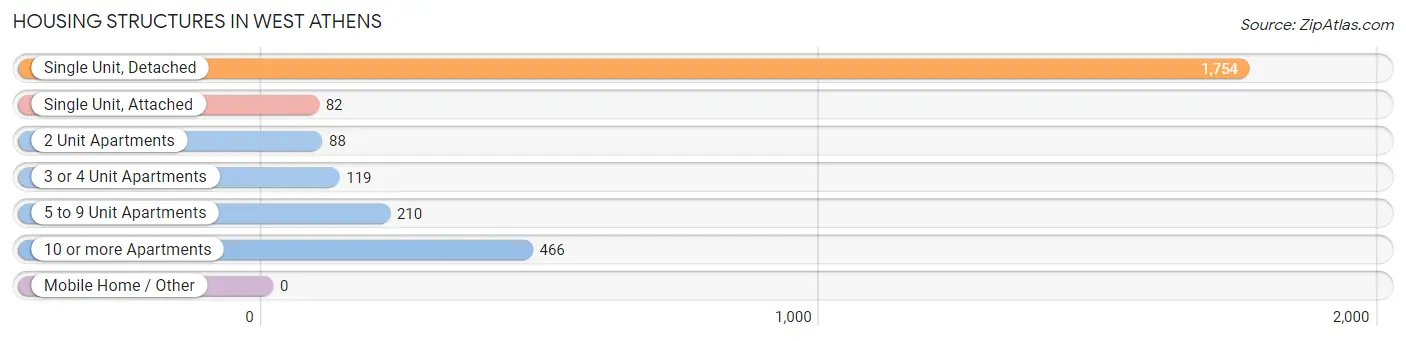
| Structure Type | # Housing Units | % Housing Units |
| Single Unit, Detached | 1,754 | 64.5% |
| Single Unit, Attached | 82 | 3.0% |
| 2 Unit Apartments | 88 | 3.2% |
| 3 or 4 Unit Apartments | 119 | 4.4% |
| 5 to 9 Unit Apartments | 210 | 7.7% |
| 10 or more Apartments | 466 | 17.1% |
| Mobile Home / Other | 0 | 0.0% |
| Total | 2,719 | 100.0% |
Housing Structures by Occupancy in West Athens
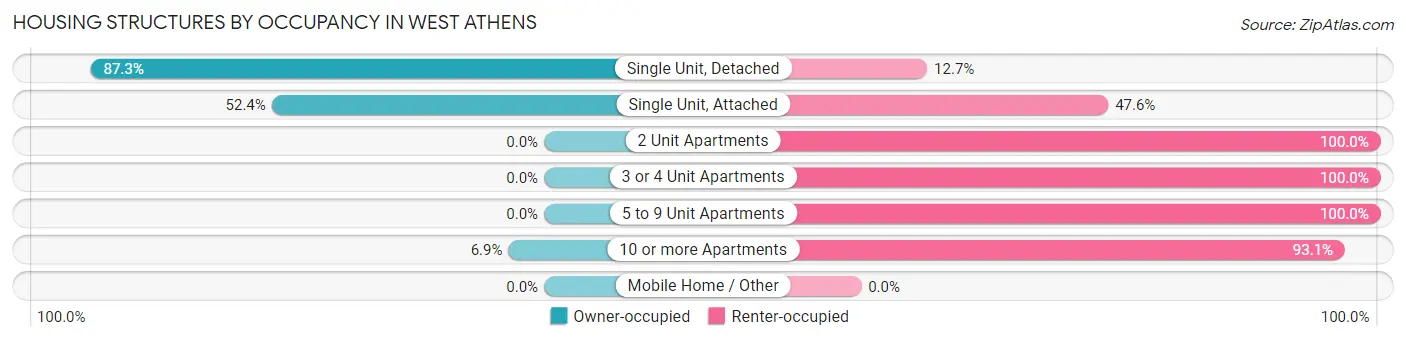
| Structure Type | Owner-occupied | Renter-occupied |
| Single Unit, Detached | 1,531 (87.3%) | 223 (12.7%) |
| Single Unit, Attached | 43 (52.4%) | 39 (47.6%) |
| 2 Unit Apartments | 0 (0.0%) | 88 (100.0%) |
| 3 or 4 Unit Apartments | 0 (0.0%) | 119 (100.0%) |
| 5 to 9 Unit Apartments | 0 (0.0%) | 210 (100.0%) |
| 10 or more Apartments | 32 (6.9%) | 434 (93.1%) |
| Mobile Home / Other | 0 (0.0%) | 0 (0.0%) |
| Total | 1,606 (59.1%) | 1,113 (40.9%) |
Housing Structures by Number of Rooms in West Athens
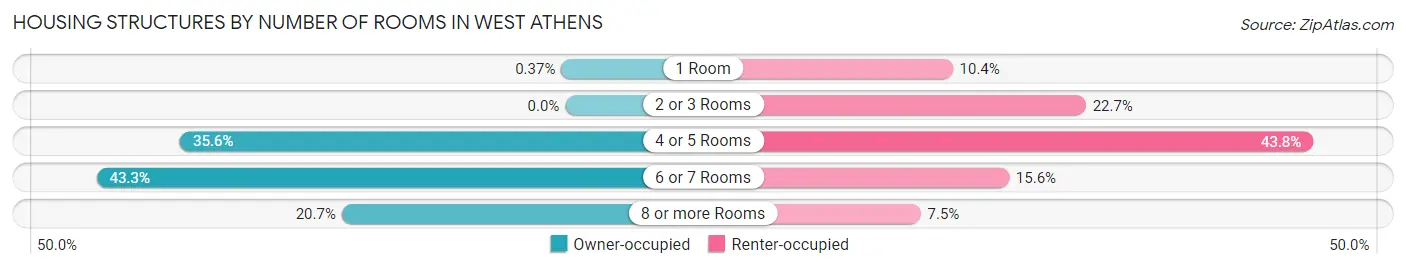
| Number of Rooms | Owner-occupied | Renter-occupied |
| 1 Room | 6 (0.4%) | 116 (10.4%) |
| 2 or 3 Rooms | 0 (0.0%) | 253 (22.7%) |
| 4 or 5 Rooms | 572 (35.6%) | 487 (43.8%) |
| 6 or 7 Rooms | 696 (43.3%) | 174 (15.6%) |
| 8 or more Rooms | 332 (20.7%) | 83 (7.5%) |
| Total | 1,606 (100.0%) | 1,113 (100.0%) |
Housing Structure by Heating Type in West Athens
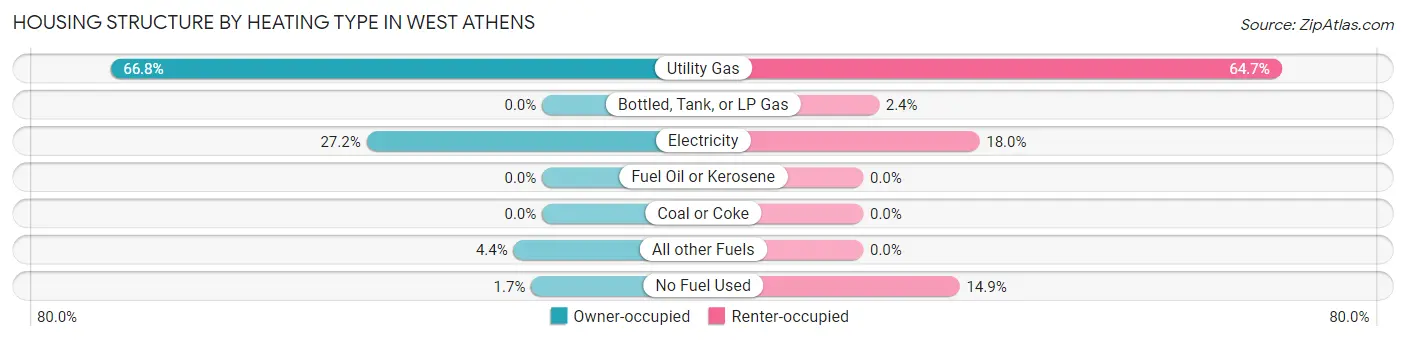
| Heating Type | Owner-occupied | Renter-occupied |
| Utility Gas | 1,072 (66.7%) | 720 (64.7%) |
| Bottled, Tank, or LP Gas | 0 (0.0%) | 27 (2.4%) |
| Electricity | 436 (27.2%) | 200 (18.0%) |
| Fuel Oil or Kerosene | 0 (0.0%) | 0 (0.0%) |
| Coal or Coke | 0 (0.0%) | 0 (0.0%) |
| All other Fuels | 71 (4.4%) | 0 (0.0%) |
| No Fuel Used | 27 (1.7%) | 166 (14.9%) |
| Total | 1,606 (100.0%) | 1,113 (100.0%) |
Household Vehicle Usage in West Athens
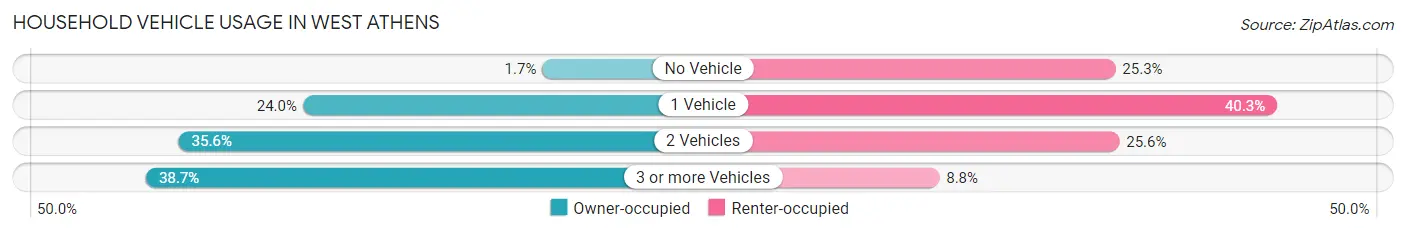
| Vehicles per Household | Owner-occupied | Renter-occupied |
| No Vehicle | 27 (1.7%) | 281 (25.3%) |
| 1 Vehicle | 386 (24.0%) | 449 (40.3%) |
| 2 Vehicles | 572 (35.6%) | 285 (25.6%) |
| 3 or more Vehicles | 621 (38.7%) | 98 (8.8%) |
| Total | 1,606 (100.0%) | 1,113 (100.0%) |
Real Estate & Mortgages in West Athens
Real Estate and Mortgage Overview in West Athens
| Characteristic | Without Mortgage | With Mortgage |
| Housing Units | 402 | 1,204 |
| Median Property Value | $581,900 | $659,200 |
| Median Household Income | $53,984 | $563 |
| Monthly Housing Costs | $452 | $380 |
| Real Estate Taxes | $2,604 | $13 |
Property Value by Mortgage Status in West Athens
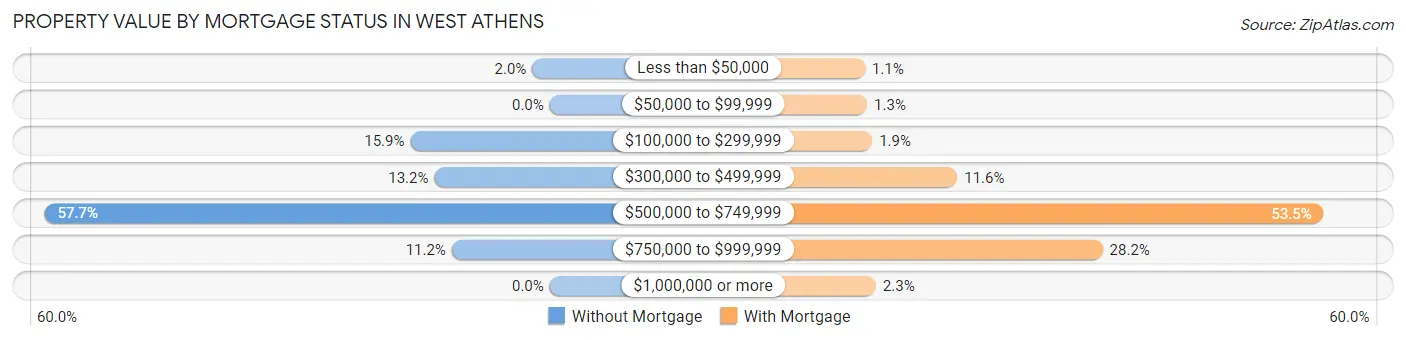
| Property Value | Without Mortgage | With Mortgage |
| Less than $50,000 | 8 (2.0%) | 13 (1.1%) |
| $50,000 to $99,999 | 0 (0.0%) | 16 (1.3%) |
| $100,000 to $299,999 | 64 (15.9%) | 23 (1.9%) |
| $300,000 to $499,999 | 53 (13.2%) | 140 (11.6%) |
| $500,000 to $749,999 | 232 (57.7%) | 644 (53.5%) |
| $750,000 to $999,999 | 45 (11.2%) | 340 (28.2%) |
| $1,000,000 or more | 0 (0.0%) | 28 (2.3%) |
| Total | 402 (100.0%) | 1,204 (100.0%) |
Household Income by Mortgage Status in West Athens
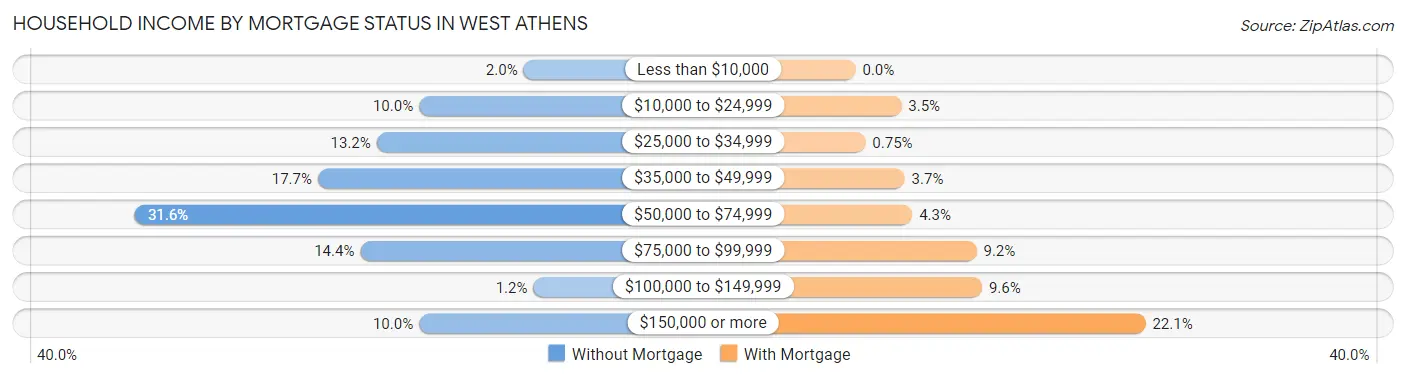
| Household Income | Without Mortgage | With Mortgage |
| Less than $10,000 | 8 (2.0%) | 0 (0.0%) |
| $10,000 to $24,999 | 40 (10.0%) | 42 (3.5%) |
| $25,000 to $34,999 | 53 (13.2%) | 9 (0.7%) |
| $35,000 to $49,999 | 71 (17.7%) | 45 (3.7%) |
| $50,000 to $74,999 | 127 (31.6%) | 52 (4.3%) |
| $75,000 to $99,999 | 58 (14.4%) | 111 (9.2%) |
| $100,000 to $149,999 | 5 (1.2%) | 116 (9.6%) |
| $150,000 or more | 40 (10.0%) | 266 (22.1%) |
| Total | 402 (100.0%) | 1,204 (100.0%) |
Property Value to Household Income Ratio in West Athens
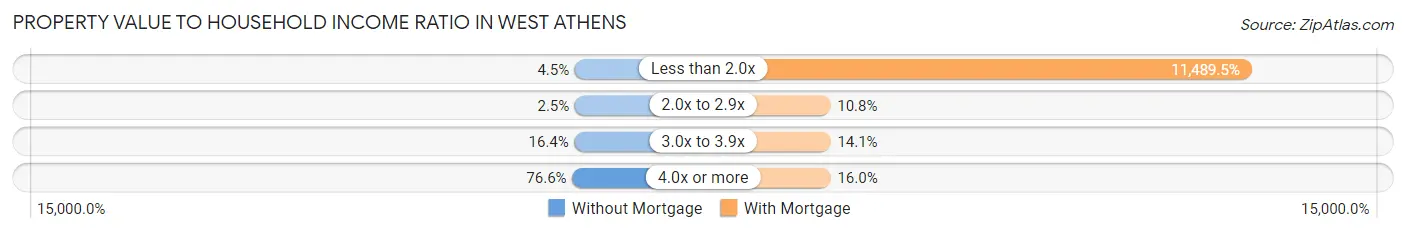
| Value-to-Income Ratio | Without Mortgage | With Mortgage |
| Less than 2.0x | 18 (4.5%) | 138,333 (11,489.4%) |
| 2.0x to 2.9x | 10 (2.5%) | 130 (10.8%) |
| 3.0x to 3.9x | 66 (16.4%) | 170 (14.1%) |
| 4.0x or more | 308 (76.6%) | 192 (16.0%) |
| Total | 402 (100.0%) | 1,204 (100.0%) |
Real Estate Taxes by Mortgage Status in West Athens
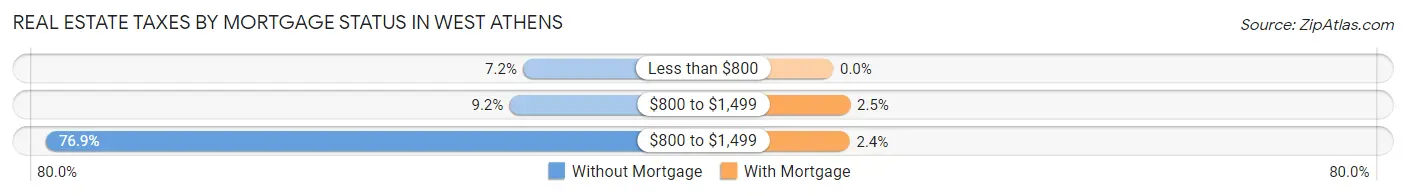
| Property Taxes | Without Mortgage | With Mortgage |
| Less than $800 | 29 (7.2%) | 0 (0.0%) |
| $800 to $1,499 | 37 (9.2%) | 30 (2.5%) |
| $800 to $1,499 | 309 (76.9%) | 29 (2.4%) |
| Total | 402 (100.0%) | 1,204 (100.0%) |
Health & Disability in West Athens
Health Insurance Coverage by Age in West Athens
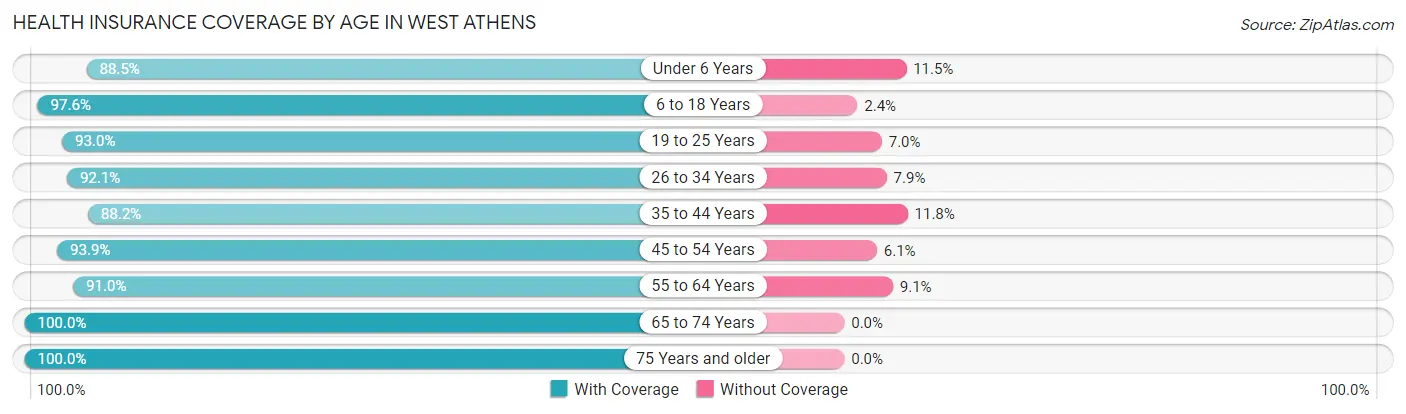
| Age Bracket | With Coverage | Without Coverage |
| Under 6 Years | 621 (88.5%) | 81 (11.5%) |
| 6 to 18 Years | 1,882 (97.6%) | 47 (2.4%) |
| 19 to 25 Years | 851 (93.0%) | 64 (7.0%) |
| 26 to 34 Years | 1,014 (92.1%) | 87 (7.9%) |
| 35 to 44 Years | 836 (88.2%) | 112 (11.8%) |
| 45 to 54 Years | 820 (93.9%) | 53 (6.1%) |
| 55 to 64 Years | 1,337 (90.9%) | 133 (9.0%) |
| 65 to 74 Years | 717 (100.0%) | 0 (0.0%) |
| 75 Years and older | 473 (100.0%) | 0 (0.0%) |
| Total | 8,551 (93.7%) | 577 (6.3%) |
Health Insurance Coverage by Citizenship Status in West Athens
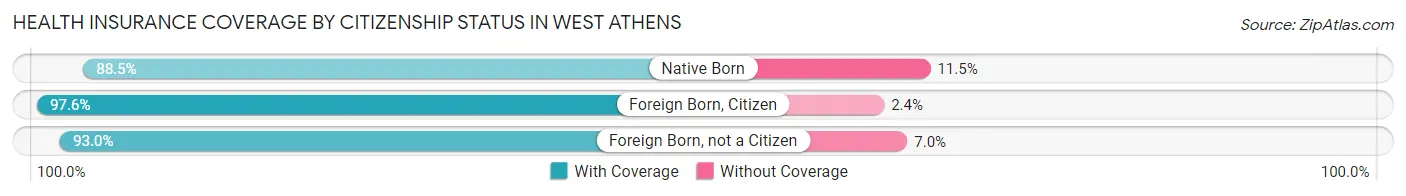
| Citizenship Status | With Coverage | Without Coverage |
| Native Born | 621 (88.5%) | 81 (11.5%) |
| Foreign Born, Citizen | 1,882 (97.6%) | 47 (2.4%) |
| Foreign Born, not a Citizen | 851 (93.0%) | 64 (7.0%) |
Health Insurance Coverage by Household Income in West Athens
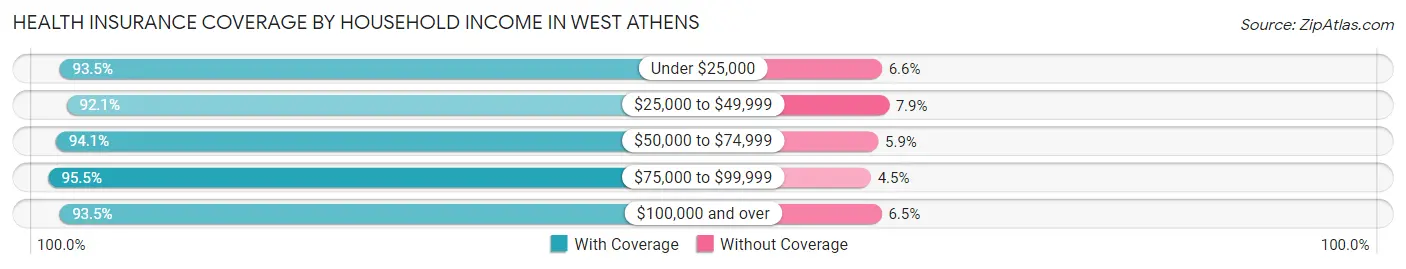
| Household Income | With Coverage | Without Coverage |
| Under $25,000 | 927 (93.4%) | 65 (6.6%) |
| $25,000 to $49,999 | 1,067 (92.1%) | 91 (7.9%) |
| $50,000 to $74,999 | 1,028 (94.1%) | 64 (5.9%) |
| $75,000 to $99,999 | 1,003 (95.5%) | 47 (4.5%) |
| $100,000 and over | 4,468 (93.5%) | 310 (6.5%) |
Public vs Private Health Insurance Coverage by Age in West Athens
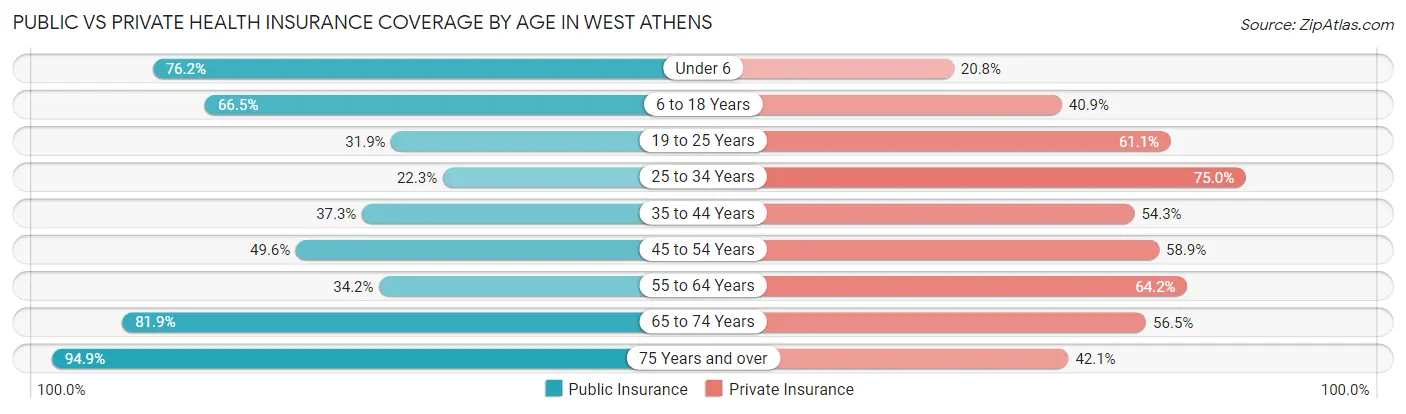
| Age Bracket | Public Insurance | Private Insurance |
| Under 6 | 535 (76.2%) | 146 (20.8%) |
| 6 to 18 Years | 1,283 (66.5%) | 788 (40.8%) |
| 19 to 25 Years | 292 (31.9%) | 559 (61.1%) |
| 25 to 34 Years | 246 (22.3%) | 826 (75.0%) |
| 35 to 44 Years | 354 (37.3%) | 515 (54.3%) |
| 45 to 54 Years | 433 (49.6%) | 514 (58.9%) |
| 55 to 64 Years | 502 (34.2%) | 943 (64.1%) |
| 65 to 74 Years | 587 (81.9%) | 405 (56.5%) |
| 75 Years and over | 449 (94.9%) | 199 (42.1%) |
| Total | 4,681 (51.3%) | 4,895 (53.6%) |
Disability Status by Sex by Age in West Athens
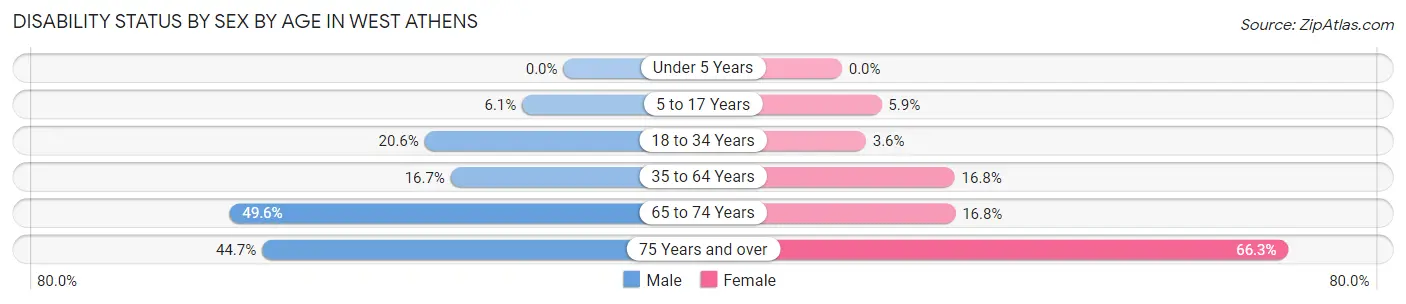
| Age Bracket | Male | Female |
| Under 5 Years | 0 (0.0%) | 0 (0.0%) |
| 5 to 17 Years | 58 (6.1%) | 55 (5.9%) |
| 18 to 34 Years | 179 (20.6%) | 44 (3.6%) |
| 35 to 64 Years | 248 (16.7%) | 303 (16.8%) |
| 65 to 74 Years | 120 (49.6%) | 80 (16.8%) |
| 75 Years and over | 51 (44.7%) | 238 (66.3%) |
Disability Class by Sex by Age in West Athens
Disability Class: Hearing Difficulty
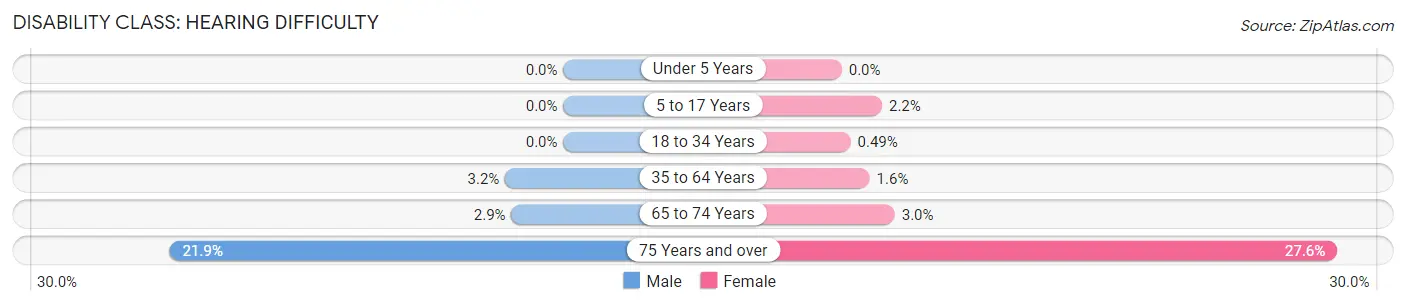
| Age Bracket | Male | Female |
| Under 5 Years | 0 (0.0%) | 0 (0.0%) |
| 5 to 17 Years | 0 (0.0%) | 21 (2.2%) |
| 18 to 34 Years | 0 (0.0%) | 6 (0.5%) |
| 35 to 64 Years | 48 (3.2%) | 28 (1.5%) |
| 65 to 74 Years | 7 (2.9%) | 14 (2.9%) |
| 75 Years and over | 25 (21.9%) | 99 (27.6%) |
Disability Class: Vision Difficulty
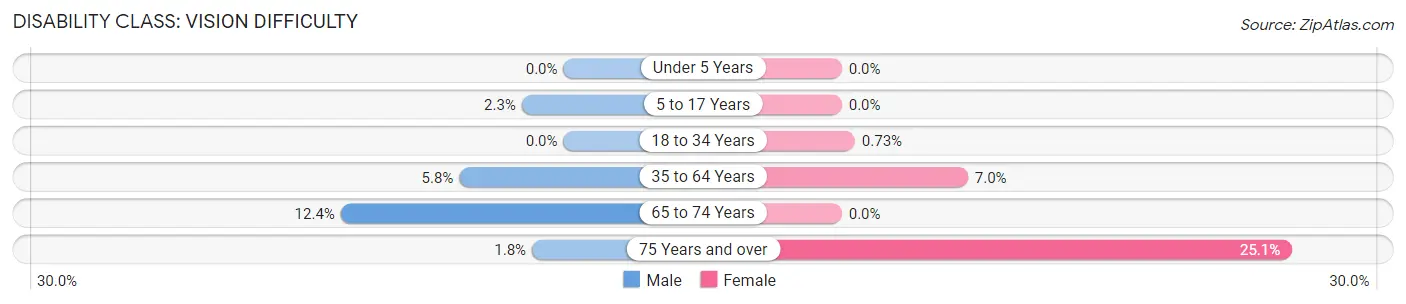
| Age Bracket | Male | Female |
| Under 5 Years | 0 (0.0%) | 0 (0.0%) |
| 5 to 17 Years | 22 (2.3%) | 0 (0.0%) |
| 18 to 34 Years | 0 (0.0%) | 9 (0.7%) |
| 35 to 64 Years | 86 (5.8%) | 127 (7.0%) |
| 65 to 74 Years | 30 (12.4%) | 0 (0.0%) |
| 75 Years and over | 2 (1.8%) | 90 (25.1%) |
Disability Class: Cognitive Difficulty
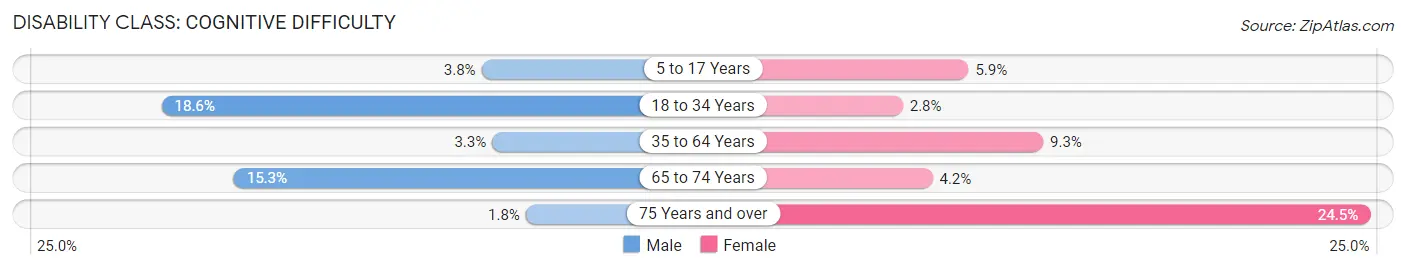
| Age Bracket | Male | Female |
| 5 to 17 Years | 36 (3.8%) | 55 (5.9%) |
| 18 to 34 Years | 162 (18.6%) | 35 (2.8%) |
| 35 to 64 Years | 49 (3.3%) | 169 (9.3%) |
| 65 to 74 Years | 37 (15.3%) | 20 (4.2%) |
| 75 Years and over | 2 (1.8%) | 88 (24.5%) |
Disability Class: Ambulatory Difficulty
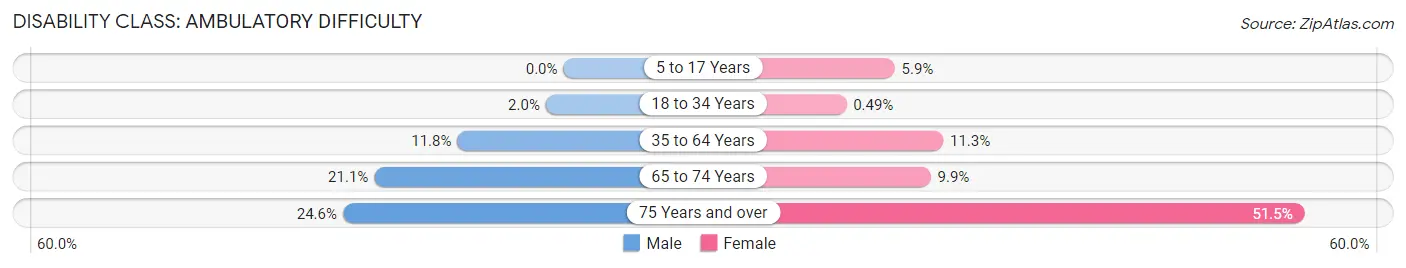
| Age Bracket | Male | Female |
| 5 to 17 Years | 0 (0.0%) | 55 (5.9%) |
| 18 to 34 Years | 17 (2.0%) | 6 (0.5%) |
| 35 to 64 Years | 175 (11.8%) | 204 (11.3%) |
| 65 to 74 Years | 51 (21.1%) | 47 (9.9%) |
| 75 Years and over | 28 (24.6%) | 185 (51.5%) |
Disability Class: Self-Care Difficulty
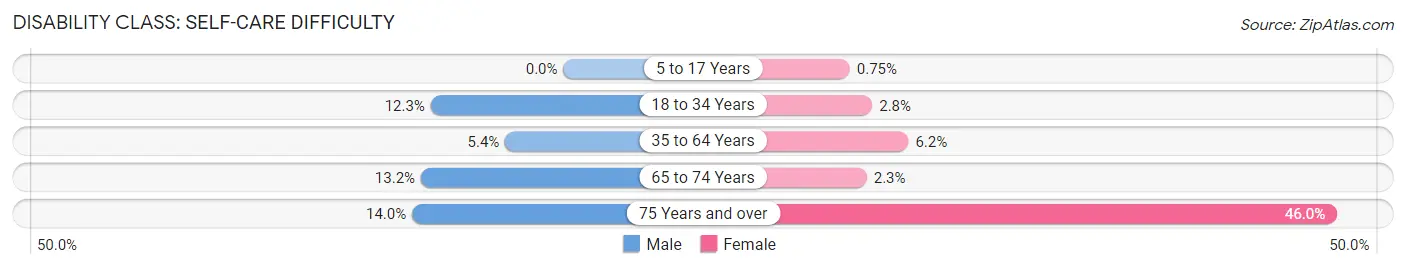
| Age Bracket | Male | Female |
| 5 to 17 Years | 0 (0.0%) | 7 (0.7%) |
| 18 to 34 Years | 107 (12.3%) | 35 (2.8%) |
| 35 to 64 Years | 80 (5.4%) | 112 (6.2%) |
| 65 to 74 Years | 32 (13.2%) | 11 (2.3%) |
| 75 Years and over | 16 (14.0%) | 165 (46.0%) |
Technology Access in West Athens
Computing Device Access in West Athens
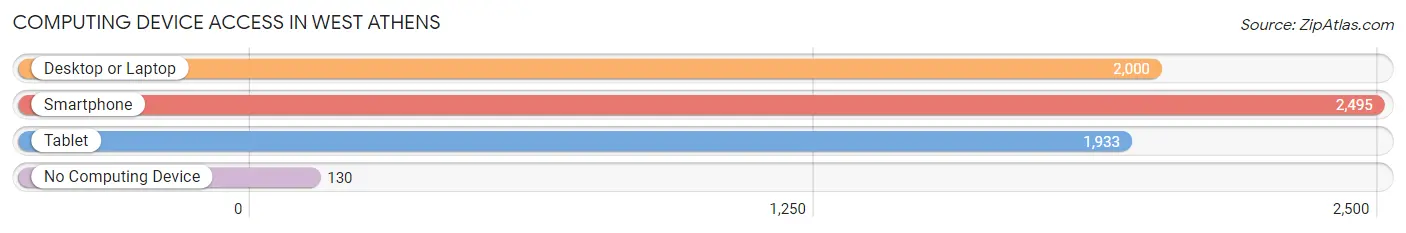
| Device Type | # Households | % Households |
| Desktop or Laptop | 2,000 | 73.6% |
| Smartphone | 2,495 | 91.8% |
| Tablet | 1,933 | 71.1% |
| No Computing Device | 130 | 4.8% |
| Total | 2,719 | 100.0% |
Internet Access in West Athens
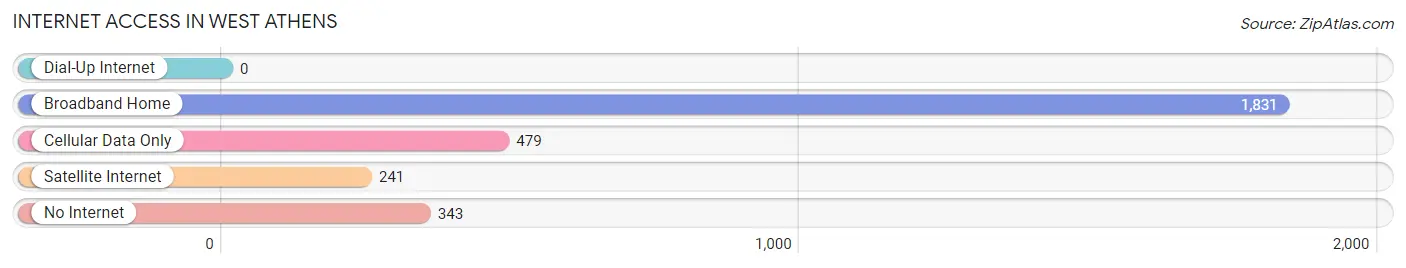
| Internet Type | # Households | % Households |
| Dial-Up Internet | 0 | 0.0% |
| Broadband Home | 1,831 | 67.3% |
| Cellular Data Only | 479 | 17.6% |
| Satellite Internet | 241 | 8.9% |
| No Internet | 343 | 12.6% |
| Total | 2,719 | 100.0% |
West Athens Summary
Athens is a small unincorporated community located in Los Angeles County, California. It is situated in the western part of the county, just south of the city of Los Angeles. The community is bordered by the cities of Inglewood, Hawthorne, and Gardena. Athens is a predominantly residential area, with a population of approximately 8,000 people.
History
Athens was originally part of the Rancho La Ballona, a Mexican land grant given to Ygnacio and Augustin Machado in 1839. The Machados sold the land to the Sepulveda family in 1859, who then sold it to the Los Angeles County in 1868. The area was then subdivided and sold to various individuals, and the community of Athens was established in the late 19th century.
Athens was originally a farming community, with many of the residents growing vegetables and fruits. The area was also home to a number of dairy farms, which supplied milk to the city of Los Angeles. In the early 20th century, the area began to experience rapid growth as the city of Los Angeles expanded. This led to the development of the area, with the construction of new homes and businesses.
Geography
Athens is located in the western part of Los Angeles County, just south of the city of Los Angeles. It is bordered by the cities of Inglewood, Hawthorne, and Gardena. The community is situated in a hilly area, with the highest point being the Athens Hill at an elevation of 545 feet. The area is also home to several small creeks, including the Ballona Creek and the Los Angeles River.
Economy
Athens is a predominantly residential area, with a small commercial district located along the main thoroughfare of La Cienega Boulevard. The area is home to a number of small businesses, including restaurants, grocery stores, and retail stores. The community is also home to a number of industrial businesses, including a recycling center and a manufacturing plant.
Demographics
As of the 2010 census, the population of Athens was 8,000 people. The racial makeup of the community was 57.3% White, 16.2% African American, 0.7% Native American, 11.2% Asian, 0.2% Pacific Islander, and 14.6% from other races. The median household income was $45,000, and the median age was 33 years.
Conclusion
Athens is a small unincorporated community located in Los Angeles County, California. It is situated in the western part of the county, just south of the city of Los Angeles. The community is bordered by the cities of Inglewood, Hawthorne, and Gardena. Athens is a predominantly residential area, with a population of approximately 8,000 people. The area was originally a farming community, but has since experienced rapid growth due to the expansion of the city of Los Angeles. The economy of Athens is largely based on small businesses and industrial businesses, and the population is diverse, with a median household income of $45,000 and a median age of 33 years.
Common Questions
What is Per Capita Income in West Athens?
Per Capita income in West Athens is $31,991.
What is the Median Family Income in West Athens?
Median Family Income in West Athens is $85,612.
What is the Median Household income in West Athens?
Median Household Income in West Athens is $67,552.
What is Income or Wage Gap in West Athens?
Income or Wage Gap in West Athens is 28.7%.
Women in West Athens earn 71.3 cents for every dollar earned by a man.
What is Inequality or Gini Index in West Athens?
Inequality or Gini Index in West Athens is 0.47.
What is the Total Population of West Athens?
Total Population of West Athens is 9,131.
What is the Total Male Population of West Athens?
Total Male Population of West Athens is 4,055.
What is the Total Female Population of West Athens?
Total Female Population of West Athens is 5,076.
What is the Ratio of Males per 100 Females in West Athens?
There are 79.89 Males per 100 Females in West Athens.
What is the Ratio of Females per 100 Males in West Athens?
There are 125.18 Females per 100 Males in West Athens.
What is the Median Population Age in West Athens?
Median Population Age in West Athens is 34.4 Years.
What is the Average Family Size in West Athens
Average Family Size in West Athens is 3.9 People.
What is the Average Household Size in West Athens
Average Household Size in West Athens is 3.3 People.
How Large is the Labor Force in West Athens?
There are 4,570 People in the Labor Forcein in West Athens.
What is the Percentage of People in the Labor Force in West Athens?
65.8% of People are in the Labor Force in West Athens.
What is the Unemployment Rate in West Athens?
Unemployment Rate in West Athens is 11.6%.