Mountain House, CA Map & Demographics
Mountain House Map
Mountain House Overview
$47,916
PER CAPITA INCOME
$174,130
AVG FAMILY INCOME
$166,821
AVG HOUSEHOLD INCOME
44.1%
WAGE / INCOME GAP [ % ]
55.9¢/ $1
WAGE / INCOME GAP [ $ ]
0.31
INEQUALITY / GINI INDEX
23,590
TOTAL POPULATION
12,067
MALE POPULATION
11,523
FEMALE POPULATION
104.72
MALES / 100 FEMALES
95.49
FEMALES / 100 MALES
34.3
MEDIAN AGE
4.1
AVG FAMILY SIZE
3.8
AVG HOUSEHOLD SIZE
11,210
LABOR FORCE [ PEOPLE ]
64.8%
PERCENT IN LABOR FORCE
3.6%
UNEMPLOYMENT RATE
Mountain House Area Codes
Income in Mountain House
Income Overview in Mountain House
Per Capita Income in Mountain House is $47,916, while median incomes of families and households are $174,130 and $166,821 respectively.
| Characteristic | Number | Measure |
| Per Capita Income | 23,590 | $47,916 |
| Median Family Income | 5,390 | $174,130 |
| Mean Family Income | 5,390 | $189,927 |
| Median Household Income | 6,159 | $166,821 |
| Mean Household Income | 6,159 | $181,030 |
| Income Deficit | 5,390 | $0 |
| Wage / Income Gap (%) | 23,590 | 44.12% |
| Wage / Income Gap ($) | 23,590 | 55.88¢ per $1 |
| Gini / Inequality Index | 23,590 | 0.31 |
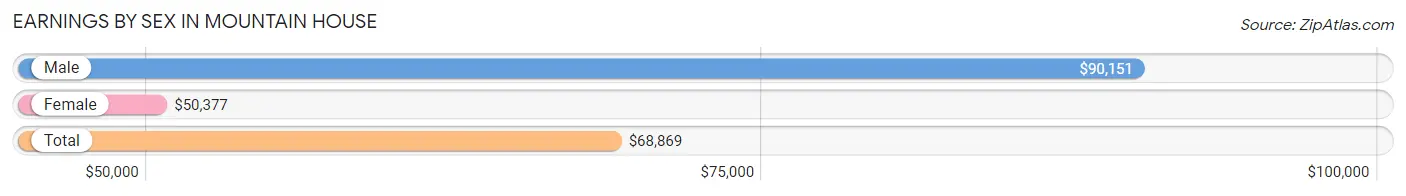
Earnings by Sex in Mountain House
Average Earnings in Mountain House are $68,869, $90,151 for men and $50,377 for women, a difference of 44.1%.
| Sex | Number | Average Earnings |
| Male | 6,493 (56.9%) | $90,151 |
| Female | 4,929 (43.1%) | $50,377 |
| Total | 11,422 (100.0%) | $68,869 |
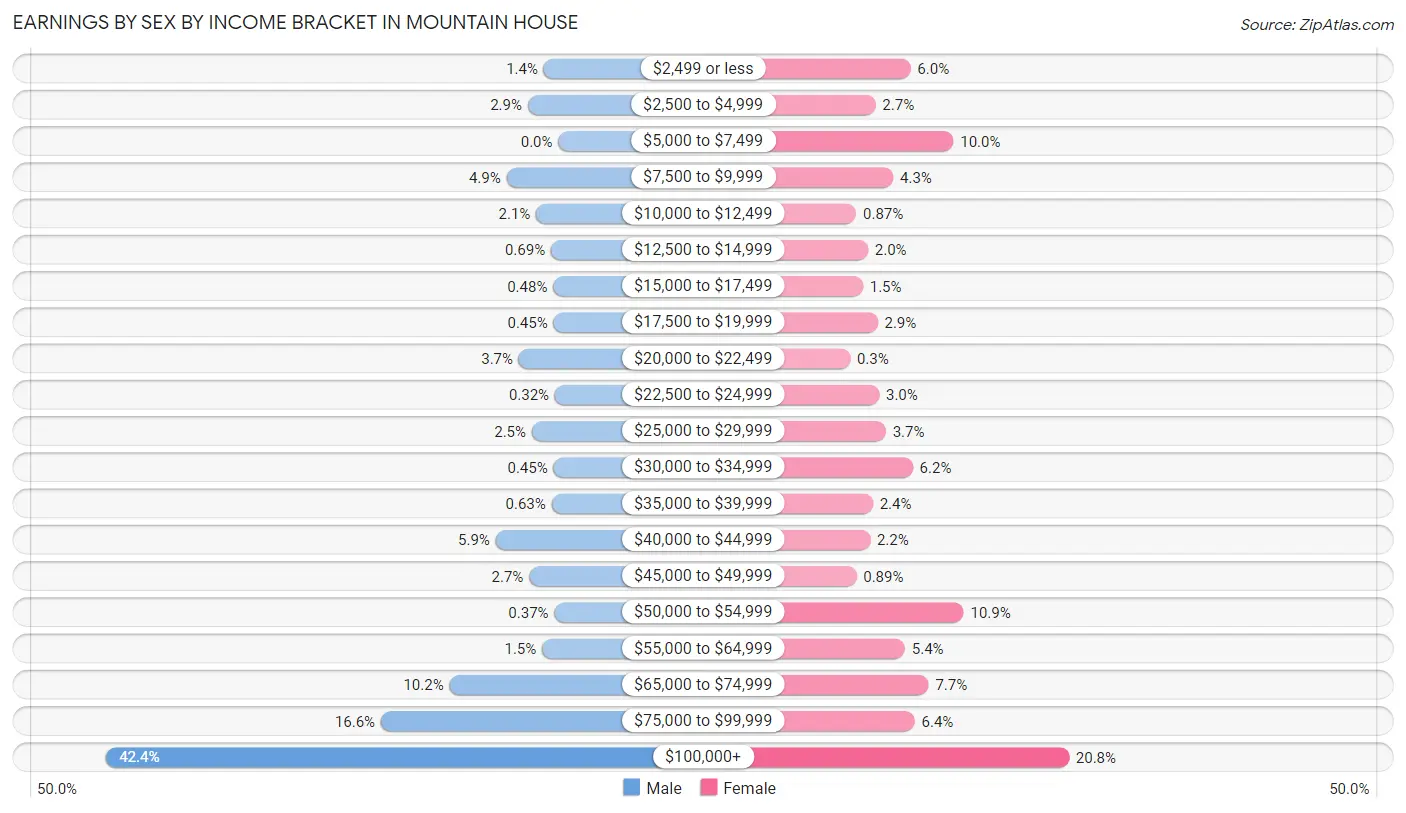
Earnings by Sex by Income Bracket in Mountain House
The most common earnings brackets in Mountain House are $100,000+ for men (2,750 | 42.3%) and $100,000+ for women (1,025 | 20.8%).
| Income | Male | Female |
| $2,499 or less | 88 (1.4%) | 294 (6.0%) |
| $2,500 to $4,999 | 186 (2.9%) | 132 (2.7%) |
| $5,000 to $7,499 | 0 (0.0%) | 492 (10.0%) |
| $7,500 to $9,999 | 315 (4.9%) | 214 (4.3%) |
| $10,000 to $12,499 | 135 (2.1%) | 43 (0.9%) |
| $12,500 to $14,999 | 45 (0.7%) | 97 (2.0%) |
| $15,000 to $17,499 | 31 (0.5%) | 74 (1.5%) |
| $17,500 to $19,999 | 29 (0.4%) | 142 (2.9%) |
| $20,000 to $22,499 | 240 (3.7%) | 15 (0.3%) |
| $22,500 to $24,999 | 21 (0.3%) | 149 (3.0%) |
| $25,000 to $29,999 | 161 (2.5%) | 180 (3.6%) |
| $30,000 to $34,999 | 29 (0.4%) | 304 (6.2%) |
| $35,000 to $39,999 | 41 (0.6%) | 120 (2.4%) |
| $40,000 to $44,999 | 381 (5.9%) | 107 (2.2%) |
| $45,000 to $49,999 | 177 (2.7%) | 44 (0.9%) |
| $50,000 to $54,999 | 24 (0.4%) | 539 (10.9%) |
| $55,000 to $64,999 | 99 (1.5%) | 268 (5.4%) |
| $65,000 to $74,999 | 662 (10.2%) | 377 (7.6%) |
| $75,000 to $99,999 | 1,079 (16.6%) | 313 (6.4%) |
| $100,000+ | 2,750 (42.3%) | 1,025 (20.8%) |
| Total | 6,493 (100.0%) | 4,929 (100.0%) |
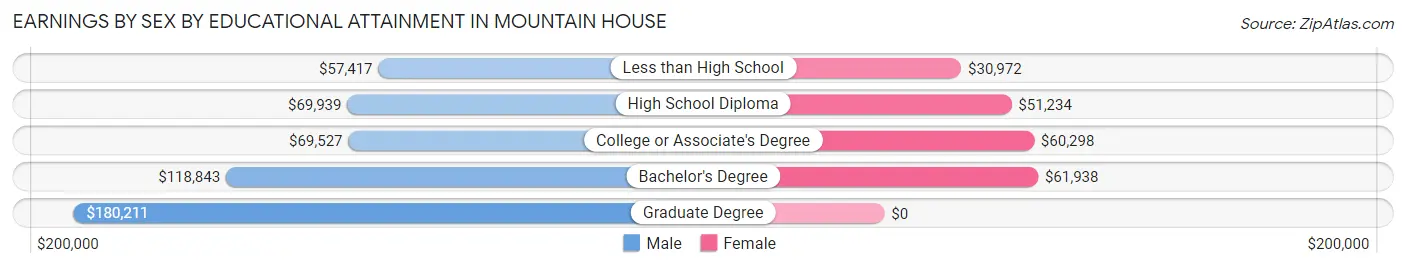
Earnings by Sex by Educational Attainment in Mountain House
Average earnings in Mountain House are $100,610 for men and $53,773 for women, a difference of 46.6%. Men with an educational attainment of graduate degree enjoy the highest average annual earnings of $180,211, while those with less than high school education earn the least with $57,417. Women with an educational attainment of bachelor's degree earn the most with the average annual earnings of $61,938, while those with less than high school education have the smallest earnings of $30,972.
| Educational Attainment | Male Income | Female Income |
| Less than High School | $57,417 | $30,972 |
| High School Diploma | $69,939 | $51,234 |
| College or Associate's Degree | $69,527 | $60,298 |
| Bachelor's Degree | $118,843 | $61,938 |
| Graduate Degree | $180,211 | $0 |
| Total | $100,610 | $53,773 |
Family Income in Mountain House
Family Income Brackets in Mountain House
According to the Mountain House family income data, there are 2,027 families falling into the $200,000+ income range, which is the most common income bracket and makes up 37.6% of all families.
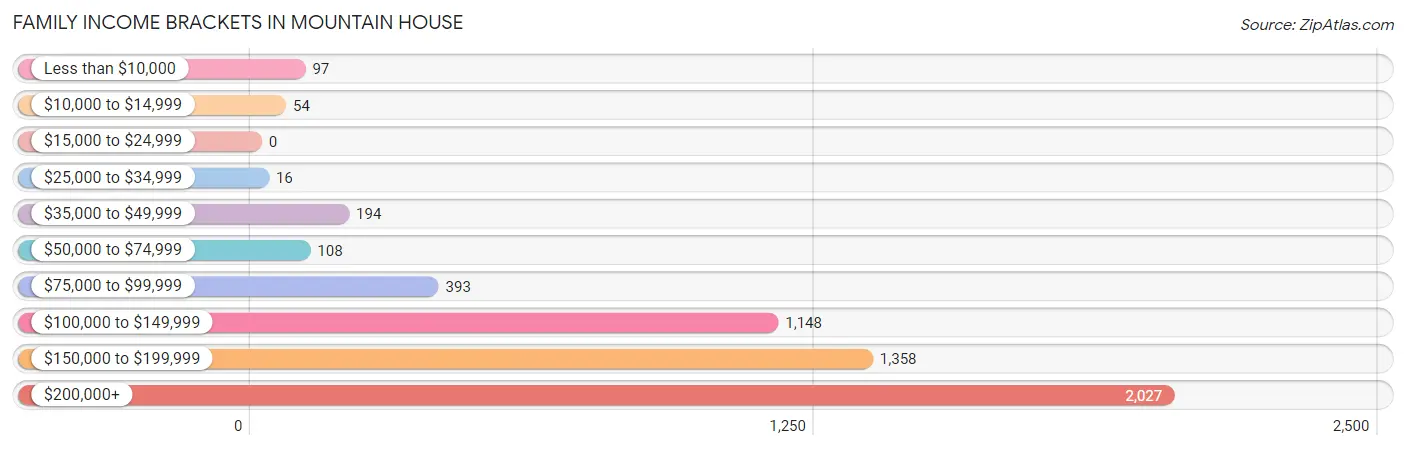
| Income Bracket | # Families | % Families |
| Less than $10,000 | 97 | 1.8% |
| $10,000 to $14,999 | 54 | 1.0% |
| $15,000 to $24,999 | 0 | 0.0% |
| $25,000 to $34,999 | 16 | 0.3% |
| $35,000 to $49,999 | 194 | 3.6% |
| $50,000 to $74,999 | 108 | 2.0% |
| $75,000 to $99,999 | 393 | 7.3% |
| $100,000 to $149,999 | 1,148 | 21.3% |
| $150,000 to $199,999 | 1,358 | 25.2% |
| $200,000+ | 2,027 | 37.6% |
Family Income by Famaliy Size in Mountain House
7+ person families (180 | 3.3%) account for the highest median family income in Mountain House with $250,001 per family, while 2-person families (812 | 15.1%) have the highest median income of $67,819 per family member.
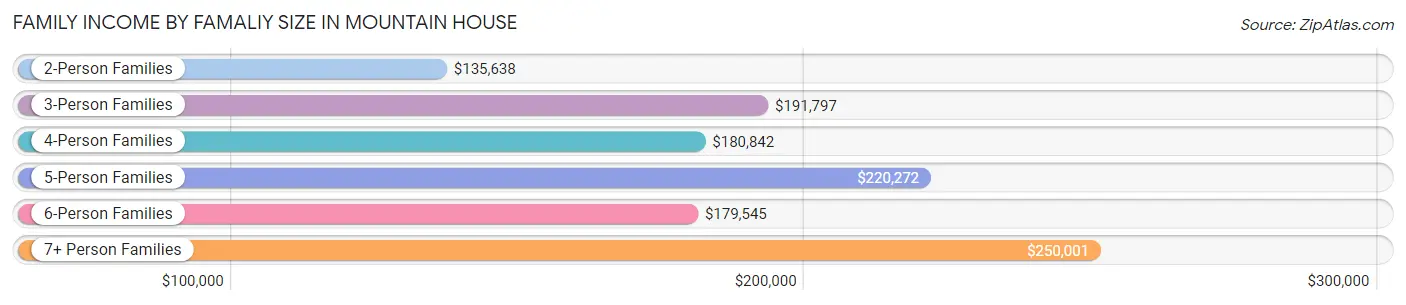
| Income Bracket | # Families | Median Income |
| 2-Person Families | 812 (15.1%) | $135,638 |
| 3-Person Families | 1,075 (19.9%) | $191,797 |
| 4-Person Families | 2,038 (37.8%) | $180,842 |
| 5-Person Families | 673 (12.5%) | $220,272 |
| 6-Person Families | 612 (11.4%) | $179,545 |
| 7+ Person Families | 180 (3.3%) | $250,001 |
| Total | 5,390 (100.0%) | $174,130 |
Family Income by Number of Earners in Mountain House
The median family income in Mountain House is $174,130, with families comprising 2 earners (2,529) having the highest median family income of $190,293, while families with no earners (405) have the lowest median family income of $78,573, accounting for 46.9% and 7.5% of families, respectively.
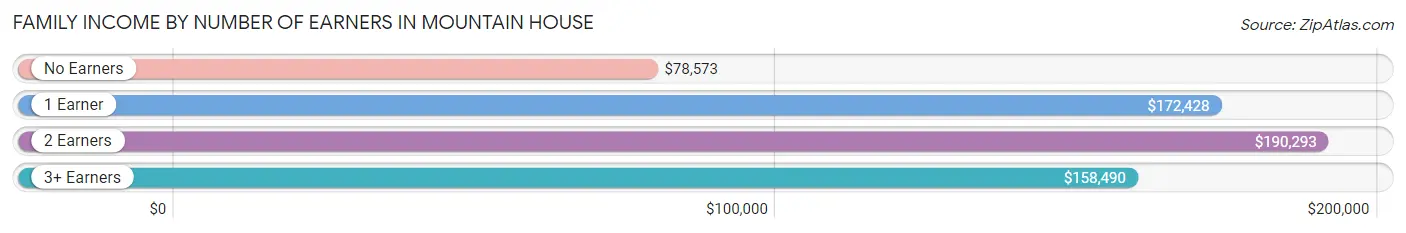
| Number of Earners | # Families | Median Income |
| No Earners | 405 (7.5%) | $78,573 |
| 1 Earner | 1,463 (27.1%) | $172,428 |
| 2 Earners | 2,529 (46.9%) | $190,293 |
| 3+ Earners | 993 (18.4%) | $158,490 |
| Total | 5,390 (100.0%) | $174,130 |
Household Income in Mountain House
Household Income Brackets in Mountain House
With 2,174 households falling in the category, the $200,000+ income range is the most frequent in Mountain House, accounting for 35.3% of all households. In contrast, only 31 households (0.5%) fall into the $15,000 to $24,999 income bracket, making it the least populous group.
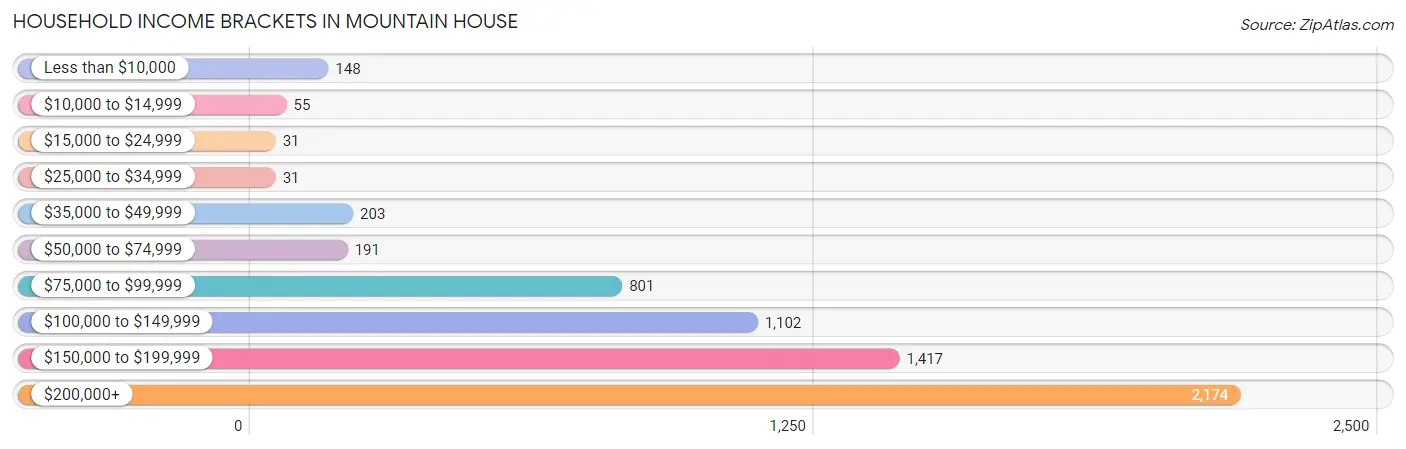
| Income Bracket | # Households | % Households |
| Less than $10,000 | 148 | 2.4% |
| $10,000 to $14,999 | 55 | 0.9% |
| $15,000 to $24,999 | 31 | 0.5% |
| $25,000 to $34,999 | 31 | 0.5% |
| $35,000 to $49,999 | 203 | 3.3% |
| $50,000 to $74,999 | 191 | 3.1% |
| $75,000 to $99,999 | 801 | 13.0% |
| $100,000 to $149,999 | 1,102 | 17.9% |
| $150,000 to $199,999 | 1,417 | 23.0% |
| $200,000+ | 2,174 | 35.3% |
Household Income by Householder Age in Mountain House
The median household income in Mountain House is $166,821, with the highest median household income of $181,474 found in the 25 to 44 years age bracket for the primary householder. A total of 2,702 households (43.9%) fall into this category. Meanwhile, the 15 to 24 years age bracket for the primary householder has the lowest median household income of $0, with 80 households (1.3%) in this group.
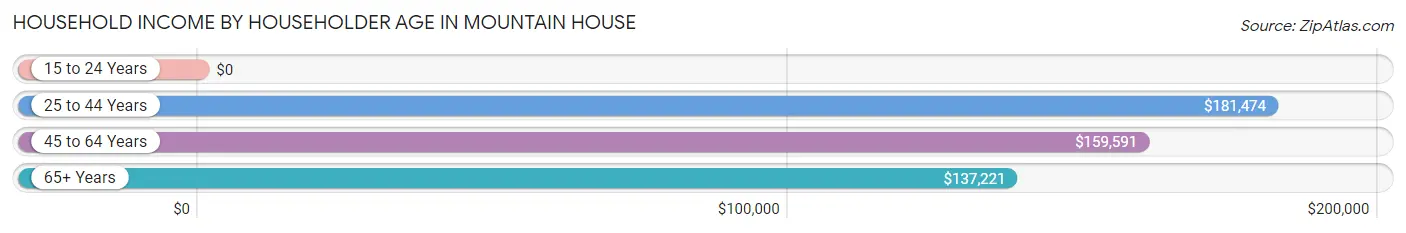
| Income Bracket | # Households | Median Income |
| 15 to 24 Years | 80 (1.3%) | $0 |
| 25 to 44 Years | 2,702 (43.9%) | $181,474 |
| 45 to 64 Years | 3,050 (49.5%) | $159,591 |
| 65+ Years | 327 (5.3%) | $137,221 |
| Total | 6,159 (100.0%) | $166,821 |
Poverty in Mountain House
Income Below Poverty by Sex and Age in Mountain House
With 3.9% poverty level for males and 3.1% for females among the residents of Mountain House, 12 to 14 year old males and under 5 year old females are the most vulnerable to poverty, with 81 males (10.6%) and 52 females (6.9%) in their respective age groups living below the poverty level.
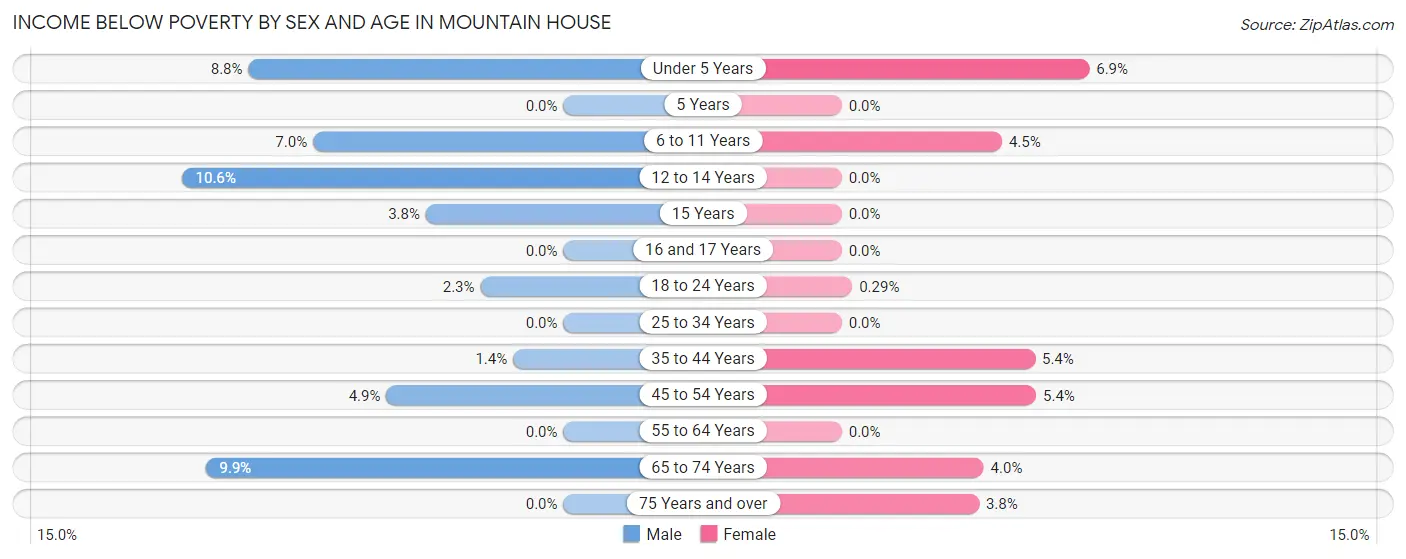
| Age Bracket | Male | Female |
| Under 5 Years | 57 (8.8%) | 52 (6.9%) |
| 5 Years | 0 (0.0%) | 0 (0.0%) |
| 6 to 11 Years | 101 (7.0%) | 55 (4.5%) |
| 12 to 14 Years | 81 (10.6%) | 0 (0.0%) |
| 15 Years | 10 (3.8%) | 0 (0.0%) |
| 16 and 17 Years | 0 (0.0%) | 0 (0.0%) |
| 18 to 24 Years | 37 (2.3%) | 3 (0.3%) |
| 25 to 34 Years | 0 (0.0%) | 0 (0.0%) |
| 35 to 44 Years | 28 (1.4%) | 114 (5.4%) |
| 45 to 54 Years | 85 (4.9%) | 90 (5.4%) |
| 55 to 64 Years | 0 (0.0%) | 0 (0.0%) |
| 65 to 74 Years | 70 (9.9%) | 28 (4.0%) |
| 75 Years and over | 0 (0.0%) | 13 (3.8%) |
| Total | 469 (3.9%) | 355 (3.1%) |
Income Above Poverty by Sex and Age in Mountain House
According to the poverty statistics in Mountain House, males aged 5 years and females aged 5 years are the age groups that are most secure financially, with 100.0% of males and 100.0% of females in these age groups living above the poverty line.
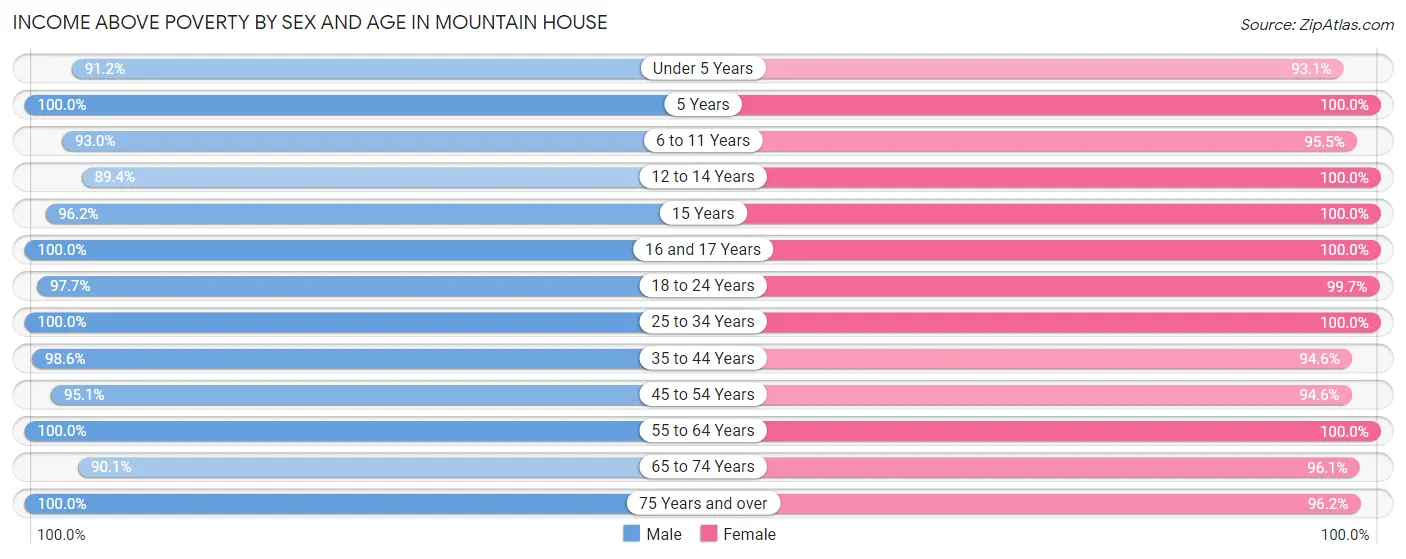
| Age Bracket | Male | Female |
| Under 5 Years | 593 (91.2%) | 703 (93.1%) |
| 5 Years | 42 (100.0%) | 169 (100.0%) |
| 6 to 11 Years | 1,348 (93.0%) | 1,177 (95.5%) |
| 12 to 14 Years | 683 (89.4%) | 701 (100.0%) |
| 15 Years | 251 (96.2%) | 139 (100.0%) |
| 16 and 17 Years | 643 (100.0%) | 415 (100.0%) |
| 18 to 24 Years | 1,562 (97.7%) | 1,025 (99.7%) |
| 25 to 34 Years | 1,096 (100.0%) | 1,014 (100.0%) |
| 35 to 44 Years | 1,972 (98.6%) | 2,004 (94.6%) |
| 45 to 54 Years | 1,638 (95.1%) | 1,574 (94.6%) |
| 55 to 64 Years | 1,033 (100.0%) | 1,110 (100.0%) |
| 65 to 74 Years | 634 (90.1%) | 681 (96.1%) |
| 75 Years and over | 103 (100.0%) | 327 (96.2%) |
| Total | 11,598 (96.1%) | 11,039 (96.9%) |
Income Below Poverty Among Married-Couple Families in Mountain House
The poverty statistics for married-couple families in Mountain House show that 2.3% or 114 of the total 4,928 families live below the poverty line. Families with 1 or 2 children have the highest poverty rate of 3.6%, comprising of 103 families. On the other hand, families with no children have the lowest poverty rate of 0.0%, which includes 0 families.
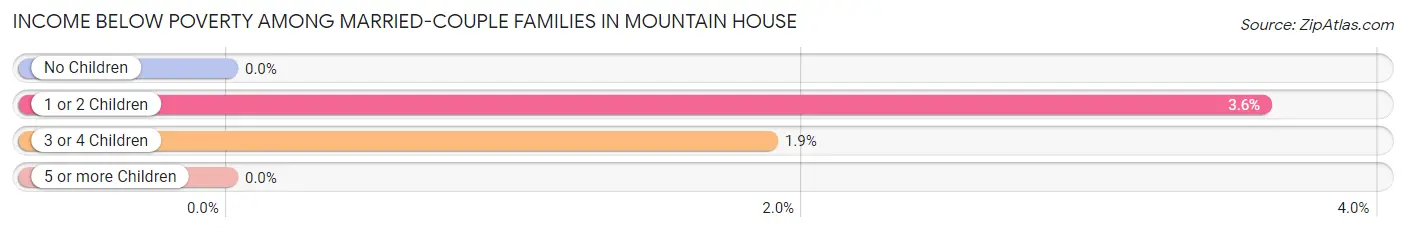
| Children | Above Poverty | Below Poverty |
| No Children | 1,479 (100.0%) | 0 (0.0%) |
| 1 or 2 Children | 2,761 (96.4%) | 103 (3.6%) |
| 3 or 4 Children | 574 (98.1%) | 11 (1.9%) |
| 5 or more Children | 0 (0.0%) | 0 (0.0%) |
| Total | 4,814 (97.7%) | 114 (2.3%) |
Income Below Poverty Among Single-Parent Households in Mountain House
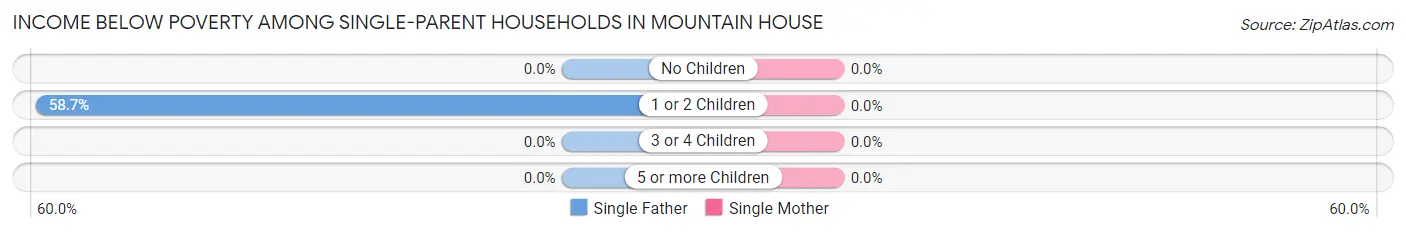
| Children | Single Father | Single Mother |
| No Children | 0 (0.0%) | 0 (0.0%) |
| 1 or 2 Children | 37 (58.7%) | 0 (0.0%) |
| 3 or 4 Children | 0 (0.0%) | 0 (0.0%) |
| 5 or more Children | 0 (0.0%) | 0 (0.0%) |
| Total | 37 (23.6%) | 0 (0.0%) |
Income Below Poverty Among Married-Couple vs Single-Parent Households in Mountain House
The poverty data for Mountain House shows that 114 of the married-couple family households (2.3%) and 37 of the single-parent households (8.0%) are living below the poverty level. Within the married-couple family households, those with 1 or 2 children have the highest poverty rate, with 103 households (3.6%) falling below the poverty line. Among the single-parent households, those with 1 or 2 children have the highest poverty rate, with 37 household (22.0%) living below poverty.
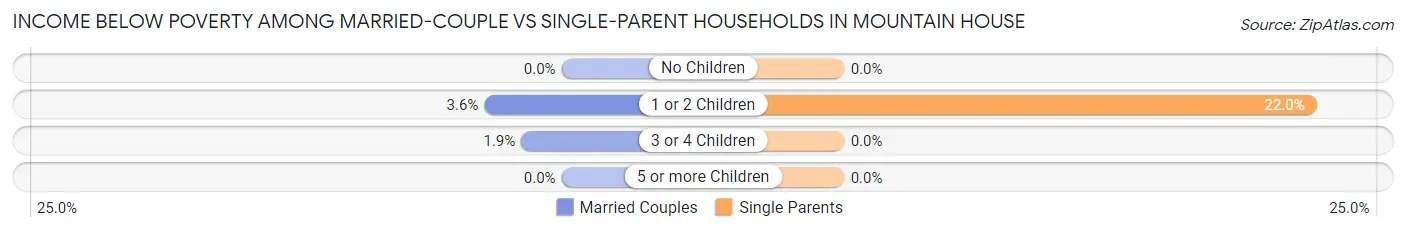
| Children | Married-Couple Families | Single-Parent Households |
| No Children | 0 (0.0%) | 0 (0.0%) |
| 1 or 2 Children | 103 (3.6%) | 37 (22.0%) |
| 3 or 4 Children | 11 (1.9%) | 0 (0.0%) |
| 5 or more Children | 0 (0.0%) | 0 (0.0%) |
| Total | 114 (2.3%) | 37 (8.0%) |
Race in Mountain House
The most populous races in Mountain House are Asian (12,310 | 52.2%), White / Caucasian (7,542 | 32.0%), and Hispanic or Latino (2,950 | 12.5%).
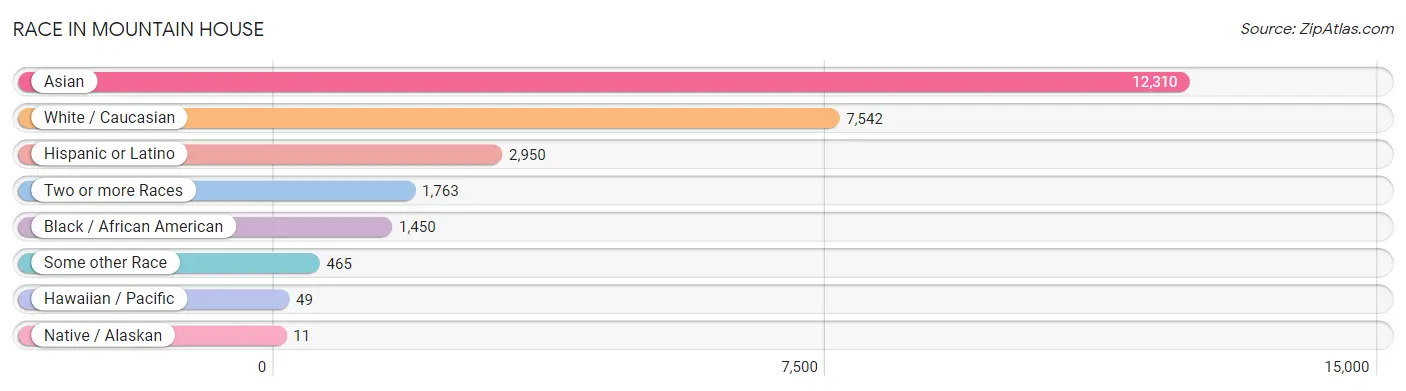
| Race | # Population | % Population |
| Asian | 12,310 | 52.2% |
| Black / African American | 1,450 | 6.1% |
| Hawaiian / Pacific | 49 | 0.2% |
| Hispanic or Latino | 2,950 | 12.5% |
| Native / Alaskan | 11 | 0.1% |
| White / Caucasian | 7,542 | 32.0% |
| Two or more Races | 1,763 | 7.5% |
| Some other Race | 465 | 2.0% |
| Total | 23,590 | 100.0% |
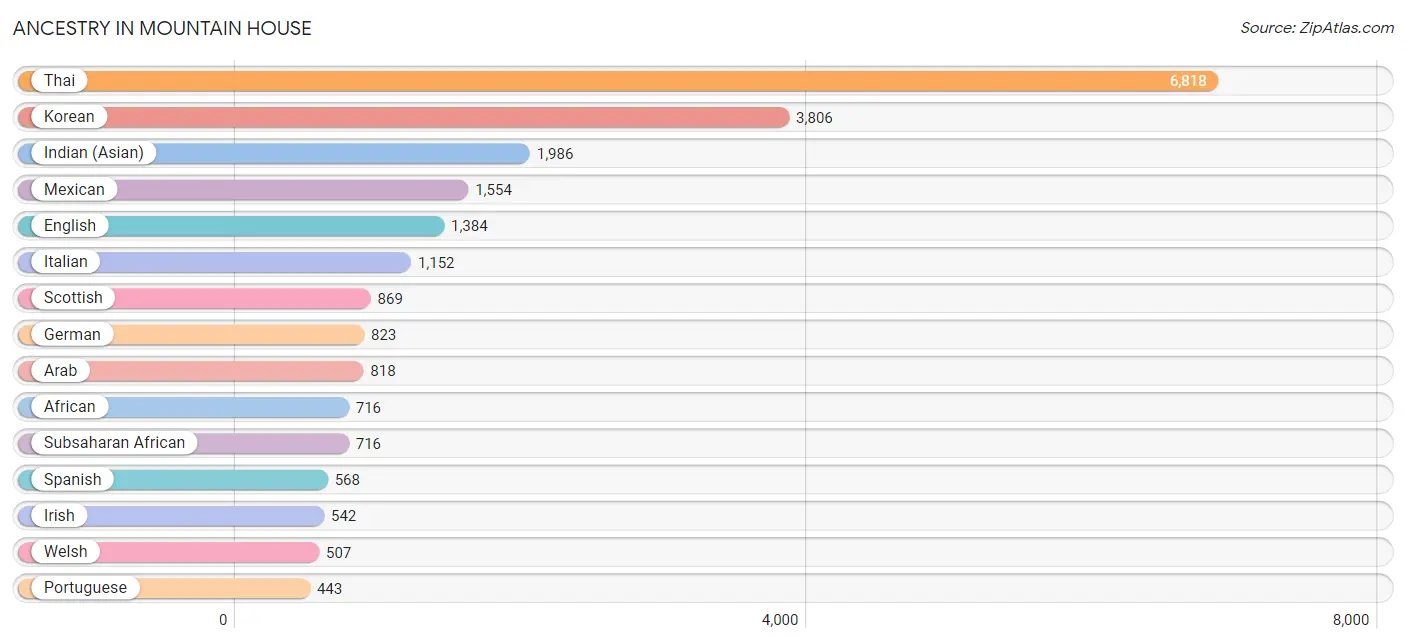
Ancestry in Mountain House
The most populous ancestries reported in Mountain House are Thai (6,818 | 28.9%), Korean (3,806 | 16.1%), Indian (Asian) (1,986 | 8.4%), Mexican (1,554 | 6.6%), and English (1,384 | 5.9%), together accounting for 65.9% of all Mountain House residents.
| Ancestry | # Population | % Population |
| Afghan | 48 | 0.2% |
| African | 716 | 3.0% |
| American | 33 | 0.1% |
| Arab | 818 | 3.5% |
| Argentinean | 79 | 0.3% |
| Austrian | 13 | 0.1% |
| Bhutanese | 398 | 1.7% |
| Bolivian | 34 | 0.1% |
| Burmese | 217 | 0.9% |
| Central American | 208 | 0.9% |
| Cherokee | 62 | 0.3% |
| Comanche | 32 | 0.1% |
| Cuban | 39 | 0.2% |
| Danish | 267 | 1.1% |
| Dutch | 115 | 0.5% |
| Ecuadorian | 31 | 0.1% |
| English | 1,384 | 5.9% |
| European | 243 | 1.0% |
| French | 176 | 0.7% |
| French Canadian | 38 | 0.2% |
| German | 823 | 3.5% |
| Greek | 226 | 1.0% |
| Guamanian / Chamorro | 86 | 0.4% |
| Hungarian | 13 | 0.1% |
| Icelander | 49 | 0.2% |
| Indian (Asian) | 1,986 | 8.4% |
| Irish | 542 | 2.3% |
| Italian | 1,152 | 4.9% |
| Jamaican | 27 | 0.1% |
| Korean | 3,806 | 16.1% |
| Laotian | 90 | 0.4% |
| Mexican | 1,554 | 6.6% |
| Native Hawaiian | 65 | 0.3% |
| Navajo | 18 | 0.1% |
| Nicaraguan | 44 | 0.2% |
| Norwegian | 252 | 1.1% |
| Panamanian | 14 | 0.1% |
| Polish | 111 | 0.5% |
| Portuguese | 443 | 1.9% |
| Puerto Rican | 51 | 0.2% |
| Russian | 82 | 0.4% |
| Salvadoran | 150 | 0.6% |
| Scandinavian | 17 | 0.1% |
| Scotch-Irish | 24 | 0.1% |
| Scottish | 869 | 3.7% |
| South American | 144 | 0.6% |
| Spaniard | 351 | 1.5% |
| Spanish | 568 | 2.4% |
| Sri Lankan | 296 | 1.3% |
| Subsaharan African | 716 | 3.0% |
| Swedish | 54 | 0.2% |
| Syrian | 105 | 0.4% |
| Thai | 6,818 | 28.9% |
| Trinidadian and Tobagonian | 35 | 0.2% |
| Welsh | 507 | 2.1% | View All 55 Rows |
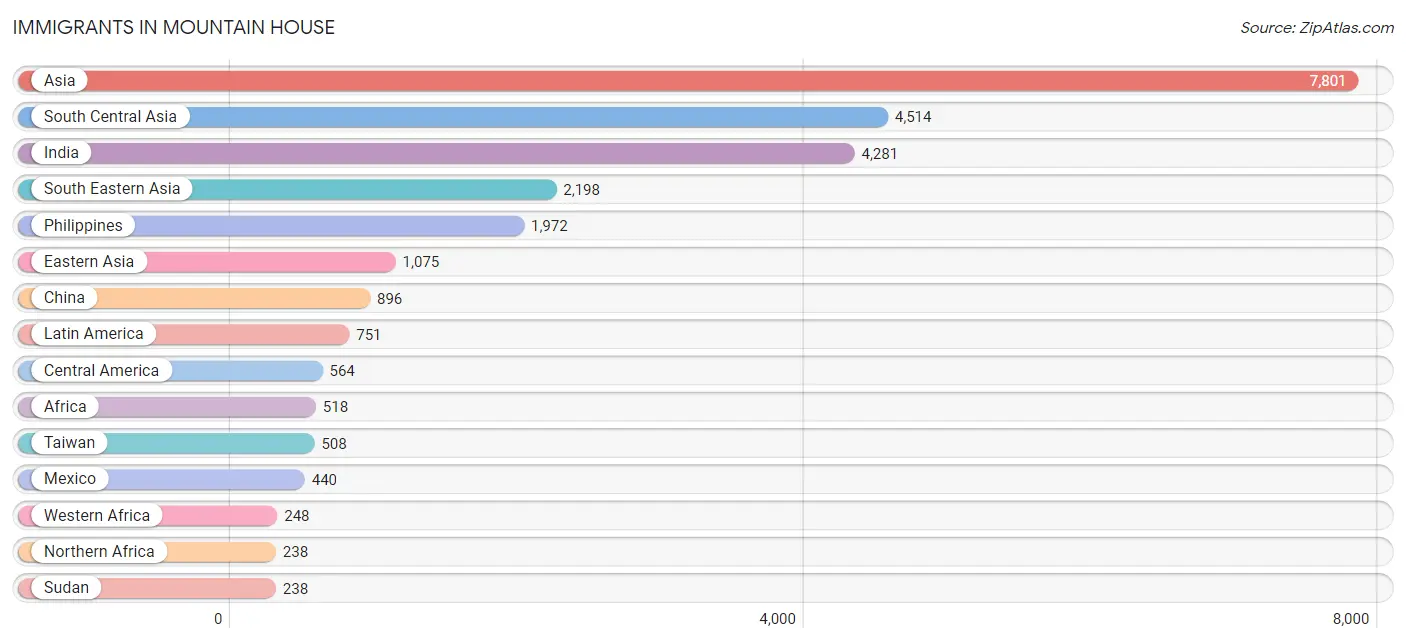
Immigrants in Mountain House
The most numerous immigrant groups reported in Mountain House came from Asia (7,801 | 33.1%), South Central Asia (4,514 | 19.1%), India (4,281 | 18.1%), South Eastern Asia (2,198 | 9.3%), and Philippines (1,972 | 8.4%), together accounting for 88.0% of all Mountain House residents.
| Immigration Origin | # Population | % Population |
| Afghanistan | 70 | 0.3% |
| Africa | 518 | 2.2% |
| Argentina | 79 | 0.3% |
| Asia | 7,801 | 33.1% |
| Cambodia | 20 | 0.1% |
| Canada | 30 | 0.1% |
| Caribbean | 74 | 0.3% |
| Central America | 564 | 2.4% |
| China | 896 | 3.8% |
| Cuba | 39 | 0.2% |
| Eastern Asia | 1,075 | 4.6% |
| Eastern Europe | 51 | 0.2% |
| El Salvador | 78 | 0.3% |
| Europe | 79 | 0.3% |
| Fiji | 49 | 0.2% |
| India | 4,281 | 18.1% |
| Japan | 109 | 0.5% |
| Korea | 70 | 0.3% |
| Latin America | 751 | 3.2% |
| Malaysia | 89 | 0.4% |
| Mexico | 440 | 1.9% |
| Middle Africa | 32 | 0.1% |
| Nicaragua | 28 | 0.1% |
| Nigeria | 212 | 0.9% |
| Northern Africa | 238 | 1.0% |
| Oceania | 49 | 0.2% |
| Pakistan | 163 | 0.7% |
| Panama | 18 | 0.1% |
| Philippines | 1,972 | 8.4% |
| Russia | 51 | 0.2% |
| South America | 113 | 0.5% |
| South Central Asia | 4,514 | 19.1% |
| South Eastern Asia | 2,198 | 9.3% |
| Southern Europe | 28 | 0.1% |
| Spain | 28 | 0.1% |
| Sudan | 238 | 1.0% |
| Taiwan | 508 | 2.1% |
| Trinidad and Tobago | 35 | 0.2% |
| Vietnam | 117 | 0.5% |
| Western Africa | 248 | 1.1% |
| Western Asia | 14 | 0.1% |
| Yemen | 14 | 0.1% | View All 42 Rows |
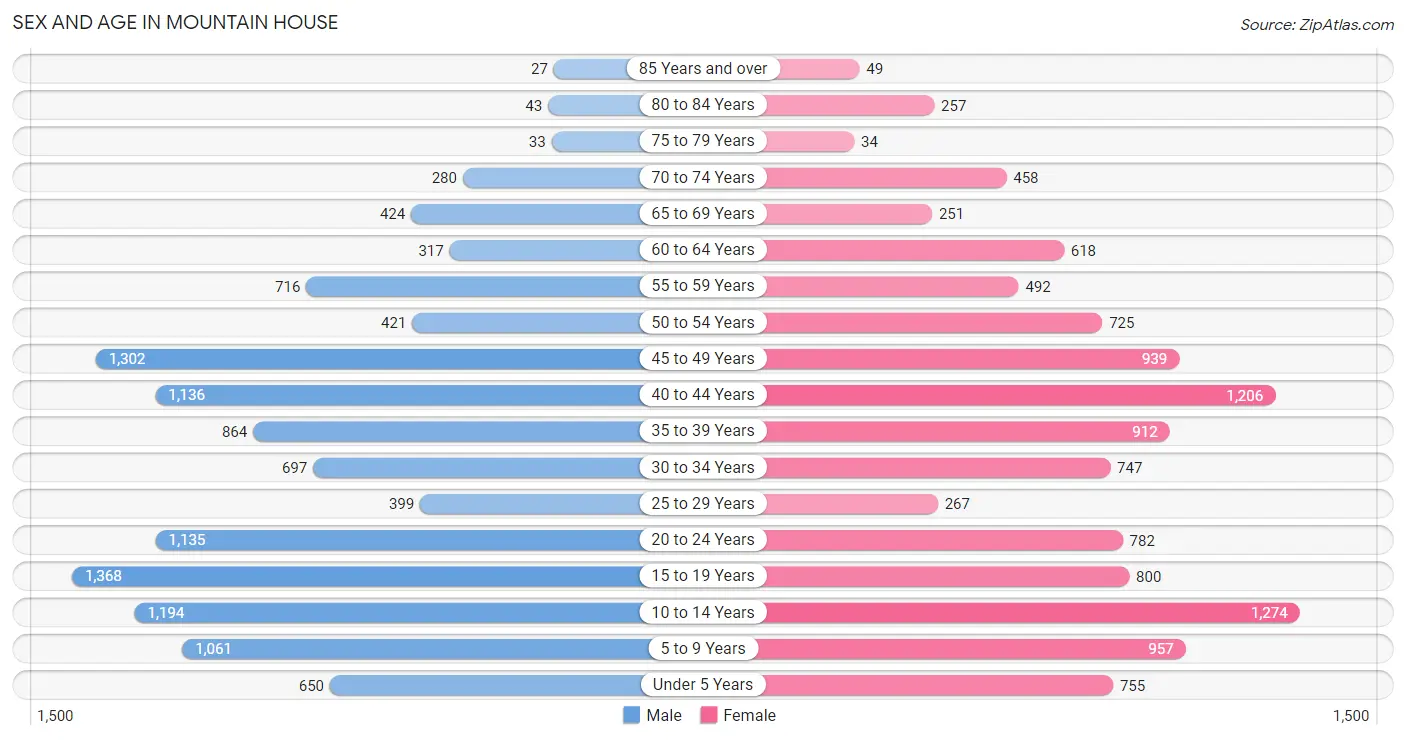
Sex and Age in Mountain House
Sex and Age in Mountain House
The most populous age groups in Mountain House are 15 to 19 Years (1,368 | 11.3%) for men and 10 to 14 Years (1,274 | 11.1%) for women.
| Age Bracket | Male | Female |
| Under 5 Years | 650 (5.4%) | 755 (6.6%) |
| 5 to 9 Years | 1,061 (8.8%) | 957 (8.3%) |
| 10 to 14 Years | 1,194 (9.9%) | 1,274 (11.1%) |
| 15 to 19 Years | 1,368 (11.3%) | 800 (6.9%) |
| 20 to 24 Years | 1,135 (9.4%) | 782 (6.8%) |
| 25 to 29 Years | 399 (3.3%) | 267 (2.3%) |
| 30 to 34 Years | 697 (5.8%) | 747 (6.5%) |
| 35 to 39 Years | 864 (7.2%) | 912 (7.9%) |
| 40 to 44 Years | 1,136 (9.4%) | 1,206 (10.5%) |
| 45 to 49 Years | 1,302 (10.8%) | 939 (8.2%) |
| 50 to 54 Years | 421 (3.5%) | 725 (6.3%) |
| 55 to 59 Years | 716 (5.9%) | 492 (4.3%) |
| 60 to 64 Years | 317 (2.6%) | 618 (5.4%) |
| 65 to 69 Years | 424 (3.5%) | 251 (2.2%) |
| 70 to 74 Years | 280 (2.3%) | 458 (4.0%) |
| 75 to 79 Years | 33 (0.3%) | 34 (0.3%) |
| 80 to 84 Years | 43 (0.4%) | 257 (2.2%) |
| 85 Years and over | 27 (0.2%) | 49 (0.4%) |
| Total | 12,067 (100.0%) | 11,523 (100.0%) |
Families and Households in Mountain House
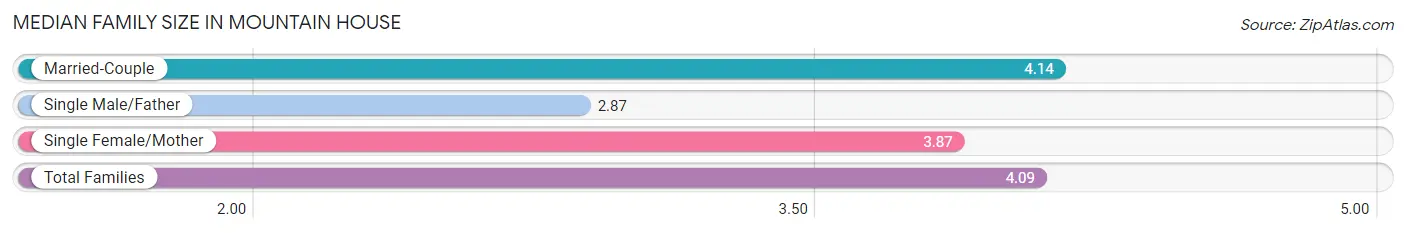
Median Family Size in Mountain House
The median family size in Mountain House is 4.09 persons per family, with married-couple families (4,928 | 91.4%) accounting for the largest median family size of 4.14 persons per family. On the other hand, single male/father families (157 | 2.9%) represent the smallest median family size with 2.87 persons per family.
| Family Type | # Families | Family Size |
| Married-Couple | 4,928 (91.4%) | 4.14 |
| Single Male/Father | 157 (2.9%) | 2.87 |
| Single Female/Mother | 305 (5.7%) | 3.87 |
| Total Families | 5,390 (100.0%) | 4.09 |
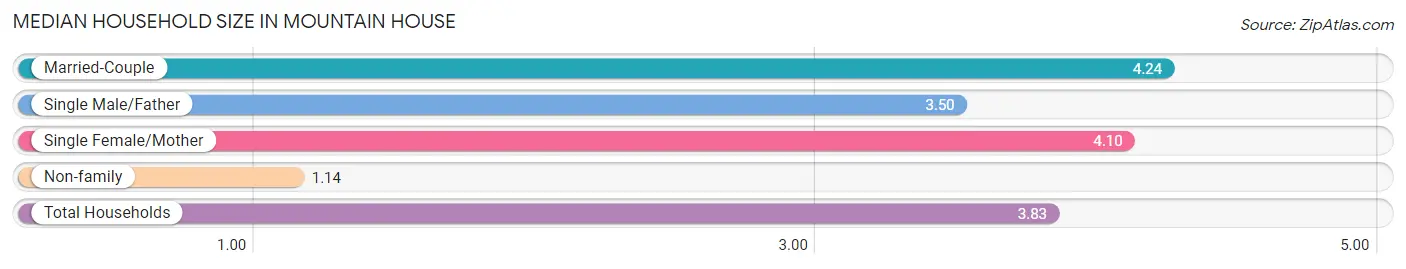
Median Household Size in Mountain House
The median household size in Mountain House is 3.83 persons per household, with married-couple households (4,928 | 80.0%) accounting for the largest median household size of 4.24 persons per household. non-family households (769 | 12.5%) represent the smallest median household size with 1.14 persons per household.
| Household Type | # Households | Household Size |
| Married-Couple | 4,928 (80.0%) | 4.24 |
| Single Male/Father | 157 (2.5%) | 3.50 |
| Single Female/Mother | 305 (5.0%) | 4.10 |
| Non-family | 769 (12.5%) | 1.14 |
| Total Households | 6,159 (100.0%) | 3.83 |
Household Size by Marriage Status in Mountain House
Out of a total of 6,159 households in Mountain House, 5,390 (87.5%) are family households, while 769 (12.5%) are nonfamily households. The most numerous type of family households are 4-person households, comprising 2,105, and the most common type of nonfamily households are 1-person households, comprising 709.
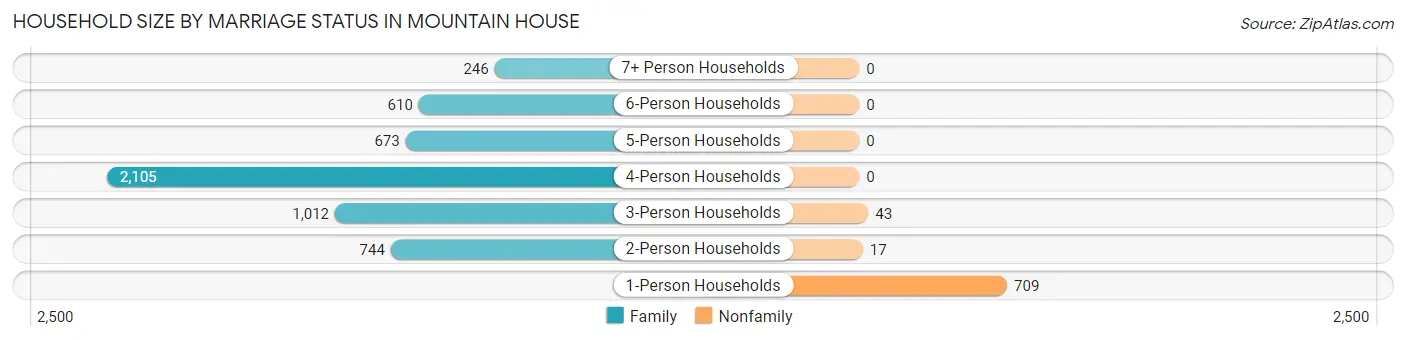
| Household Size | Family Households | Nonfamily Households |
| 1-Person Households | - | 709 (11.5%) |
| 2-Person Households | 744 (12.1%) | 17 (0.3%) |
| 3-Person Households | 1,012 (16.4%) | 43 (0.7%) |
| 4-Person Households | 2,105 (34.2%) | 0 (0.0%) |
| 5-Person Households | 673 (10.9%) | 0 (0.0%) |
| 6-Person Households | 610 (9.9%) | 0 (0.0%) |
| 7+ Person Households | 246 (4.0%) | 0 (0.0%) |
| Total | 5,390 (87.5%) | 769 (12.5%) |
Female Fertility in Mountain House
Fertility by Age in Mountain House
Average fertility rate in Mountain House is 56.0 births per 1,000 women. Women in the age bracket of 20 to 34 years have the highest fertility rate with 143.0 births per 1,000 women. Women in the age bracket of 20 to 34 years acount for 79.0% of all women with births.
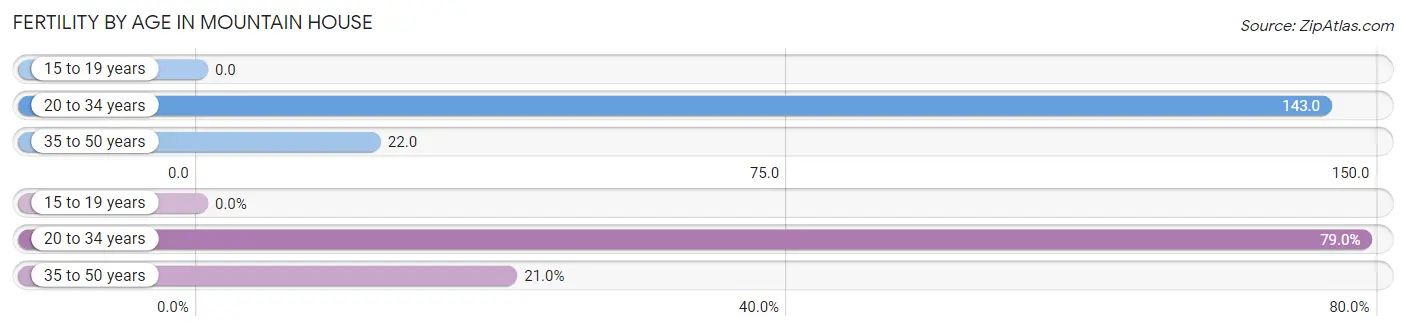
| Age Bracket | Women with Births | Births / 1,000 Women |
| 15 to 19 years | 0 (0.0%) | 0.0 |
| 20 to 34 years | 256 (79.0%) | 143.0 |
| 35 to 50 years | 68 (21.0%) | 22.0 |
| Total | 324 (100.0%) | 56.0 |
Fertility by Age by Marriage Status in Mountain House
54.0% of women with births (324) in Mountain House are married. The highest percentage of unmarried women with births falls into 20 to 34 years age bracket with 48.8% of them unmarried at the time of birth, while the lowest percentage of unmarried women with births belong to 35 to 50 years age bracket with 35.3% of them unmarried.
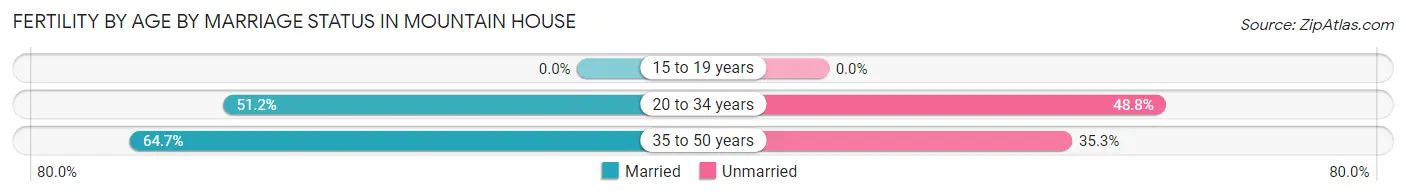
| Age Bracket | Married | Unmarried |
| 15 to 19 years | 0 (0.0%) | 0 (0.0%) |
| 20 to 34 years | 131 (51.2%) | 125 (48.8%) |
| 35 to 50 years | 44 (64.7%) | 24 (35.3%) |
| Total | 175 (54.0%) | 149 (46.0%) |
Fertility by Education in Mountain House
Average fertility rate in Mountain House is 56.0 births per 1,000 women. Women with the education attainment of high school diploma have the highest fertility rate of 184.0 births per 1,000 women, while women with the education attainment of less than high school have the lowest fertility at 39.0 births per 1,000 women. Women with the education attainment of high school diploma represent 30.6% of all women with births.
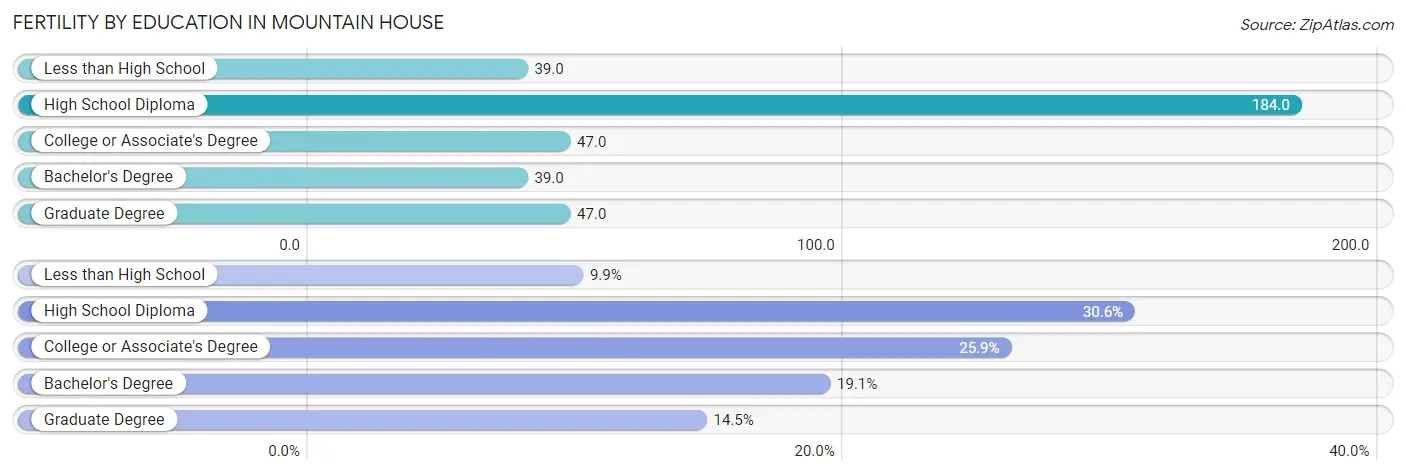
| Educational Attainment | Women with Births | Births / 1,000 Women |
| Less than High School | 32 (9.9%) | 39.0 |
| High School Diploma | 99 (30.6%) | 184.0 |
| College or Associate's Degree | 84 (25.9%) | 47.0 |
| Bachelor's Degree | 62 (19.1%) | 39.0 |
| Graduate Degree | 47 (14.5%) | 47.0 |
| Total | 324 (100.0%) | 56.0 |
Fertility by Education by Marriage Status in Mountain House
46.0% of women with births in Mountain House are unmarried. Women with the educational attainment of less than high school are most likely to be married with 100.0% of them married at childbirth, while women with the educational attainment of college or associate's degree are least likely to be married with 85.7% of them unmarried at childbirth.
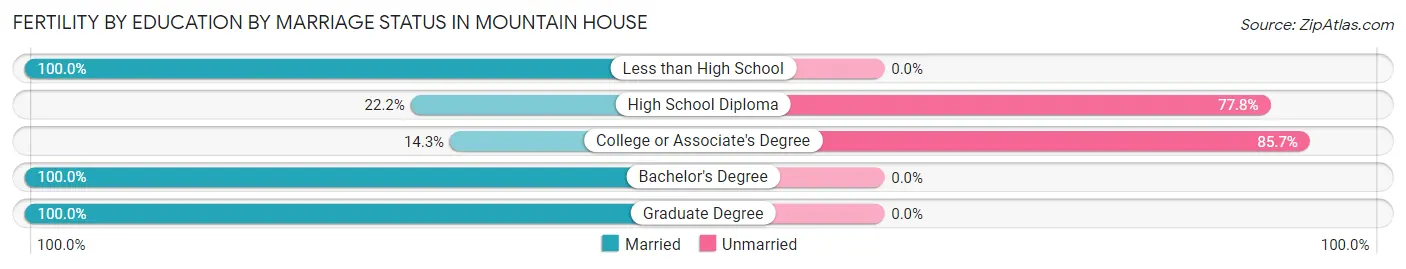
| Educational Attainment | Married | Unmarried |
| Less than High School | 32 (100.0%) | 0 (0.0%) |
| High School Diploma | 22 (22.2%) | 77 (77.8%) |
| College or Associate's Degree | 12 (14.3%) | 72 (85.7%) |
| Bachelor's Degree | 62 (100.0%) | 0 (0.0%) |
| Graduate Degree | 47 (100.0%) | 0 (0.0%) |
| Total | 175 (54.0%) | 149 (46.0%) |
Employment Characteristics in Mountain House
Employment by Class of Employer in Mountain House
Among the 9,733 employed individuals in Mountain House, private company employees (7,352 | 75.5%), not-for-profit organizations (705 | 7.2%), and local government employees (608 | 6.2%) make up the most common classes of employment.
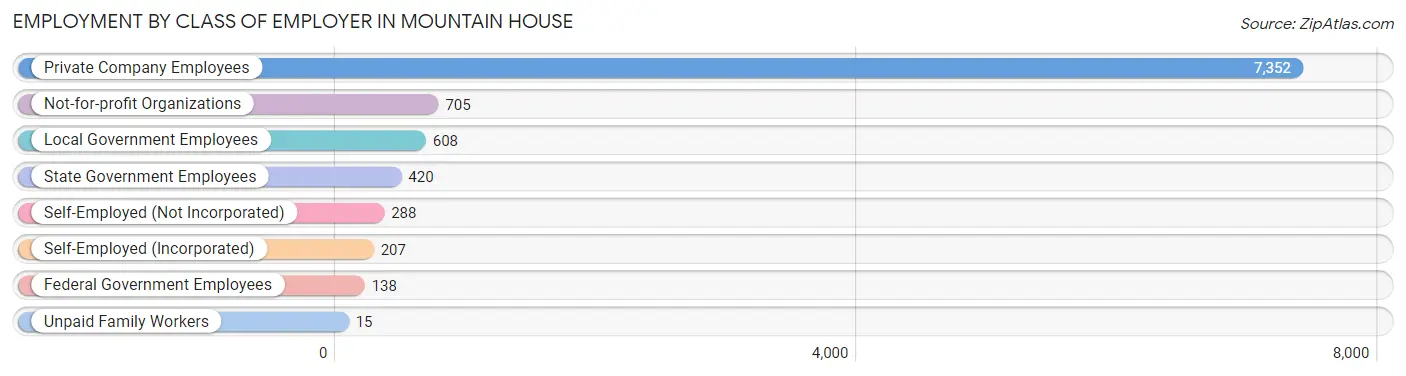
| Employer Class | # Employees | % Employees |
| Private Company Employees | 7,352 | 75.5% |
| Self-Employed (Incorporated) | 207 | 2.1% |
| Self-Employed (Not Incorporated) | 288 | 3.0% |
| Not-for-profit Organizations | 705 | 7.2% |
| Local Government Employees | 608 | 6.2% |
| State Government Employees | 420 | 4.3% |
| Federal Government Employees | 138 | 1.4% |
| Unpaid Family Workers | 15 | 0.2% |
| Total | 9,733 | 100.0% |
Employment Status by Age in Mountain House
According to the labor force statistics for Mountain House, out of the total population over 16 years of age (17,299), 64.8% or 11,210 individuals are in the labor force, with 3.6% or 404 of them unemployed. The age group with the highest labor force participation rate is 25 to 29 years, with 89.0% or 593 individuals in the labor force. Within the labor force, the 16 to 19 years age range has the highest percentage of unemployed individuals, with 14.6% or 54 of them being unemployed.
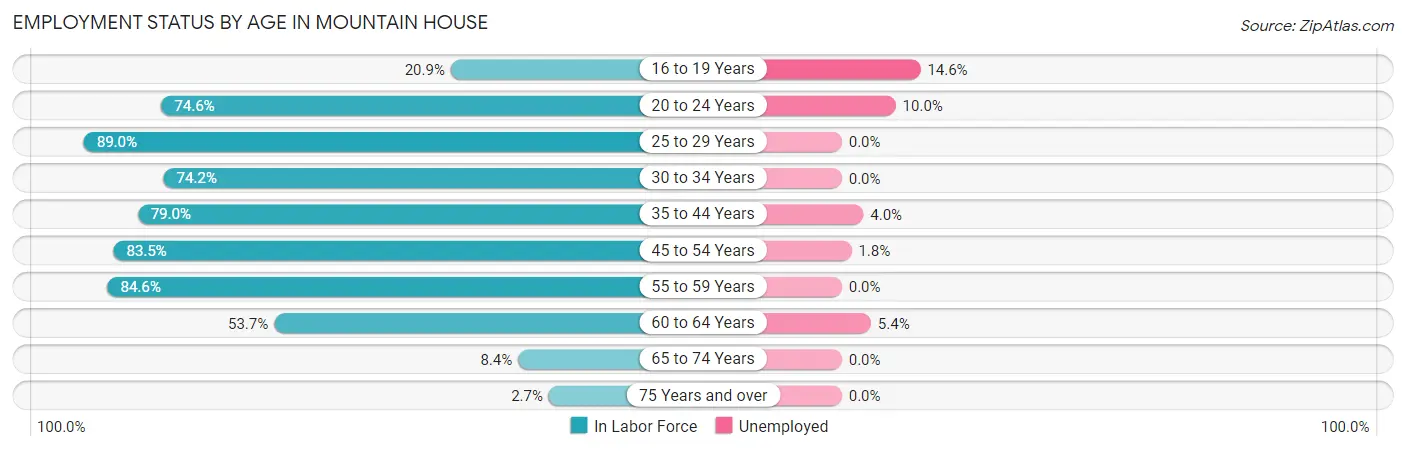
| Age Bracket | In Labor Force | Unemployed |
| 16 to 19 Years | 370 (20.9%) | 54 (14.6%) |
| 20 to 24 Years | 1,430 (74.6%) | 143 (10.0%) |
| 25 to 29 Years | 593 (89.0%) | 0 (0.0%) |
| 30 to 34 Years | 1,071 (74.2%) | 0 (0.0%) |
| 35 to 44 Years | 3,253 (79.0%) | 130 (4.0%) |
| 45 to 54 Years | 2,828 (83.5%) | 51 (1.8%) |
| 55 to 59 Years | 1,022 (84.6%) | 0 (0.0%) |
| 60 to 64 Years | 502 (53.7%) | 27 (5.4%) |
| 65 to 74 Years | 119 (8.4%) | 0 (0.0%) |
| 75 Years and over | 12 (2.7%) | 0 (0.0%) |
| Total | 11,210 (64.8%) | 404 (3.6%) |
Employment Status by Educational Attainment in Mountain House
According to labor force statistics for Mountain House, 78.9% of individuals (9,277) out of the total population between 25 and 64 years of age (11,758) are in the labor force, with 2.2% or 204 of them being unemployed. The group with the highest labor force participation rate are those with the educational attainment of college / associate degree, with 87.4% or 2,875 individuals in the labor force. Within the labor force, individuals with college / associate degree education have the highest percentage of unemployment, with 3.7% or 106 of them being unemployed.
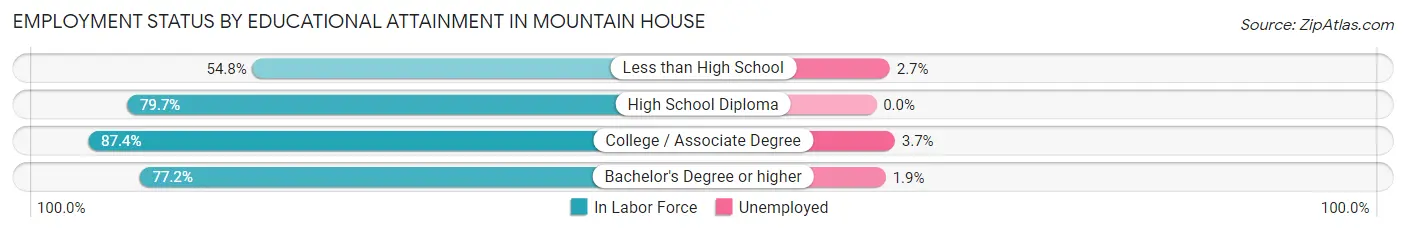
| Educational Attainment | In Labor Force | Unemployed |
| Less than High School | 440 (54.8%) | 22 (2.7%) |
| High School Diploma | 1,315 (79.7%) | 0 (0.0%) |
| College / Associate Degree | 2,875 (87.4%) | 122 (3.7%) |
| Bachelor's Degree or higher | 4,644 (77.2%) | 114 (1.9%) |
| Total | 9,277 (78.9%) | 259 (2.2%) |
Employment Occupations by Sex in Mountain House
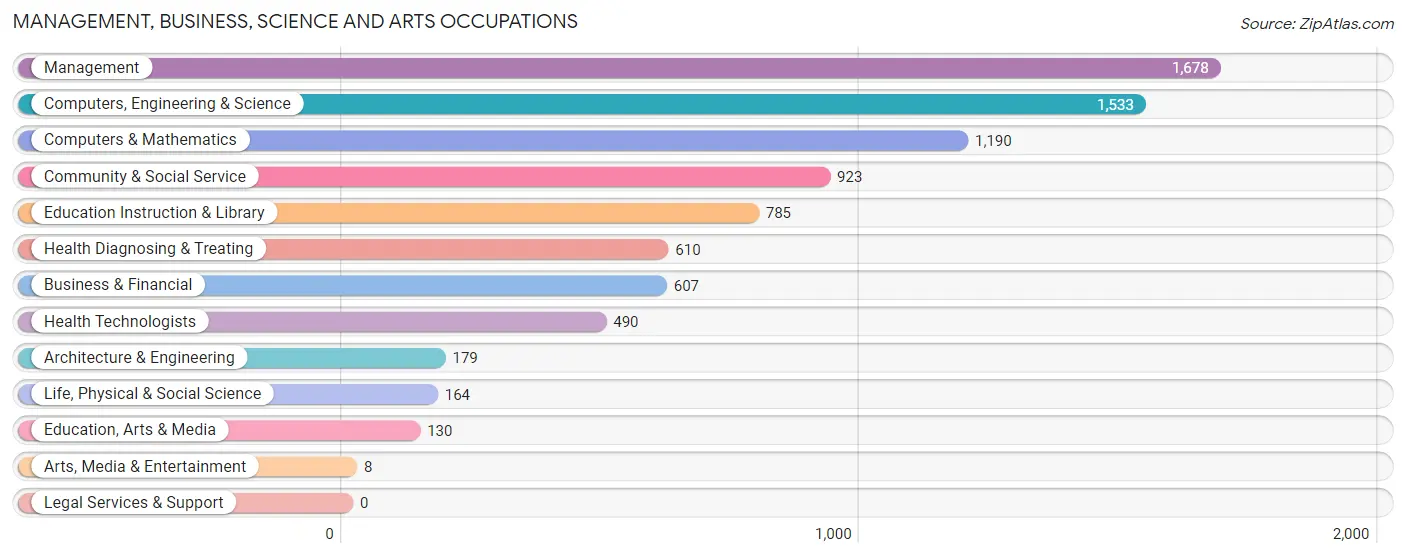
Management, Business, Science and Arts Occupations
The most common Management, Business, Science and Arts occupations in Mountain House are Management (1,678 | 15.5%), Computers, Engineering & Science (1,533 | 14.2%), Computers & Mathematics (1,190 | 11.0%), Community & Social Service (923 | 8.6%), and Education Instruction & Library (785 | 7.3%).
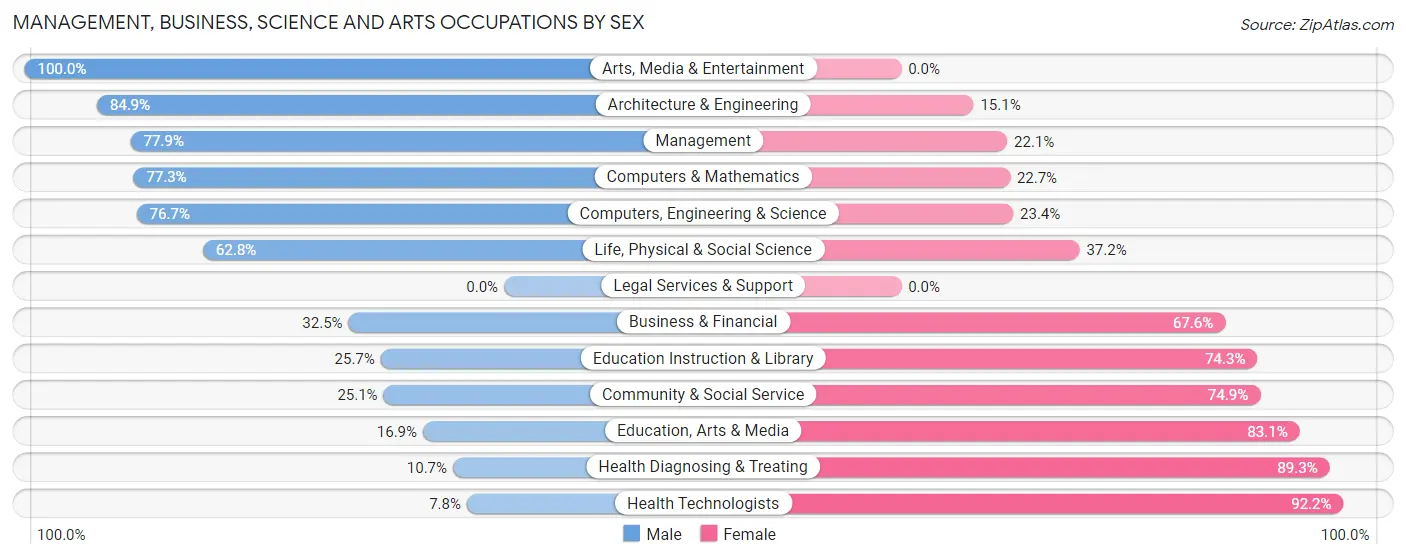
Management, Business, Science and Arts Occupations by Sex
Within the Management, Business, Science and Arts occupations in Mountain House, the most male-oriented occupations are Arts, Media & Entertainment (100.0%), Architecture & Engineering (84.9%), and Management (77.9%), while the most female-oriented occupations are Health Technologists (92.2%), Health Diagnosing & Treating (89.3%), and Education, Arts & Media (83.1%).
| Occupation | Male | Female |
| Management | 1,307 (77.9%) | 371 (22.1%) |
| Business & Financial | 197 (32.5%) | 410 (67.5%) |
| Computers, Engineering & Science | 1,175 (76.6%) | 358 (23.4%) |
| Computers & Mathematics | 920 (77.3%) | 270 (22.7%) |
| Architecture & Engineering | 152 (84.9%) | 27 (15.1%) |
| Life, Physical & Social Science | 103 (62.8%) | 61 (37.2%) |
| Community & Social Service | 232 (25.1%) | 691 (74.9%) |
| Education, Arts & Media | 22 (16.9%) | 108 (83.1%) |
| Legal Services & Support | 0 (0.0%) | 0 (0.0%) |
| Education Instruction & Library | 202 (25.7%) | 583 (74.3%) |
| Arts, Media & Entertainment | 8 (100.0%) | 0 (0.0%) |
| Health Diagnosing & Treating | 65 (10.7%) | 545 (89.3%) |
| Health Technologists | 38 (7.8%) | 452 (92.2%) |
| Total (Category) | 2,976 (55.6%) | 2,375 (44.4%) |
| Total (Overall) | 6,340 (58.7%) | 4,458 (41.3%) |
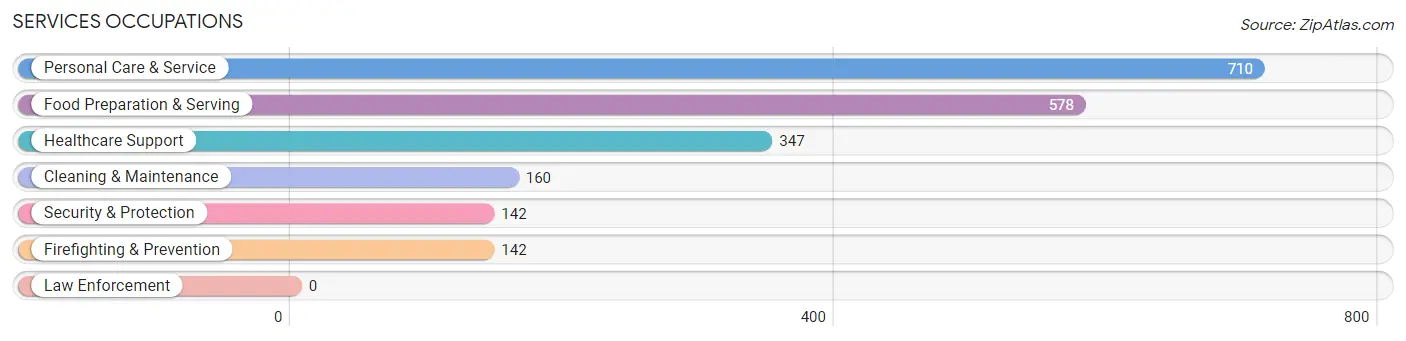
Services Occupations
The most common Services occupations in Mountain House are Personal Care & Service (710 | 6.6%), Food Preparation & Serving (578 | 5.3%), Healthcare Support (347 | 3.2%), Cleaning & Maintenance (160 | 1.5%), and Security & Protection (142 | 1.3%).
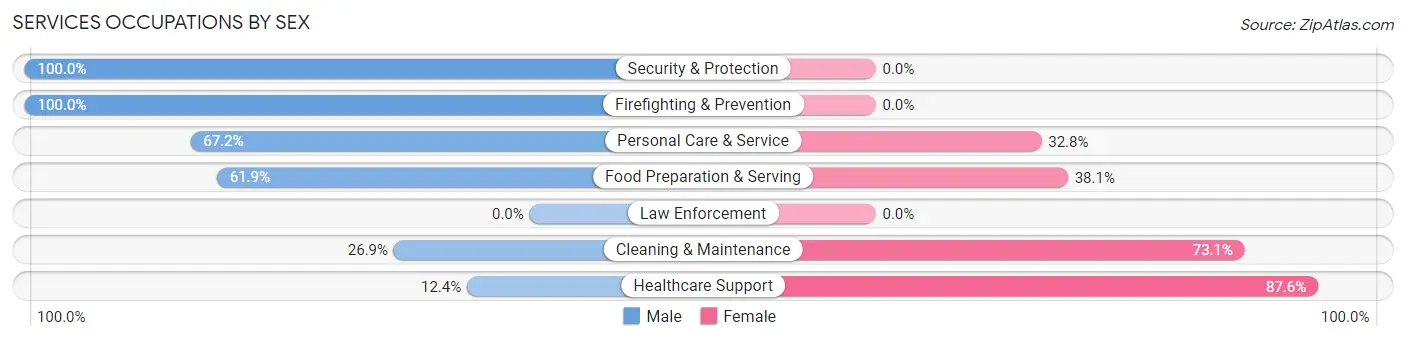
Services Occupations by Sex
Within the Services occupations in Mountain House, the most male-oriented occupations are Security & Protection (100.0%), Firefighting & Prevention (100.0%), and Personal Care & Service (67.2%), while the most female-oriented occupations are Healthcare Support (87.6%), Cleaning & Maintenance (73.1%), and Food Preparation & Serving (38.1%).
| Occupation | Male | Female |
| Healthcare Support | 43 (12.4%) | 304 (87.6%) |
| Security & Protection | 142 (100.0%) | 0 (0.0%) |
| Firefighting & Prevention | 142 (100.0%) | 0 (0.0%) |
| Law Enforcement | 0 (0.0%) | 0 (0.0%) |
| Food Preparation & Serving | 358 (61.9%) | 220 (38.1%) |
| Cleaning & Maintenance | 43 (26.9%) | 117 (73.1%) |
| Personal Care & Service | 477 (67.2%) | 233 (32.8%) |
| Total (Category) | 1,063 (54.9%) | 874 (45.1%) |
| Total (Overall) | 6,340 (58.7%) | 4,458 (41.3%) |
Sales and Office Occupations
The most common Sales and Office occupations in Mountain House are Office & Administration (1,094 | 10.1%), and Sales & Related (610 | 5.7%).
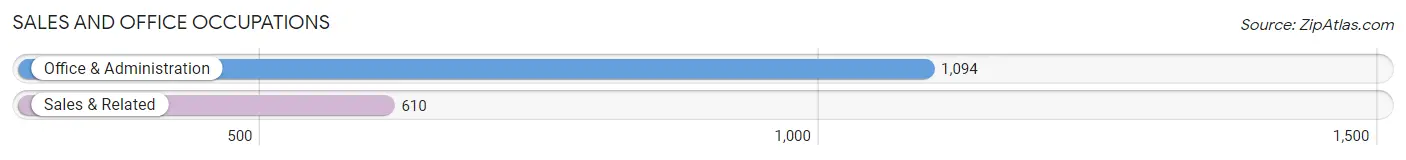
Sales and Office Occupations by Sex
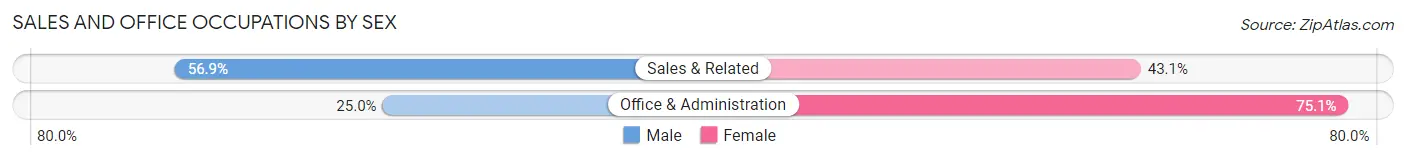
| Occupation | Male | Female |
| Sales & Related | 347 (56.9%) | 263 (43.1%) |
| Office & Administration | 273 (24.9%) | 821 (75.0%) |
| Total (Category) | 620 (36.4%) | 1,084 (63.6%) |
| Total (Overall) | 6,340 (58.7%) | 4,458 (41.3%) |
Natural Resources, Construction and Maintenance Occupations
The most common Natural Resources, Construction and Maintenance occupations in Mountain House are Construction & Extraction (541 | 5.0%), Farming, Fishing & Forestry (288 | 2.7%), and Installation, Maintenance & Repair (216 | 2.0%).
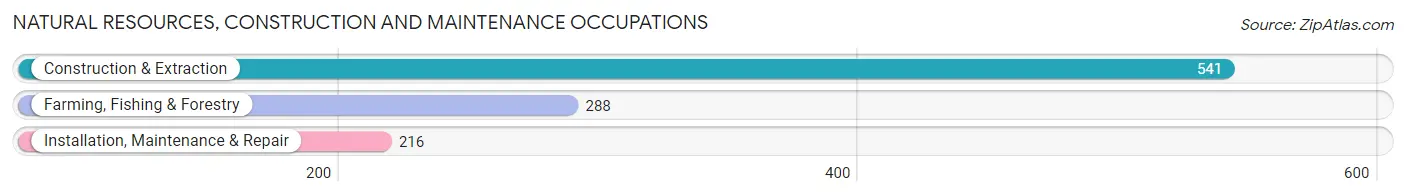
Natural Resources, Construction and Maintenance Occupations by Sex
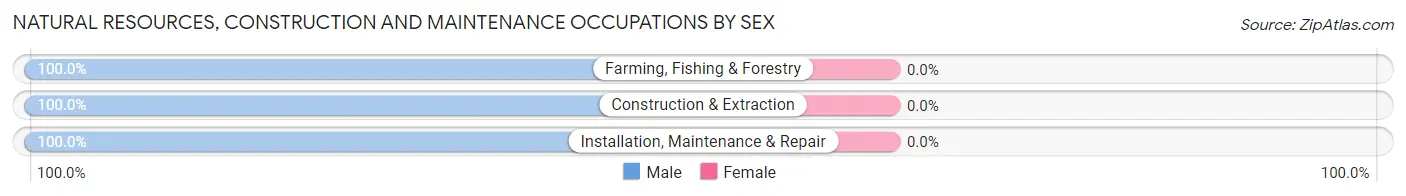
| Occupation | Male | Female |
| Farming, Fishing & Forestry | 288 (100.0%) | 0 (0.0%) |
| Construction & Extraction | 541 (100.0%) | 0 (0.0%) |
| Installation, Maintenance & Repair | 216 (100.0%) | 0 (0.0%) |
| Total (Category) | 1,045 (100.0%) | 0 (0.0%) |
| Total (Overall) | 6,340 (58.7%) | 4,458 (41.3%) |
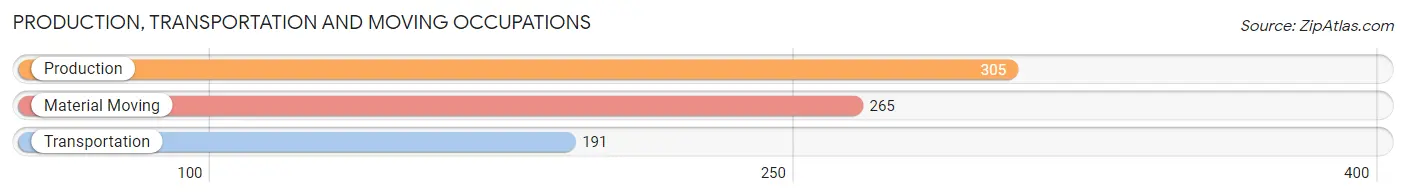
Production, Transportation and Moving Occupations
The most common Production, Transportation and Moving occupations in Mountain House are Production (305 | 2.8%), Material Moving (265 | 2.5%), and Transportation (191 | 1.8%).
Production, Transportation and Moving Occupations by Sex
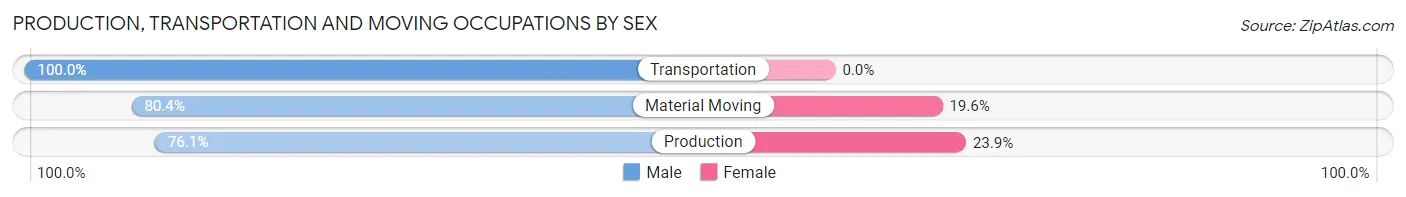
| Occupation | Male | Female |
| Production | 232 (76.1%) | 73 (23.9%) |
| Transportation | 191 (100.0%) | 0 (0.0%) |
| Material Moving | 213 (80.4%) | 52 (19.6%) |
| Total (Category) | 636 (83.6%) | 125 (16.4%) |
| Total (Overall) | 6,340 (58.7%) | 4,458 (41.3%) |
Employment Industries by Sex in Mountain House
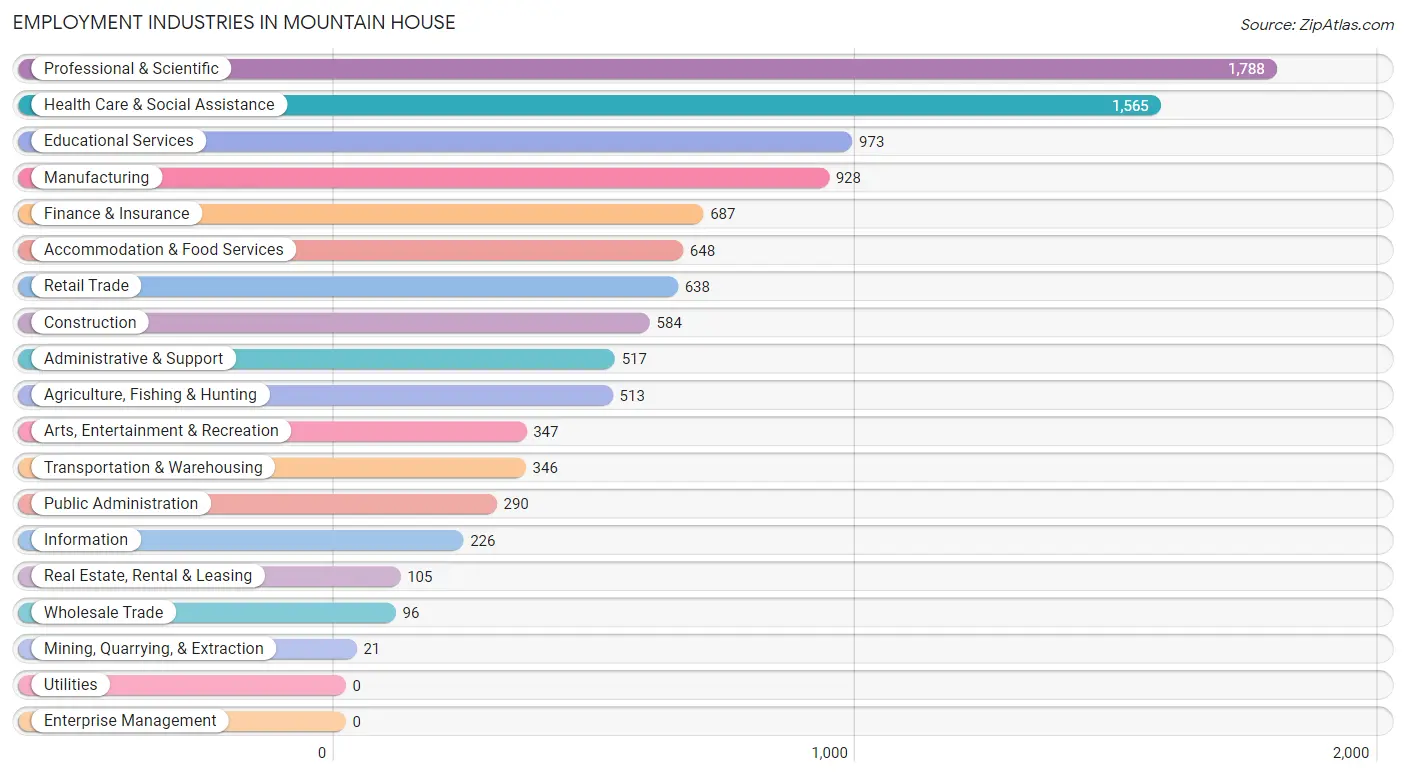
Employment Industries in Mountain House
The major employment industries in Mountain House include Professional & Scientific (1,788 | 16.6%), Health Care & Social Assistance (1,565 | 14.5%), Educational Services (973 | 9.0%), Manufacturing (928 | 8.6%), and Finance & Insurance (687 | 6.4%).
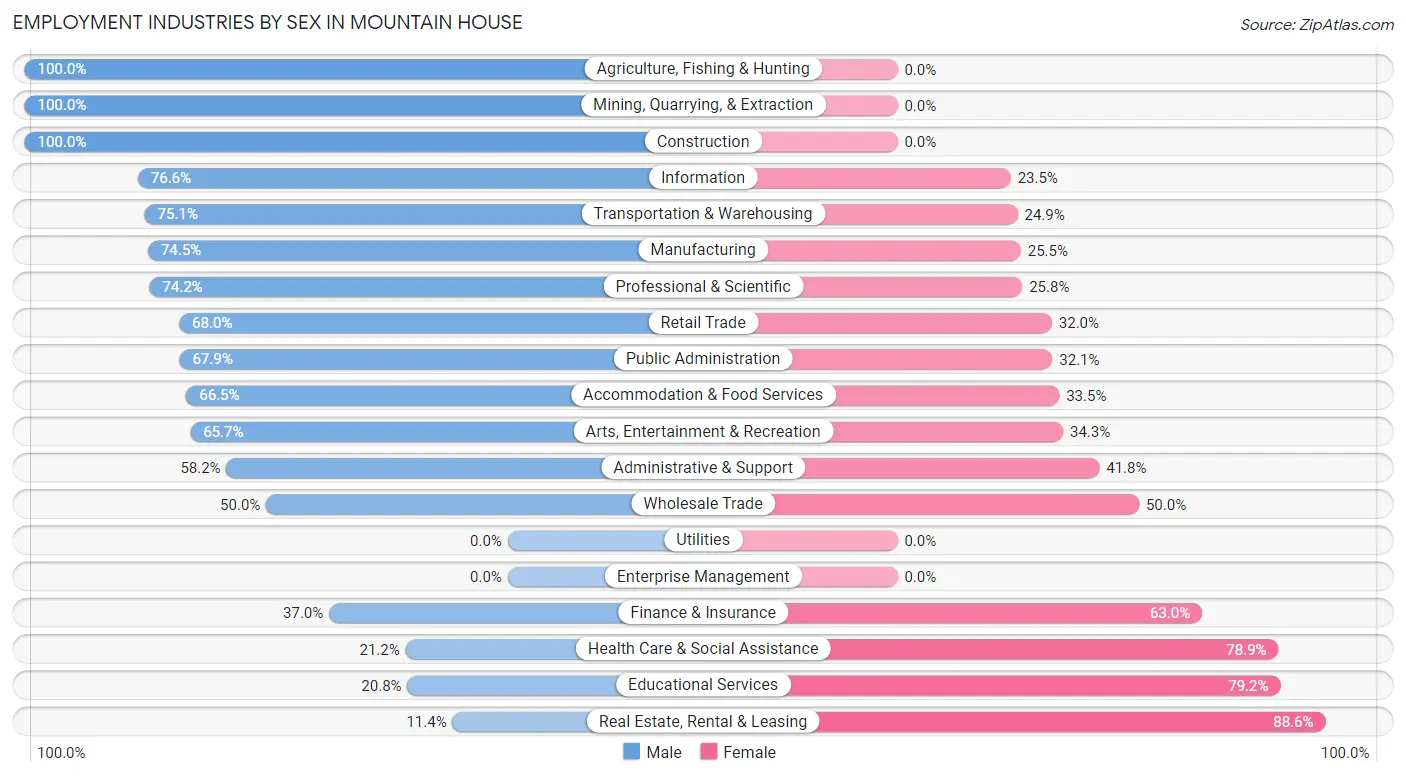
Employment Industries by Sex in Mountain House
The Mountain House industries that see more men than women are Agriculture, Fishing & Hunting (100.0%), Mining, Quarrying, & Extraction (100.0%), and Construction (100.0%), whereas the industries that tend to have a higher number of women are Real Estate, Rental & Leasing (88.6%), Educational Services (79.2%), and Health Care & Social Assistance (78.8%).
| Industry | Male | Female |
| Agriculture, Fishing & Hunting | 513 (100.0%) | 0 (0.0%) |
| Mining, Quarrying, & Extraction | 21 (100.0%) | 0 (0.0%) |
| Construction | 584 (100.0%) | 0 (0.0%) |
| Manufacturing | 691 (74.5%) | 237 (25.5%) |
| Wholesale Trade | 48 (50.0%) | 48 (50.0%) |
| Retail Trade | 434 (68.0%) | 204 (32.0%) |
| Transportation & Warehousing | 260 (75.1%) | 86 (24.9%) |
| Utilities | 0 (0.0%) | 0 (0.0%) |
| Information | 173 (76.5%) | 53 (23.4%) |
| Finance & Insurance | 254 (37.0%) | 433 (63.0%) |
| Real Estate, Rental & Leasing | 12 (11.4%) | 93 (88.6%) |
| Professional & Scientific | 1,326 (74.2%) | 462 (25.8%) |
| Enterprise Management | 0 (0.0%) | 0 (0.0%) |
| Administrative & Support | 301 (58.2%) | 216 (41.8%) |
| Educational Services | 202 (20.8%) | 771 (79.2%) |
| Health Care & Social Assistance | 331 (21.1%) | 1,234 (78.8%) |
| Arts, Entertainment & Recreation | 228 (65.7%) | 119 (34.3%) |
| Accommodation & Food Services | 431 (66.5%) | 217 (33.5%) |
| Public Administration | 197 (67.9%) | 93 (32.1%) |
| Total | 6,340 (58.7%) | 4,458 (41.3%) |
Education in Mountain House
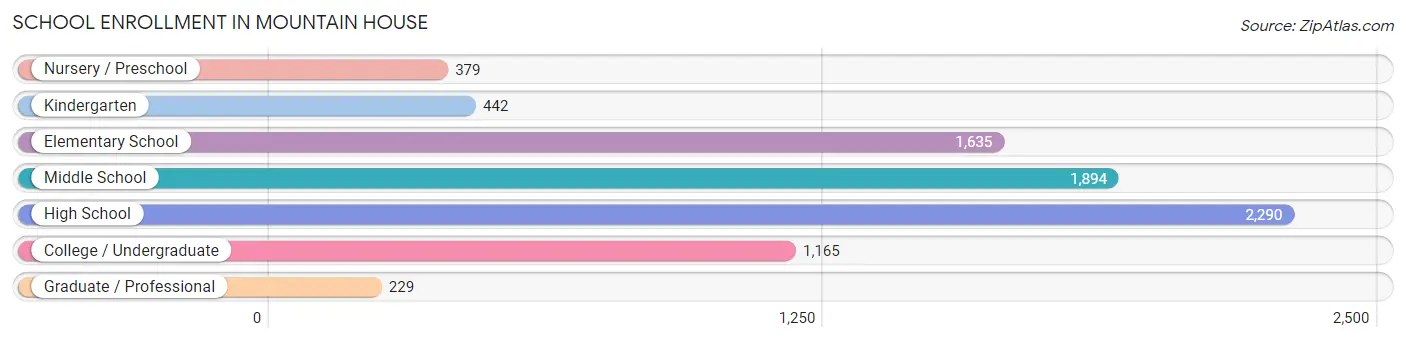
School Enrollment in Mountain House
The most common levels of schooling among the 8,034 students in Mountain House are high school (2,290 | 28.5%), middle school (1,894 | 23.6%), and elementary school (1,635 | 20.3%).
| School Level | # Students | % Students |
| Nursery / Preschool | 379 | 4.7% |
| Kindergarten | 442 | 5.5% |
| Elementary School | 1,635 | 20.3% |
| Middle School | 1,894 | 23.6% |
| High School | 2,290 | 28.5% |
| College / Undergraduate | 1,165 | 14.5% |
| Graduate / Professional | 229 | 2.9% |
| Total | 8,034 | 100.0% |
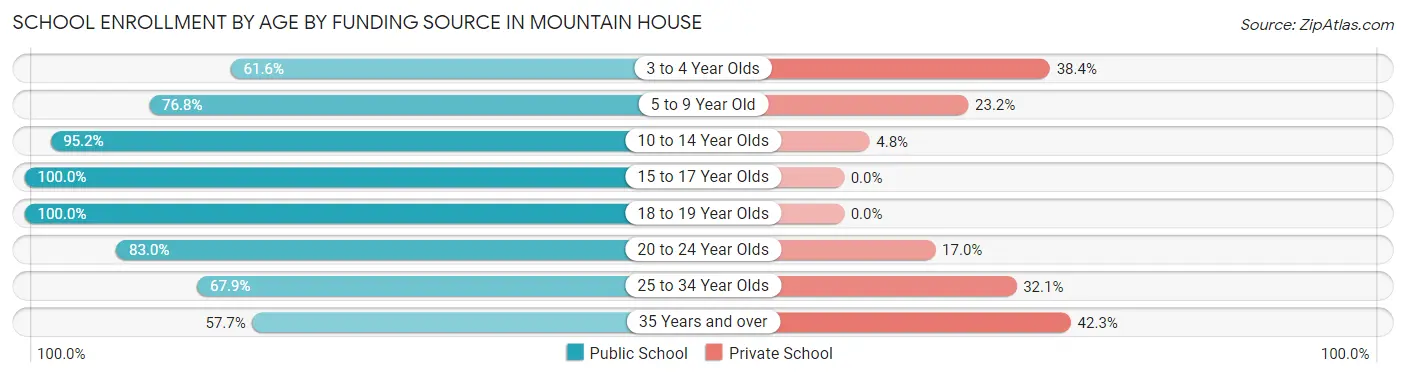
School Enrollment by Age by Funding Source in Mountain House
Out of a total of 8,034 students who are enrolled in schools in Mountain House, 1,028 (12.8%) attend a private institution, while the remaining 7,006 (87.2%) are enrolled in public schools. The age group of 35 years and over has the highest likelihood of being enrolled in private schools, with 126 (42.3% in the age bracket) enrolled. Conversely, the age group of 15 to 17 year olds has the lowest likelihood of being enrolled in a private school, with 1,435 (100.0% in the age bracket) attending a public institution.
| Age Bracket | Public School | Private School |
| 3 to 4 Year Olds | 236 (61.6%) | 147 (38.4%) |
| 5 to 9 Year Old | 1,511 (76.8%) | 456 (23.2%) |
| 10 to 14 Year Olds | 2,350 (95.2%) | 118 (4.8%) |
| 15 to 17 Year Olds | 1,435 (100.0%) | 0 (0.0%) |
| 18 to 19 Year Olds | 539 (100.0%) | 0 (0.0%) |
| 20 to 24 Year Olds | 667 (83.0%) | 137 (17.0%) |
| 25 to 34 Year Olds | 95 (67.9%) | 45 (32.1%) |
| 35 Years and over | 172 (57.7%) | 126 (42.3%) |
| Total | 7,006 (87.2%) | 1,028 (12.8%) |
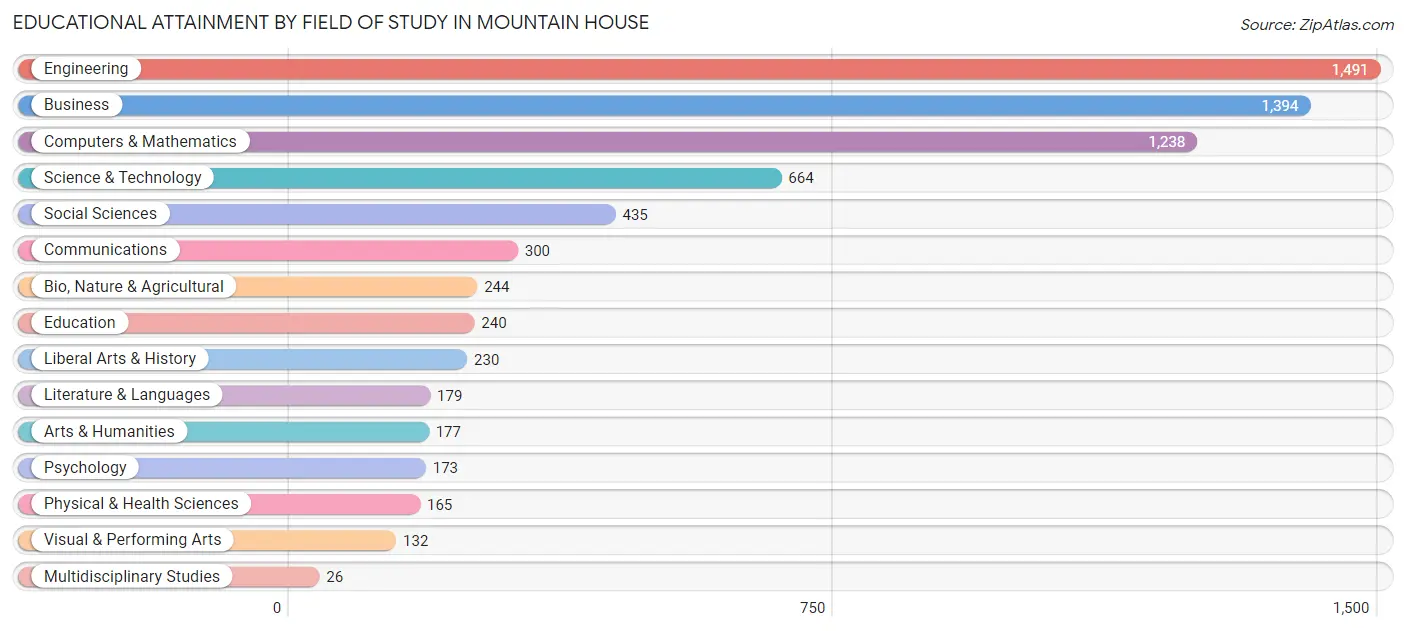
Educational Attainment by Field of Study in Mountain House
Engineering (1,491 | 21.0%), business (1,394 | 19.7%), computers & mathematics (1,238 | 17.5%), science & technology (664 | 9.4%), and social sciences (435 | 6.1%) are the most common fields of study among 7,088 individuals in Mountain House who have obtained a bachelor's degree or higher.
| Field of Study | # Graduates | % Graduates |
| Computers & Mathematics | 1,238 | 17.5% |
| Bio, Nature & Agricultural | 244 | 3.4% |
| Physical & Health Sciences | 165 | 2.3% |
| Psychology | 173 | 2.4% |
| Social Sciences | 435 | 6.1% |
| Engineering | 1,491 | 21.0% |
| Multidisciplinary Studies | 26 | 0.4% |
| Science & Technology | 664 | 9.4% |
| Business | 1,394 | 19.7% |
| Education | 240 | 3.4% |
| Literature & Languages | 179 | 2.5% |
| Liberal Arts & History | 230 | 3.2% |
| Visual & Performing Arts | 132 | 1.9% |
| Communications | 300 | 4.2% |
| Arts & Humanities | 177 | 2.5% |
| Total | 7,088 | 100.0% |
Transportation & Commute in Mountain House
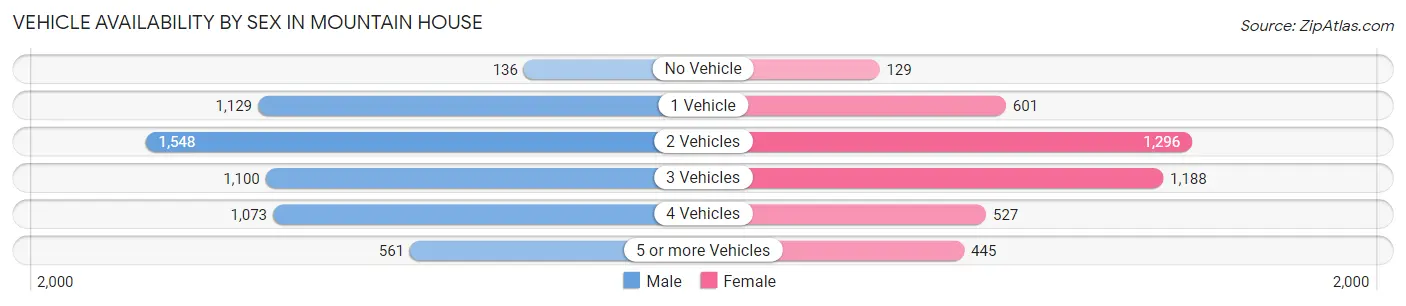
Vehicle Availability by Sex in Mountain House
The most prevalent vehicle ownership categories in Mountain House are males with 2 vehicles (1,548, accounting for 27.9%) and females with 2 vehicles (1,296, making up 37.0%).
| Vehicles Available | Male | Female |
| No Vehicle | 136 (2.5%) | 129 (3.1%) |
| 1 Vehicle | 1,129 (20.3%) | 601 (14.4%) |
| 2 Vehicles | 1,548 (27.9%) | 1,296 (31.0%) |
| 3 Vehicles | 1,100 (19.8%) | 1,188 (28.4%) |
| 4 Vehicles | 1,073 (19.3%) | 527 (12.6%) |
| 5 or more Vehicles | 561 (10.1%) | 445 (10.6%) |
| Total | 5,547 (100.0%) | 4,186 (100.0%) |
Commute Time in Mountain House
The most frequently occuring commute durations in Mountain House are 90 or more minutes (2,064 commuters, 25.2%), 60 to 89 minutes (1,426 commuters, 17.4%), and 45 to 59 minutes (1,134 commuters, 13.9%).
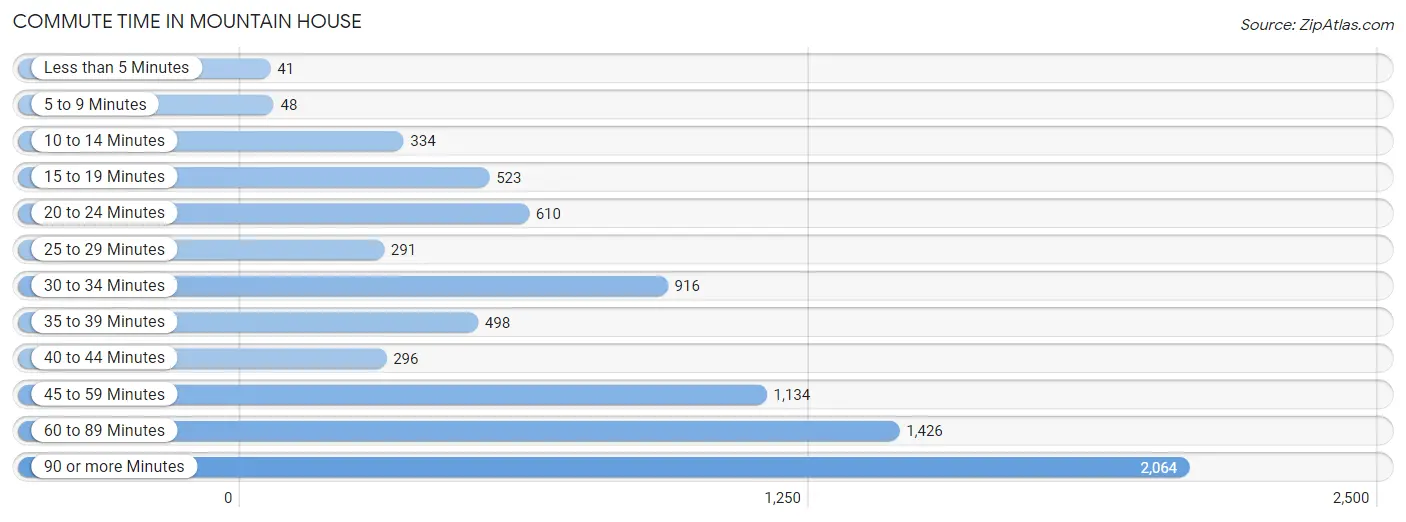
| Commute Time | # Commuters | % Commuters |
| Less than 5 Minutes | 41 | 0.5% |
| 5 to 9 Minutes | 48 | 0.6% |
| 10 to 14 Minutes | 334 | 4.1% |
| 15 to 19 Minutes | 523 | 6.4% |
| 20 to 24 Minutes | 610 | 7.5% |
| 25 to 29 Minutes | 291 | 3.6% |
| 30 to 34 Minutes | 916 | 11.2% |
| 35 to 39 Minutes | 498 | 6.1% |
| 40 to 44 Minutes | 296 | 3.6% |
| 45 to 59 Minutes | 1,134 | 13.9% |
| 60 to 89 Minutes | 1,426 | 17.4% |
| 90 or more Minutes | 2,064 | 25.2% |
Commute Time by Sex in Mountain House
The most common commute times in Mountain House are 90 or more minutes (1,374 commuters, 28.8%) for males and 90 or more minutes (690 commuters, 20.3%) for females.
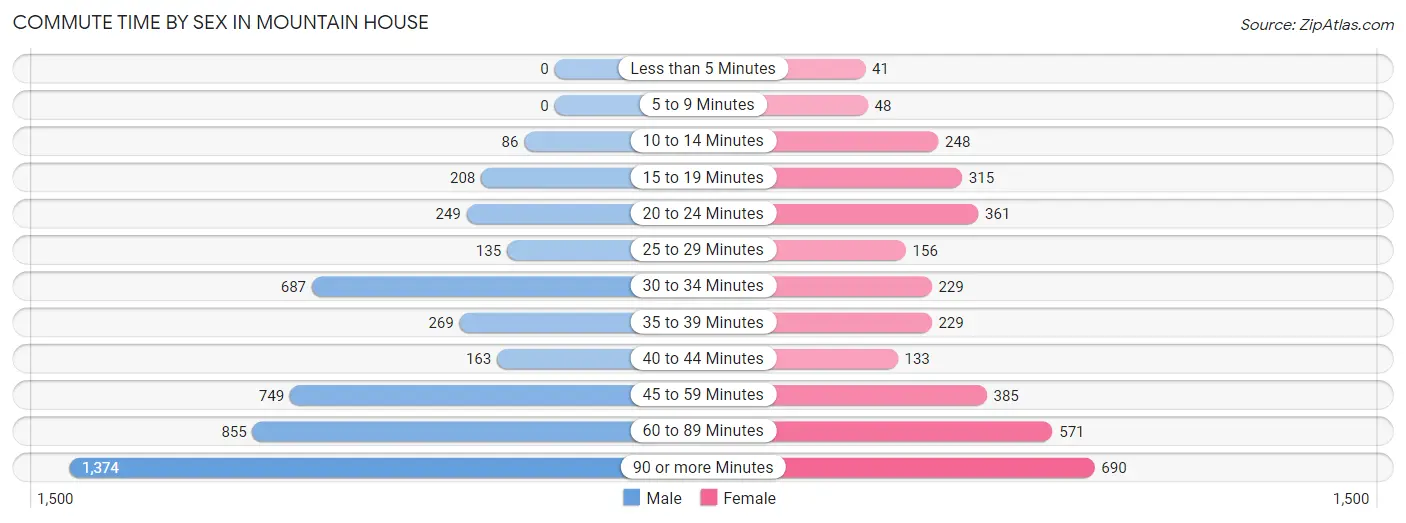
| Commute Time | Male | Female |
| Less than 5 Minutes | 0 (0.0%) | 41 (1.2%) |
| 5 to 9 Minutes | 0 (0.0%) | 48 (1.4%) |
| 10 to 14 Minutes | 86 (1.8%) | 248 (7.3%) |
| 15 to 19 Minutes | 208 (4.4%) | 315 (9.2%) |
| 20 to 24 Minutes | 249 (5.2%) | 361 (10.6%) |
| 25 to 29 Minutes | 135 (2.8%) | 156 (4.6%) |
| 30 to 34 Minutes | 687 (14.4%) | 229 (6.7%) |
| 35 to 39 Minutes | 269 (5.6%) | 229 (6.7%) |
| 40 to 44 Minutes | 163 (3.4%) | 133 (3.9%) |
| 45 to 59 Minutes | 749 (15.7%) | 385 (11.3%) |
| 60 to 89 Minutes | 855 (17.9%) | 571 (16.8%) |
| 90 or more Minutes | 1,374 (28.8%) | 690 (20.3%) |
Time of Departure to Work by Sex in Mountain House
The most frequent times of departure to work in Mountain House are 8:00 AM to 8:29 AM (1,191, 24.9%) for males and 7:30 AM to 7:59 AM (812, 23.8%) for females.
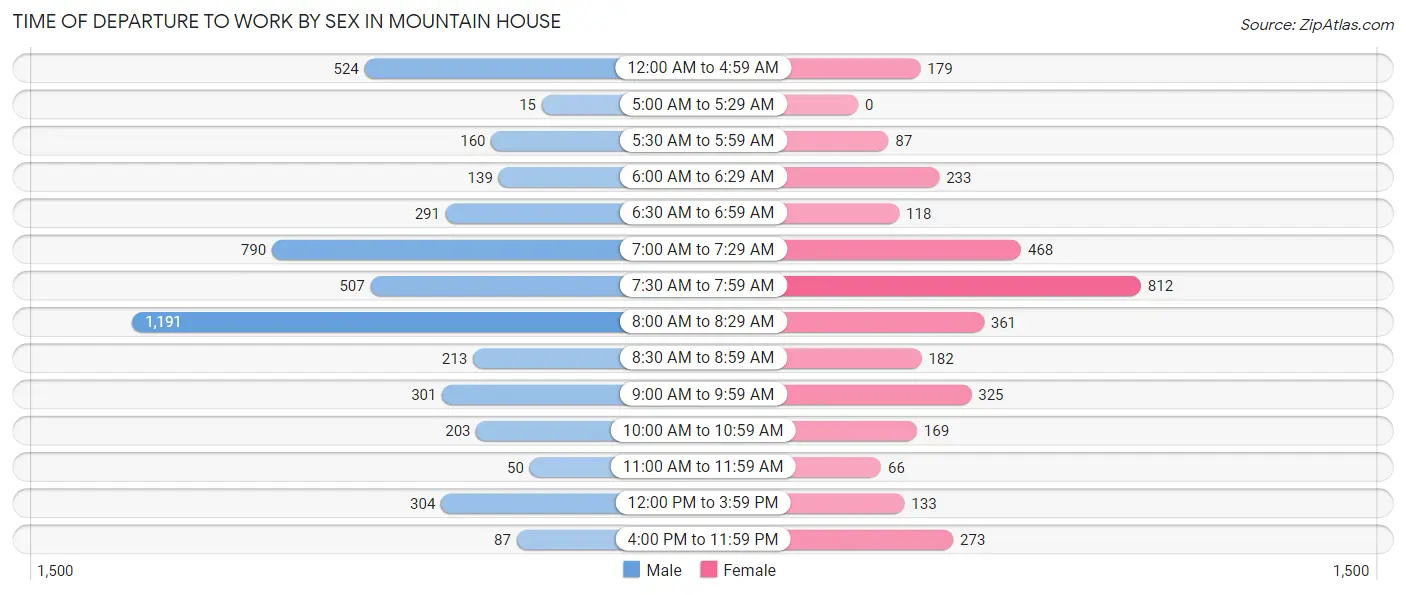
| Time of Departure | Male | Female |
| 12:00 AM to 4:59 AM | 524 (11.0%) | 179 (5.3%) |
| 5:00 AM to 5:29 AM | 15 (0.3%) | 0 (0.0%) |
| 5:30 AM to 5:59 AM | 160 (3.4%) | 87 (2.5%) |
| 6:00 AM to 6:29 AM | 139 (2.9%) | 233 (6.8%) |
| 6:30 AM to 6:59 AM | 291 (6.1%) | 118 (3.5%) |
| 7:00 AM to 7:29 AM | 790 (16.5%) | 468 (13.7%) |
| 7:30 AM to 7:59 AM | 507 (10.6%) | 812 (23.8%) |
| 8:00 AM to 8:29 AM | 1,191 (24.9%) | 361 (10.6%) |
| 8:30 AM to 8:59 AM | 213 (4.5%) | 182 (5.3%) |
| 9:00 AM to 9:59 AM | 301 (6.3%) | 325 (9.5%) |
| 10:00 AM to 10:59 AM | 203 (4.3%) | 169 (5.0%) |
| 11:00 AM to 11:59 AM | 50 (1.1%) | 66 (1.9%) |
| 12:00 PM to 3:59 PM | 304 (6.4%) | 133 (3.9%) |
| 4:00 PM to 11:59 PM | 87 (1.8%) | 273 (8.0%) |
| Total | 4,775 (100.0%) | 3,406 (100.0%) |
Housing Occupancy in Mountain House
Occupancy by Ownership in Mountain House
Of the total 6,159 dwellings in Mountain House, owner-occupied units account for 4,298 (69.8%), while renter-occupied units make up 1,861 (30.2%).
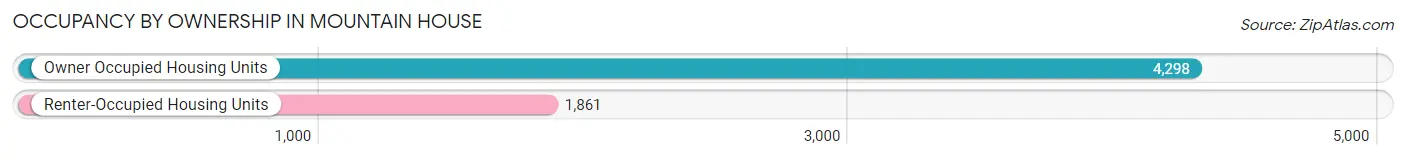
| Occupancy | # Housing Units | % Housing Units |
| Owner Occupied Housing Units | 4,298 | 69.8% |
| Renter-Occupied Housing Units | 1,861 | 30.2% |
| Total Occupied Housing Units | 6,159 | 100.0% |
Occupancy by Household Size in Mountain House
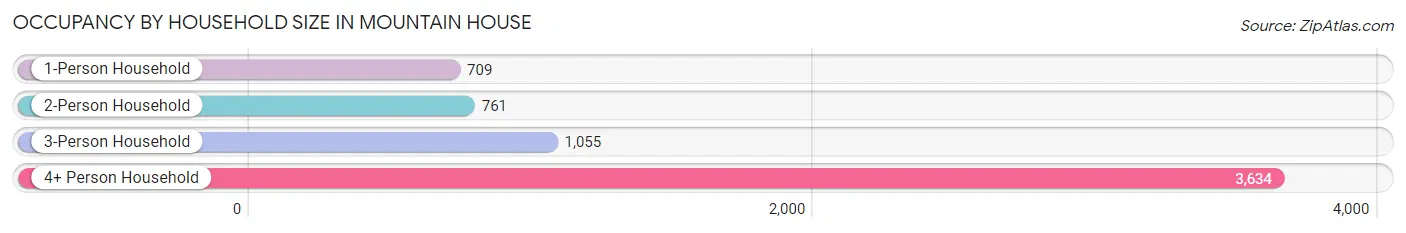
| Household Size | # Housing Units | % Housing Units |
| 1-Person Household | 709 | 11.5% |
| 2-Person Household | 761 | 12.4% |
| 3-Person Household | 1,055 | 17.1% |
| 4+ Person Household | 3,634 | 59.0% |
| Total Housing Units | 6,159 | 100.0% |
Occupancy by Ownership by Household Size in Mountain House
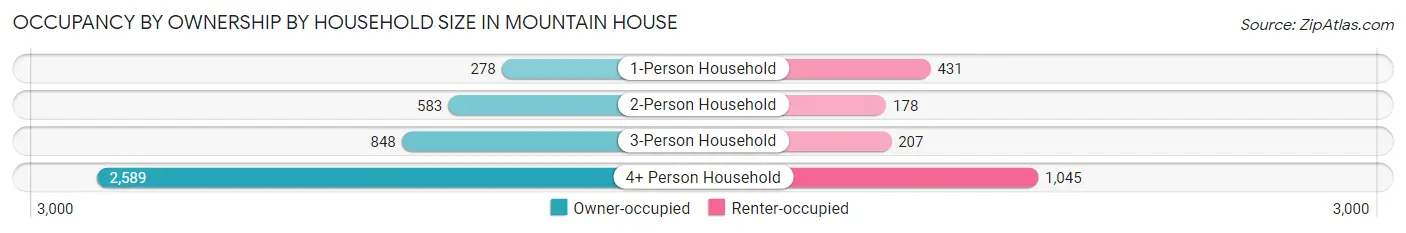
| Household Size | Owner-occupied | Renter-occupied |
| 1-Person Household | 278 (39.2%) | 431 (60.8%) |
| 2-Person Household | 583 (76.6%) | 178 (23.4%) |
| 3-Person Household | 848 (80.4%) | 207 (19.6%) |
| 4+ Person Household | 2,589 (71.2%) | 1,045 (28.8%) |
| Total Housing Units | 4,298 (69.8%) | 1,861 (30.2%) |
Occupancy by Educational Attainment in Mountain House
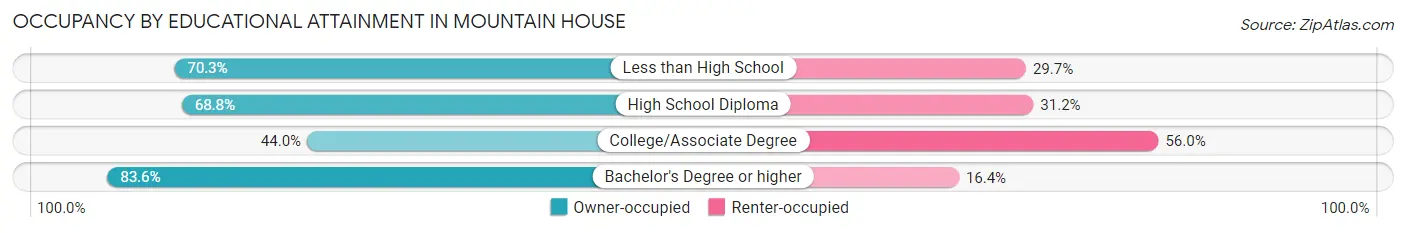
| Household Size | Owner-occupied | Renter-occupied |
| Less than High School | 71 (70.3%) | 30 (29.7%) |
| High School Diploma | 501 (68.8%) | 227 (31.2%) |
| College/Associate Degree | 812 (44.0%) | 1,032 (56.0%) |
| Bachelor's Degree or higher | 2,914 (83.6%) | 572 (16.4%) |
Occupancy by Age of Householder in Mountain House
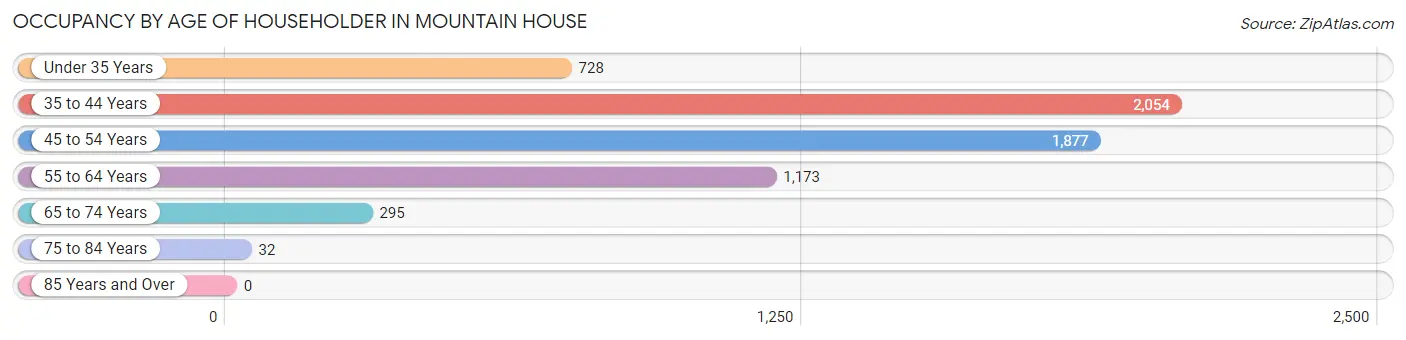
| Age Bracket | # Households | % Households |
| Under 35 Years | 728 | 11.8% |
| 35 to 44 Years | 2,054 | 33.4% |
| 45 to 54 Years | 1,877 | 30.5% |
| 55 to 64 Years | 1,173 | 19.1% |
| 65 to 74 Years | 295 | 4.8% |
| 75 to 84 Years | 32 | 0.5% |
| 85 Years and Over | 0 | 0.0% |
| Total | 6,159 | 100.0% |
Housing Finances in Mountain House
Median Income by Occupancy in Mountain House
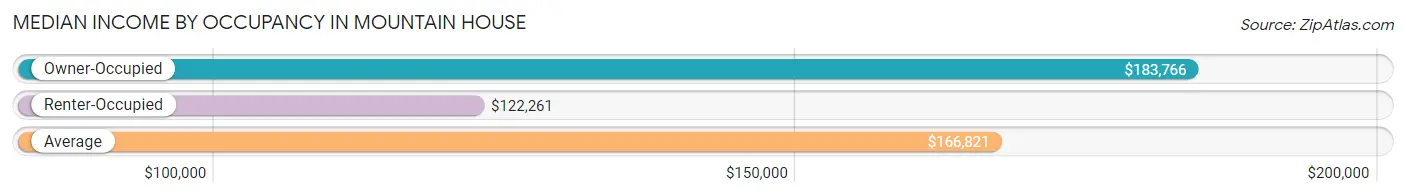
| Occupancy Type | # Households | Median Income |
| Owner-Occupied | 4,298 (69.8%) | $183,766 |
| Renter-Occupied | 1,861 (30.2%) | $122,261 |
| Average | 6,159 (100.0%) | $166,821 |
Occupancy by Householder Income Bracket in Mountain House
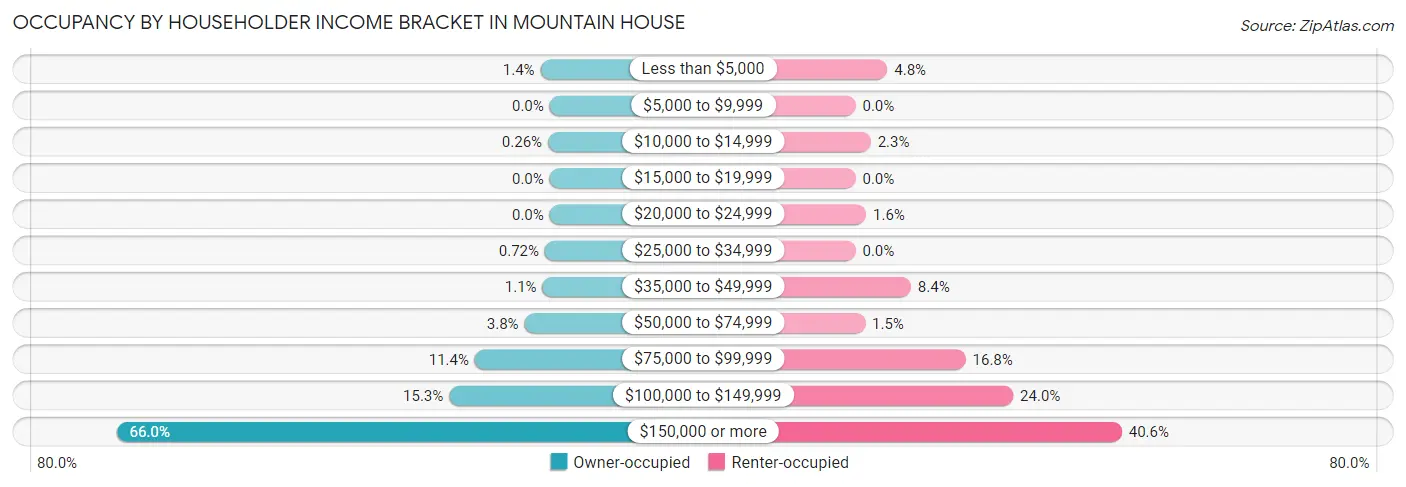
| Income Bracket | Owner-occupied | Renter-occupied |
| Less than $5,000 | 60 (1.4%) | 90 (4.8%) |
| $5,000 to $9,999 | 0 (0.0%) | 0 (0.0%) |
| $10,000 to $14,999 | 11 (0.3%) | 43 (2.3%) |
| $15,000 to $19,999 | 0 (0.0%) | 0 (0.0%) |
| $20,000 to $24,999 | 0 (0.0%) | 30 (1.6%) |
| $25,000 to $34,999 | 31 (0.7%) | 0 (0.0%) |
| $35,000 to $49,999 | 47 (1.1%) | 157 (8.4%) |
| $50,000 to $74,999 | 165 (3.8%) | 27 (1.5%) |
| $75,000 to $99,999 | 490 (11.4%) | 312 (16.8%) |
| $100,000 to $149,999 | 658 (15.3%) | 447 (24.0%) |
| $150,000 or more | 2,836 (66.0%) | 755 (40.6%) |
| Total | 4,298 (100.0%) | 1,861 (100.0%) |
Monthly Housing Cost Tiers in Mountain House
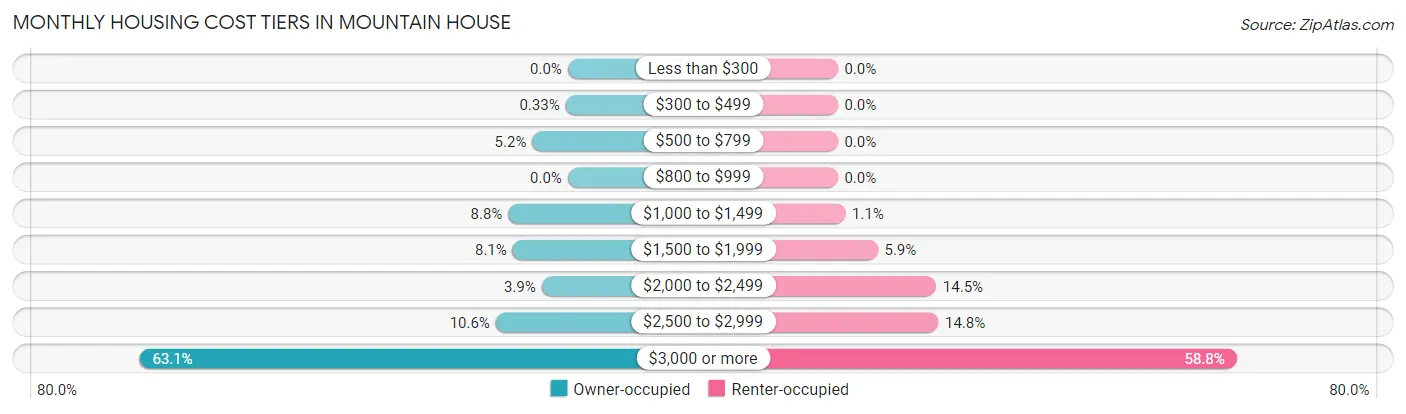
| Monthly Cost | Owner-occupied | Renter-occupied |
| Less than $300 | 0 (0.0%) | 0 (0.0%) |
| $300 to $499 | 14 (0.3%) | 0 (0.0%) |
| $500 to $799 | 225 (5.2%) | 0 (0.0%) |
| $800 to $999 | 0 (0.0%) | 0 (0.0%) |
| $1,000 to $1,499 | 377 (8.8%) | 21 (1.1%) |
| $1,500 to $1,999 | 349 (8.1%) | 110 (5.9%) |
| $2,000 to $2,499 | 166 (3.9%) | 270 (14.5%) |
| $2,500 to $2,999 | 456 (10.6%) | 276 (14.8%) |
| $3,000 or more | 2,711 (63.1%) | 1,094 (58.8%) |
| Total | 4,298 (100.0%) | 1,861 (100.0%) |
Physical Housing Characteristics in Mountain House
Housing Structures in Mountain House
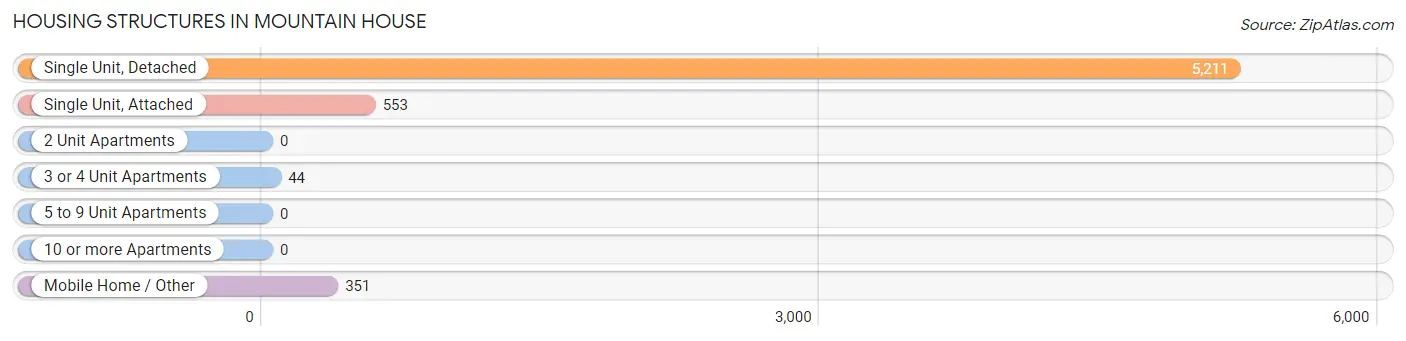
| Structure Type | # Housing Units | % Housing Units |
| Single Unit, Detached | 5,211 | 84.6% |
| Single Unit, Attached | 553 | 9.0% |
| 2 Unit Apartments | 0 | 0.0% |
| 3 or 4 Unit Apartments | 44 | 0.7% |
| 5 to 9 Unit Apartments | 0 | 0.0% |
| 10 or more Apartments | 0 | 0.0% |
| Mobile Home / Other | 351 | 5.7% |
| Total | 6,159 | 100.0% |
Housing Structures by Occupancy in Mountain House
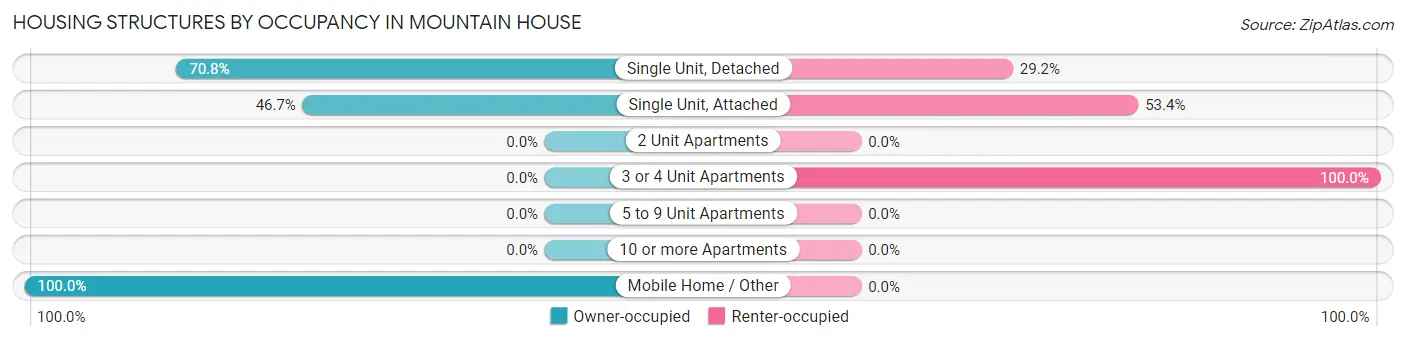
| Structure Type | Owner-occupied | Renter-occupied |
| Single Unit, Detached | 3,689 (70.8%) | 1,522 (29.2%) |
| Single Unit, Attached | 258 (46.7%) | 295 (53.3%) |
| 2 Unit Apartments | 0 (0.0%) | 0 (0.0%) |
| 3 or 4 Unit Apartments | 0 (0.0%) | 44 (100.0%) |
| 5 to 9 Unit Apartments | 0 (0.0%) | 0 (0.0%) |
| 10 or more Apartments | 0 (0.0%) | 0 (0.0%) |
| Mobile Home / Other | 351 (100.0%) | 0 (0.0%) |
| Total | 4,298 (69.8%) | 1,861 (30.2%) |
Housing Structures by Number of Rooms in Mountain House
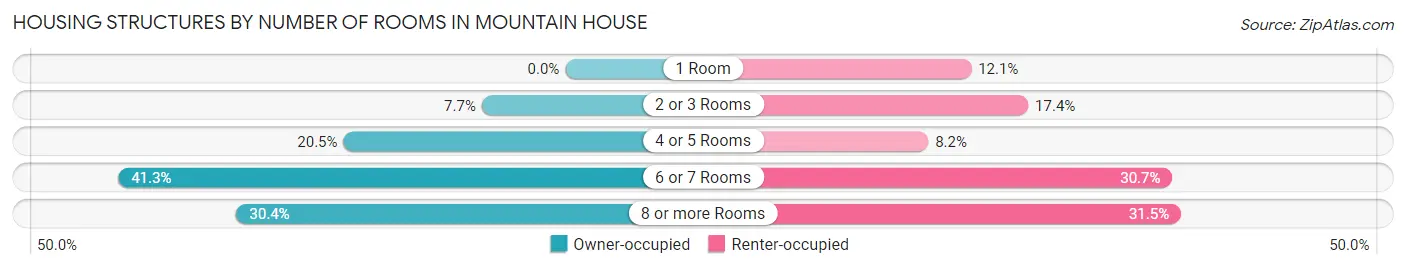
| Number of Rooms | Owner-occupied | Renter-occupied |
| 1 Room | 0 (0.0%) | 226 (12.1%) |
| 2 or 3 Rooms | 332 (7.7%) | 324 (17.4%) |
| 4 or 5 Rooms | 882 (20.5%) | 152 (8.2%) |
| 6 or 7 Rooms | 1,777 (41.3%) | 572 (30.7%) |
| 8 or more Rooms | 1,307 (30.4%) | 587 (31.5%) |
| Total | 4,298 (100.0%) | 1,861 (100.0%) |
Housing Structure by Heating Type in Mountain House
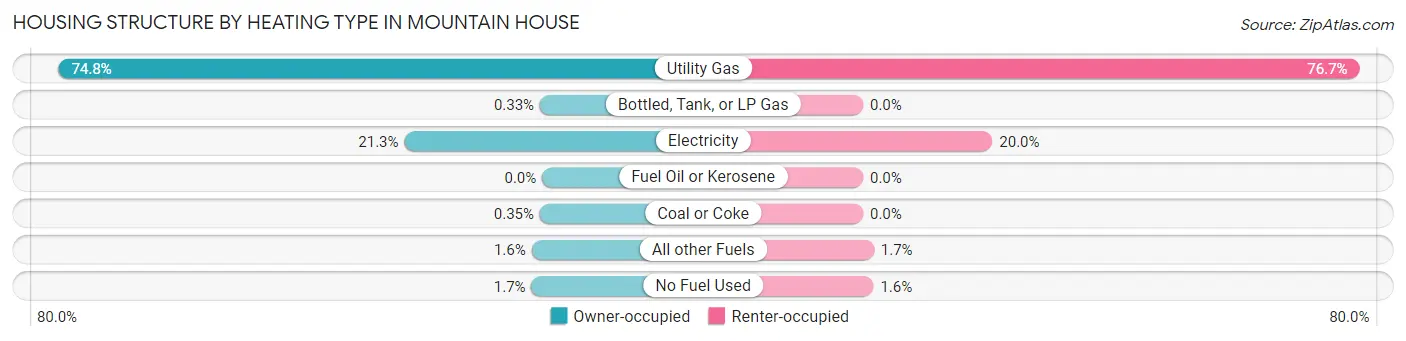
| Heating Type | Owner-occupied | Renter-occupied |
| Utility Gas | 3,213 (74.8%) | 1,428 (76.7%) |
| Bottled, Tank, or LP Gas | 14 (0.3%) | 0 (0.0%) |
| Electricity | 915 (21.3%) | 372 (20.0%) |
| Fuel Oil or Kerosene | 0 (0.0%) | 0 (0.0%) |
| Coal or Coke | 15 (0.4%) | 0 (0.0%) |
| All other Fuels | 70 (1.6%) | 31 (1.7%) |
| No Fuel Used | 71 (1.7%) | 30 (1.6%) |
| Total | 4,298 (100.0%) | 1,861 (100.0%) |
Household Vehicle Usage in Mountain House
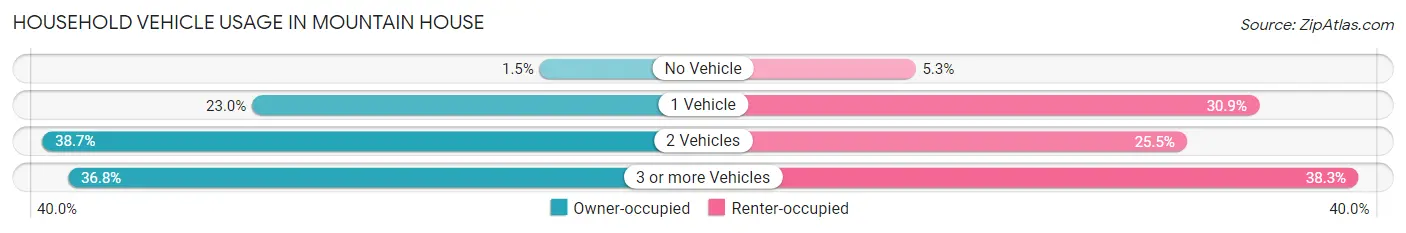
| Vehicles per Household | Owner-occupied | Renter-occupied |
| No Vehicle | 66 (1.5%) | 98 (5.3%) |
| 1 Vehicle | 989 (23.0%) | 575 (30.9%) |
| 2 Vehicles | 1,663 (38.7%) | 475 (25.5%) |
| 3 or more Vehicles | 1,580 (36.8%) | 713 (38.3%) |
| Total | 4,298 (100.0%) | 1,861 (100.0%) |
Real Estate & Mortgages in Mountain House
Real Estate and Mortgage Overview in Mountain House
| Characteristic | Without Mortgage | With Mortgage |
| Housing Units | 684 | 3,614 |
| Median Property Value | $596,000 | $762,800 |
| Median Household Income | $157,978 | $2,451 |
| Monthly Housing Costs | $1,046 | $2,711 |
| Real Estate Taxes | - | - |
Property Value by Mortgage Status in Mountain House
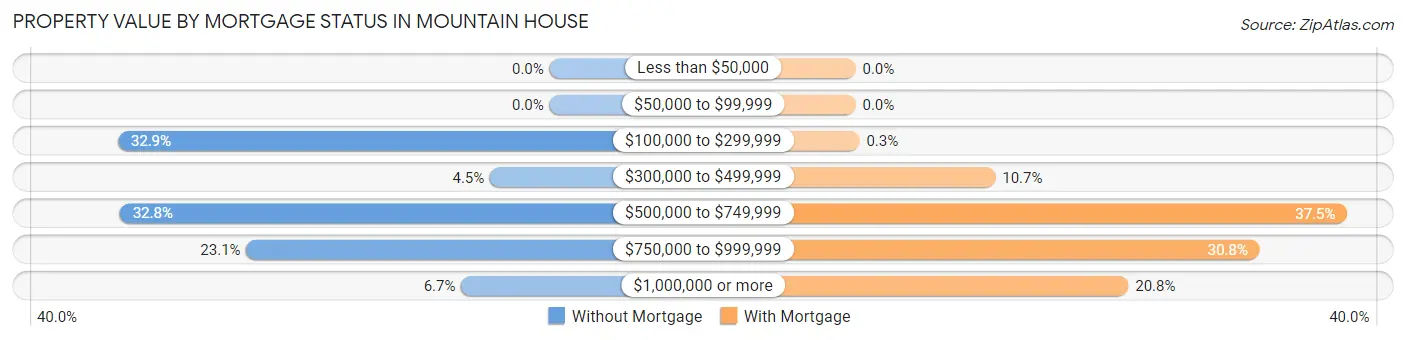
| Property Value | Without Mortgage | With Mortgage |
| Less than $50,000 | 0 (0.0%) | 0 (0.0%) |
| $50,000 to $99,999 | 0 (0.0%) | 0 (0.0%) |
| $100,000 to $299,999 | 225 (32.9%) | 11 (0.3%) |
| $300,000 to $499,999 | 31 (4.5%) | 385 (10.6%) |
| $500,000 to $749,999 | 224 (32.8%) | 1,354 (37.5%) |
| $750,000 to $999,999 | 158 (23.1%) | 1,113 (30.8%) |
| $1,000,000 or more | 46 (6.7%) | 751 (20.8%) |
| Total | 684 (100.0%) | 3,614 (100.0%) |
Household Income by Mortgage Status in Mountain House
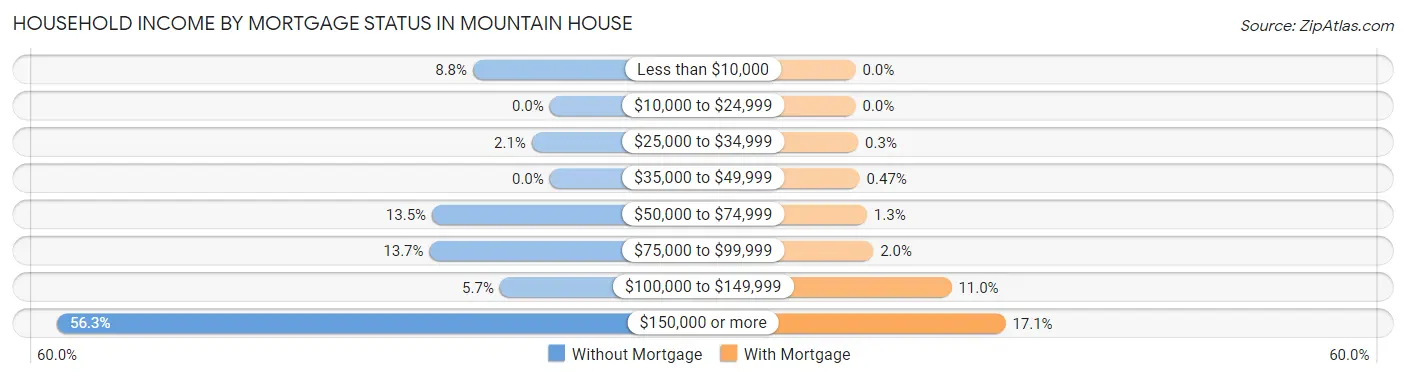
| Household Income | Without Mortgage | With Mortgage |
| Less than $10,000 | 60 (8.8%) | 0 (0.0%) |
| $10,000 to $24,999 | 0 (0.0%) | 0 (0.0%) |
| $25,000 to $34,999 | 14 (2.1%) | 11 (0.3%) |
| $35,000 to $49,999 | 0 (0.0%) | 17 (0.5%) |
| $50,000 to $74,999 | 92 (13.5%) | 47 (1.3%) |
| $75,000 to $99,999 | 94 (13.7%) | 73 (2.0%) |
| $100,000 to $149,999 | 39 (5.7%) | 396 (11.0%) |
| $150,000 or more | 385 (56.3%) | 619 (17.1%) |
| Total | 684 (100.0%) | 3,614 (100.0%) |
Property Value to Household Income Ratio in Mountain House
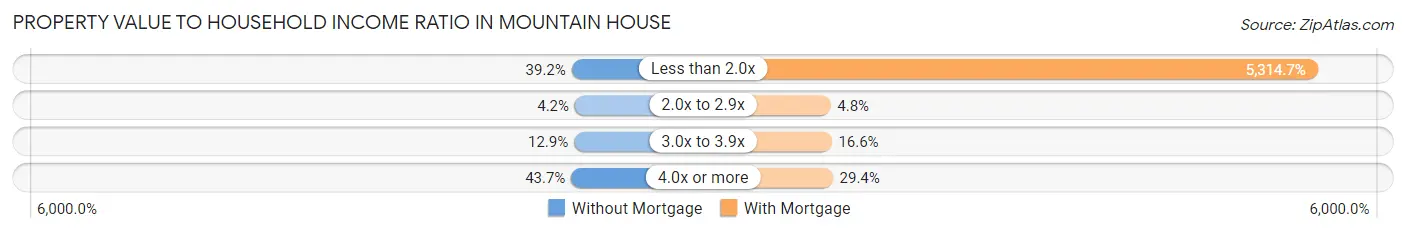
| Value-to-Income Ratio | Without Mortgage | With Mortgage |
| Less than 2.0x | 268 (39.2%) | 192,072 (5,314.7%) |
| 2.0x to 2.9x | 29 (4.2%) | 172 (4.8%) |
| 3.0x to 3.9x | 88 (12.9%) | 601 (16.6%) |
| 4.0x or more | 299 (43.7%) | 1,061 (29.4%) |
| Total | 684 (100.0%) | 3,614 (100.0%) |
Real Estate Taxes by Mortgage Status in Mountain House
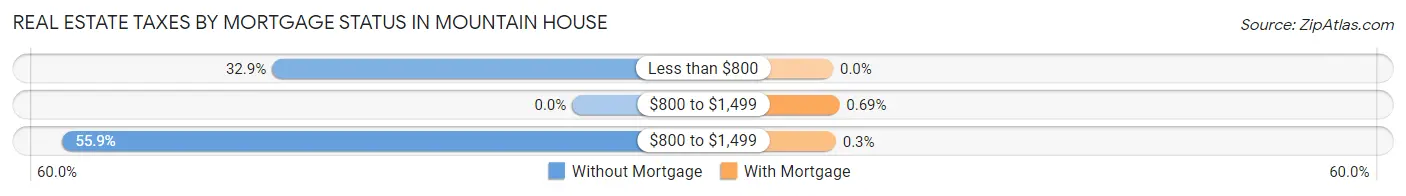
| Property Taxes | Without Mortgage | With Mortgage |
| Less than $800 | 225 (32.9%) | 0 (0.0%) |
| $800 to $1,499 | 0 (0.0%) | 25 (0.7%) |
| $800 to $1,499 | 382 (55.8%) | 11 (0.3%) |
| Total | 684 (100.0%) | 3,614 (100.0%) |
Health & Disability in Mountain House
Health Insurance Coverage by Age in Mountain House
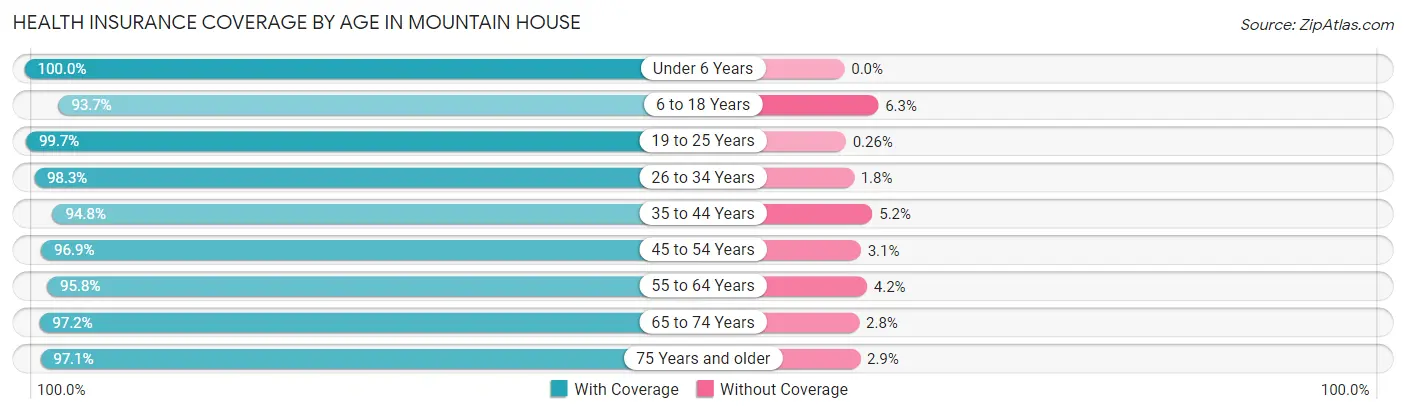
| Age Bracket | With Coverage | Without Coverage |
| Under 6 Years | 1,745 (100.0%) | 0 (0.0%) |
| 6 to 18 Years | 5,599 (93.7%) | 378 (6.3%) |
| 19 to 25 Years | 2,296 (99.7%) | 6 (0.3%) |
| 26 to 34 Years | 2,026 (98.3%) | 36 (1.8%) |
| 35 to 44 Years | 3,903 (94.8%) | 215 (5.2%) |
| 45 to 54 Years | 3,283 (96.9%) | 104 (3.1%) |
| 55 to 64 Years | 2,053 (95.8%) | 90 (4.2%) |
| 65 to 74 Years | 1,374 (97.2%) | 39 (2.8%) |
| 75 Years and older | 430 (97.1%) | 13 (2.9%) |
| Total | 22,709 (96.3%) | 881 (3.7%) |
Health Insurance Coverage by Citizenship Status in Mountain House
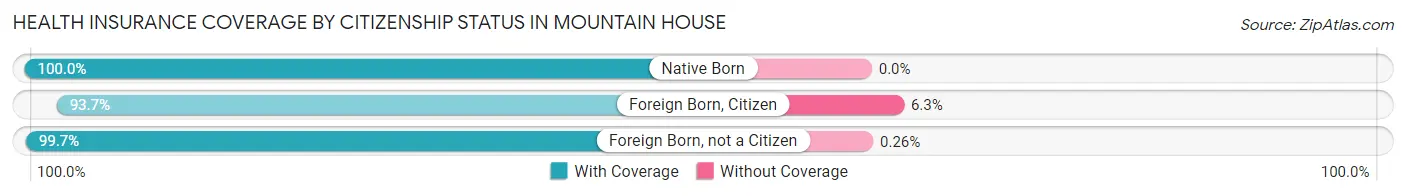
| Citizenship Status | With Coverage | Without Coverage |
| Native Born | 1,745 (100.0%) | 0 (0.0%) |
| Foreign Born, Citizen | 5,599 (93.7%) | 378 (6.3%) |
| Foreign Born, not a Citizen | 2,296 (99.7%) | 6 (0.3%) |
Health Insurance Coverage by Household Income in Mountain House
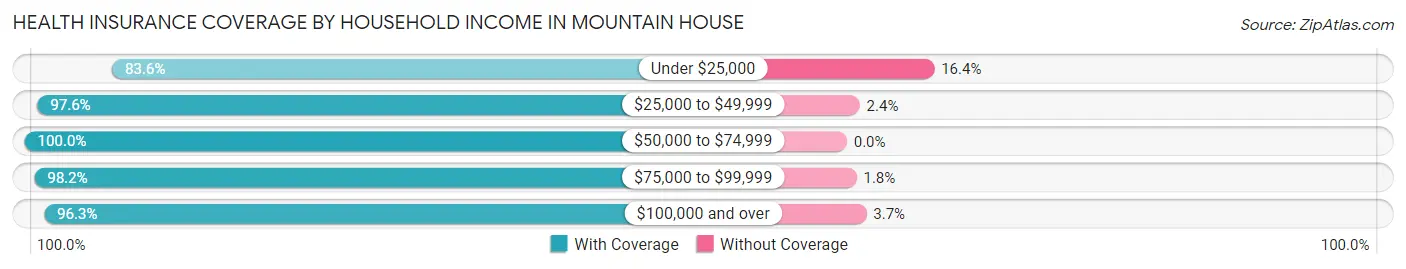
| Household Income | With Coverage | Without Coverage |
| Under $25,000 | 531 (83.6%) | 104 (16.4%) |
| $25,000 to $49,999 | 689 (97.6%) | 17 (2.4%) |
| $50,000 to $74,999 | 632 (100.0%) | 0 (0.0%) |
| $75,000 to $99,999 | 1,615 (98.2%) | 30 (1.8%) |
| $100,000 and over | 19,242 (96.3%) | 730 (3.7%) |
Public vs Private Health Insurance Coverage by Age in Mountain House
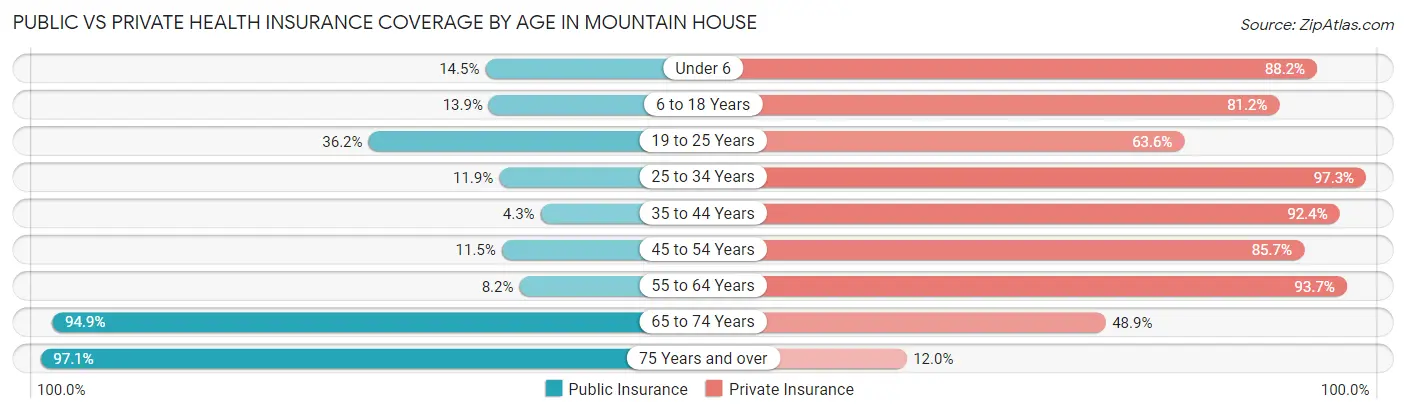
| Age Bracket | Public Insurance | Private Insurance |
| Under 6 | 253 (14.5%) | 1,539 (88.2%) |
| 6 to 18 Years | 828 (13.9%) | 4,852 (81.2%) |
| 19 to 25 Years | 833 (36.2%) | 1,463 (63.5%) |
| 25 to 34 Years | 246 (11.9%) | 2,006 (97.3%) |
| 35 to 44 Years | 175 (4.3%) | 3,804 (92.4%) |
| 45 to 54 Years | 388 (11.5%) | 2,904 (85.7%) |
| 55 to 64 Years | 175 (8.2%) | 2,008 (93.7%) |
| 65 to 74 Years | 1,341 (94.9%) | 691 (48.9%) |
| 75 Years and over | 430 (97.1%) | 53 (12.0%) |
| Total | 4,669 (19.8%) | 19,320 (81.9%) |
Disability Status by Sex by Age in Mountain House
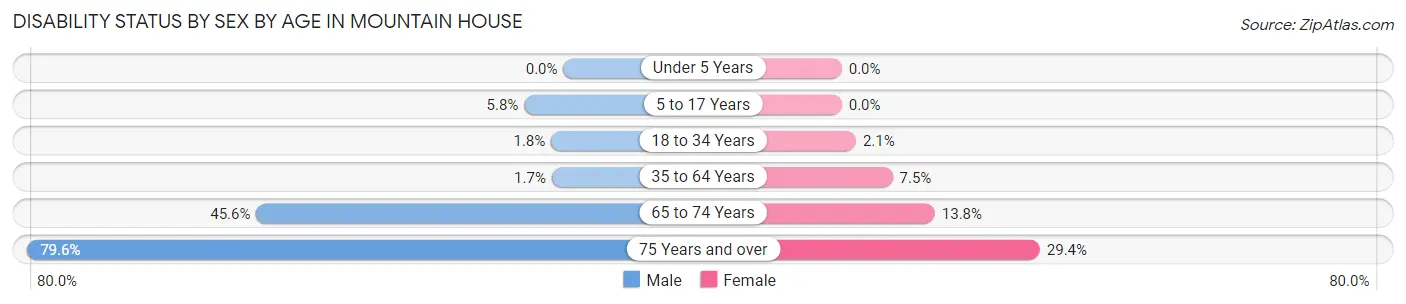
| Age Bracket | Male | Female |
| Under 5 Years | 0 (0.0%) | 0 (0.0%) |
| 5 to 17 Years | 184 (5.8%) | 0 (0.0%) |
| 18 to 34 Years | 49 (1.8%) | 43 (2.1%) |
| 35 to 64 Years | 82 (1.7%) | 369 (7.5%) |
| 65 to 74 Years | 321 (45.6%) | 98 (13.8%) |
| 75 Years and over | 82 (79.6%) | 100 (29.4%) |
Disability Class by Sex by Age in Mountain House
Disability Class: Hearing Difficulty
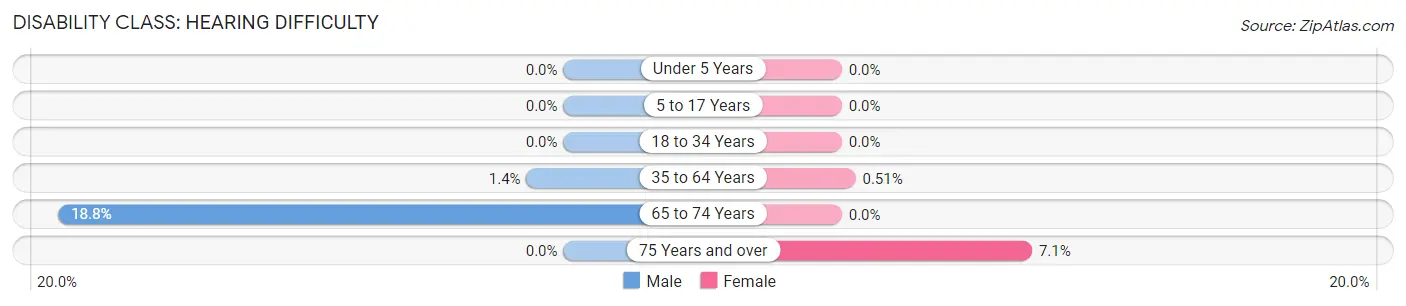
| Age Bracket | Male | Female |
| Under 5 Years | 0 (0.0%) | 0 (0.0%) |
| 5 to 17 Years | 0 (0.0%) | 0 (0.0%) |
| 18 to 34 Years | 0 (0.0%) | 0 (0.0%) |
| 35 to 64 Years | 65 (1.4%) | 25 (0.5%) |
| 65 to 74 Years | 132 (18.8%) | 0 (0.0%) |
| 75 Years and over | 0 (0.0%) | 24 (7.1%) |
Disability Class: Vision Difficulty
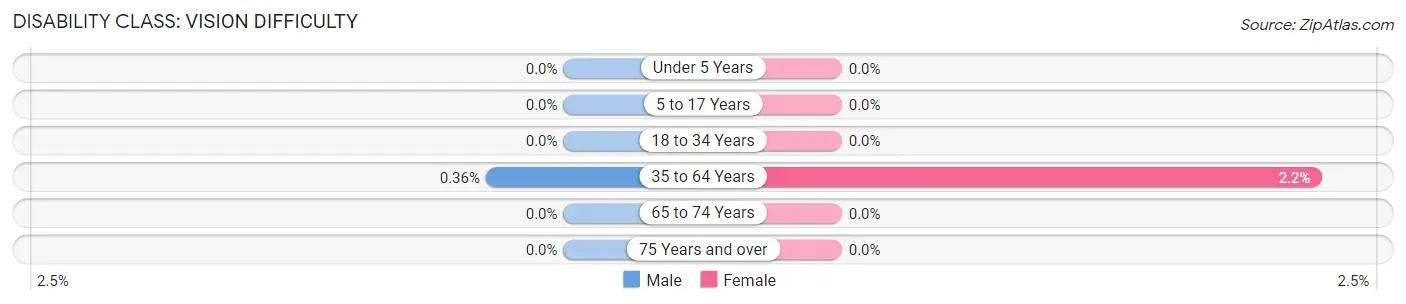
| Age Bracket | Male | Female |
| Under 5 Years | 0 (0.0%) | 0 (0.0%) |
| 5 to 17 Years | 0 (0.0%) | 0 (0.0%) |
| 18 to 34 Years | 0 (0.0%) | 0 (0.0%) |
| 35 to 64 Years | 17 (0.4%) | 109 (2.2%) |
| 65 to 74 Years | 0 (0.0%) | 0 (0.0%) |
| 75 Years and over | 0 (0.0%) | 0 (0.0%) |
Disability Class: Cognitive Difficulty
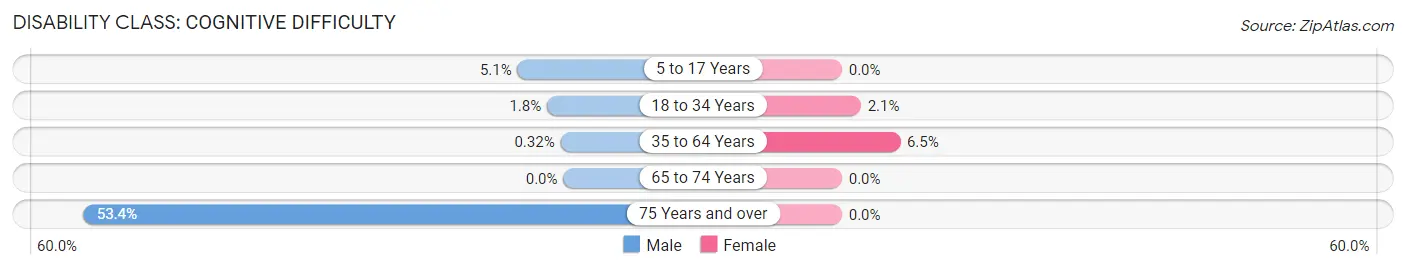
| Age Bracket | Male | Female |
| 5 to 17 Years | 161 (5.1%) | 0 (0.0%) |
| 18 to 34 Years | 49 (1.8%) | 43 (2.1%) |
| 35 to 64 Years | 15 (0.3%) | 317 (6.5%) |
| 65 to 74 Years | 0 (0.0%) | 0 (0.0%) |
| 75 Years and over | 55 (53.4%) | 0 (0.0%) |
Disability Class: Ambulatory Difficulty
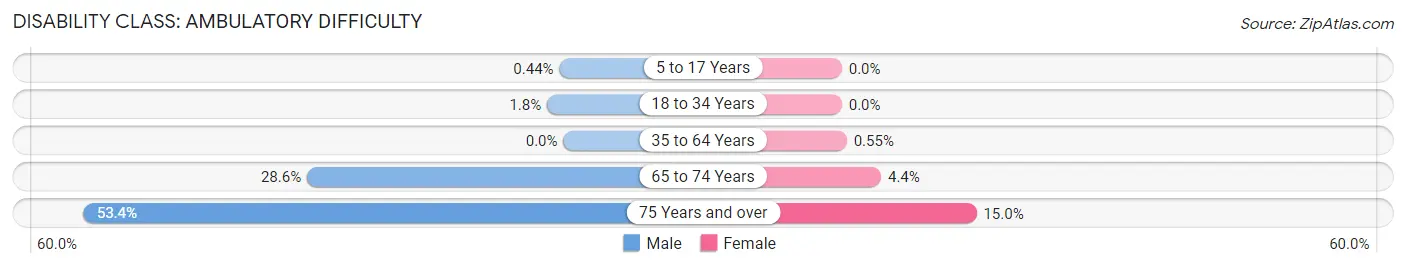
| Age Bracket | Male | Female |
| 5 to 17 Years | 14 (0.4%) | 0 (0.0%) |
| 18 to 34 Years | 49 (1.8%) | 0 (0.0%) |
| 35 to 64 Years | 0 (0.0%) | 27 (0.5%) |
| 65 to 74 Years | 201 (28.5%) | 31 (4.4%) |
| 75 Years and over | 55 (53.4%) | 51 (15.0%) |
Disability Class: Self-Care Difficulty
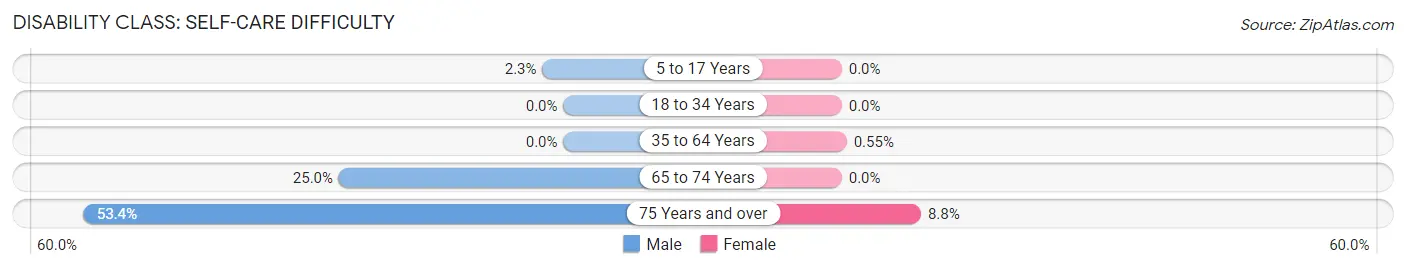
| Age Bracket | Male | Female |
| 5 to 17 Years | 74 (2.3%) | 0 (0.0%) |
| 18 to 34 Years | 0 (0.0%) | 0 (0.0%) |
| 35 to 64 Years | 0 (0.0%) | 27 (0.5%) |
| 65 to 74 Years | 176 (25.0%) | 0 (0.0%) |
| 75 Years and over | 55 (53.4%) | 30 (8.8%) |
Technology Access in Mountain House
Computing Device Access in Mountain House
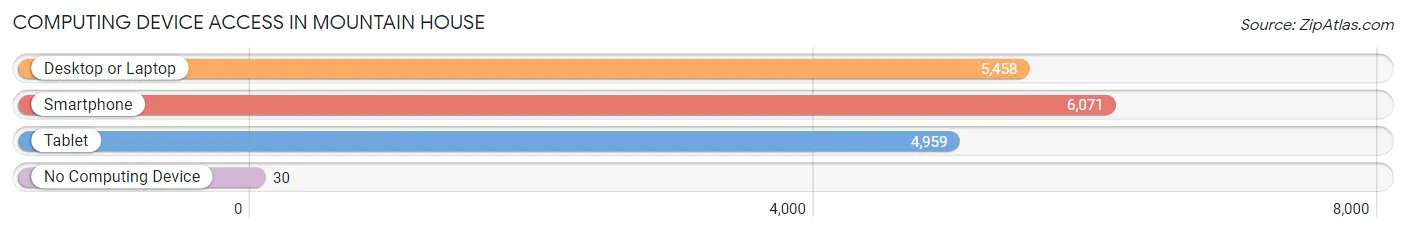
| Device Type | # Households | % Households |
| Desktop or Laptop | 5,458 | 88.6% |
| Smartphone | 6,071 | 98.6% |
| Tablet | 4,959 | 80.5% |
| No Computing Device | 30 | 0.5% |
| Total | 6,159 | 100.0% |
Internet Access in Mountain House
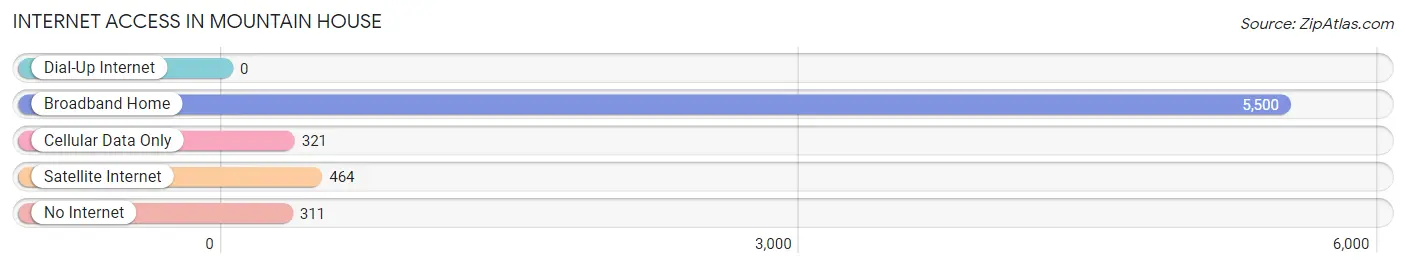
| Internet Type | # Households | % Households |
| Dial-Up Internet | 0 | 0.0% |
| Broadband Home | 5,500 | 89.3% |
| Cellular Data Only | 321 | 5.2% |
| Satellite Internet | 464 | 7.5% |
| No Internet | 311 | 5.1% |
| Total | 6,159 | 100.0% |
Mountain House Summary
Mountain House is a census-designated place (CDP) located in San Joaquin County, California, United States. The population was 8,521 at the 2010 census, up from 7,531 at the 2000 census. Mountain House is located in the San Francisco Bay Area, approximately 25 miles east of Tracy and 45 miles south of Sacramento.
History
Mountain House was founded in 1856 by a group of settlers from the East Coast. The settlers were attracted to the area by the abundance of natural resources, including timber, water, and fertile soil. The town was originally called Mountain House Station, and was a stop on the Central Pacific Railroad. The town was renamed Mountain House in 1876.
In the early 1900s, Mountain House was a thriving agricultural community, with orchards, vineyards, and dairy farms. The town was also home to a number of small businesses, including a blacksmith shop, a general store, and a post office.
In the 1950s, Mountain House began to experience rapid growth as the population of the San Francisco Bay Area increased. The town was incorporated in 1965, and the population continued to grow throughout the 1970s and 1980s.
Geography
Mountain House is located at 37 45 25 North 121 25 17 West 37 756944 121 421389
According to the United States Census Bureau, the CDP has a total area of 8.3 square miles (21.5 km2), all of it land.
Economy
Mountain House is a bedroom community for the San Francisco Bay Area, with many residents commuting to jobs in the Bay Area. The town is also home to a number of businesses, including a grocery store, a hardware store, and a number of restaurants.
Demographics
As of the census of 2000, there were 7,531 people, 2,541 households, and 2,072 families residing in the CDP. The population density was 908.3 people per square mile (351.2/km2). There were 2,619 housing units at an average density of 315.7 per square mile (121.8/km2). The racial makeup of the CDP was 74.2% White, 0.9% African American, 0.7% Native American, 11.2% Asian, 0.2% Pacific Islander, 9.2% from other races, and 3.7% from two or more races. Hispanic or Latino of any race were 19.2% of the population.
There were 2,541 households, out of which 48.2% had children under the age of 18 living with them, 68.2% were married couples living together, 9.2% had a female householder with no husband present, and 18.2% were non-families. 13.2% of all households were made up of individuals, and 2.7% had someone living alone who was 65 years of age or older. The average household size was 2.97 and the average family size was 3.25.
In the CDP, the population was spread out, with 30.2% under the age of 18, 6.2% from 18 to 24, 37.2% from 25 to 44, 21.2% from 45 to 64, and 5.2% who were 65 years of age or older. The median age was 34 years. For every 100 females, there were 98.2 males. For every 100 females age 18 and over, there were 95.2 males.
The median income for a household in the CDP was $76,945, and the median income for a family was $80,945. Males had a median income of $51,945 versus $37,945 for females. The per capita income for the CDP was $27,945. About 2.7% of families and 3.2% of the population were below the poverty line, including 3.7% of those under age 18 and none of those age 65 or over.
Common Questions
What is Per Capita Income in Mountain House?
Per Capita income in Mountain House is $47,916.
What is the Median Family Income in Mountain House?
Median Family Income in Mountain House is $174,130.
What is the Median Household income in Mountain House?
Median Household Income in Mountain House is $166,821.
What is Income or Wage Gap in Mountain House?
Income or Wage Gap in Mountain House is 44.1%.
Women in Mountain House earn 55.9 cents for every dollar earned by a man.
What is Inequality or Gini Index in Mountain House?
Inequality or Gini Index in Mountain House is 0.31.
What is the Total Population of Mountain House?
Total Population of Mountain House is 23,590.
What is the Total Male Population of Mountain House?
Total Male Population of Mountain House is 12,067.
What is the Total Female Population of Mountain House?
Total Female Population of Mountain House is 11,523.
What is the Ratio of Males per 100 Females in Mountain House?
There are 104.72 Males per 100 Females in Mountain House.
What is the Ratio of Females per 100 Males in Mountain House?
There are 95.49 Females per 100 Males in Mountain House.
What is the Median Population Age in Mountain House?
Median Population Age in Mountain House is 34.3 Years.
What is the Average Family Size in Mountain House
Average Family Size in Mountain House is 4.1 People.
What is the Average Household Size in Mountain House
Average Household Size in Mountain House is 3.8 People.
How Large is the Labor Force in Mountain House?
There are 11,210 People in the Labor Forcein in Mountain House.
What is the Percentage of People in the Labor Force in Mountain House?
64.8% of People are in the Labor Force in Mountain House.
What is the Unemployment Rate in Mountain House?
Unemployment Rate in Mountain House is 3.6%.