Hoopa, CA Map & Demographics
Hoopa Map
Hoopa Overview
$21,058
PER CAPITA INCOME
$77,695
AVG FAMILY INCOME
$55,000
AVG HOUSEHOLD INCOME
2.4%
WAGE / INCOME GAP [ % ]
97.6¢/ $1
WAGE / INCOME GAP [ $ ]
$12,873
FAMILY INCOME DEFICIT
0.45
INEQUALITY / GINI INDEX
2,489
TOTAL POPULATION
1,083
MALE POPULATION
1,406
FEMALE POPULATION
77.03
MALES / 100 FEMALES
129.82
FEMALES / 100 MALES
33.3
MEDIAN AGE
3.7
AVG FAMILY SIZE
3.4
AVG HOUSEHOLD SIZE
884
LABOR FORCE [ PEOPLE ]
46.5%
PERCENT IN LABOR FORCE
17.9%
UNEMPLOYMENT RATE
Hoopa Zip Codes
Hoopa Area Codes
Income in Hoopa
Income Overview in Hoopa
Per Capita Income in Hoopa is $21,058, while median incomes of families and households are $77,695 and $55,000 respectively.
| Characteristic | Number | Measure |
| Per Capita Income | 2,489 | $21,058 |
| Median Family Income | 563 | $77,695 |
| Mean Family Income | 563 | $79,613 |
| Median Household Income | 730 | $55,000 |
| Mean Household Income | 730 | $72,129 |
| Income Deficit | 563 | $12,873 |
| Wage / Income Gap (%) | 2,489 | 2.41% |
| Wage / Income Gap ($) | 2,489 | 97.59¢ per $1 |
| Gini / Inequality Index | 2,489 | 0.45 |
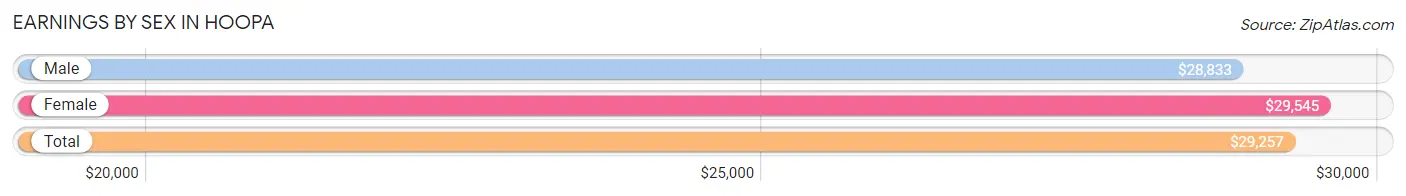
Earnings by Sex in Hoopa
Average Earnings in Hoopa are $29,257, $28,833 for men and $29,545 for women, a difference of 2.4%.
| Sex | Number | Average Earnings |
| Male | 404 (43.1%) | $28,833 |
| Female | 534 (56.9%) | $29,545 |
| Total | 938 (100.0%) | $29,257 |
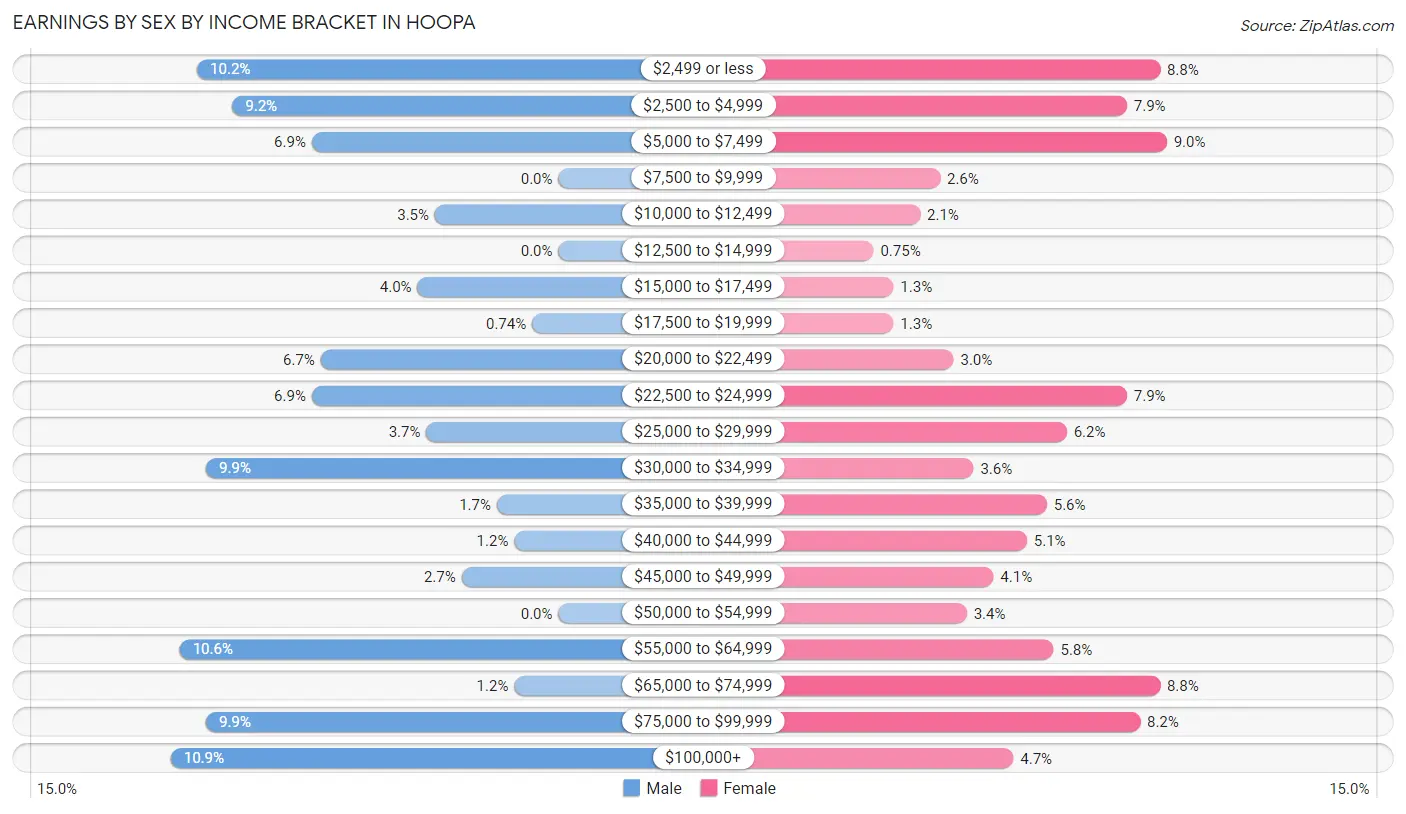
Earnings by Sex by Income Bracket in Hoopa
The most common earnings brackets in Hoopa are $100,000+ for men (44 | 10.9%) and $5,000 to $7,499 for women (48 | 9.0%).
| Income | Male | Female |
| $2,499 or less | 41 (10.2%) | 47 (8.8%) |
| $2,500 to $4,999 | 37 (9.2%) | 42 (7.9%) |
| $5,000 to $7,499 | 28 (6.9%) | 48 (9.0%) |
| $7,500 to $9,999 | 0 (0.0%) | 14 (2.6%) |
| $10,000 to $12,499 | 14 (3.5%) | 11 (2.1%) |
| $12,500 to $14,999 | 0 (0.0%) | 4 (0.7%) |
| $15,000 to $17,499 | 16 (4.0%) | 7 (1.3%) |
| $17,500 to $19,999 | 3 (0.7%) | 7 (1.3%) |
| $20,000 to $22,499 | 27 (6.7%) | 16 (3.0%) |
| $22,500 to $24,999 | 28 (6.9%) | 42 (7.9%) |
| $25,000 to $29,999 | 15 (3.7%) | 33 (6.2%) |
| $30,000 to $34,999 | 40 (9.9%) | 19 (3.6%) |
| $35,000 to $39,999 | 7 (1.7%) | 30 (5.6%) |
| $40,000 to $44,999 | 5 (1.2%) | 27 (5.1%) |
| $45,000 to $49,999 | 11 (2.7%) | 22 (4.1%) |
| $50,000 to $54,999 | 0 (0.0%) | 18 (3.4%) |
| $55,000 to $64,999 | 43 (10.6%) | 31 (5.8%) |
| $65,000 to $74,999 | 5 (1.2%) | 47 (8.8%) |
| $75,000 to $99,999 | 40 (9.9%) | 44 (8.2%) |
| $100,000+ | 44 (10.9%) | 25 (4.7%) |
| Total | 404 (100.0%) | 534 (100.0%) |
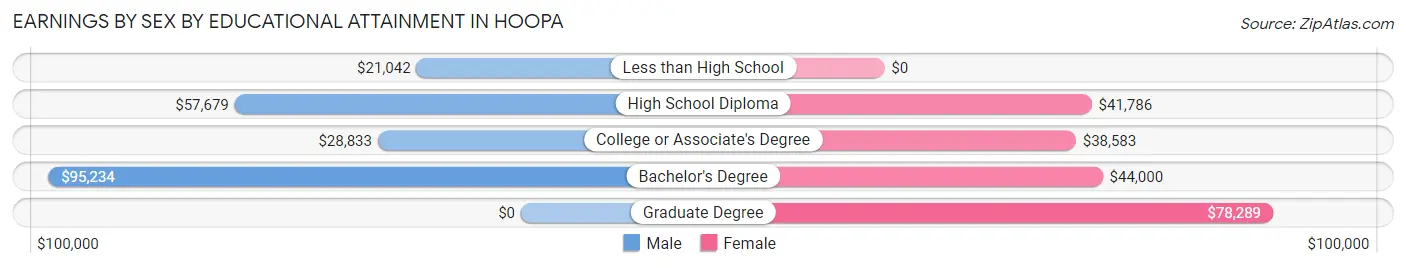
Earnings by Sex by Educational Attainment in Hoopa
Average earnings in Hoopa are $39,286 for men and $44,188 for women, a difference of 11.1%. Men with an educational attainment of bachelor's degree enjoy the highest average annual earnings of $95,234, while those with less than high school education earn the least with $21,042. Women with an educational attainment of graduate degree earn the most with the average annual earnings of $78,289, while those with college or associate's degree education have the smallest earnings of $38,583.
| Educational Attainment | Male Income | Female Income |
| Less than High School | $21,042 | $0 |
| High School Diploma | $57,679 | $41,786 |
| College or Associate's Degree | $28,833 | $38,583 |
| Bachelor's Degree | $95,234 | $44,000 |
| Graduate Degree | - | - |
| Total | $39,286 | $44,188 |
Family Income in Hoopa
Family Income Brackets in Hoopa
According to the Hoopa family income data, there are 176 families falling into the $75,000 to $99,999 income range, which is the most common income bracket and makes up 31.3% of all families. Conversely, the $10,000 to $14,999 income bracket is the least frequent group with only 12 families (2.1%) belonging to this category.
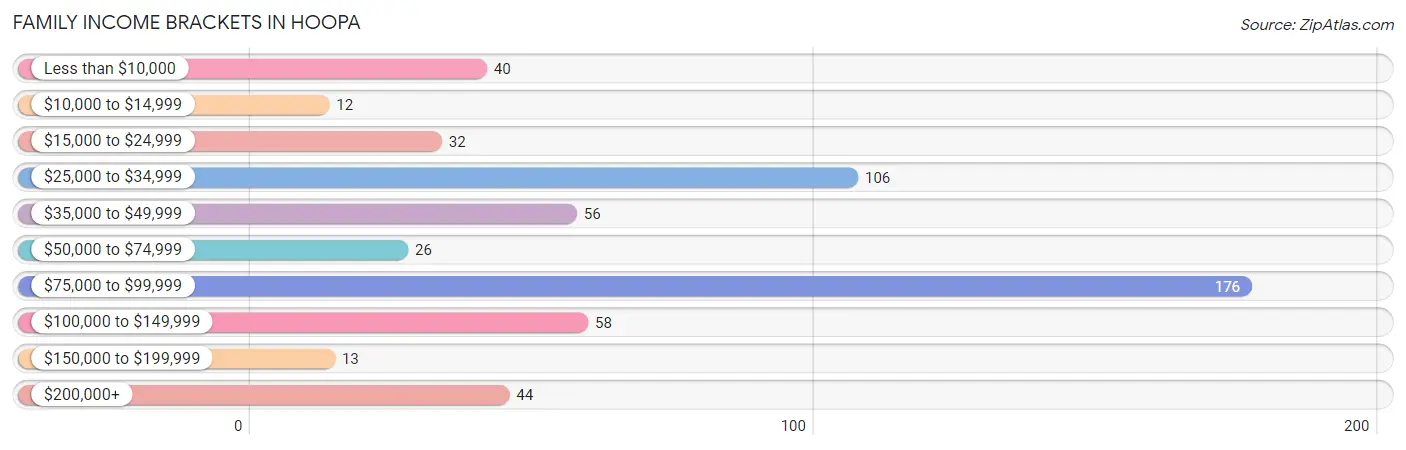
| Income Bracket | # Families | % Families |
| Less than $10,000 | 40 | 7.1% |
| $10,000 to $14,999 | 12 | 2.1% |
| $15,000 to $24,999 | 32 | 5.7% |
| $25,000 to $34,999 | 106 | 18.8% |
| $35,000 to $49,999 | 56 | 9.9% |
| $50,000 to $74,999 | 26 | 4.6% |
| $75,000 to $99,999 | 176 | 31.3% |
| $100,000 to $149,999 | 58 | 10.3% |
| $150,000 to $199,999 | 13 | 2.3% |
| $200,000+ | 44 | 7.8% |
Family Income by Famaliy Size in Hoopa
6-person families (104 | 18.5%) account for the highest median family income in Hoopa with $93,720 per family, while 2-person families (152 | 27.0%) have the highest median income of $24,286 per family member.
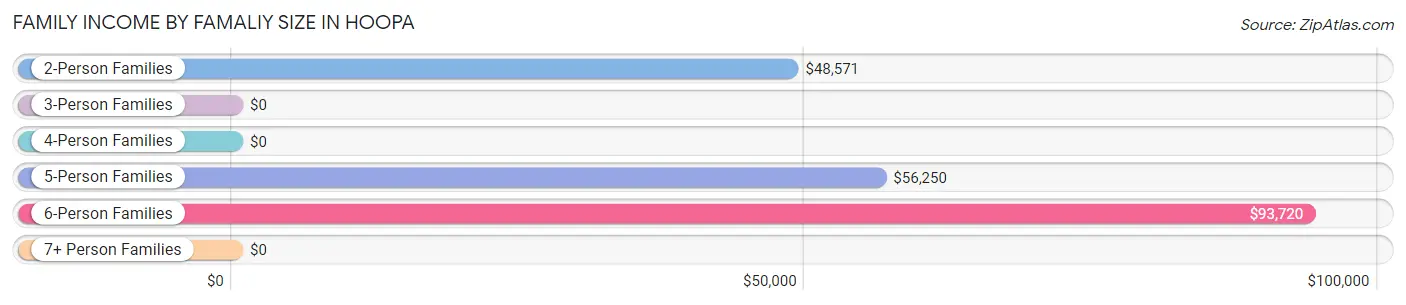
| Income Bracket | # Families | Median Income |
| 2-Person Families | 152 (27.0%) | $48,571 |
| 3-Person Families | 156 (27.7%) | $0 |
| 4-Person Families | 89 (15.8%) | $0 |
| 5-Person Families | 46 (8.2%) | $56,250 |
| 6-Person Families | 104 (18.5%) | $93,720 |
| 7+ Person Families | 16 (2.8%) | $0 |
| Total | 563 (100.0%) | $77,695 |
Family Income by Number of Earners in Hoopa
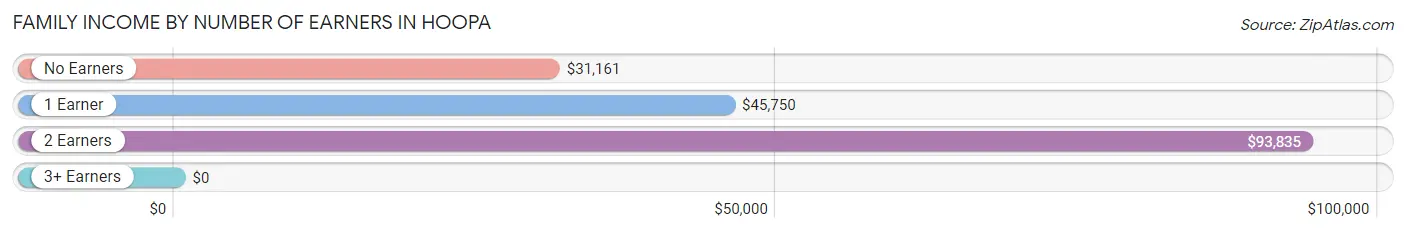
| Number of Earners | # Families | Median Income |
| No Earners | 127 (22.6%) | $31,161 |
| 1 Earner | 166 (29.5%) | $45,750 |
| 2 Earners | 228 (40.5%) | $93,835 |
| 3+ Earners | 42 (7.5%) | $0 |
| Total | 563 (100.0%) | $77,695 |
Household Income in Hoopa
Household Income Brackets in Hoopa
With 142 households falling in the category, the $100,000 to $149,999 income range is the most frequent in Hoopa, accounting for 19.5% of all households. In contrast, only 20 households (2.7%) fall into the $150,000 to $199,999 income bracket, making it the least populous group.
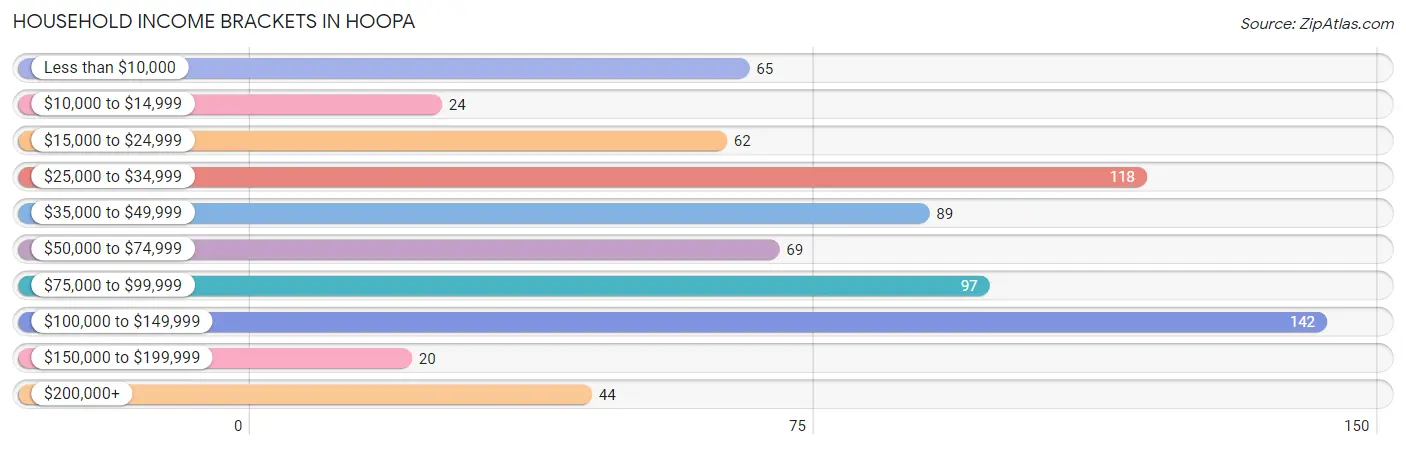
| Income Bracket | # Households | % Households |
| Less than $10,000 | 65 | 8.9% |
| $10,000 to $14,999 | 24 | 3.3% |
| $15,000 to $24,999 | 62 | 8.5% |
| $25,000 to $34,999 | 118 | 16.2% |
| $35,000 to $49,999 | 89 | 12.2% |
| $50,000 to $74,999 | 69 | 9.5% |
| $75,000 to $99,999 | 97 | 13.3% |
| $100,000 to $149,999 | 142 | 19.5% |
| $150,000 to $199,999 | 20 | 2.7% |
| $200,000+ | 44 | 6.0% |
Household Income by Householder Age in Hoopa
The median household income in Hoopa is $55,000, with the highest median household income of $68,194 found in the 65+ years age bracket for the primary householder. A total of 265 households (36.3%) fall into this category. Meanwhile, the 15 to 24 years age bracket for the primary householder has the lowest median household income of $0, with 18 households (2.5%) in this group.
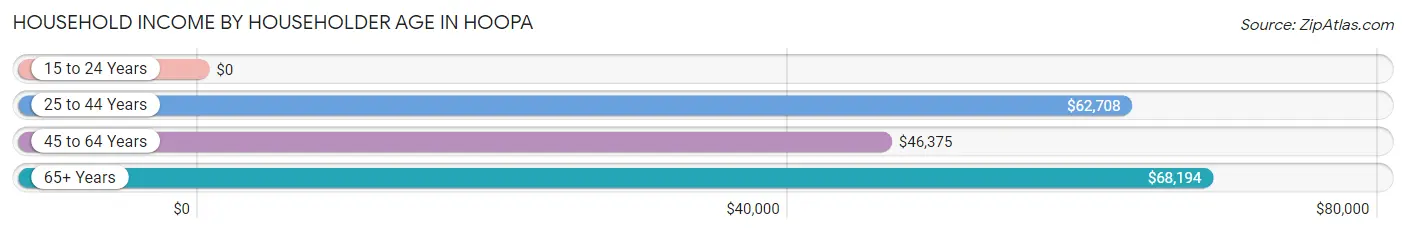
| Income Bracket | # Households | Median Income |
| 15 to 24 Years | 18 (2.5%) | $0 |
| 25 to 44 Years | 164 (22.5%) | $62,708 |
| 45 to 64 Years | 283 (38.8%) | $46,375 |
| 65+ Years | 265 (36.3%) | $68,194 |
| Total | 730 (100.0%) | $55,000 |
Poverty in Hoopa
Income Below Poverty by Sex and Age in Hoopa
With 26.8% poverty level for males and 29.8% for females among the residents of Hoopa, under 5 year old males and 15 year old females are the most vulnerable to poverty, with 47 males (67.1%) and 11 females (100.0%) in their respective age groups living below the poverty level.
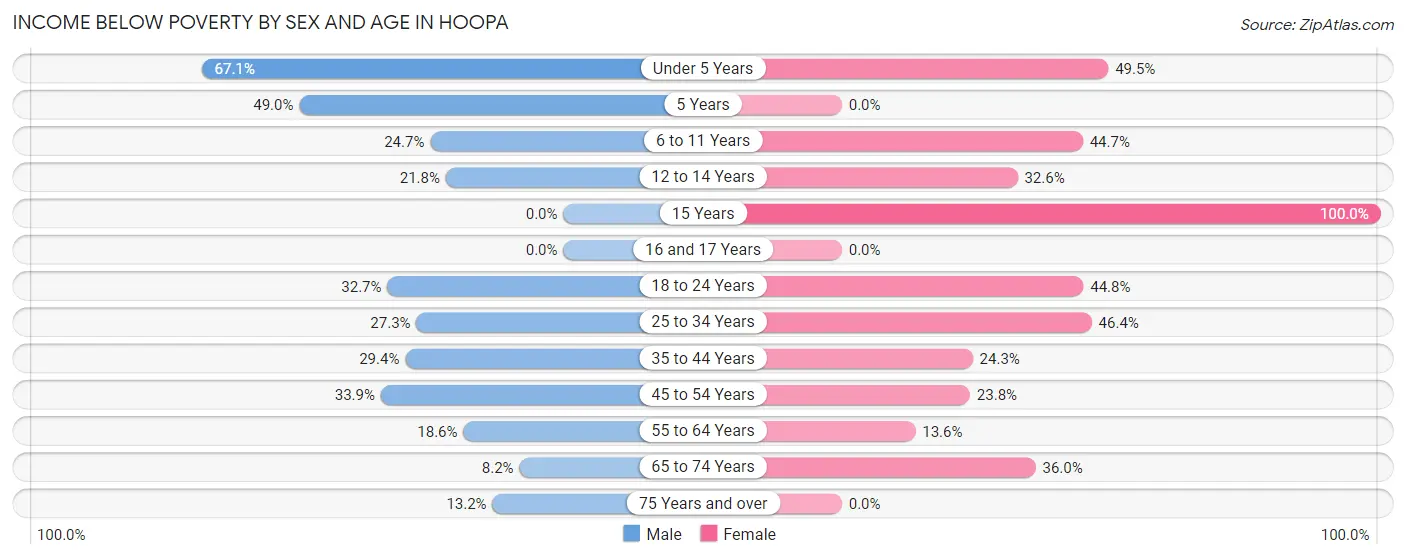
| Age Bracket | Male | Female |
| Under 5 Years | 47 (67.1%) | 45 (49.4%) |
| 5 Years | 25 (49.0%) | 0 (0.0%) |
| 6 to 11 Years | 21 (24.7%) | 55 (44.7%) |
| 12 to 14 Years | 12 (21.8%) | 15 (32.6%) |
| 15 Years | 0 (0.0%) | 11 (100.0%) |
| 16 and 17 Years | 0 (0.0%) | 0 (0.0%) |
| 18 to 24 Years | 49 (32.7%) | 91 (44.8%) |
| 25 to 34 Years | 33 (27.3%) | 64 (46.4%) |
| 35 to 44 Years | 27 (29.3%) | 34 (24.3%) |
| 45 to 54 Years | 41 (33.9%) | 34 (23.8%) |
| 55 to 64 Years | 18 (18.6%) | 21 (13.6%) |
| 65 to 74 Years | 12 (8.2%) | 41 (36.0%) |
| 75 Years and over | 5 (13.2%) | 0 (0.0%) |
| Total | 290 (26.8%) | 411 (29.8%) |
Income Above Poverty by Sex and Age in Hoopa
According to the poverty statistics in Hoopa, males aged 15 years and females aged 5 years are the age groups that are most secure financially, with 100.0% of males and 100.0% of females in these age groups living above the poverty line.
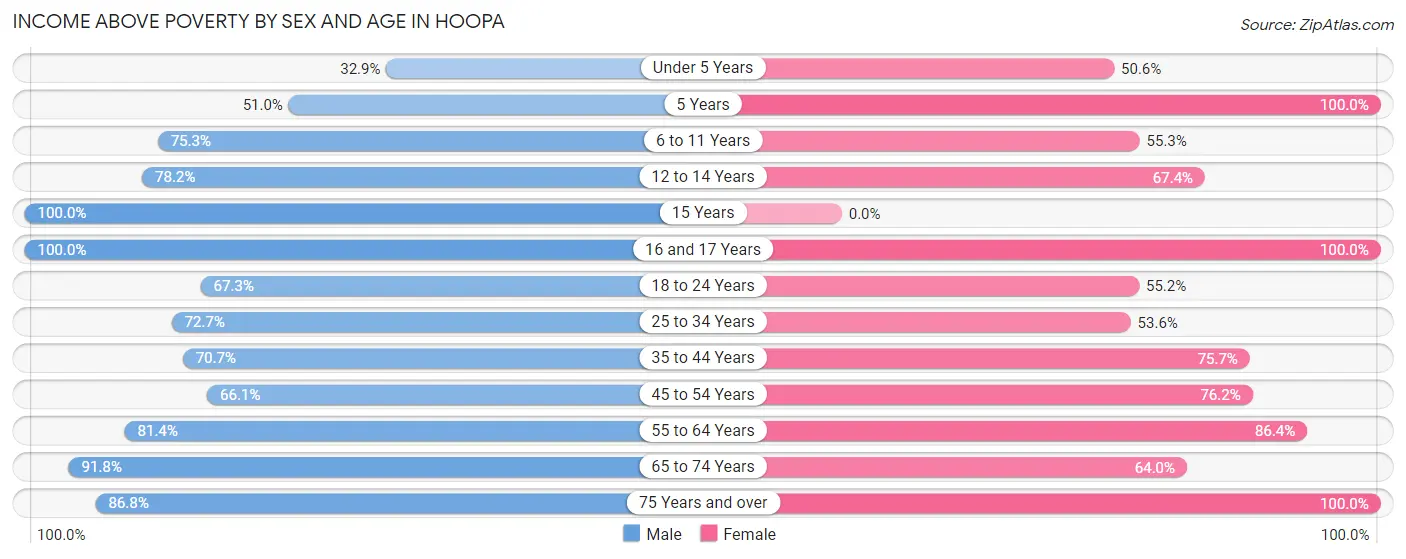
| Age Bracket | Male | Female |
| Under 5 Years | 23 (32.9%) | 46 (50.5%) |
| 5 Years | 26 (51.0%) | 17 (100.0%) |
| 6 to 11 Years | 64 (75.3%) | 68 (55.3%) |
| 12 to 14 Years | 43 (78.2%) | 31 (67.4%) |
| 15 Years | 15 (100.0%) | 0 (0.0%) |
| 16 and 17 Years | 40 (100.0%) | 35 (100.0%) |
| 18 to 24 Years | 101 (67.3%) | 112 (55.2%) |
| 25 to 34 Years | 88 (72.7%) | 74 (53.6%) |
| 35 to 44 Years | 65 (70.7%) | 106 (75.7%) |
| 45 to 54 Years | 80 (66.1%) | 109 (76.2%) |
| 55 to 64 Years | 79 (81.4%) | 133 (86.4%) |
| 65 to 74 Years | 135 (91.8%) | 73 (64.0%) |
| 75 Years and over | 33 (86.8%) | 166 (100.0%) |
| Total | 792 (73.2%) | 970 (70.2%) |
Income Below Poverty Among Married-Couple Families in Hoopa
The poverty statistics for married-couple families in Hoopa show that 22.8% or 49 of the total 215 families live below the poverty line. Families with 5 or more children have the highest poverty rate of 100.0%, comprising of 6 families. On the other hand, families with no children have the lowest poverty rate of 11.9%, which includes 13 families.
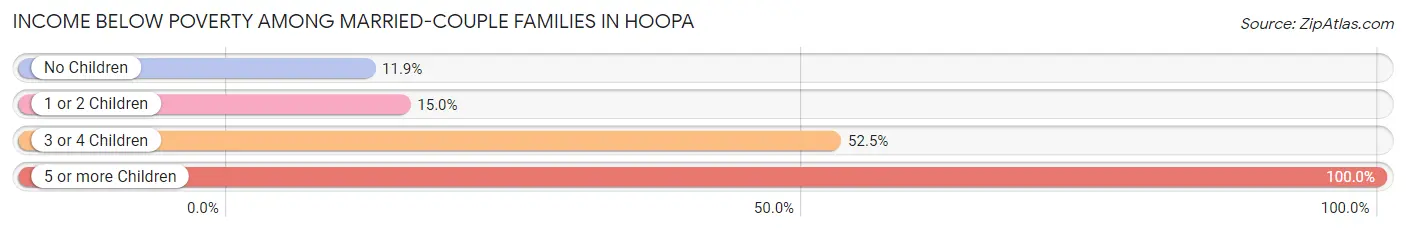
| Children | Above Poverty | Below Poverty |
| No Children | 96 (88.1%) | 13 (11.9%) |
| 1 or 2 Children | 51 (85.0%) | 9 (15.0%) |
| 3 or 4 Children | 19 (47.5%) | 21 (52.5%) |
| 5 or more Children | 0 (0.0%) | 6 (100.0%) |
| Total | 166 (77.2%) | 49 (22.8%) |
Income Below Poverty Among Single-Parent Households in Hoopa
According to the poverty data in Hoopa, 10.8% or 17 single-father households and 21.0% or 40 single-mother households are living below the poverty line. Among single-father households, those with 5 or more children have the highest poverty rate, with 4 households (100.0%) experiencing poverty. Likewise, among single-mother households, those with 3 or 4 children have the highest poverty rate, with 7 households (100.0%) falling below the poverty line.
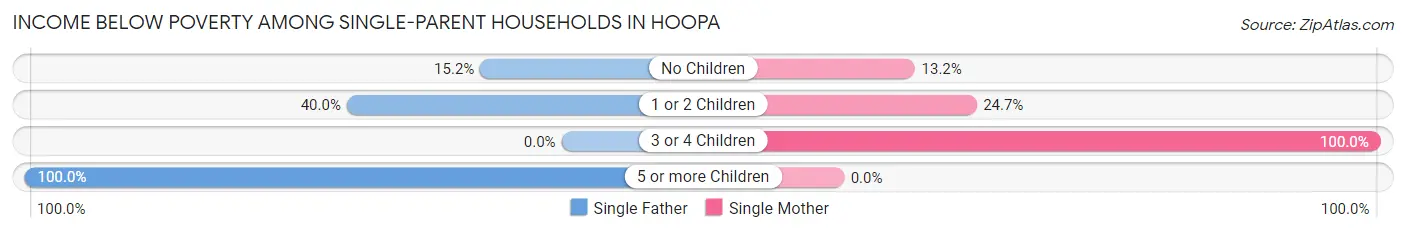
| Children | Single Father | Single Mother |
| No Children | 5 (15.1%) | 14 (13.2%) |
| 1 or 2 Children | 8 (40.0%) | 19 (24.7%) |
| 3 or 4 Children | 0 (0.0%) | 7 (100.0%) |
| 5 or more Children | 4 (100.0%) | 0 (0.0%) |
| Total | 17 (10.8%) | 40 (21.0%) |
Income Below Poverty Among Married-Couple vs Single-Parent Households in Hoopa
The poverty data for Hoopa shows that 49 of the married-couple family households (22.8%) and 57 of the single-parent households (16.4%) are living below the poverty level. Within the married-couple family households, those with 5 or more children have the highest poverty rate, with 6 households (100.0%) falling below the poverty line. Among the single-parent households, those with 5 or more children have the highest poverty rate, with 4 household (100.0%) living below poverty.
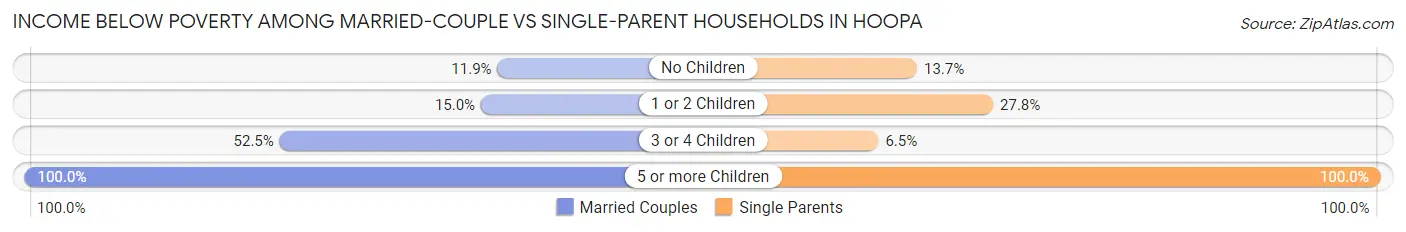
| Children | Married-Couple Families | Single-Parent Households |
| No Children | 13 (11.9%) | 19 (13.7%) |
| 1 or 2 Children | 9 (15.0%) | 27 (27.8%) |
| 3 or 4 Children | 21 (52.5%) | 7 (6.5%) |
| 5 or more Children | 6 (100.0%) | 4 (100.0%) |
| Total | 49 (22.8%) | 57 (16.4%) |
Race in Hoopa
The most populous races in Hoopa are Native / Alaskan (1,826 | 73.4%), Two or more Races (334 | 13.4%), and White / Caucasian (169 | 6.8%).
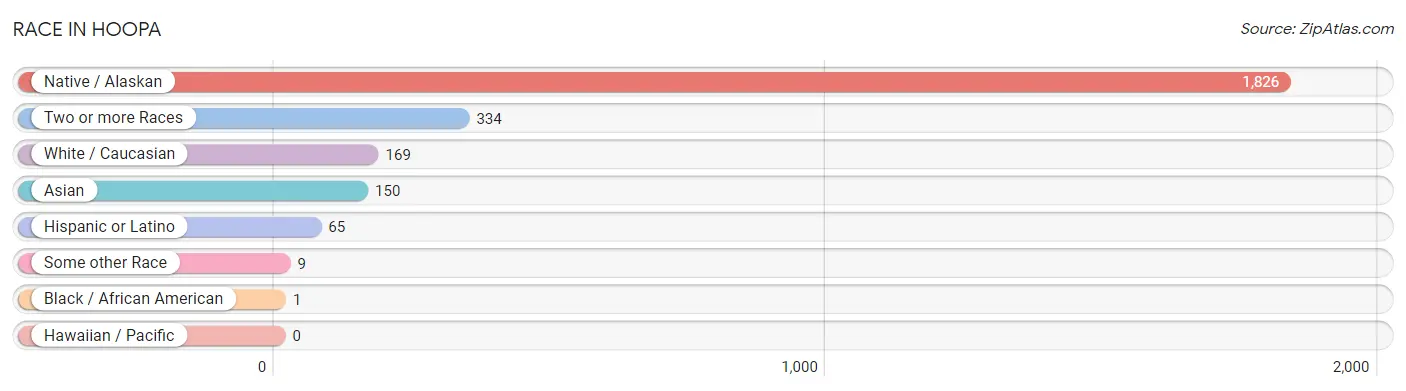
| Race | # Population | % Population |
| Asian | 150 | 6.0% |
| Black / African American | 1 | 0.0% |
| Hawaiian / Pacific | 0 | 0.0% |
| Hispanic or Latino | 65 | 2.6% |
| Native / Alaskan | 1,826 | 73.4% |
| White / Caucasian | 169 | 6.8% |
| Two or more Races | 334 | 13.4% |
| Some other Race | 9 | 0.4% |
| Total | 2,489 | 100.0% |
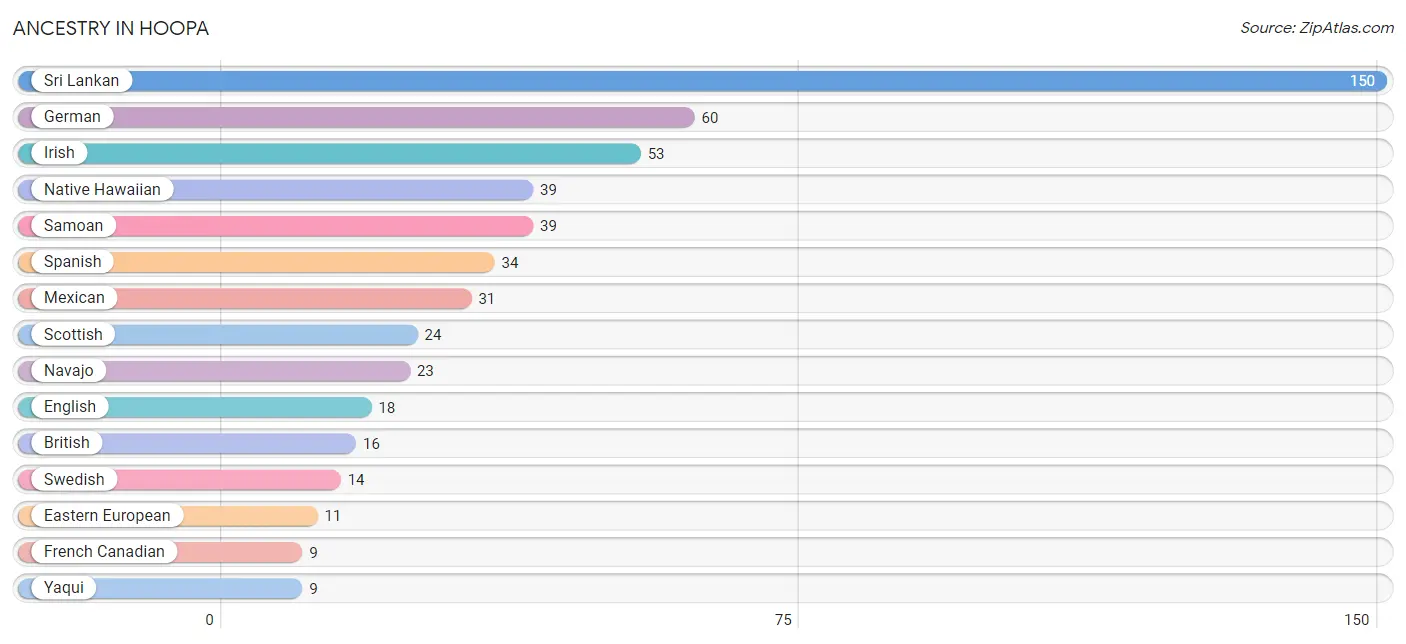
Ancestry in Hoopa
The most populous ancestries reported in Hoopa are Sri Lankan (150 | 6.0%), German (60 | 2.4%), Irish (53 | 2.1%), Native Hawaiian (39 | 1.6%), and Samoan (39 | 1.6%), together accounting for 13.7% of all Hoopa residents.
| Ancestry | # Population | % Population |
| British | 16 | 0.6% |
| Cherokee | 3 | 0.1% |
| Chippewa | 7 | 0.3% |
| Czech | 3 | 0.1% |
| Eastern European | 11 | 0.4% |
| English | 18 | 0.7% |
| Finnish | 7 | 0.3% |
| French | 6 | 0.2% |
| French Canadian | 9 | 0.4% |
| German | 60 | 2.4% |
| Irish | 53 | 2.1% |
| Iroquois | 7 | 0.3% |
| Italian | 7 | 0.3% |
| Jamaican | 7 | 0.3% |
| Japanese | 5 | 0.2% |
| Korean | 6 | 0.2% |
| Mexican | 31 | 1.3% |
| Native Hawaiian | 39 | 1.6% |
| Navajo | 23 | 0.9% |
| Norwegian | 6 | 0.2% |
| Paiute | 3 | 0.1% |
| Polish | 6 | 0.2% |
| Samoan | 39 | 1.6% |
| Scotch-Irish | 5 | 0.2% |
| Scottish | 24 | 1.0% |
| Spanish | 34 | 1.4% |
| Sri Lankan | 150 | 6.0% |
| Swedish | 14 | 0.6% |
| Swiss | 3 | 0.1% |
| Yaqui | 9 | 0.4% | View All 30 Rows |
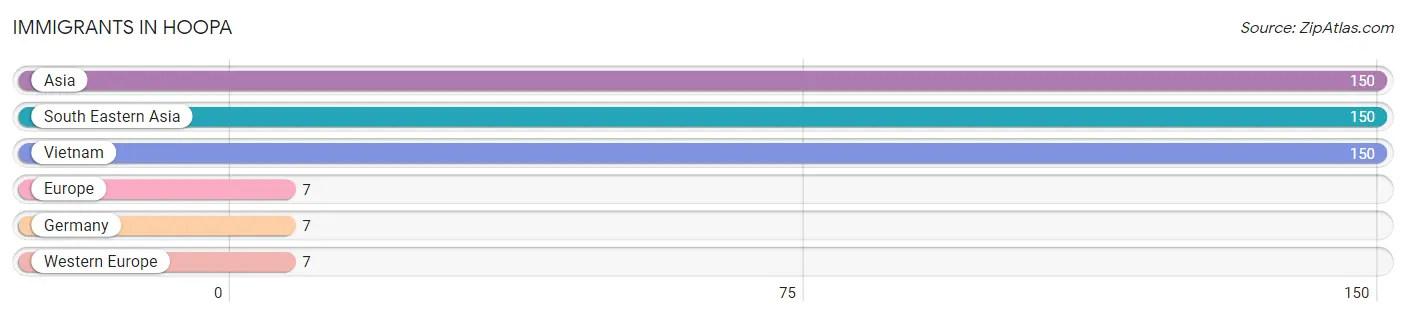
Immigrants in Hoopa
The most numerous immigrant groups reported in Hoopa came from Asia (150 | 6.0%), South Eastern Asia (150 | 6.0%), Vietnam (150 | 6.0%), Europe (7 | 0.3%), and Germany (7 | 0.3%), together accounting for 18.6% of all Hoopa residents.
| Immigration Origin | # Population | % Population |
| Asia | 150 | 6.0% |
| Europe | 7 | 0.3% |
| Germany | 7 | 0.3% |
| South Eastern Asia | 150 | 6.0% |
| Vietnam | 150 | 6.0% |
| Western Europe | 7 | 0.3% | View All 6 Rows |
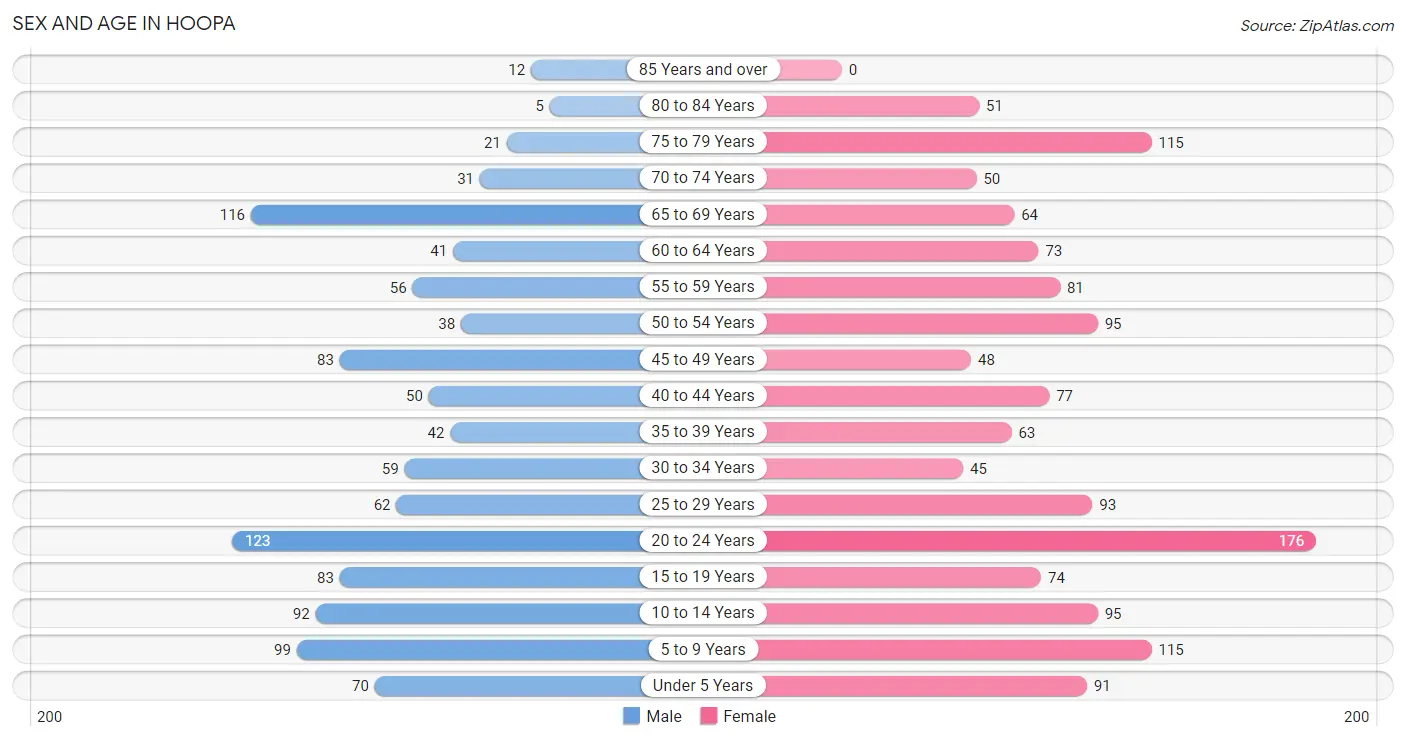
Sex and Age in Hoopa
Sex and Age in Hoopa
The most populous age groups in Hoopa are 20 to 24 Years (123 | 11.4%) for men and 20 to 24 Years (176 | 12.5%) for women.
| Age Bracket | Male | Female |
| Under 5 Years | 70 (6.5%) | 91 (6.5%) |
| 5 to 9 Years | 99 (9.1%) | 115 (8.2%) |
| 10 to 14 Years | 92 (8.5%) | 95 (6.8%) |
| 15 to 19 Years | 83 (7.7%) | 74 (5.3%) |
| 20 to 24 Years | 123 (11.4%) | 176 (12.5%) |
| 25 to 29 Years | 62 (5.7%) | 93 (6.6%) |
| 30 to 34 Years | 59 (5.4%) | 45 (3.2%) |
| 35 to 39 Years | 42 (3.9%) | 63 (4.5%) |
| 40 to 44 Years | 50 (4.6%) | 77 (5.5%) |
| 45 to 49 Years | 83 (7.7%) | 48 (3.4%) |
| 50 to 54 Years | 38 (3.5%) | 95 (6.8%) |
| 55 to 59 Years | 56 (5.2%) | 81 (5.8%) |
| 60 to 64 Years | 41 (3.8%) | 73 (5.2%) |
| 65 to 69 Years | 116 (10.7%) | 64 (4.5%) |
| 70 to 74 Years | 31 (2.9%) | 50 (3.6%) |
| 75 to 79 Years | 21 (1.9%) | 115 (8.2%) |
| 80 to 84 Years | 5 (0.5%) | 51 (3.6%) |
| 85 Years and over | 12 (1.1%) | 0 (0.0%) |
| Total | 1,083 (100.0%) | 1,406 (100.0%) |
Families and Households in Hoopa
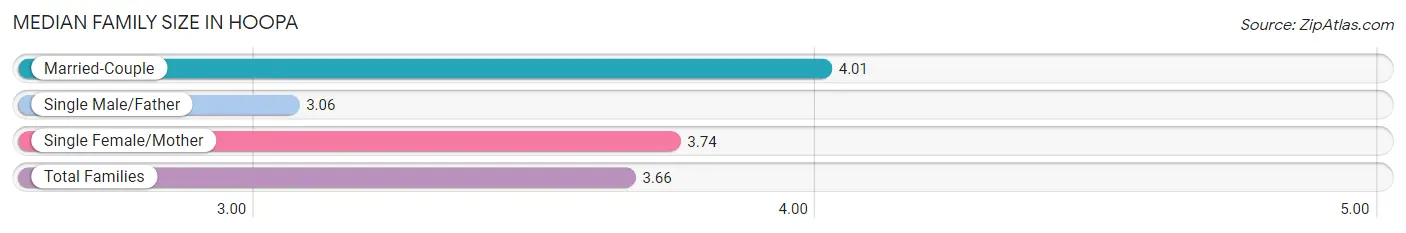
Median Family Size in Hoopa
The median family size in Hoopa is 3.66 persons per family, with married-couple families (215 | 38.2%) accounting for the largest median family size of 4.01 persons per family. On the other hand, single male/father families (158 | 28.1%) represent the smallest median family size with 3.06 persons per family.
| Family Type | # Families | Family Size |
| Married-Couple | 215 (38.2%) | 4.01 |
| Single Male/Father | 158 (28.1%) | 3.06 |
| Single Female/Mother | 190 (33.8%) | 3.74 |
| Total Families | 563 (100.0%) | 3.66 |
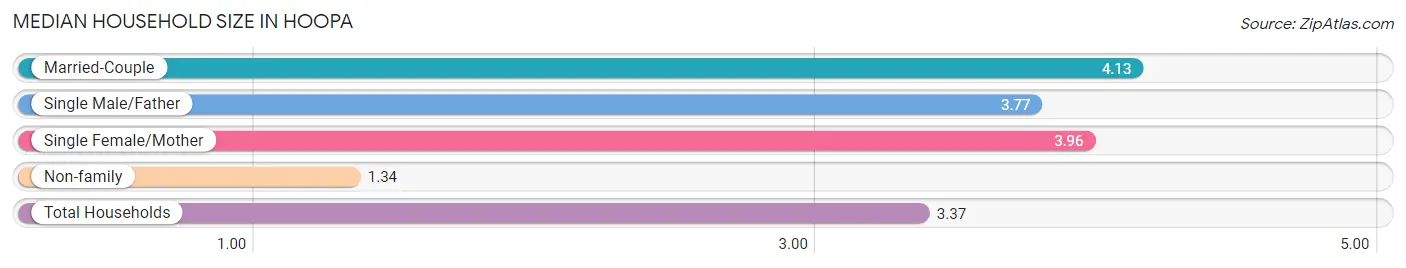
Median Household Size in Hoopa
The median household size in Hoopa is 3.37 persons per household, with married-couple households (215 | 29.4%) accounting for the largest median household size of 4.13 persons per household. non-family households (167 | 22.9%) represent the smallest median household size with 1.34 persons per household.
| Household Type | # Households | Household Size |
| Married-Couple | 215 (29.4%) | 4.13 |
| Single Male/Father | 158 (21.6%) | 3.77 |
| Single Female/Mother | 190 (26.0%) | 3.96 |
| Non-family | 167 (22.9%) | 1.34 |
| Total Households | 730 (100.0%) | 3.37 |
Household Size by Marriage Status in Hoopa
Out of a total of 730 households in Hoopa, 563 (77.1%) are family households, while 167 (22.9%) are nonfamily households. The most numerous type of family households are 3-person households, comprising 143, and the most common type of nonfamily households are 1-person households, comprising 119.
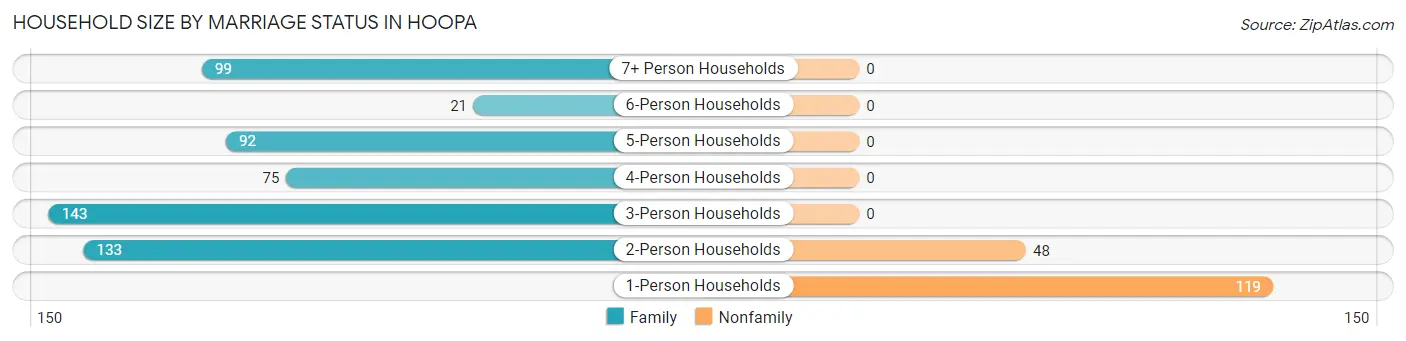
| Household Size | Family Households | Nonfamily Households |
| 1-Person Households | - | 119 (16.3%) |
| 2-Person Households | 133 (18.2%) | 48 (6.6%) |
| 3-Person Households | 143 (19.6%) | 0 (0.0%) |
| 4-Person Households | 75 (10.3%) | 0 (0.0%) |
| 5-Person Households | 92 (12.6%) | 0 (0.0%) |
| 6-Person Households | 21 (2.9%) | 0 (0.0%) |
| 7+ Person Households | 99 (13.6%) | 0 (0.0%) |
| Total | 563 (77.1%) | 167 (22.9%) |
Female Fertility in Hoopa
Fertility by Age in Hoopa
Average fertility rate in Hoopa is 129.0 births per 1,000 women. Women in the age bracket of 20 to 34 years have the highest fertility rate with 175.0 births per 1,000 women. Women in the age bracket of 20 to 34 years acount for 70.5% of all women with births.
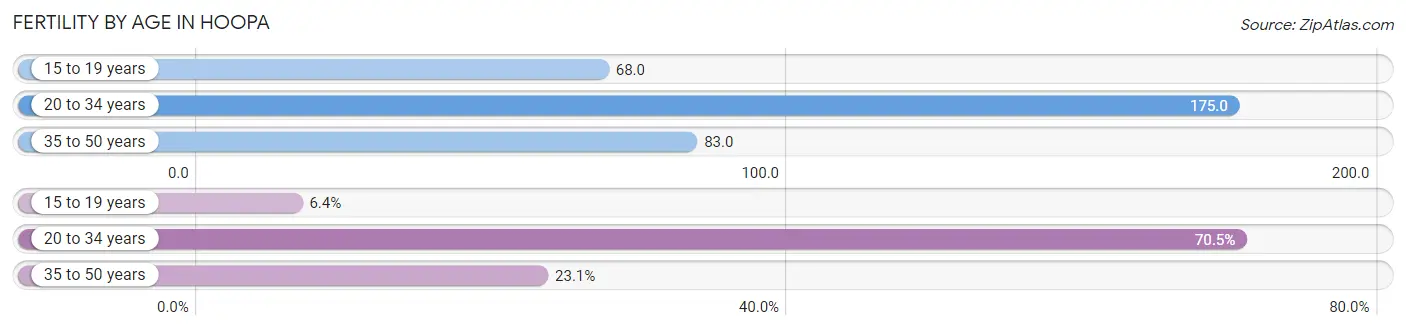
| Age Bracket | Women with Births | Births / 1,000 Women |
| 15 to 19 years | 5 (6.4%) | 68.0 |
| 20 to 34 years | 55 (70.5%) | 175.0 |
| 35 to 50 years | 18 (23.1%) | 83.0 |
| Total | 78 (100.0%) | 129.0 |
Fertility by Age by Marriage Status in Hoopa
24.4% of women with births (78) in Hoopa are married. The highest percentage of unmarried women with births falls into 15 to 19 years age bracket with 100.0% of them unmarried at the time of birth, while the lowest percentage of unmarried women with births belong to 35 to 50 years age bracket with 33.3% of them unmarried.
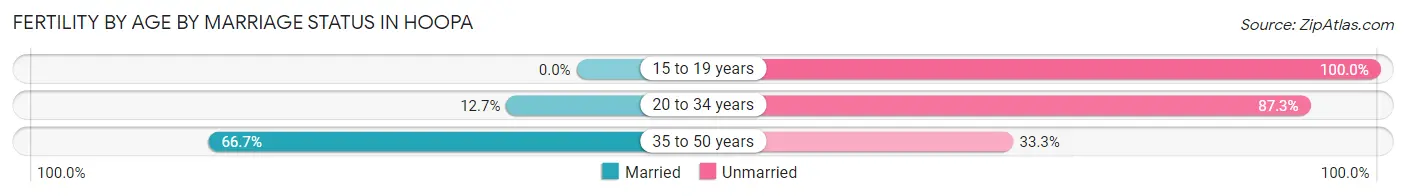
| Age Bracket | Married | Unmarried |
| 15 to 19 years | 0 (0.0%) | 5 (100.0%) |
| 20 to 34 years | 7 (12.7%) | 48 (87.3%) |
| 35 to 50 years | 12 (66.7%) | 6 (33.3%) |
| Total | 19 (24.4%) | 59 (75.6%) |
Fertility by Education in Hoopa
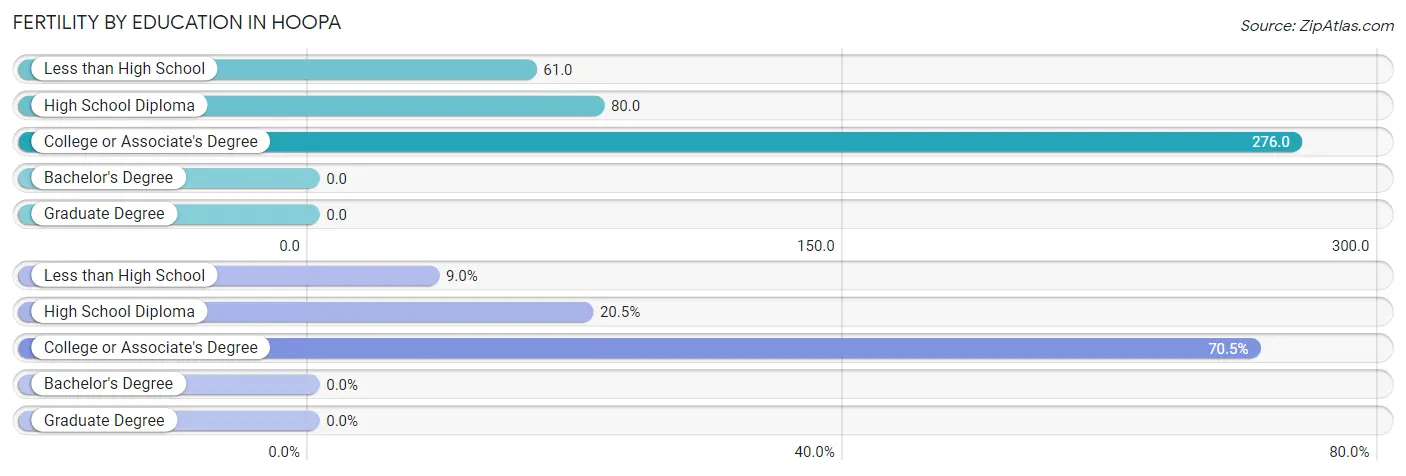
| Educational Attainment | Women with Births | Births / 1,000 Women |
| Less than High School | 7 (9.0%) | 61.0 |
| High School Diploma | 16 (20.5%) | 80.0 |
| College or Associate's Degree | 55 (70.5%) | 276.0 |
| Bachelor's Degree | 0 (0.0%) | 0.0 |
| Graduate Degree | 0 (0.0%) | 0.0 |
| Total | 78 (100.0%) | 129.0 |
Fertility by Education by Marriage Status in Hoopa
75.6% of women with births in Hoopa are unmarried. Women with the educational attainment of less than high school are most likely to be married with 100.0% of them married at childbirth, while women with the educational attainment of high school diploma are least likely to be married with 100.0% of them unmarried at childbirth.
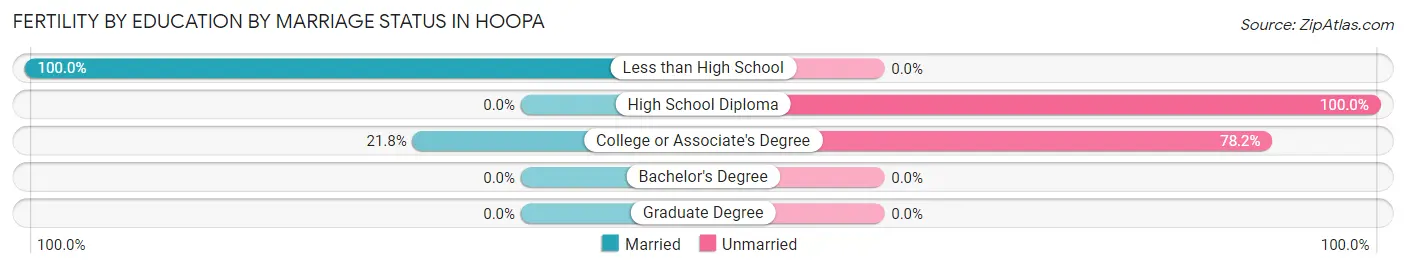
| Educational Attainment | Married | Unmarried |
| Less than High School | 7 (100.0%) | 0 (0.0%) |
| High School Diploma | 0 (0.0%) | 16 (100.0%) |
| College or Associate's Degree | 12 (21.8%) | 43 (78.2%) |
| Bachelor's Degree | 0 (0.0%) | 0 (0.0%) |
| Graduate Degree | 0 (0.0%) | 0 (0.0%) |
| Total | 19 (24.4%) | 59 (75.6%) |
Employment Characteristics in Hoopa
Employment by Class of Employer in Hoopa
Among the 708 employed individuals in Hoopa, private company employees (229 | 32.3%), federal government employees (165 | 23.3%), and local government employees (158 | 22.3%) make up the most common classes of employment.
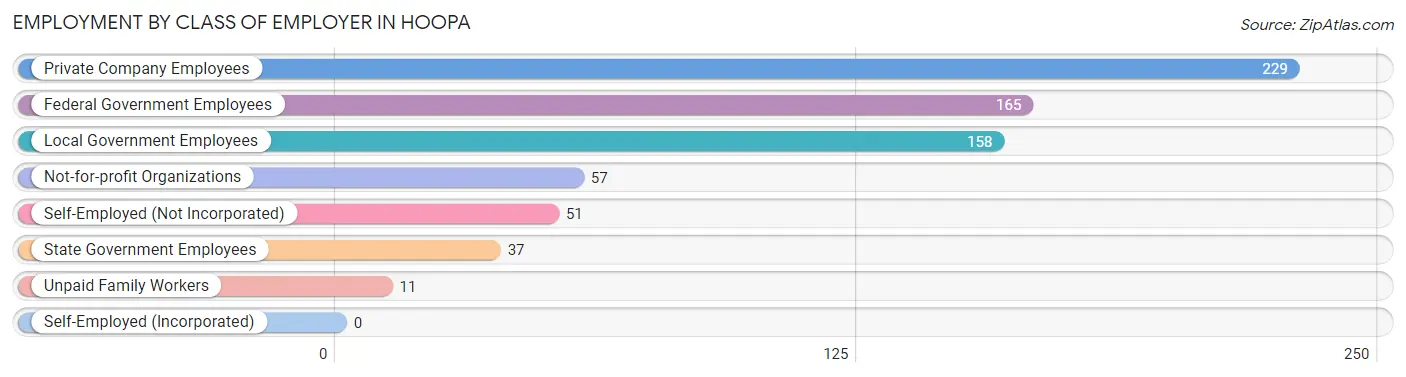
| Employer Class | # Employees | % Employees |
| Private Company Employees | 229 | 32.3% |
| Self-Employed (Incorporated) | 0 | 0.0% |
| Self-Employed (Not Incorporated) | 51 | 7.2% |
| Not-for-profit Organizations | 57 | 8.1% |
| Local Government Employees | 158 | 22.3% |
| State Government Employees | 37 | 5.2% |
| Federal Government Employees | 165 | 23.3% |
| Unpaid Family Workers | 11 | 1.5% |
| Total | 708 | 100.0% |
Employment Status by Age in Hoopa
According to the labor force statistics for Hoopa, out of the total population over 16 years of age (1,900), 46.5% or 884 individuals are in the labor force, with 17.9% or 158 of them unemployed. The age group with the highest labor force participation rate is 45 to 54 years, with 73.1% or 193 individuals in the labor force. Within the labor force, the 75 years and over age range has the highest percentage of unemployed individuals, with 66.7% or 6 of them being unemployed.
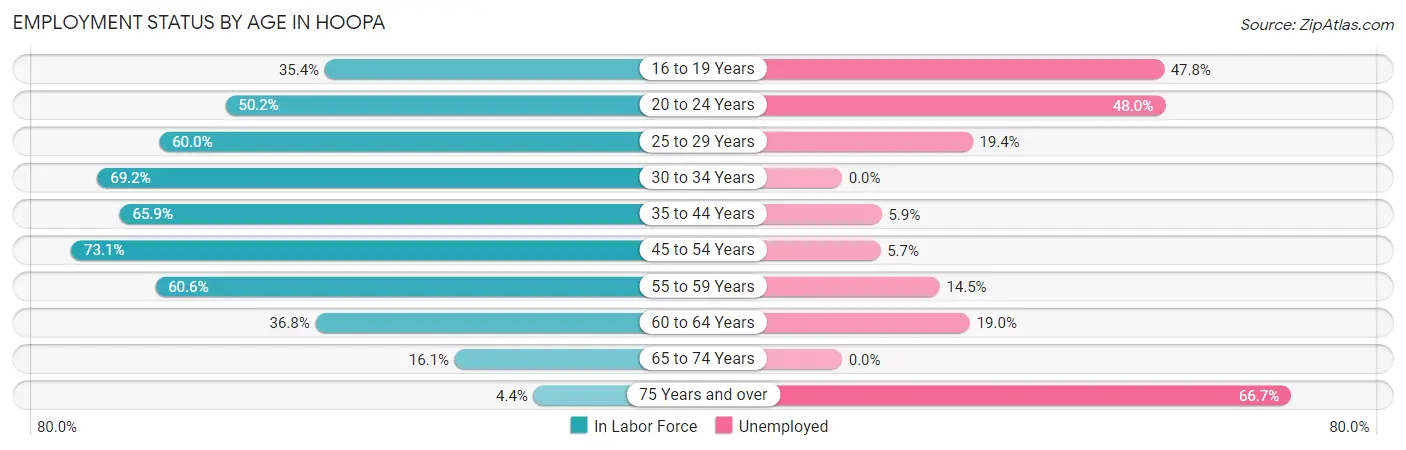
| Age Bracket | In Labor Force | Unemployed |
| 16 to 19 Years | 46 (35.4%) | 22 (47.8%) |
| 20 to 24 Years | 150 (50.2%) | 72 (48.0%) |
| 25 to 29 Years | 93 (60.0%) | 18 (19.4%) |
| 30 to 34 Years | 72 (69.2%) | 0 (0.0%) |
| 35 to 44 Years | 153 (65.9%) | 9 (5.9%) |
| 45 to 54 Years | 193 (73.1%) | 11 (5.7%) |
| 55 to 59 Years | 83 (60.6%) | 12 (14.5%) |
| 60 to 64 Years | 42 (36.8%) | 8 (19.0%) |
| 65 to 74 Years | 42 (16.1%) | 0 (0.0%) |
| 75 Years and over | 9 (4.4%) | 6 (66.7%) |
| Total | 884 (46.5%) | 158 (17.9%) |
Employment Status by Educational Attainment in Hoopa
According to labor force statistics for Hoopa, 63.2% of individuals (636) out of the total population between 25 and 64 years of age (1,006) are in the labor force, with 9.1% or 58 of them being unemployed. The group with the highest labor force participation rate are those with the educational attainment of college / associate degree, with 72.2% or 278 individuals in the labor force. Within the labor force, individuals with high school diploma education have the highest percentage of unemployment, with 20.7% or 40 of them being unemployed.
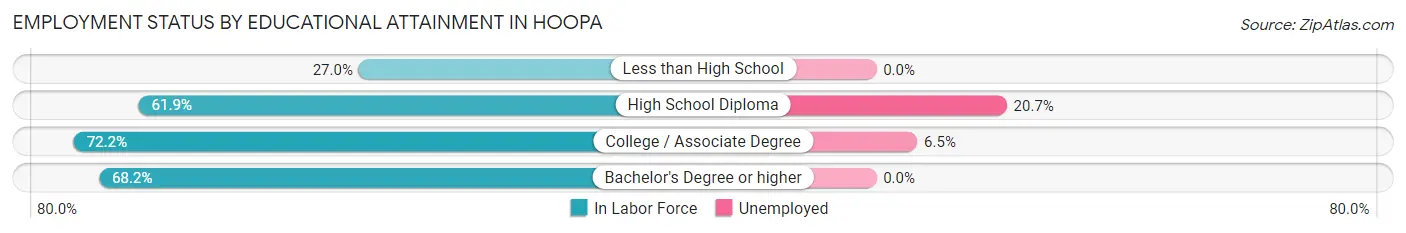
| Educational Attainment | In Labor Force | Unemployed |
| Less than High School | 30 (27.0%) | 0 (0.0%) |
| High School Diploma | 193 (61.9%) | 65 (20.7%) |
| College / Associate Degree | 278 (72.2%) | 25 (6.5%) |
| Bachelor's Degree or higher | 135 (68.2%) | 0 (0.0%) |
| Total | 636 (63.2%) | 92 (9.1%) |
Employment Occupations by Sex in Hoopa
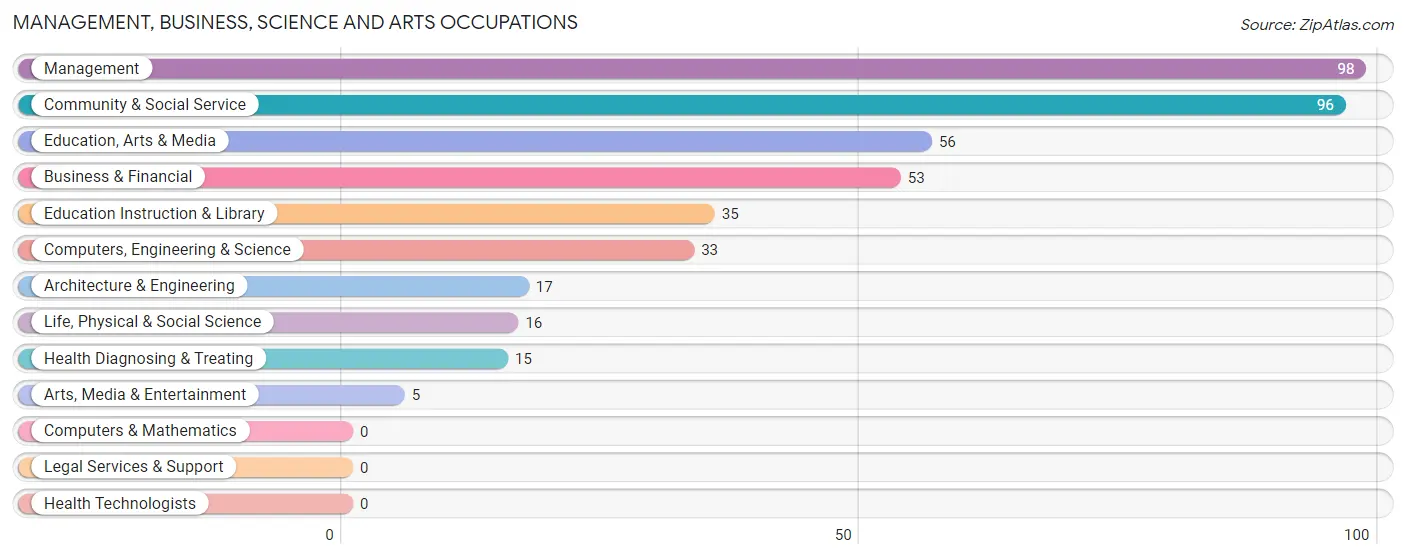
Management, Business, Science and Arts Occupations
The most common Management, Business, Science and Arts occupations in Hoopa are Management (98 | 13.5%), Community & Social Service (96 | 13.2%), Education, Arts & Media (56 | 7.7%), Business & Financial (53 | 7.3%), and Education Instruction & Library (35 | 4.8%).
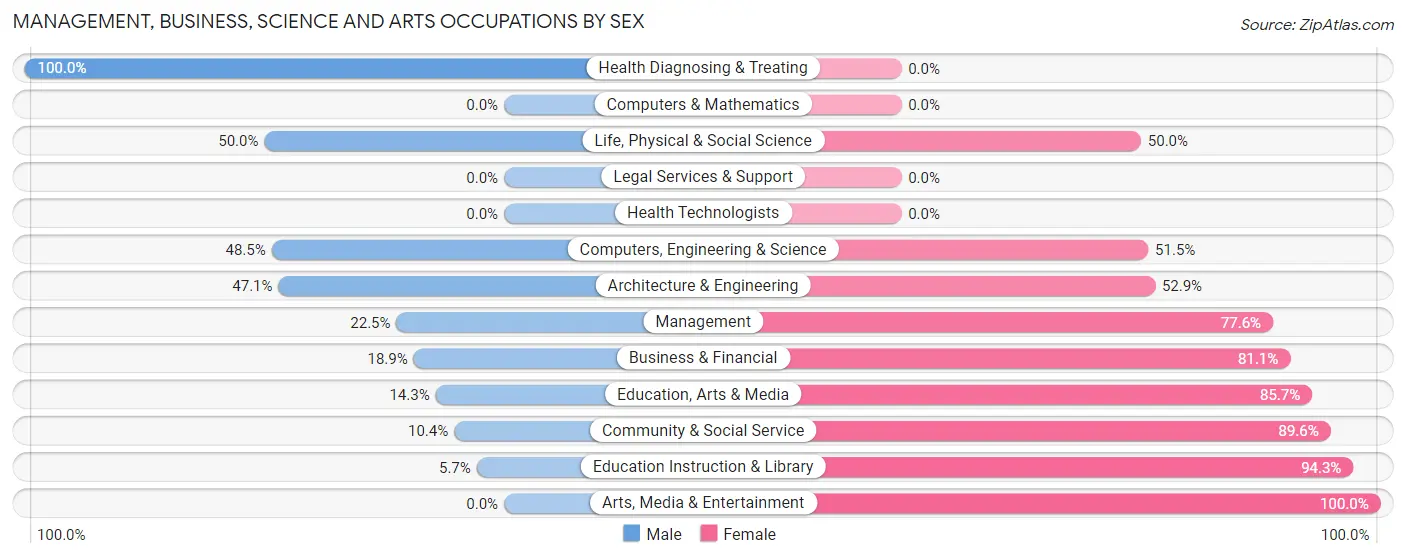
Management, Business, Science and Arts Occupations by Sex
Within the Management, Business, Science and Arts occupations in Hoopa, the most male-oriented occupations are Health Diagnosing & Treating (100.0%), Life, Physical & Social Science (50.0%), and Computers, Engineering & Science (48.5%), while the most female-oriented occupations are Arts, Media & Entertainment (100.0%), Education Instruction & Library (94.3%), and Community & Social Service (89.6%).
| Occupation | Male | Female |
| Management | 22 (22.5%) | 76 (77.5%) |
| Business & Financial | 10 (18.9%) | 43 (81.1%) |
| Computers, Engineering & Science | 16 (48.5%) | 17 (51.5%) |
| Computers & Mathematics | 0 (0.0%) | 0 (0.0%) |
| Architecture & Engineering | 8 (47.1%) | 9 (52.9%) |
| Life, Physical & Social Science | 8 (50.0%) | 8 (50.0%) |
| Community & Social Service | 10 (10.4%) | 86 (89.6%) |
| Education, Arts & Media | 8 (14.3%) | 48 (85.7%) |
| Legal Services & Support | 0 (0.0%) | 0 (0.0%) |
| Education Instruction & Library | 2 (5.7%) | 33 (94.3%) |
| Arts, Media & Entertainment | 0 (0.0%) | 5 (100.0%) |
| Health Diagnosing & Treating | 15 (100.0%) | 0 (0.0%) |
| Health Technologists | 0 (0.0%) | 0 (0.0%) |
| Total (Category) | 73 (24.7%) | 222 (75.2%) |
| Total (Overall) | 309 (42.6%) | 416 (57.4%) |
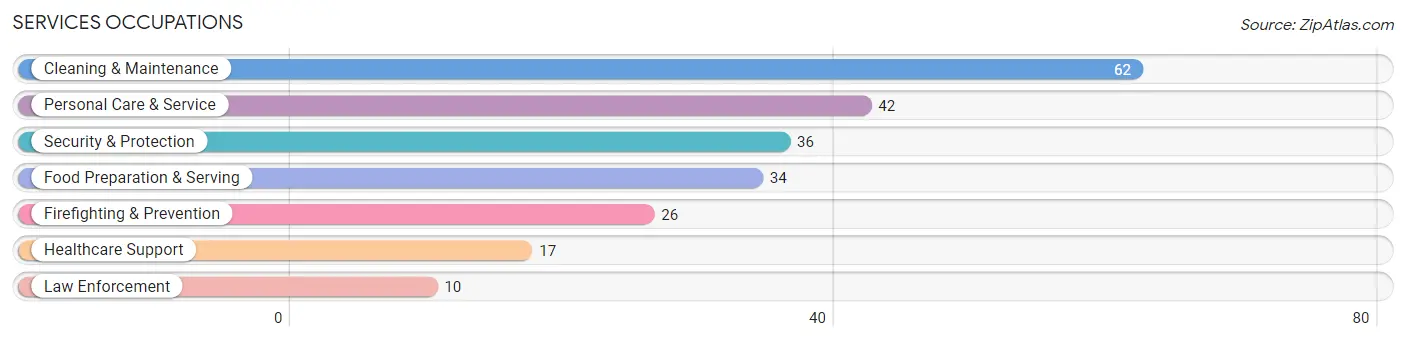
Services Occupations
The most common Services occupations in Hoopa are Cleaning & Maintenance (62 | 8.6%), Personal Care & Service (42 | 5.8%), Security & Protection (36 | 5.0%), Food Preparation & Serving (34 | 4.7%), and Firefighting & Prevention (26 | 3.6%).
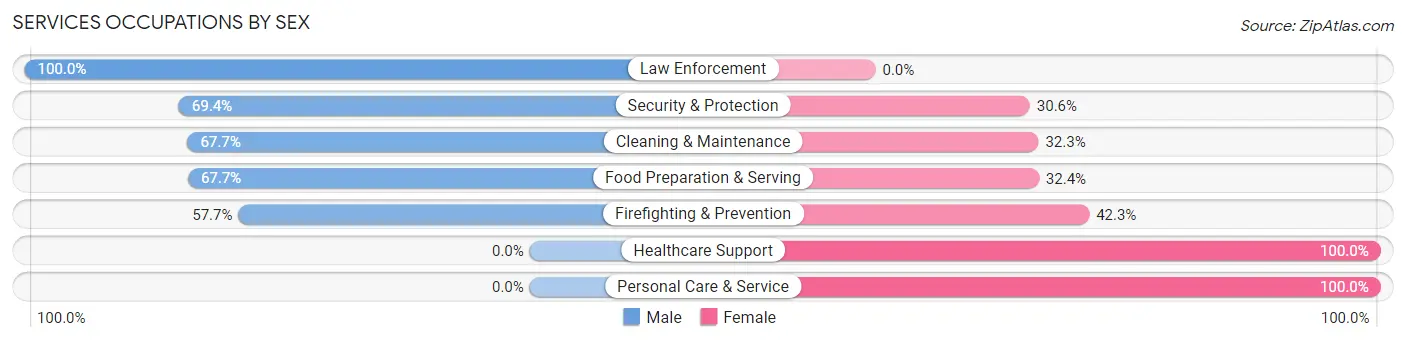
Services Occupations by Sex
Within the Services occupations in Hoopa, the most male-oriented occupations are Law Enforcement (100.0%), Security & Protection (69.4%), and Cleaning & Maintenance (67.7%), while the most female-oriented occupations are Healthcare Support (100.0%), Personal Care & Service (100.0%), and Firefighting & Prevention (42.3%).
| Occupation | Male | Female |
| Healthcare Support | 0 (0.0%) | 17 (100.0%) |
| Security & Protection | 25 (69.4%) | 11 (30.6%) |
| Firefighting & Prevention | 15 (57.7%) | 11 (42.3%) |
| Law Enforcement | 10 (100.0%) | 0 (0.0%) |
| Food Preparation & Serving | 23 (67.6%) | 11 (32.4%) |
| Cleaning & Maintenance | 42 (67.7%) | 20 (32.3%) |
| Personal Care & Service | 0 (0.0%) | 42 (100.0%) |
| Total (Category) | 90 (47.1%) | 101 (52.9%) |
| Total (Overall) | 309 (42.6%) | 416 (57.4%) |
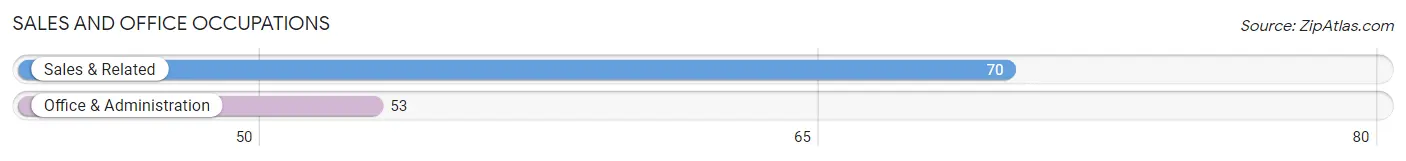
Sales and Office Occupations
The most common Sales and Office occupations in Hoopa are Sales & Related (70 | 9.7%), and Office & Administration (53 | 7.3%).
Sales and Office Occupations by Sex
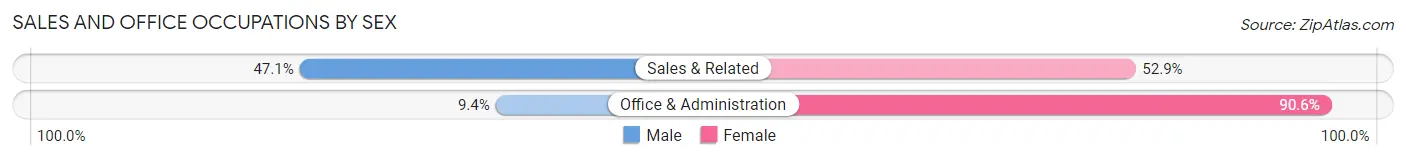
| Occupation | Male | Female |
| Sales & Related | 33 (47.1%) | 37 (52.9%) |
| Office & Administration | 5 (9.4%) | 48 (90.6%) |
| Total (Category) | 38 (30.9%) | 85 (69.1%) |
| Total (Overall) | 309 (42.6%) | 416 (57.4%) |
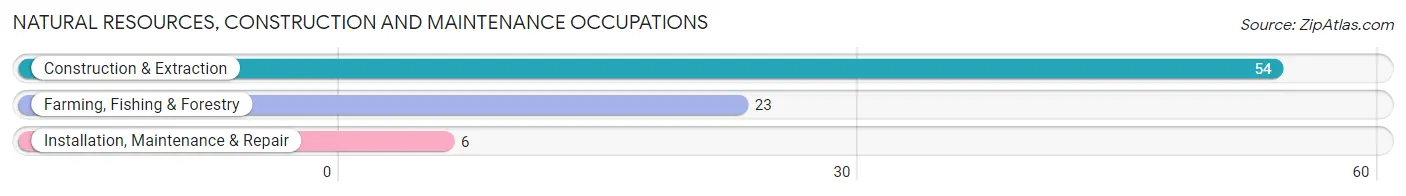
Natural Resources, Construction and Maintenance Occupations
The most common Natural Resources, Construction and Maintenance occupations in Hoopa are Construction & Extraction (54 | 7.4%), Farming, Fishing & Forestry (23 | 3.2%), and Installation, Maintenance & Repair (6 | 0.8%).
Natural Resources, Construction and Maintenance Occupations by Sex
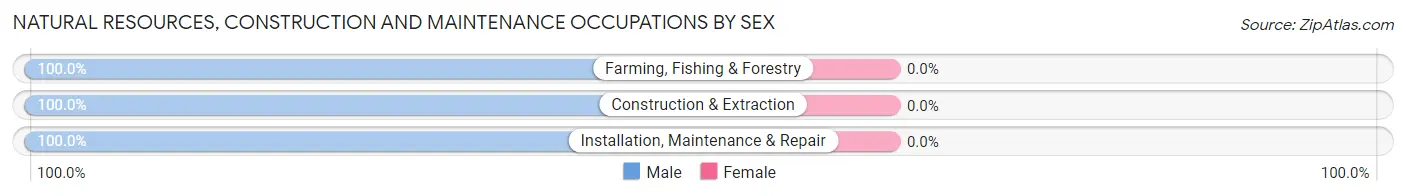
| Occupation | Male | Female |
| Farming, Fishing & Forestry | 23 (100.0%) | 0 (0.0%) |
| Construction & Extraction | 54 (100.0%) | 0 (0.0%) |
| Installation, Maintenance & Repair | 6 (100.0%) | 0 (0.0%) |
| Total (Category) | 83 (100.0%) | 0 (0.0%) |
| Total (Overall) | 309 (42.6%) | 416 (57.4%) |
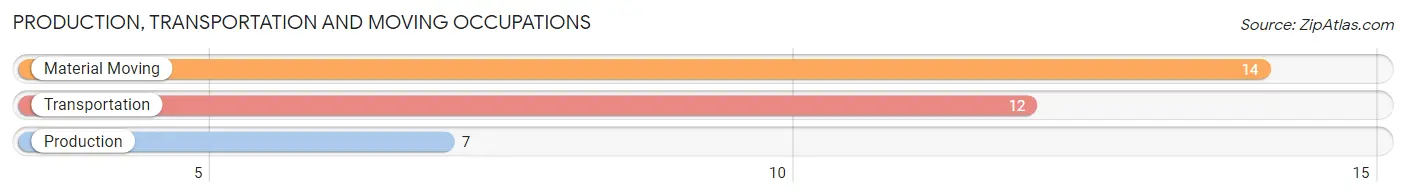
Production, Transportation and Moving Occupations
The most common Production, Transportation and Moving occupations in Hoopa are Material Moving (14 | 1.9%), Transportation (12 | 1.7%), and Production (7 | 1.0%).
Production, Transportation and Moving Occupations by Sex
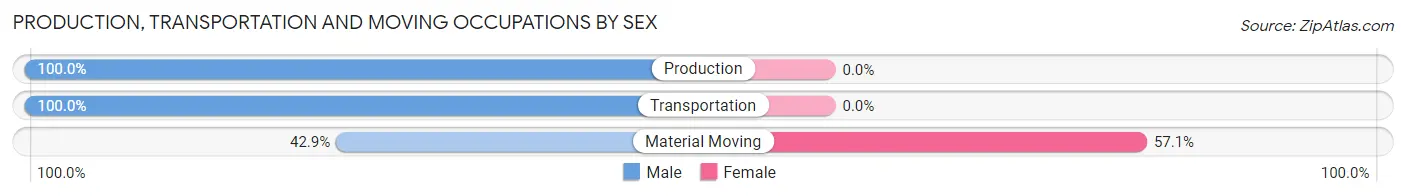
| Occupation | Male | Female |
| Production | 7 (100.0%) | 0 (0.0%) |
| Transportation | 12 (100.0%) | 0 (0.0%) |
| Material Moving | 6 (42.9%) | 8 (57.1%) |
| Total (Category) | 25 (75.8%) | 8 (24.2%) |
| Total (Overall) | 309 (42.6%) | 416 (57.4%) |
Employment Industries by Sex in Hoopa
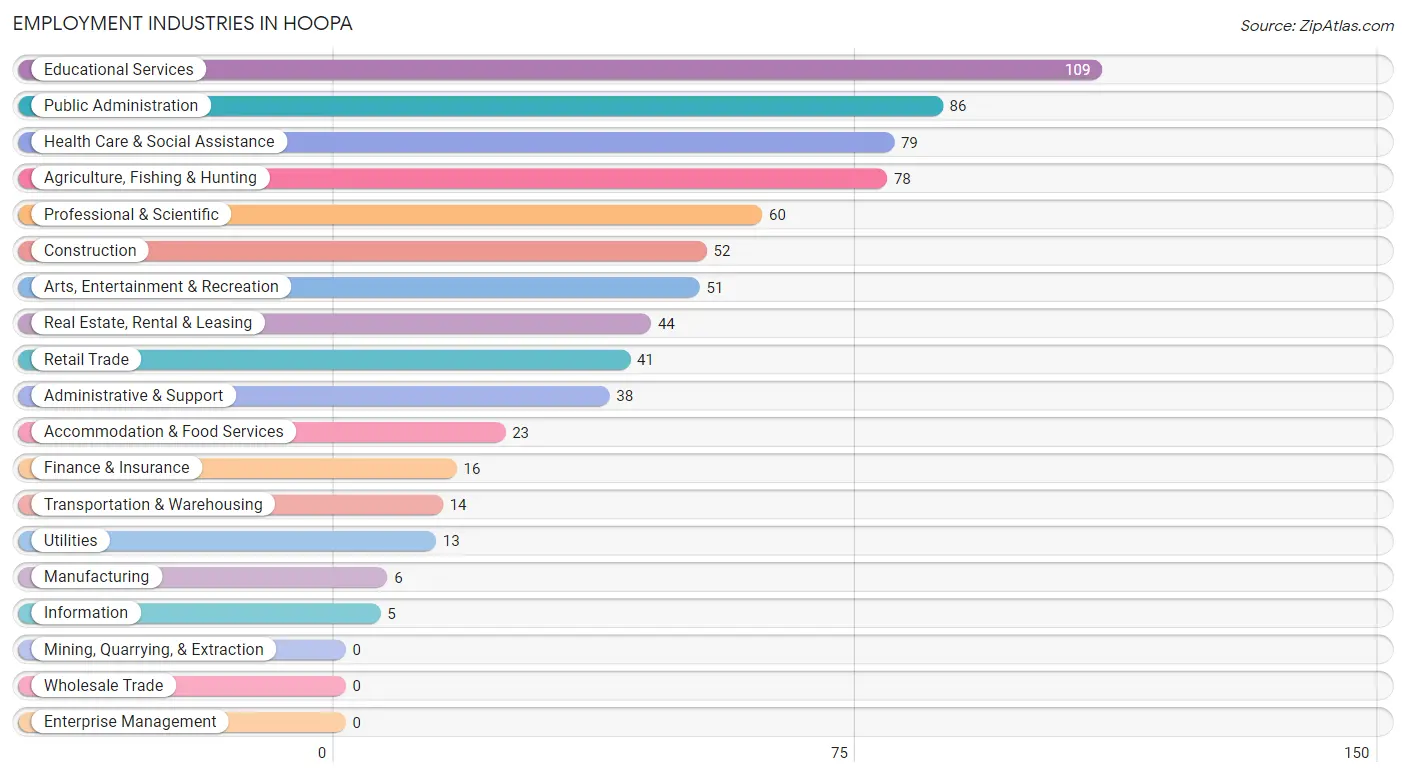
Employment Industries in Hoopa
The major employment industries in Hoopa include Educational Services (109 | 15.0%), Public Administration (86 | 11.9%), Health Care & Social Assistance (79 | 10.9%), Agriculture, Fishing & Hunting (78 | 10.8%), and Professional & Scientific (60 | 8.3%).
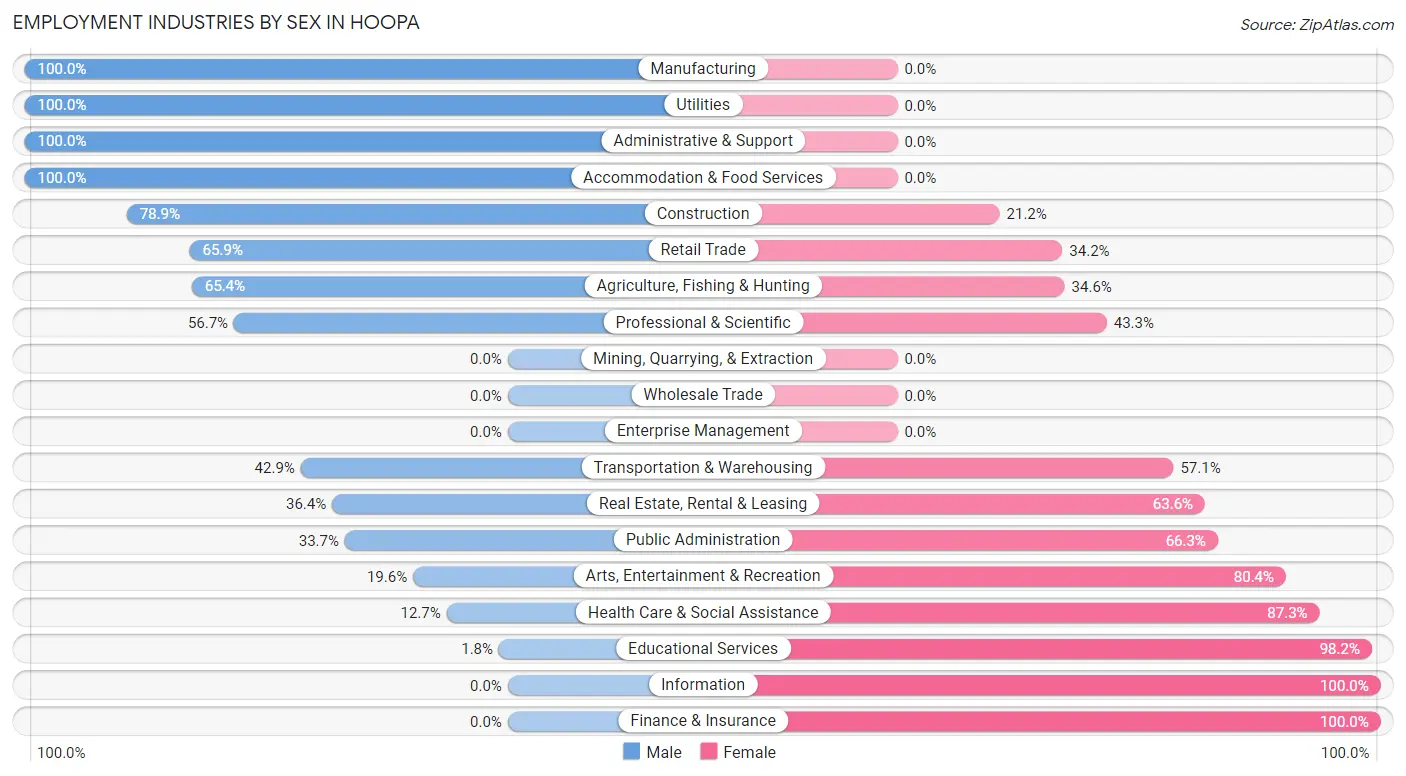
Employment Industries by Sex in Hoopa
The Hoopa industries that see more men than women are Manufacturing (100.0%), Utilities (100.0%), and Administrative & Support (100.0%), whereas the industries that tend to have a higher number of women are Information (100.0%), Finance & Insurance (100.0%), and Educational Services (98.2%).
| Industry | Male | Female |
| Agriculture, Fishing & Hunting | 51 (65.4%) | 27 (34.6%) |
| Mining, Quarrying, & Extraction | 0 (0.0%) | 0 (0.0%) |
| Construction | 41 (78.8%) | 11 (21.1%) |
| Manufacturing | 6 (100.0%) | 0 (0.0%) |
| Wholesale Trade | 0 (0.0%) | 0 (0.0%) |
| Retail Trade | 27 (65.8%) | 14 (34.2%) |
| Transportation & Warehousing | 6 (42.9%) | 8 (57.1%) |
| Utilities | 13 (100.0%) | 0 (0.0%) |
| Information | 0 (0.0%) | 5 (100.0%) |
| Finance & Insurance | 0 (0.0%) | 16 (100.0%) |
| Real Estate, Rental & Leasing | 16 (36.4%) | 28 (63.6%) |
| Professional & Scientific | 34 (56.7%) | 26 (43.3%) |
| Enterprise Management | 0 (0.0%) | 0 (0.0%) |
| Administrative & Support | 38 (100.0%) | 0 (0.0%) |
| Educational Services | 2 (1.8%) | 107 (98.2%) |
| Health Care & Social Assistance | 10 (12.7%) | 69 (87.3%) |
| Arts, Entertainment & Recreation | 10 (19.6%) | 41 (80.4%) |
| Accommodation & Food Services | 23 (100.0%) | 0 (0.0%) |
| Public Administration | 29 (33.7%) | 57 (66.3%) |
| Total | 309 (42.6%) | 416 (57.4%) |
Education in Hoopa
School Enrollment in Hoopa
The most common levels of schooling among the 654 students in Hoopa are elementary school (154 | 23.5%), middle school (139 | 21.2%), and high school (137 | 20.9%).
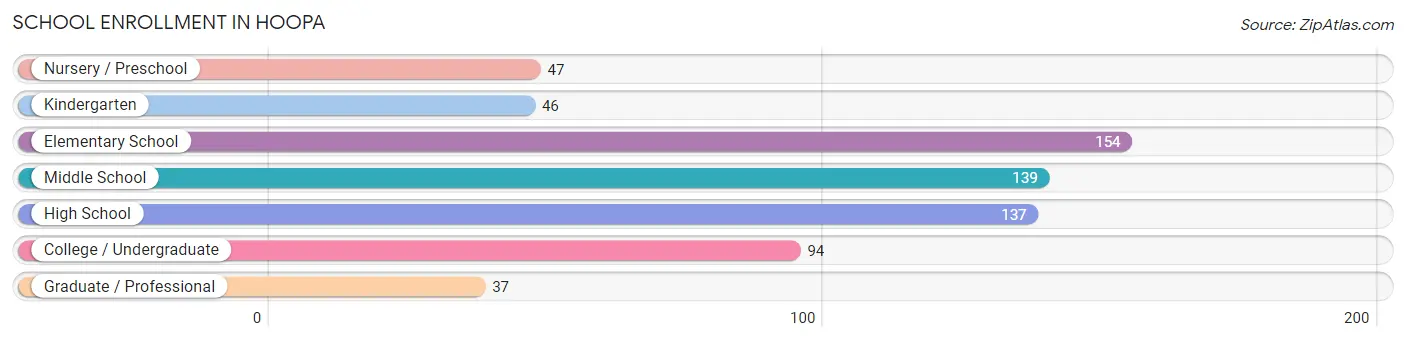
| School Level | # Students | % Students |
| Nursery / Preschool | 47 | 7.2% |
| Kindergarten | 46 | 7.0% |
| Elementary School | 154 | 23.5% |
| Middle School | 139 | 21.2% |
| High School | 137 | 20.9% |
| College / Undergraduate | 94 | 14.4% |
| Graduate / Professional | 37 | 5.7% |
| Total | 654 | 100.0% |
School Enrollment by Age by Funding Source in Hoopa
Out of a total of 654 students who are enrolled in schools in Hoopa, 69 (10.6%) attend a private institution, while the remaining 585 (89.4%) are enrolled in public schools. The age group of 20 to 24 year olds has the highest likelihood of being enrolled in private schools, with 25 (35.2% in the age bracket) enrolled. Conversely, the age group of 3 to 4 year olds has the lowest likelihood of being enrolled in a private school, with 34 (100.0% in the age bracket) attending a public institution.
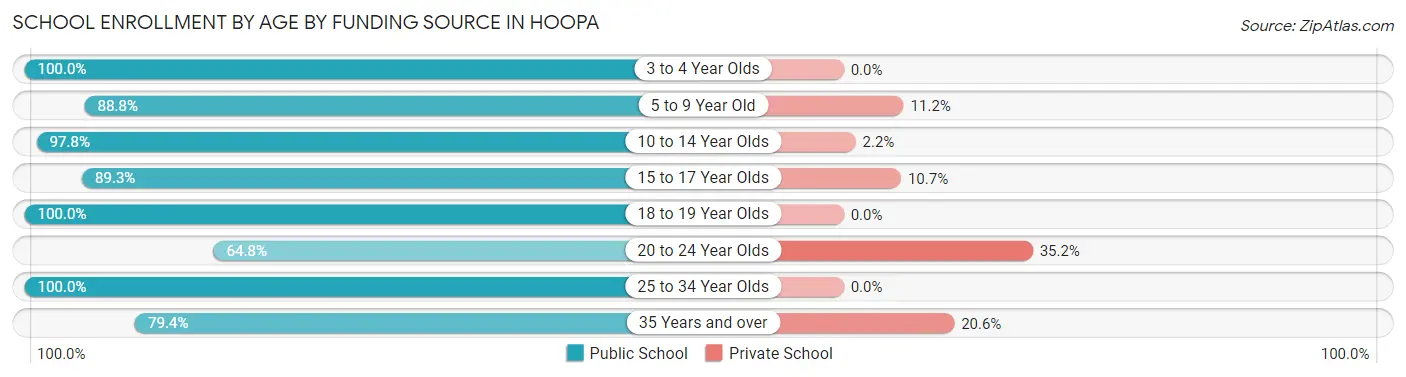
| Age Bracket | Public School | Private School |
| 3 to 4 Year Olds | 34 (100.0%) | 0 (0.0%) |
| 5 to 9 Year Old | 175 (88.8%) | 22 (11.2%) |
| 10 to 14 Year Olds | 175 (97.8%) | 4 (2.2%) |
| 15 to 17 Year Olds | 92 (89.3%) | 11 (10.7%) |
| 18 to 19 Year Olds | 28 (100.0%) | 0 (0.0%) |
| 20 to 24 Year Olds | 46 (64.8%) | 25 (35.2%) |
| 25 to 34 Year Olds | 8 (100.0%) | 0 (0.0%) |
| 35 Years and over | 27 (79.4%) | 7 (20.6%) |
| Total | 585 (89.4%) | 69 (10.6%) |
Educational Attainment by Field of Study in Hoopa
Science & technology (44 | 16.7%), business (40 | 15.1%), literature & languages (21 | 8.0%), education (20 | 7.6%), and social sciences (19 | 7.2%) are the most common fields of study among 264 individuals in Hoopa who have obtained a bachelor's degree or higher.
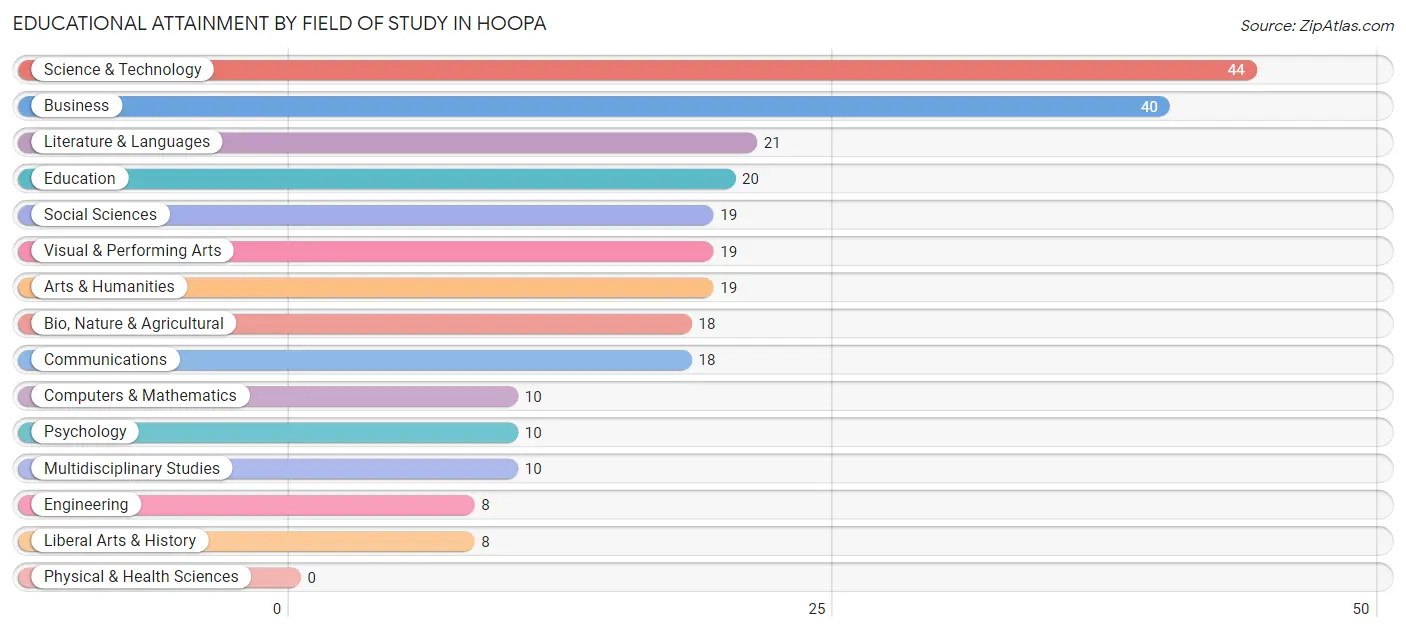
| Field of Study | # Graduates | % Graduates |
| Computers & Mathematics | 10 | 3.8% |
| Bio, Nature & Agricultural | 18 | 6.8% |
| Physical & Health Sciences | 0 | 0.0% |
| Psychology | 10 | 3.8% |
| Social Sciences | 19 | 7.2% |
| Engineering | 8 | 3.0% |
| Multidisciplinary Studies | 10 | 3.8% |
| Science & Technology | 44 | 16.7% |
| Business | 40 | 15.1% |
| Education | 20 | 7.6% |
| Literature & Languages | 21 | 8.0% |
| Liberal Arts & History | 8 | 3.0% |
| Visual & Performing Arts | 19 | 7.2% |
| Communications | 18 | 6.8% |
| Arts & Humanities | 19 | 7.2% |
| Total | 264 | 100.0% |
Transportation & Commute in Hoopa
Vehicle Availability by Sex in Hoopa
The most prevalent vehicle ownership categories in Hoopa are males with 2 vehicles (105, accounting for 36.6%) and females with 2 vehicles (94, making up 25.4%).
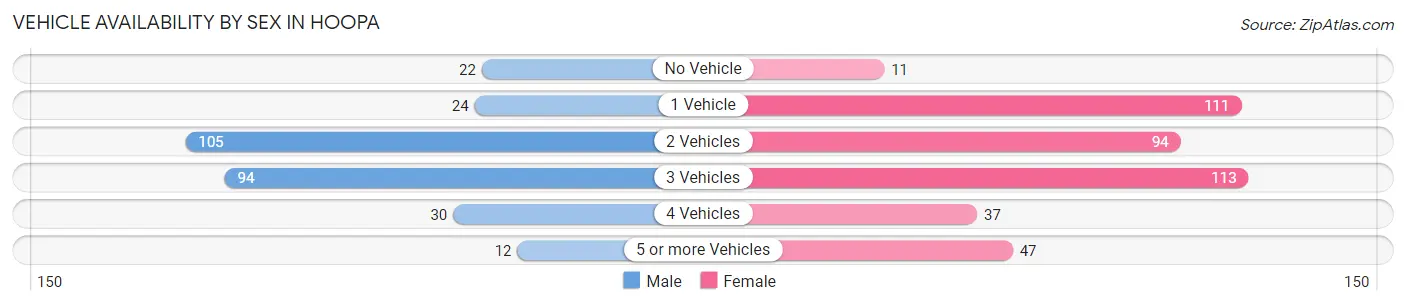
| Vehicles Available | Male | Female |
| No Vehicle | 22 (7.7%) | 11 (2.7%) |
| 1 Vehicle | 24 (8.4%) | 111 (26.9%) |
| 2 Vehicles | 105 (36.6%) | 94 (22.8%) |
| 3 Vehicles | 94 (32.8%) | 113 (27.4%) |
| 4 Vehicles | 30 (10.4%) | 37 (9.0%) |
| 5 or more Vehicles | 12 (4.2%) | 47 (11.4%) |
| Total | 287 (100.0%) | 413 (100.0%) |
Commute Time in Hoopa
The most frequently occuring commute durations in Hoopa are 5 to 9 minutes (264 commuters, 41.2%), 15 to 19 minutes (114 commuters, 17.8%), and less than 5 minutes (58 commuters, 9.0%).
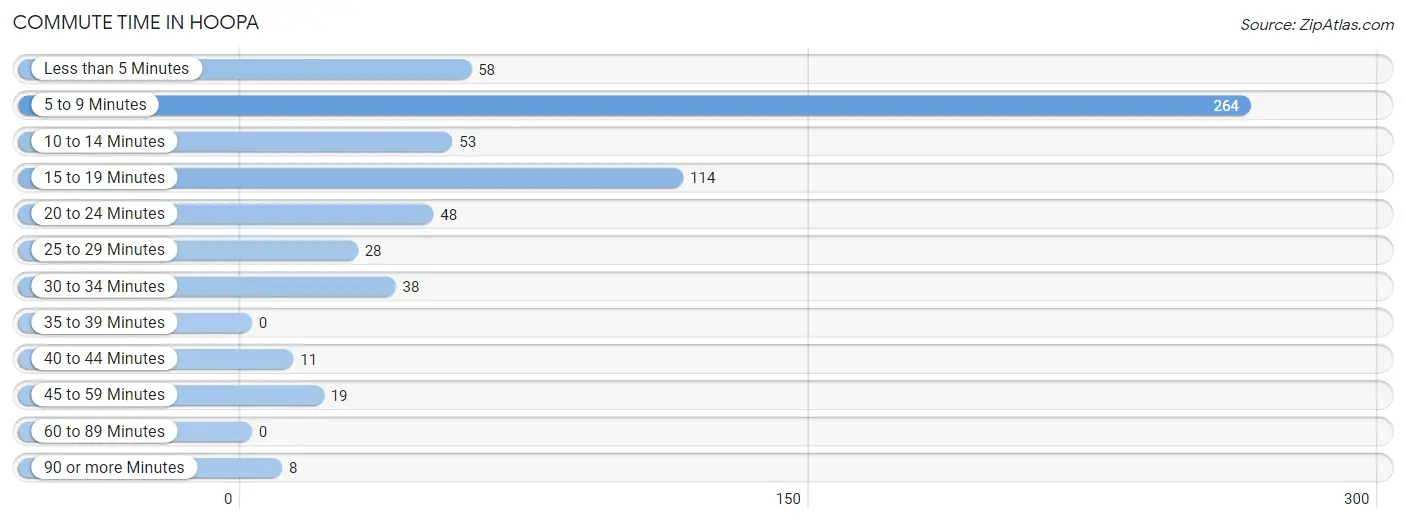
| Commute Time | # Commuters | % Commuters |
| Less than 5 Minutes | 58 | 9.0% |
| 5 to 9 Minutes | 264 | 41.2% |
| 10 to 14 Minutes | 53 | 8.3% |
| 15 to 19 Minutes | 114 | 17.8% |
| 20 to 24 Minutes | 48 | 7.5% |
| 25 to 29 Minutes | 28 | 4.4% |
| 30 to 34 Minutes | 38 | 5.9% |
| 35 to 39 Minutes | 0 | 0.0% |
| 40 to 44 Minutes | 11 | 1.7% |
| 45 to 59 Minutes | 19 | 3.0% |
| 60 to 89 Minutes | 0 | 0.0% |
| 90 or more Minutes | 8 | 1.3% |
Commute Time by Sex in Hoopa
The most common commute times in Hoopa are 5 to 9 minutes (100 commuters, 36.9%) for males and 5 to 9 minutes (164 commuters, 44.3%) for females.
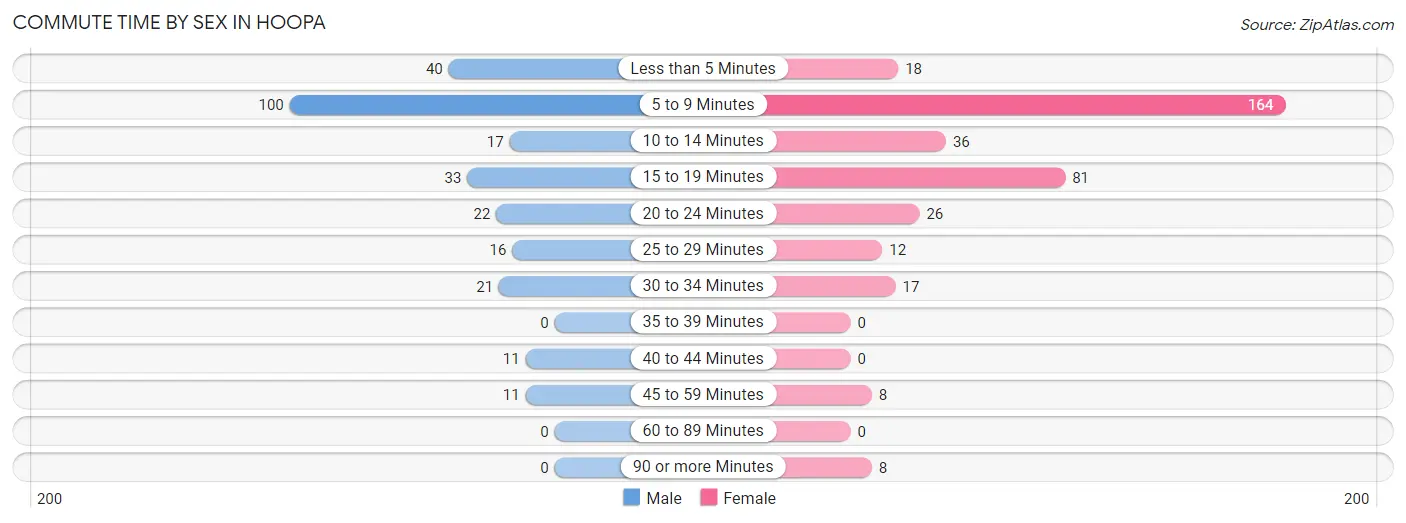
| Commute Time | Male | Female |
| Less than 5 Minutes | 40 (14.8%) | 18 (4.9%) |
| 5 to 9 Minutes | 100 (36.9%) | 164 (44.3%) |
| 10 to 14 Minutes | 17 (6.3%) | 36 (9.7%) |
| 15 to 19 Minutes | 33 (12.2%) | 81 (21.9%) |
| 20 to 24 Minutes | 22 (8.1%) | 26 (7.0%) |
| 25 to 29 Minutes | 16 (5.9%) | 12 (3.2%) |
| 30 to 34 Minutes | 21 (7.7%) | 17 (4.6%) |
| 35 to 39 Minutes | 0 (0.0%) | 0 (0.0%) |
| 40 to 44 Minutes | 11 (4.1%) | 0 (0.0%) |
| 45 to 59 Minutes | 11 (4.1%) | 8 (2.2%) |
| 60 to 89 Minutes | 0 (0.0%) | 0 (0.0%) |
| 90 or more Minutes | 0 (0.0%) | 8 (2.2%) |
Time of Departure to Work by Sex in Hoopa
The most frequent times of departure to work in Hoopa are 7:00 AM to 7:29 AM (64, 23.6%) for males and 7:30 AM to 7:59 AM (112, 30.3%) for females.
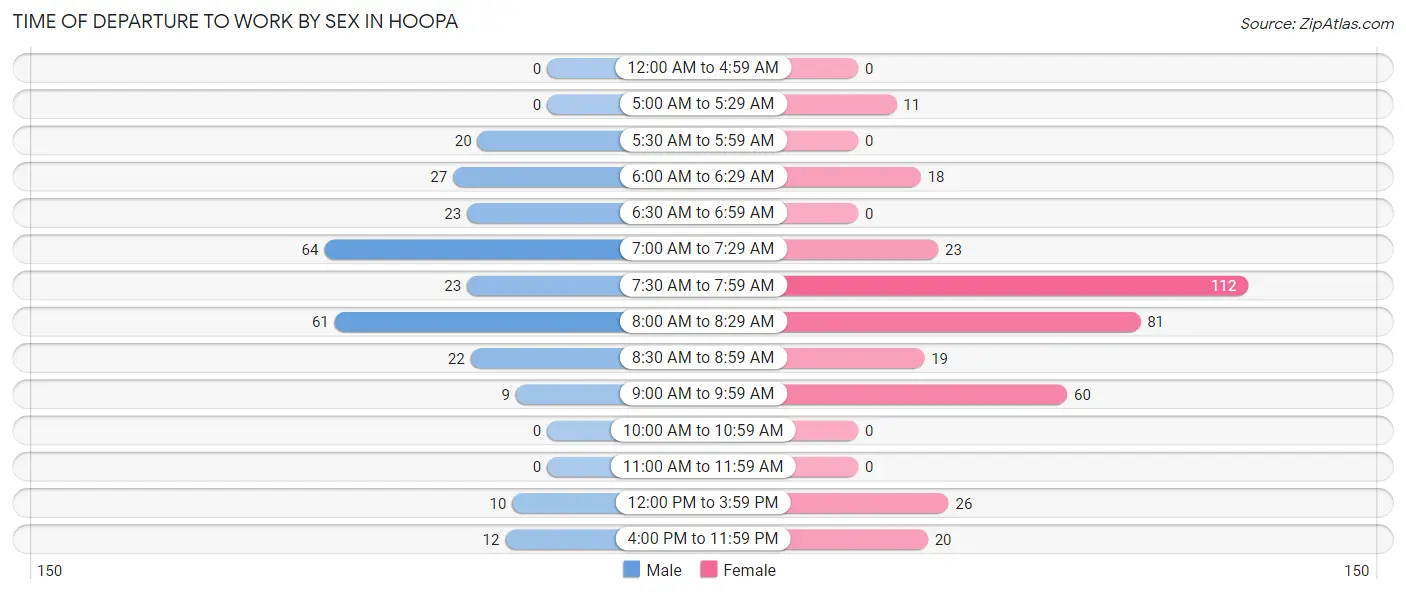
| Time of Departure | Male | Female |
| 12:00 AM to 4:59 AM | 0 (0.0%) | 0 (0.0%) |
| 5:00 AM to 5:29 AM | 0 (0.0%) | 11 (3.0%) |
| 5:30 AM to 5:59 AM | 20 (7.4%) | 0 (0.0%) |
| 6:00 AM to 6:29 AM | 27 (10.0%) | 18 (4.9%) |
| 6:30 AM to 6:59 AM | 23 (8.5%) | 0 (0.0%) |
| 7:00 AM to 7:29 AM | 64 (23.6%) | 23 (6.2%) |
| 7:30 AM to 7:59 AM | 23 (8.5%) | 112 (30.3%) |
| 8:00 AM to 8:29 AM | 61 (22.5%) | 81 (21.9%) |
| 8:30 AM to 8:59 AM | 22 (8.1%) | 19 (5.1%) |
| 9:00 AM to 9:59 AM | 9 (3.3%) | 60 (16.2%) |
| 10:00 AM to 10:59 AM | 0 (0.0%) | 0 (0.0%) |
| 11:00 AM to 11:59 AM | 0 (0.0%) | 0 (0.0%) |
| 12:00 PM to 3:59 PM | 10 (3.7%) | 26 (7.0%) |
| 4:00 PM to 11:59 PM | 12 (4.4%) | 20 (5.4%) |
| Total | 271 (100.0%) | 370 (100.0%) |
Housing Occupancy in Hoopa
Occupancy by Ownership in Hoopa
Of the total 730 dwellings in Hoopa, owner-occupied units account for 587 (80.4%), while renter-occupied units make up 143 (19.6%).
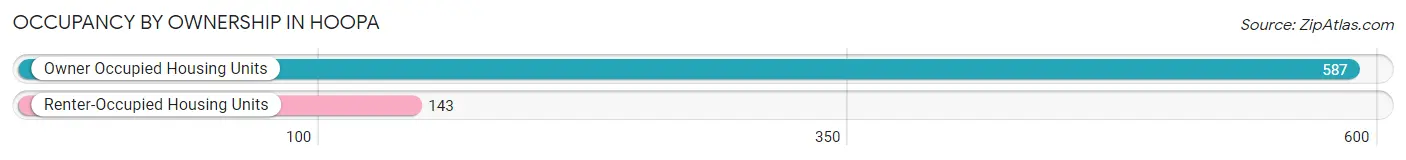
| Occupancy | # Housing Units | % Housing Units |
| Owner Occupied Housing Units | 587 | 80.4% |
| Renter-Occupied Housing Units | 143 | 19.6% |
| Total Occupied Housing Units | 730 | 100.0% |
Occupancy by Household Size in Hoopa
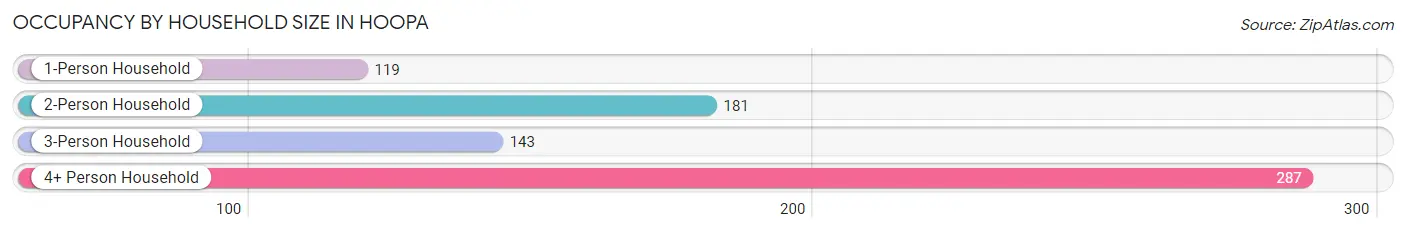
| Household Size | # Housing Units | % Housing Units |
| 1-Person Household | 119 | 16.3% |
| 2-Person Household | 181 | 24.8% |
| 3-Person Household | 143 | 19.6% |
| 4+ Person Household | 287 | 39.3% |
| Total Housing Units | 730 | 100.0% |
Occupancy by Ownership by Household Size in Hoopa
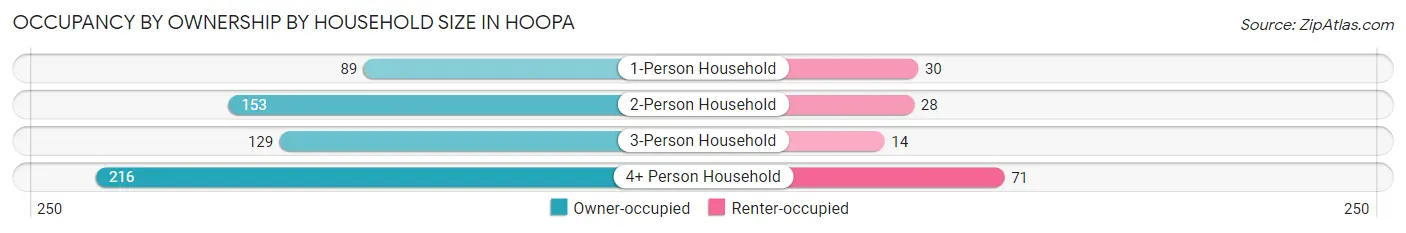
| Household Size | Owner-occupied | Renter-occupied |
| 1-Person Household | 89 (74.8%) | 30 (25.2%) |
| 2-Person Household | 153 (84.5%) | 28 (15.5%) |
| 3-Person Household | 129 (90.2%) | 14 (9.8%) |
| 4+ Person Household | 216 (75.3%) | 71 (24.7%) |
| Total Housing Units | 587 (80.4%) | 143 (19.6%) |
Occupancy by Educational Attainment in Hoopa
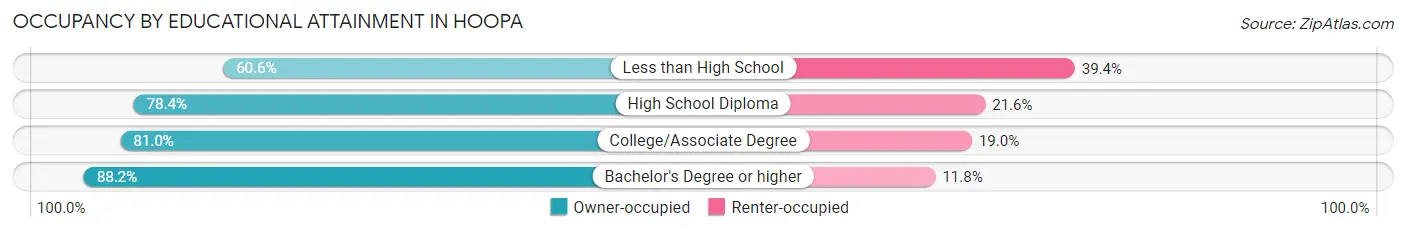
| Household Size | Owner-occupied | Renter-occupied |
| Less than High School | 20 (60.6%) | 13 (39.4%) |
| High School Diploma | 221 (78.4%) | 61 (21.6%) |
| College/Associate Degree | 226 (81.0%) | 53 (19.0%) |
| Bachelor's Degree or higher | 120 (88.2%) | 16 (11.8%) |
Occupancy by Age of Householder in Hoopa
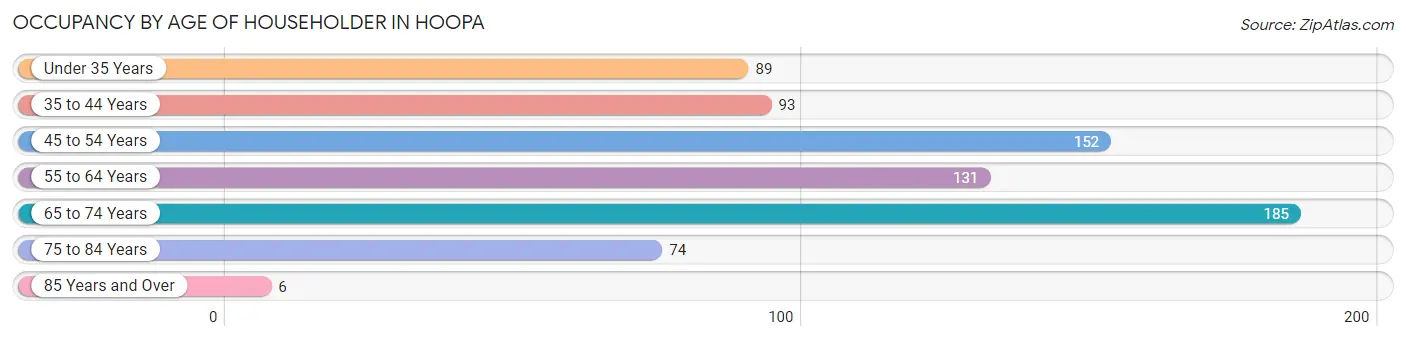
| Age Bracket | # Households | % Households |
| Under 35 Years | 89 | 12.2% |
| 35 to 44 Years | 93 | 12.7% |
| 45 to 54 Years | 152 | 20.8% |
| 55 to 64 Years | 131 | 17.9% |
| 65 to 74 Years | 185 | 25.3% |
| 75 to 84 Years | 74 | 10.1% |
| 85 Years and Over | 6 | 0.8% |
| Total | 730 | 100.0% |
Housing Finances in Hoopa
Median Income by Occupancy in Hoopa
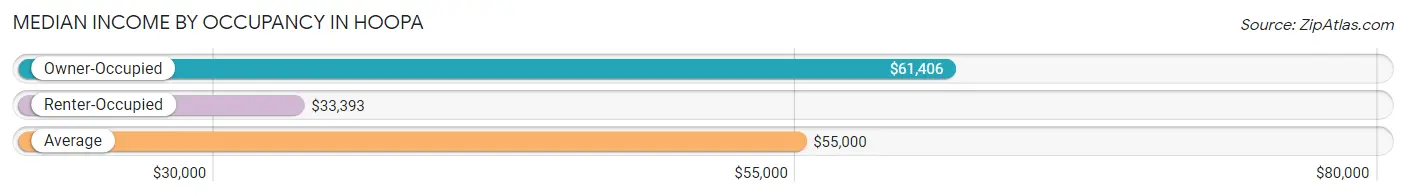
| Occupancy Type | # Households | Median Income |
| Owner-Occupied | 587 (80.4%) | $61,406 |
| Renter-Occupied | 143 (19.6%) | $33,393 |
| Average | 730 (100.0%) | $55,000 |
Occupancy by Householder Income Bracket in Hoopa
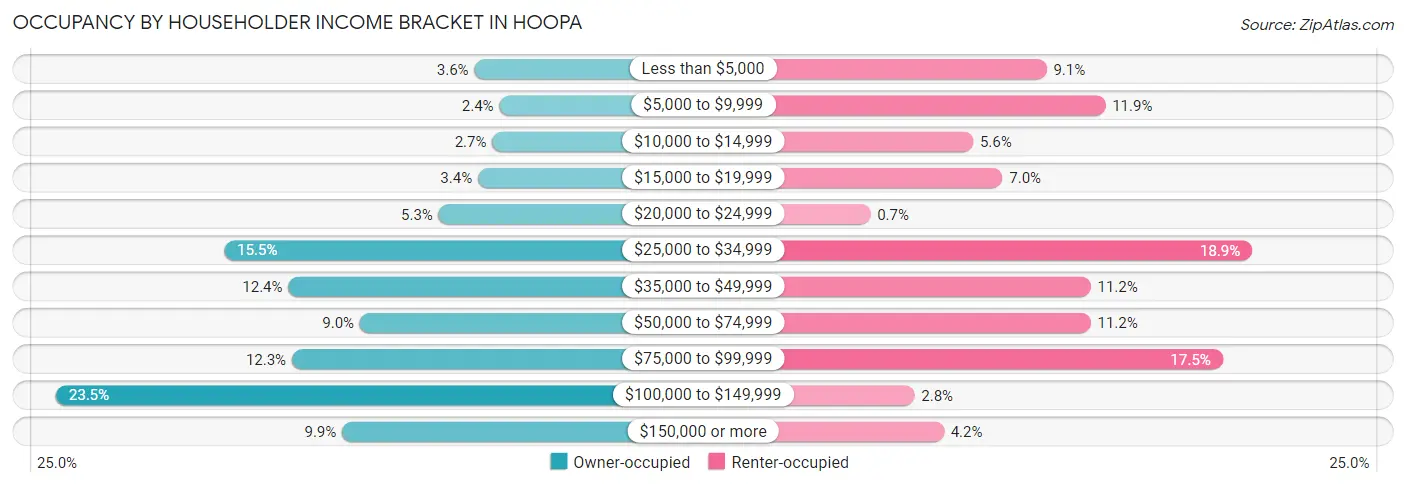
| Income Bracket | Owner-occupied | Renter-occupied |
| Less than $5,000 | 21 (3.6%) | 13 (9.1%) |
| $5,000 to $9,999 | 14 (2.4%) | 17 (11.9%) |
| $10,000 to $14,999 | 16 (2.7%) | 8 (5.6%) |
| $15,000 to $19,999 | 20 (3.4%) | 10 (7.0%) |
| $20,000 to $24,999 | 31 (5.3%) | 1 (0.7%) |
| $25,000 to $34,999 | 91 (15.5%) | 27 (18.9%) |
| $35,000 to $49,999 | 73 (12.4%) | 16 (11.2%) |
| $50,000 to $74,999 | 53 (9.0%) | 16 (11.2%) |
| $75,000 to $99,999 | 72 (12.3%) | 25 (17.5%) |
| $100,000 to $149,999 | 138 (23.5%) | 4 (2.8%) |
| $150,000 or more | 58 (9.9%) | 6 (4.2%) |
| Total | 587 (100.0%) | 143 (100.0%) |
Monthly Housing Cost Tiers in Hoopa
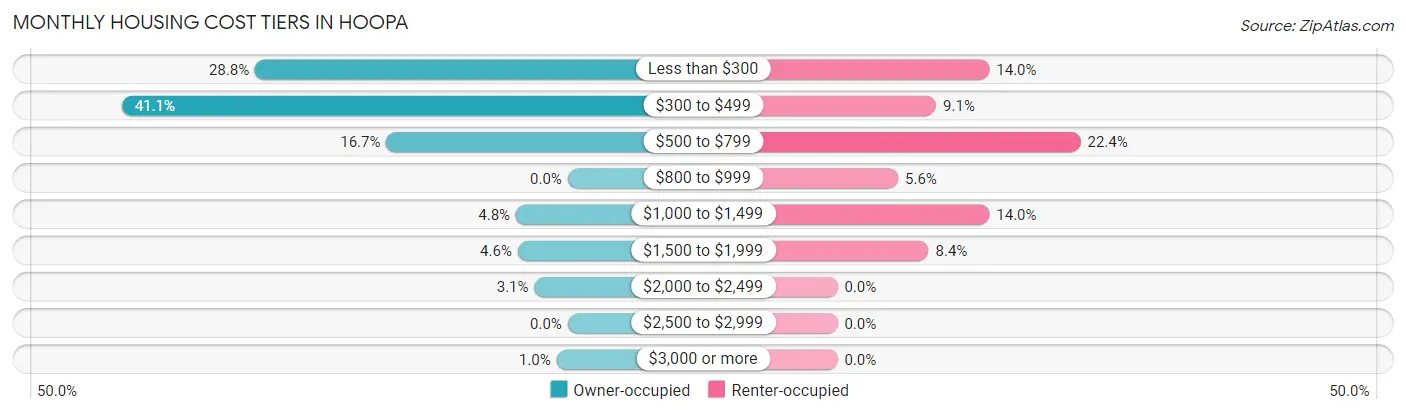
| Monthly Cost | Owner-occupied | Renter-occupied |
| Less than $300 | 169 (28.8%) | 20 (14.0%) |
| $300 to $499 | 241 (41.1%) | 13 (9.1%) |
| $500 to $799 | 98 (16.7%) | 32 (22.4%) |
| $800 to $999 | 0 (0.0%) | 8 (5.6%) |
| $1,000 to $1,499 | 28 (4.8%) | 20 (14.0%) |
| $1,500 to $1,999 | 27 (4.6%) | 12 (8.4%) |
| $2,000 to $2,499 | 18 (3.1%) | 0 (0.0%) |
| $2,500 to $2,999 | 0 (0.0%) | 0 (0.0%) |
| $3,000 or more | 6 (1.0%) | 0 (0.0%) |
| Total | 587 (100.0%) | 143 (100.0%) |
Physical Housing Characteristics in Hoopa
Housing Structures in Hoopa
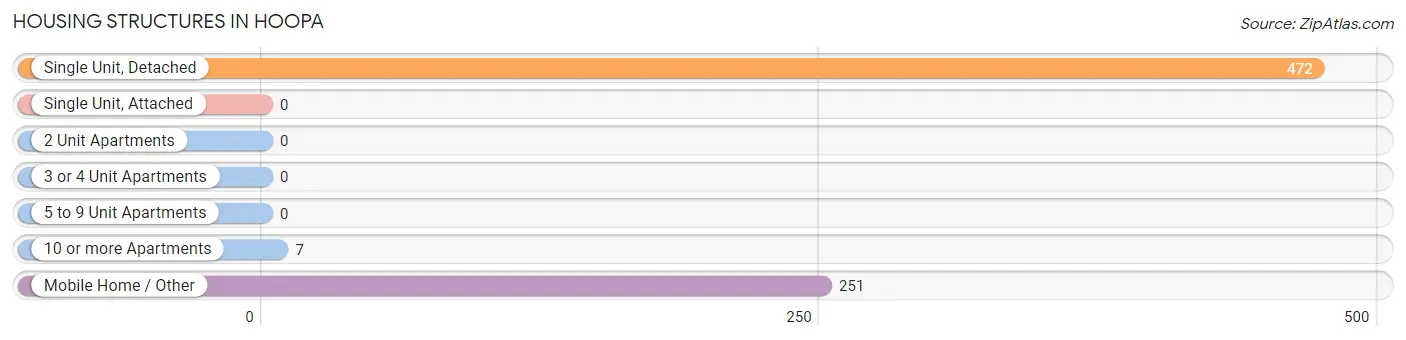
| Structure Type | # Housing Units | % Housing Units |
| Single Unit, Detached | 472 | 64.7% |
| Single Unit, Attached | 0 | 0.0% |
| 2 Unit Apartments | 0 | 0.0% |
| 3 or 4 Unit Apartments | 0 | 0.0% |
| 5 to 9 Unit Apartments | 0 | 0.0% |
| 10 or more Apartments | 7 | 1.0% |
| Mobile Home / Other | 251 | 34.4% |
| Total | 730 | 100.0% |
Housing Structures by Occupancy in Hoopa
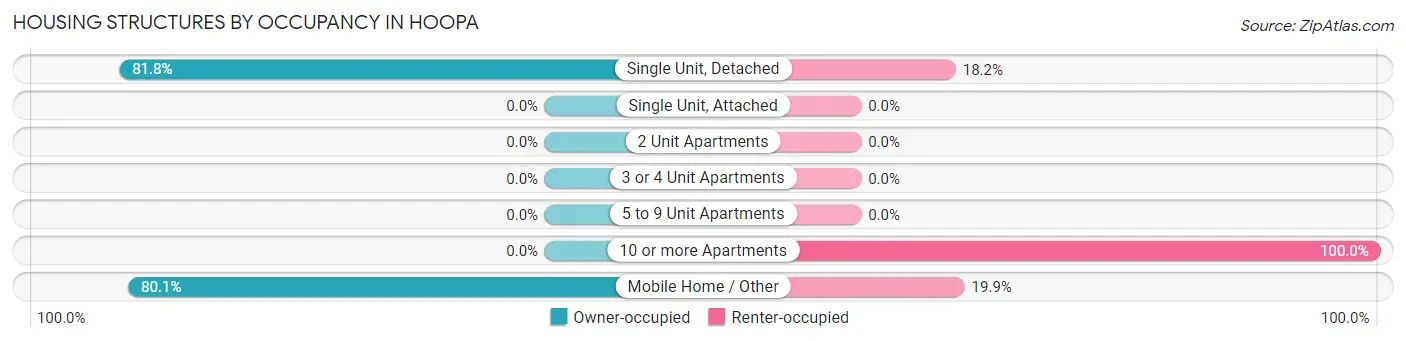
| Structure Type | Owner-occupied | Renter-occupied |
| Single Unit, Detached | 386 (81.8%) | 86 (18.2%) |
| Single Unit, Attached | 0 (0.0%) | 0 (0.0%) |
| 2 Unit Apartments | 0 (0.0%) | 0 (0.0%) |
| 3 or 4 Unit Apartments | 0 (0.0%) | 0 (0.0%) |
| 5 to 9 Unit Apartments | 0 (0.0%) | 0 (0.0%) |
| 10 or more Apartments | 0 (0.0%) | 7 (100.0%) |
| Mobile Home / Other | 201 (80.1%) | 50 (19.9%) |
| Total | 587 (80.4%) | 143 (19.6%) |
Housing Structures by Number of Rooms in Hoopa
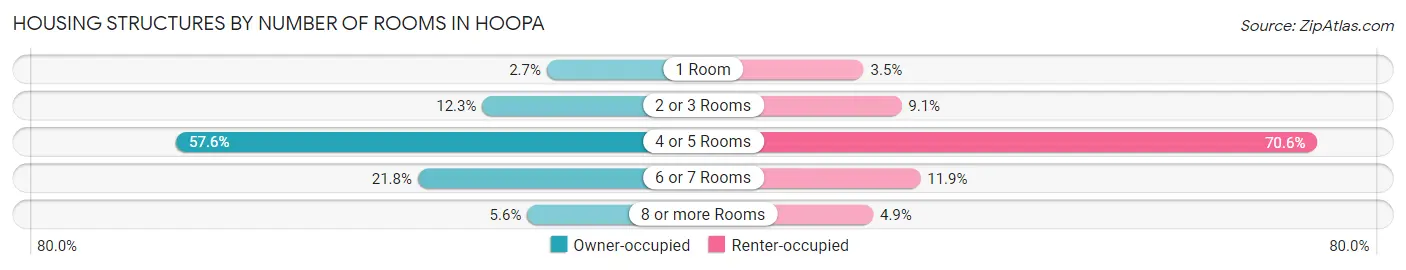
| Number of Rooms | Owner-occupied | Renter-occupied |
| 1 Room | 16 (2.7%) | 5 (3.5%) |
| 2 or 3 Rooms | 72 (12.3%) | 13 (9.1%) |
| 4 or 5 Rooms | 338 (57.6%) | 101 (70.6%) |
| 6 or 7 Rooms | 128 (21.8%) | 17 (11.9%) |
| 8 or more Rooms | 33 (5.6%) | 7 (4.9%) |
| Total | 587 (100.0%) | 143 (100.0%) |
Housing Structure by Heating Type in Hoopa
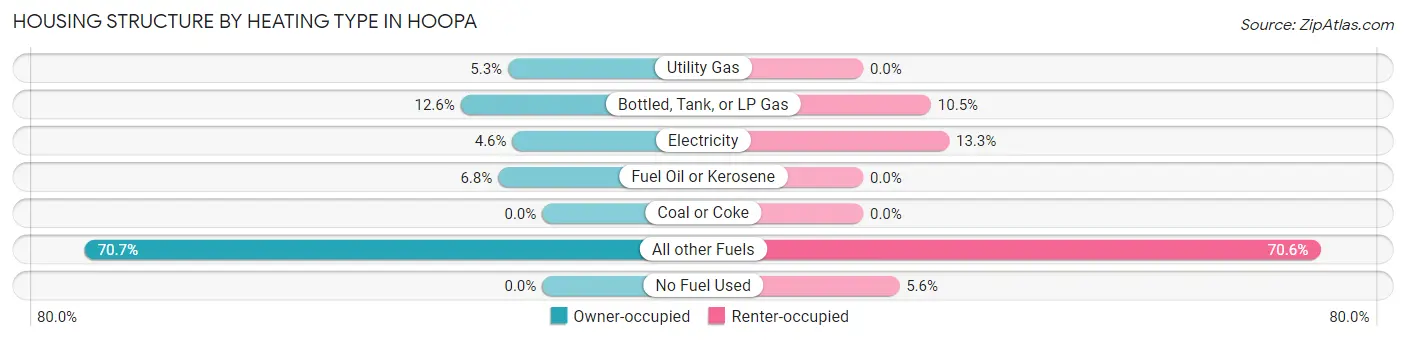
| Heating Type | Owner-occupied | Renter-occupied |
| Utility Gas | 31 (5.3%) | 0 (0.0%) |
| Bottled, Tank, or LP Gas | 74 (12.6%) | 15 (10.5%) |
| Electricity | 27 (4.6%) | 19 (13.3%) |
| Fuel Oil or Kerosene | 40 (6.8%) | 0 (0.0%) |
| Coal or Coke | 0 (0.0%) | 0 (0.0%) |
| All other Fuels | 415 (70.7%) | 101 (70.6%) |
| No Fuel Used | 0 (0.0%) | 8 (5.6%) |
| Total | 587 (100.0%) | 143 (100.0%) |
Household Vehicle Usage in Hoopa
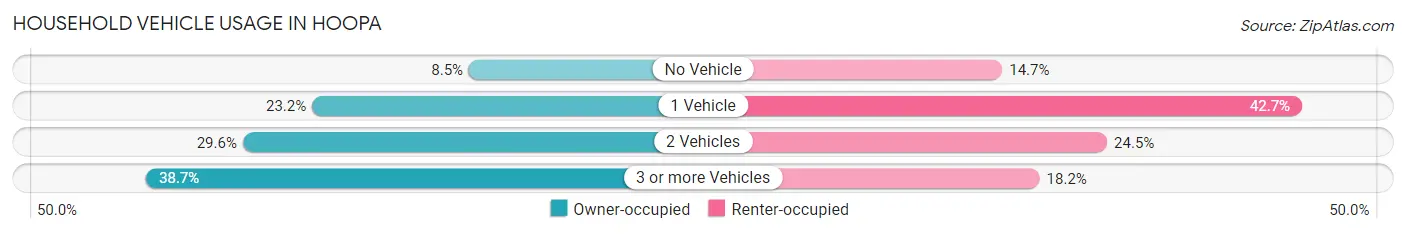
| Vehicles per Household | Owner-occupied | Renter-occupied |
| No Vehicle | 50 (8.5%) | 21 (14.7%) |
| 1 Vehicle | 136 (23.2%) | 61 (42.7%) |
| 2 Vehicles | 174 (29.6%) | 35 (24.5%) |
| 3 or more Vehicles | 227 (38.7%) | 26 (18.2%) |
| Total | 587 (100.0%) | 143 (100.0%) |
Real Estate & Mortgages in Hoopa
Real Estate and Mortgage Overview in Hoopa
| Characteristic | Without Mortgage | With Mortgage |
| Housing Units | 424 | 163 |
| Median Property Value | $236,400 | $275,000 |
| Median Household Income | $61,563 | $23 |
| Monthly Housing Costs | $400 | $6 |
| Real Estate Taxes | $605 | $102 |
Property Value by Mortgage Status in Hoopa
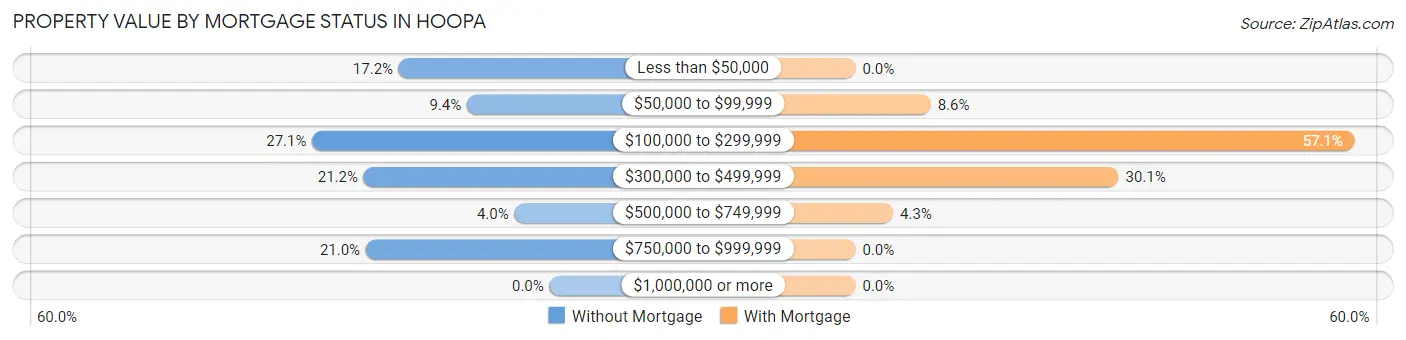
| Property Value | Without Mortgage | With Mortgage |
| Less than $50,000 | 73 (17.2%) | 0 (0.0%) |
| $50,000 to $99,999 | 40 (9.4%) | 14 (8.6%) |
| $100,000 to $299,999 | 115 (27.1%) | 93 (57.1%) |
| $300,000 to $499,999 | 90 (21.2%) | 49 (30.1%) |
| $500,000 to $749,999 | 17 (4.0%) | 7 (4.3%) |
| $750,000 to $999,999 | 89 (21.0%) | 0 (0.0%) |
| $1,000,000 or more | 0 (0.0%) | 0 (0.0%) |
| Total | 424 (100.0%) | 163 (100.0%) |
Household Income by Mortgage Status in Hoopa
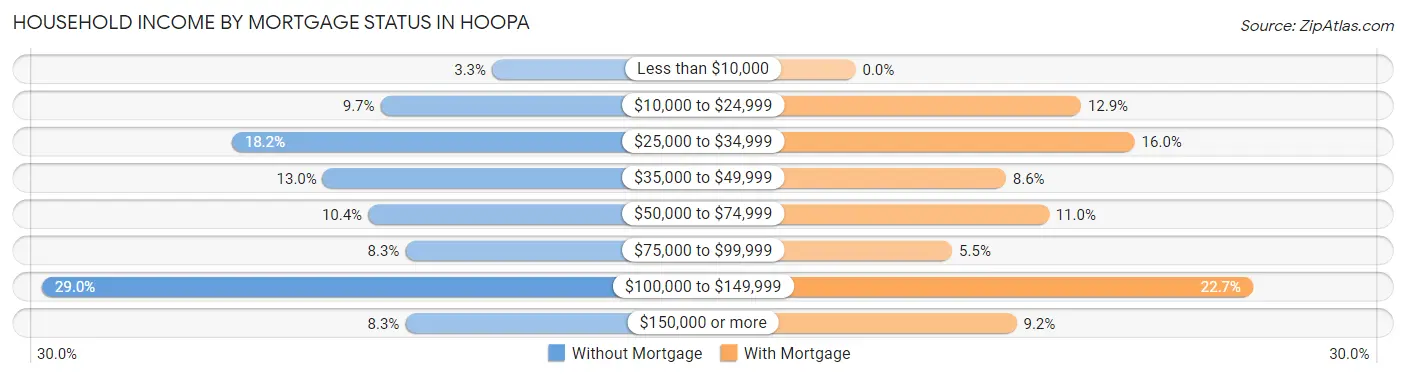
| Household Income | Without Mortgage | With Mortgage |
| Less than $10,000 | 14 (3.3%) | 0 (0.0%) |
| $10,000 to $24,999 | 41 (9.7%) | 21 (12.9%) |
| $25,000 to $34,999 | 77 (18.2%) | 26 (16.0%) |
| $35,000 to $49,999 | 55 (13.0%) | 14 (8.6%) |
| $50,000 to $74,999 | 44 (10.4%) | 18 (11.0%) |
| $75,000 to $99,999 | 35 (8.3%) | 9 (5.5%) |
| $100,000 to $149,999 | 123 (29.0%) | 37 (22.7%) |
| $150,000 or more | 35 (8.3%) | 15 (9.2%) |
| Total | 424 (100.0%) | 163 (100.0%) |
Property Value to Household Income Ratio in Hoopa
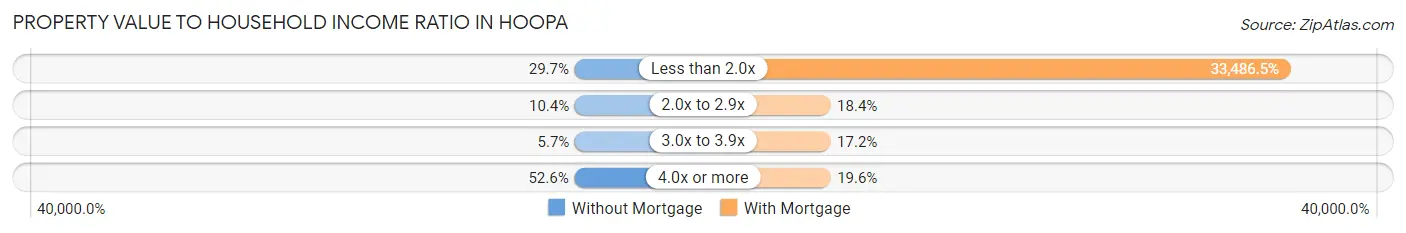
| Value-to-Income Ratio | Without Mortgage | With Mortgage |
| Less than 2.0x | 126 (29.7%) | 54,583 (33,486.5%) |
| 2.0x to 2.9x | 44 (10.4%) | 30 (18.4%) |
| 3.0x to 3.9x | 24 (5.7%) | 28 (17.2%) |
| 4.0x or more | 223 (52.6%) | 32 (19.6%) |
| Total | 424 (100.0%) | 163 (100.0%) |
Real Estate Taxes by Mortgage Status in Hoopa
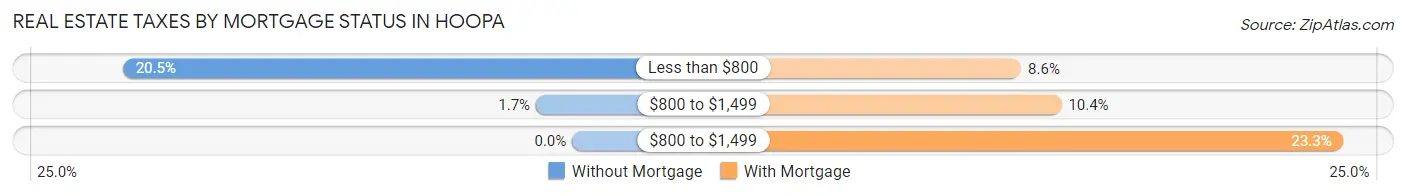
| Property Taxes | Without Mortgage | With Mortgage |
| Less than $800 | 87 (20.5%) | 14 (8.6%) |
| $800 to $1,499 | 7 (1.7%) | 17 (10.4%) |
| $800 to $1,499 | 0 (0.0%) | 38 (23.3%) |
| Total | 424 (100.0%) | 163 (100.0%) |
Health & Disability in Hoopa
Health Insurance Coverage by Age in Hoopa
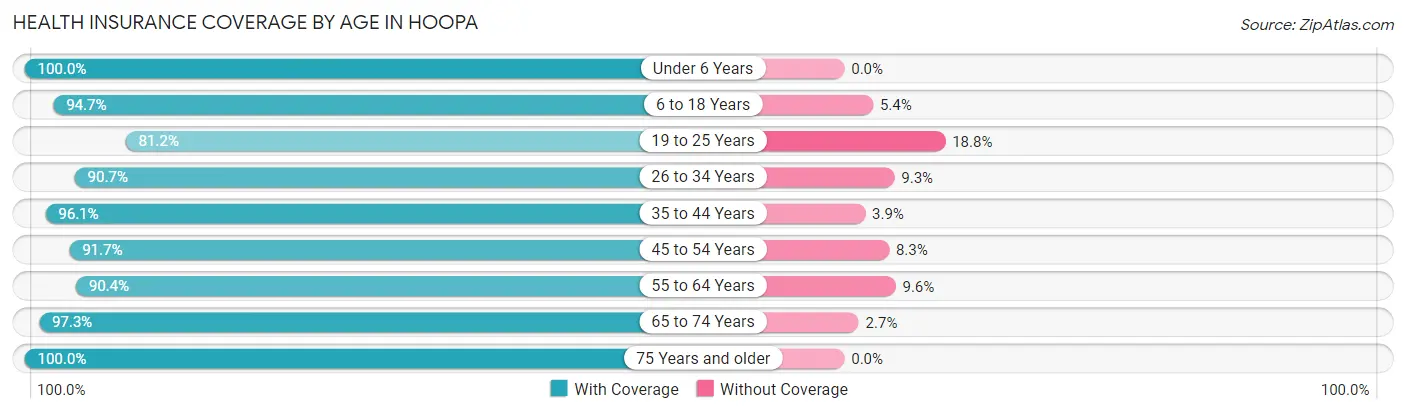
| Age Bracket | With Coverage | Without Coverage |
| Under 6 Years | 229 (100.0%) | 0 (0.0%) |
| 6 to 18 Years | 425 (94.7%) | 24 (5.3%) |
| 19 to 25 Years | 302 (81.2%) | 70 (18.8%) |
| 26 to 34 Years | 204 (90.7%) | 21 (9.3%) |
| 35 to 44 Years | 223 (96.1%) | 9 (3.9%) |
| 45 to 54 Years | 242 (91.7%) | 22 (8.3%) |
| 55 to 64 Years | 227 (90.4%) | 24 (9.6%) |
| 65 to 74 Years | 254 (97.3%) | 7 (2.7%) |
| 75 Years and older | 204 (100.0%) | 0 (0.0%) |
| Total | 2,310 (92.9%) | 177 (7.1%) |
Health Insurance Coverage by Citizenship Status in Hoopa
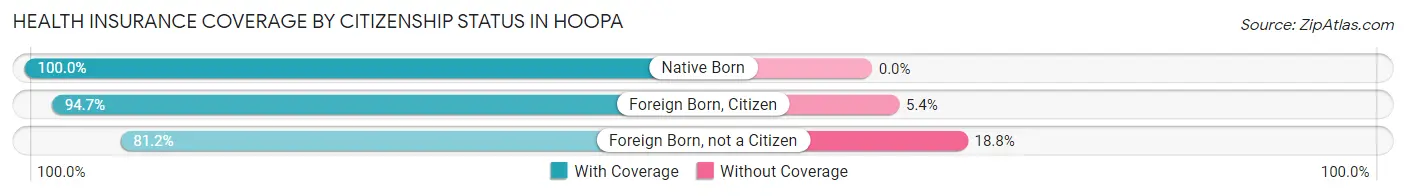
| Citizenship Status | With Coverage | Without Coverage |
| Native Born | 229 (100.0%) | 0 (0.0%) |
| Foreign Born, Citizen | 425 (94.7%) | 24 (5.3%) |
| Foreign Born, not a Citizen | 302 (81.2%) | 70 (18.8%) |
Health Insurance Coverage by Household Income in Hoopa
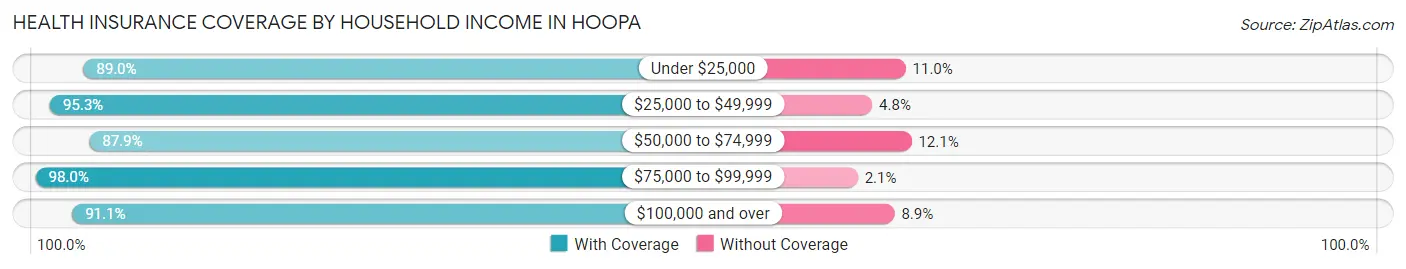
| Household Income | With Coverage | Without Coverage |
| Under $25,000 | 323 (89.0%) | 40 (11.0%) |
| $25,000 to $49,999 | 722 (95.3%) | 36 (4.8%) |
| $50,000 to $74,999 | 174 (87.9%) | 24 (12.1%) |
| $75,000 to $99,999 | 382 (98.0%) | 8 (2.1%) |
| $100,000 and over | 683 (91.1%) | 67 (8.9%) |
Public vs Private Health Insurance Coverage by Age in Hoopa
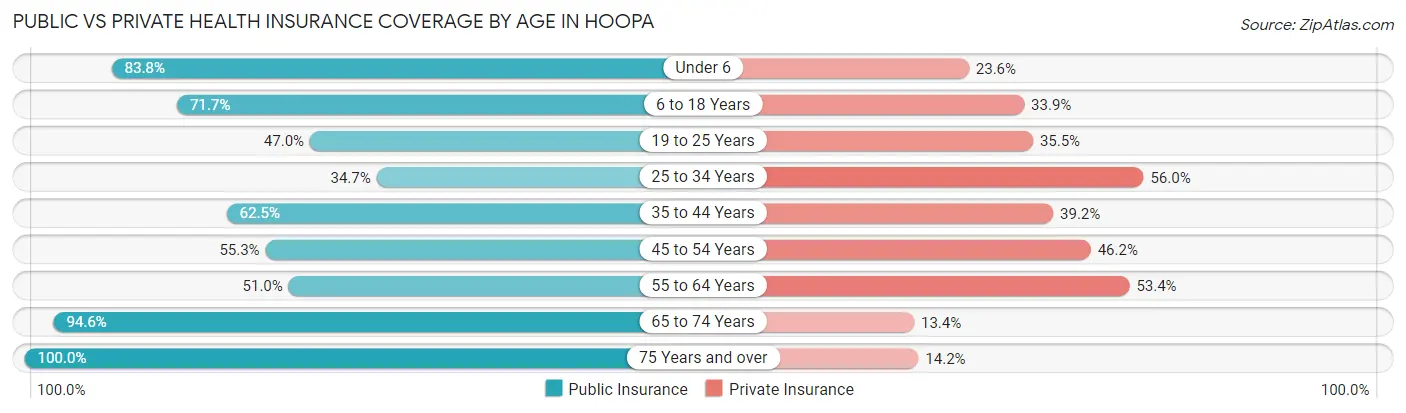
| Age Bracket | Public Insurance | Private Insurance |
| Under 6 | 192 (83.8%) | 54 (23.6%) |
| 6 to 18 Years | 322 (71.7%) | 152 (33.9%) |
| 19 to 25 Years | 175 (47.0%) | 132 (35.5%) |
| 25 to 34 Years | 78 (34.7%) | 126 (56.0%) |
| 35 to 44 Years | 145 (62.5%) | 91 (39.2%) |
| 45 to 54 Years | 146 (55.3%) | 122 (46.2%) |
| 55 to 64 Years | 128 (51.0%) | 134 (53.4%) |
| 65 to 74 Years | 247 (94.6%) | 35 (13.4%) |
| 75 Years and over | 204 (100.0%) | 29 (14.2%) |
| Total | 1,637 (65.8%) | 875 (35.2%) |
Disability Status by Sex by Age in Hoopa
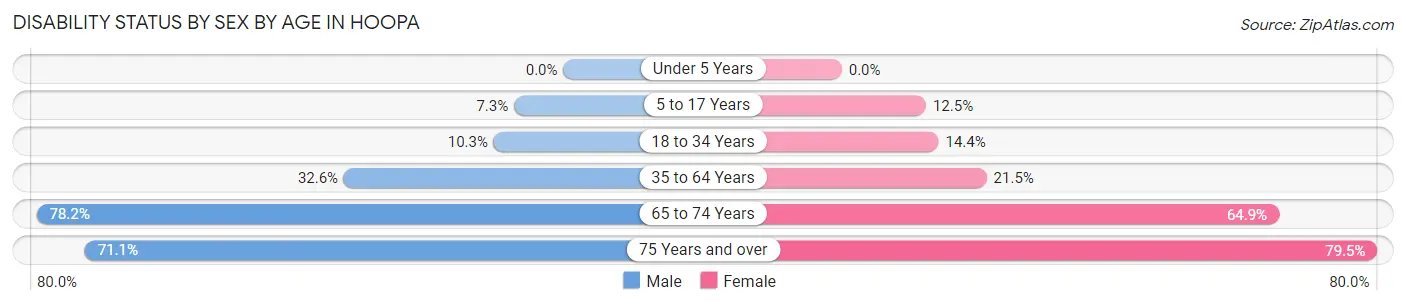
| Age Bracket | Male | Female |
| Under 5 Years | 0 (0.0%) | 0 (0.0%) |
| 5 to 17 Years | 18 (7.3%) | 32 (12.5%) |
| 18 to 34 Years | 28 (10.3%) | 49 (14.4%) |
| 35 to 64 Years | 101 (32.6%) | 94 (21.5%) |
| 65 to 74 Years | 115 (78.2%) | 74 (64.9%) |
| 75 Years and over | 27 (71.1%) | 132 (79.5%) |
Disability Class by Sex by Age in Hoopa
Disability Class: Hearing Difficulty
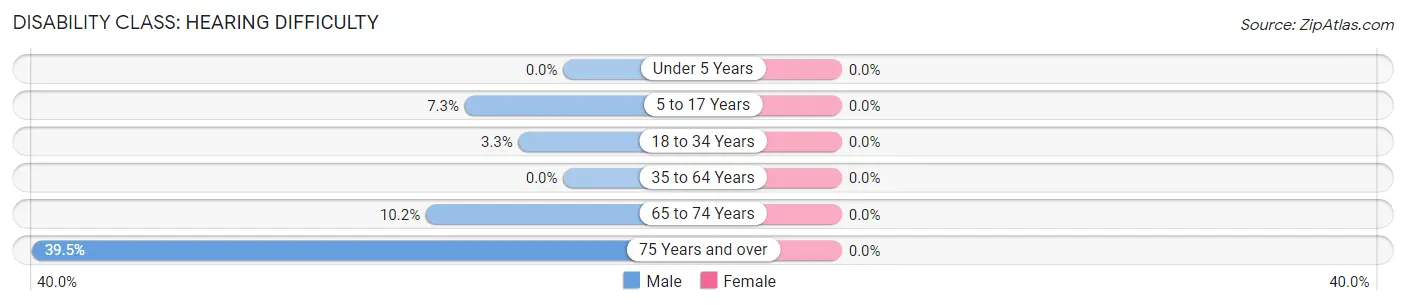
| Age Bracket | Male | Female |
| Under 5 Years | 0 (0.0%) | 0 (0.0%) |
| 5 to 17 Years | 18 (7.3%) | 0 (0.0%) |
| 18 to 34 Years | 9 (3.3%) | 0 (0.0%) |
| 35 to 64 Years | 0 (0.0%) | 0 (0.0%) |
| 65 to 74 Years | 15 (10.2%) | 0 (0.0%) |
| 75 Years and over | 15 (39.5%) | 0 (0.0%) |
Disability Class: Vision Difficulty
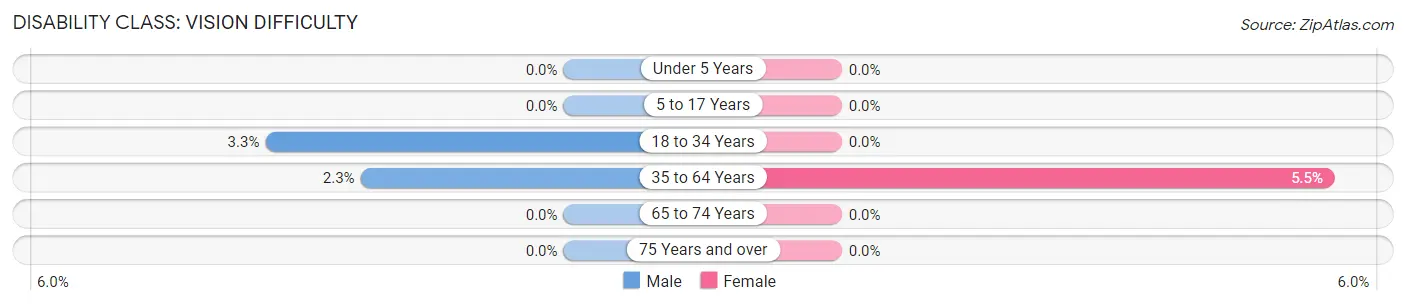
| Age Bracket | Male | Female |
| Under 5 Years | 0 (0.0%) | 0 (0.0%) |
| 5 to 17 Years | 0 (0.0%) | 0 (0.0%) |
| 18 to 34 Years | 9 (3.3%) | 0 (0.0%) |
| 35 to 64 Years | 7 (2.3%) | 24 (5.5%) |
| 65 to 74 Years | 0 (0.0%) | 0 (0.0%) |
| 75 Years and over | 0 (0.0%) | 0 (0.0%) |
Disability Class: Cognitive Difficulty
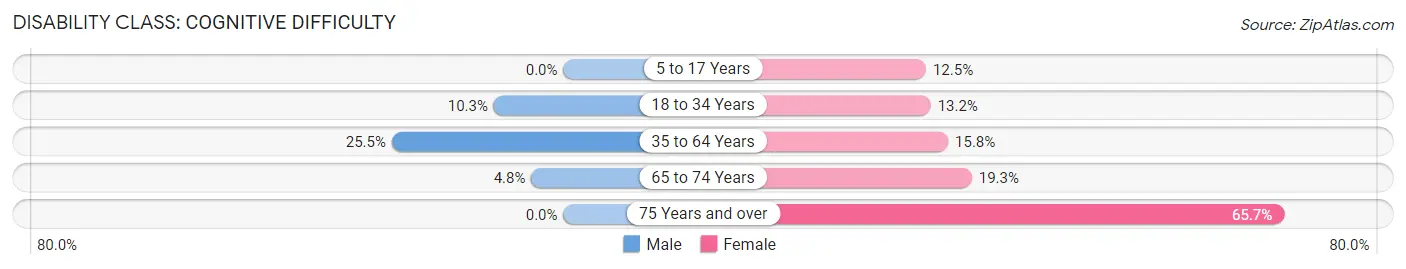
| Age Bracket | Male | Female |
| 5 to 17 Years | 0 (0.0%) | 32 (12.5%) |
| 18 to 34 Years | 28 (10.3%) | 45 (13.2%) |
| 35 to 64 Years | 79 (25.5%) | 69 (15.8%) |
| 65 to 74 Years | 7 (4.8%) | 22 (19.3%) |
| 75 Years and over | 0 (0.0%) | 109 (65.7%) |
Disability Class: Ambulatory Difficulty
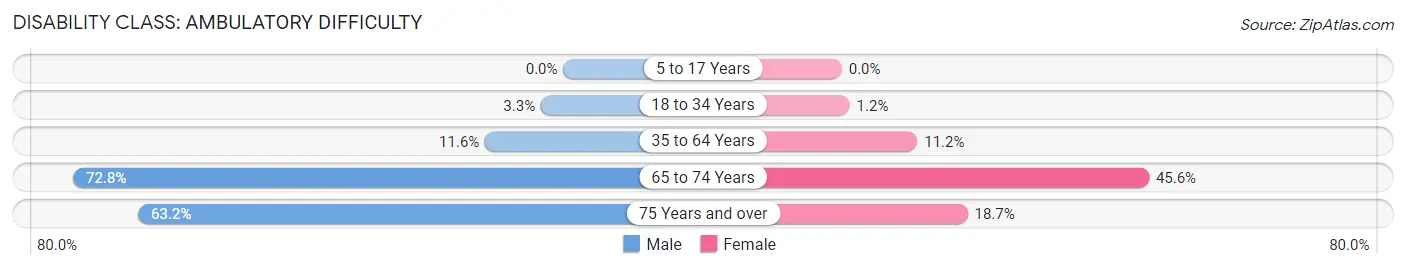
| Age Bracket | Male | Female |
| 5 to 17 Years | 0 (0.0%) | 0 (0.0%) |
| 18 to 34 Years | 9 (3.3%) | 4 (1.2%) |
| 35 to 64 Years | 36 (11.6%) | 49 (11.2%) |
| 65 to 74 Years | 107 (72.8%) | 52 (45.6%) |
| 75 Years and over | 24 (63.2%) | 31 (18.7%) |
Disability Class: Self-Care Difficulty
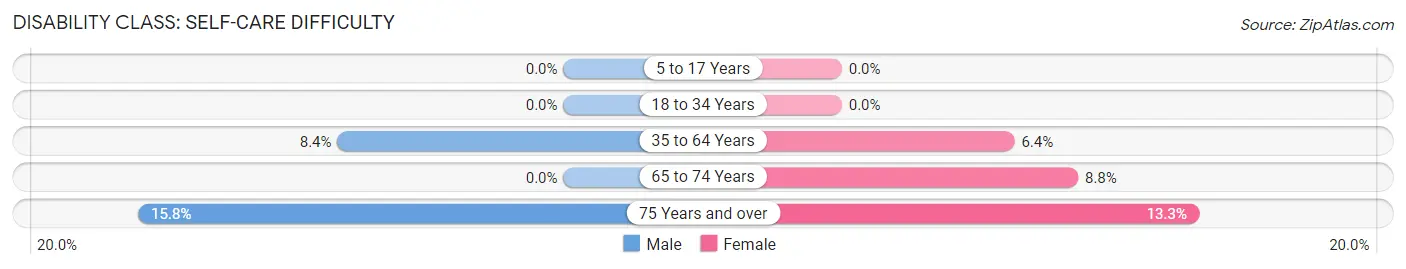
| Age Bracket | Male | Female |
| 5 to 17 Years | 0 (0.0%) | 0 (0.0%) |
| 18 to 34 Years | 0 (0.0%) | 0 (0.0%) |
| 35 to 64 Years | 26 (8.4%) | 28 (6.4%) |
| 65 to 74 Years | 0 (0.0%) | 10 (8.8%) |
| 75 Years and over | 6 (15.8%) | 22 (13.3%) |
Technology Access in Hoopa
Computing Device Access in Hoopa
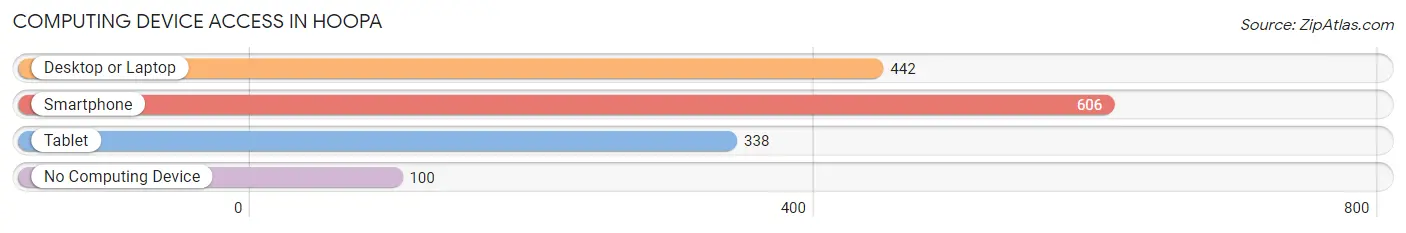
| Device Type | # Households | % Households |
| Desktop or Laptop | 442 | 60.6% |
| Smartphone | 606 | 83.0% |
| Tablet | 338 | 46.3% |
| No Computing Device | 100 | 13.7% |
| Total | 730 | 100.0% |
Internet Access in Hoopa
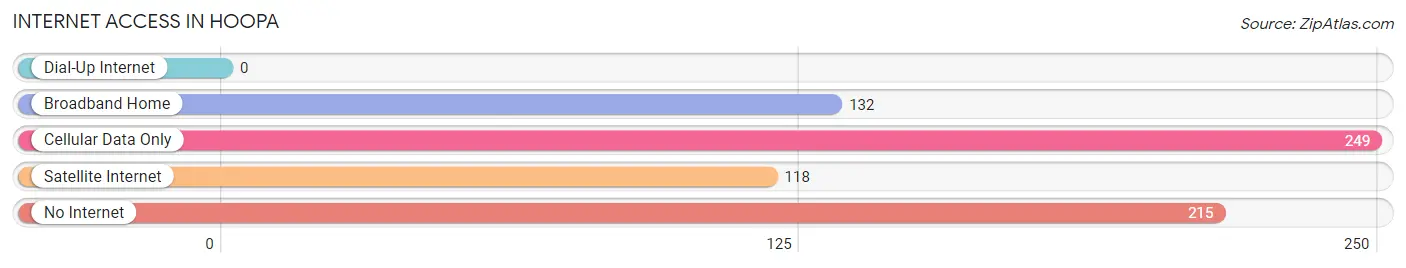
| Internet Type | # Households | % Households |
| Dial-Up Internet | 0 | 0.0% |
| Broadband Home | 132 | 18.1% |
| Cellular Data Only | 249 | 34.1% |
| Satellite Internet | 118 | 16.2% |
| No Internet | 215 | 29.4% |
| Total | 730 | 100.0% |
Hoopa Summary
Hoopa is a small unincorporated community located in Humboldt County, California. It is situated along the Trinity River, approximately 20 miles south of the Oregon border and about 30 miles east of the Pacific Ocean. The population of Hoopa was 2,631 in the 2010 census, making it the largest Native American community in California.
History
Hoopa is the ancestral home of the Hoopa Valley Tribe, a federally recognized tribe of the Yurok and Hupa people. The Hoopa Valley Tribe has lived in the area for thousands of years, and the name “Hoopa” is derived from the Hupa word for “the place where the wild grapes grow.” The tribe has a long and rich history of fishing, hunting, and gathering, and the area is still home to a variety of wildlife, including bald eagles, black bears, and salmon.
In 1864, the Hoopa Valley Reservation was established by the United States government, and the Hoopa Valley Tribe was officially recognized as a sovereign nation. The reservation is located on the banks of the Trinity River and encompasses approximately 48,000 acres of land. The reservation is home to the Hoopa Valley Tribal School, which serves students from kindergarten through 12th grade.
Geography
Hoopa is located in the Hoopa Valley, which is part of the Klamath Mountains ecoregion. The valley is surrounded by steep mountains and is home to a variety of wildlife, including black bears, bald eagles, and salmon. The climate in Hoopa is mild and temperate, with warm summers and cool winters.
The Trinity River runs through the Hoopa Valley and is a major source of water for the area. The river is also home to a variety of fish, including Chinook salmon, steelhead trout, and lamprey. The river is also a popular destination for recreational activities, such as fishing, rafting, and kayaking.
Economy
The economy of Hoopa is largely based on natural resources, such as timber, fishing, and hunting. The Hoopa Valley Tribe operates a number of businesses, including a casino, a gas station, and a convenience store. The tribe also operates a number of programs to promote economic development, such as a business incubator and a loan program.
The Hoopa Valley Tribe also operates a number of programs to promote tourism in the area, such as the Hoopa Valley Cultural Center and the Hoopa Valley Tribal Museum. The tribe also operates a number of recreational facilities, such as a golf course, a swimming pool, and a campground.
Demographics
As of the 2010 census, the population of Hoopa was 2,631. The median age was 33.7 years, and the median household income was $30,938. The majority of the population (90.2%) identified as Native American, and the majority of the population (90.2%) spoke English as their primary language.
Conclusion
Hoopa is a small unincorporated community located in Humboldt County, California. It is the ancestral home of the Hoopa Valley Tribe, a federally recognized tribe of the Yurok and Hupa people. The economy of Hoopa is largely based on natural resources, such as timber, fishing, and hunting. As of the 2010 census, the population of Hoopa was 2,631, and the majority of the population (90.2%) identified as Native American. The Hoopa Valley Tribe operates a number of businesses and programs to promote economic development and tourism in the area.
Common Questions
What is Per Capita Income in Hoopa?
Per Capita income in Hoopa is $21,058.
What is the Median Family Income in Hoopa?
Median Family Income in Hoopa is $77,695.
What is the Median Household income in Hoopa?
Median Household Income in Hoopa is $55,000.
What is Income or Wage Gap in Hoopa?
Income or Wage Gap in Hoopa is 2.4%.
Women in Hoopa earn 97.6 cents for every dollar earned by a man.
What is Family Income Deficit in Hoopa?
Family Income Deficit in Hoopa is $12,873.
Families that are below poverty line in Hoopa earn $12,873 less on average than the poverty threshold level.
What is Inequality or Gini Index in Hoopa?
Inequality or Gini Index in Hoopa is 0.45.
What is the Total Population of Hoopa?
Total Population of Hoopa is 2,489.
What is the Total Male Population of Hoopa?
Total Male Population of Hoopa is 1,083.
What is the Total Female Population of Hoopa?
Total Female Population of Hoopa is 1,406.
What is the Ratio of Males per 100 Females in Hoopa?
There are 77.03 Males per 100 Females in Hoopa.
What is the Ratio of Females per 100 Males in Hoopa?
There are 129.82 Females per 100 Males in Hoopa.
What is the Median Population Age in Hoopa?
Median Population Age in Hoopa is 33.3 Years.
What is the Average Family Size in Hoopa
Average Family Size in Hoopa is 3.7 People.
What is the Average Household Size in Hoopa
Average Household Size in Hoopa is 3.4 People.
How Large is the Labor Force in Hoopa?
There are 884 People in the Labor Forcein in Hoopa.
What is the Percentage of People in the Labor Force in Hoopa?
46.5% of People are in the Labor Force in Hoopa.
What is the Unemployment Rate in Hoopa?
Unemployment Rate in Hoopa is 17.9%.