Cities with the Lowest Poverty Level Among Seniors Over the Age of 75 in Alabama
RELATED REPORTS & OPTIONS
Lowest Poverty | Seniors 75+
Alabama
Compare Cities
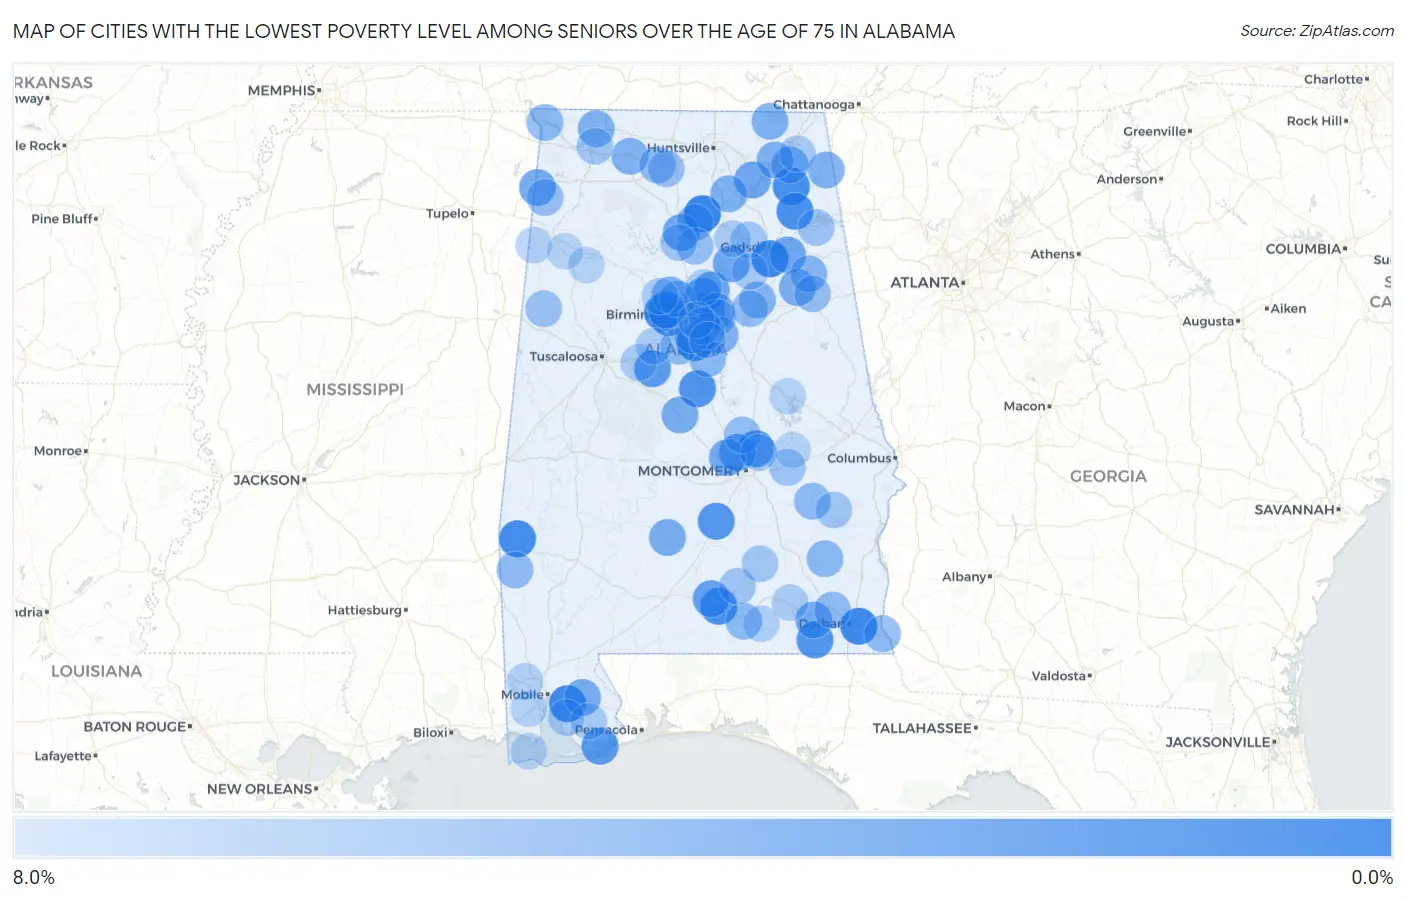
Map of Cities with the Lowest Poverty Level Among Seniors Over the Age of 75 in Alabama
8.0%
0.0%
Cities with the Lowest Poverty Level Among Seniors Over the Age of 75 in Alabama
| City | Senior Poverty | vs State | vs National | |
| 1. | Fairview | 1.1% | 11.9%(-10.7)#1 | 11.1%(-9.93)#171 |
| 2. | Pelham | 1.4% | 11.9%(-10.4)#2 | 11.1%(-9.64)#265 |
| 3. | Cowarts | 1.5% | 11.9%(-10.4)#3 | 11.1%(-9.60)#283 |
| 4. | Daphne | 1.5% | 11.9%(-10.4)#4 | 11.1%(-9.57)#295 |
| 5. | Rainbow City | 1.5% | 11.9%(-10.3)#5 | 11.1%(-9.52)#314 |
| 6. | Sylvan Springs | 1.6% | 11.9%(-10.3)#6 | 11.1%(-9.45)#343 |
| 7. | Gilbertown | 1.7% | 11.9%(-10.1)#7 | 11.1%(-9.34)#395 |
| 8. | Fyffe | 1.7% | 11.9%(-10.1)#8 | 11.1%(-9.32)#401 |
| 9. | River Falls | 1.9% | 11.9%(-9.98)#9 | 11.1%(-9.18)#469 |
| 10. | Collinsville | 2.0% | 11.9%(-9.89)#10 | 11.1%(-9.09)#508 |
| 11. | Pleasant Grove | 2.0% | 11.9%(-9.85)#11 | 11.1%(-9.05)#531 |
| 12. | Maytown | 2.0% | 11.9%(-9.83)#12 | 11.1%(-9.03)#554 |
| 13. | Jemison | 2.2% | 11.9%(-9.70)#13 | 11.1%(-8.90)#627 |
| 14. | Hartford | 2.4% | 11.9%(-9.50)#14 | 11.1%(-8.70)#750 |
| 15. | Wetumpka | 2.5% | 11.9%(-9.38)#15 | 11.1%(-8.58)#842 |
| 16. | Fort Deposit | 2.5% | 11.9%(-9.32)#16 | 11.1%(-8.52)#886 |
| 17. | Irondale | 2.6% | 11.9%(-9.24)#17 | 11.1%(-8.44)#946 |
| 18. | Orange Beach | 2.7% | 11.9%(-9.15)#18 | 11.1%(-8.35)#1,017 |
| 19. | West Blocton | 2.8% | 11.9%(-9.07)#19 | 11.1%(-8.27)#1,079 |
| 20. | Millbrook | 3.0% | 11.9%(-8.83)#20 | 11.1%(-8.03)#1,275 |
| 21. | Red Level | 3.2% | 11.9%(-8.64)#21 | 11.1%(-7.84)#1,438 |
| 22. | Center Point | 3.3% | 11.9%(-8.57)#22 | 11.1%(-7.77)#1,499 |
| 23. | Good Hope | 3.5% | 11.9%(-8.35)#23 | 11.1%(-7.55)#1,690 |
| 24. | Clay | 3.5% | 11.9%(-8.32)#24 | 11.1%(-7.52)#1,709 |
| 25. | Highland Lake | 3.6% | 11.9%(-8.29)#25 | 11.1%(-7.50)#1,754 |
| 26. | Red Bay | 3.7% | 11.9%(-8.12)#26 | 11.1%(-7.32)#1,911 |
| 27. | Glencoe | 3.8% | 11.9%(-8.08)#27 | 11.1%(-7.28)#1,960 |
| 28. | Grant | 3.8% | 11.9%(-8.07)#28 | 11.1%(-7.27)#1,971 |
| 29. | Prattville | 4.0% | 11.9%(-7.91)#29 | 11.1%(-7.11)#2,132 |
| 30. | Clayhatchee | 4.0% | 11.9%(-7.87)#30 | 11.1%(-7.07)#2,186 |
| 31. | Leeds | 4.0% | 11.9%(-7.83)#31 | 11.1%(-7.03)#2,210 |
| 32. | Loxley | 4.1% | 11.9%(-7.78)#32 | 11.1%(-6.99)#2,253 |
| 33. | Saks | 4.1% | 11.9%(-7.74)#33 | 11.1%(-6.94)#2,300 |
| 34. | Maplesville | 4.2% | 11.9%(-7.70)#34 | 11.1%(-6.90)#2,340 |
| 35. | Pine Apple | 4.2% | 11.9%(-7.70)#35 | 11.1%(-6.90)#2,362 |
| 36. | Dutton | 4.3% | 11.9%(-7.52)#36 | 11.1%(-6.72)#2,533 |
| 37. | Union Grove | 4.3% | 11.9%(-7.52)#37 | 11.1%(-6.72)#2,549 |
| 38. | Graysville | 4.4% | 11.9%(-7.46)#38 | 11.1%(-6.66)#2,590 |
| 39. | Westover | 4.4% | 11.9%(-7.45)#39 | 11.1%(-6.66)#2,594 |
| 40. | St Florian | 4.4% | 11.9%(-7.44)#40 | 11.1%(-6.64)#2,616 |
| 41. | Scottsboro | 4.4% | 11.9%(-7.44)#41 | 11.1%(-6.64)#2,618 |
| 42. | Hytop | 4.4% | 11.9%(-7.42)#42 | 11.1%(-6.62)#2,634 |
| 43. | Mentone | 4.5% | 11.9%(-7.39)#43 | 11.1%(-6.59)#2,664 |
| 44. | Courtland | 4.5% | 11.9%(-7.32)#44 | 11.1%(-6.52)#2,735 |
| 45. | Riverside | 4.7% | 11.9%(-7.20)#45 | 11.1%(-6.40)#2,872 |
| 46. | Jacksonville | 4.8% | 11.9%(-7.05)#46 | 11.1%(-6.25)#3,018 |
| 47. | Brookside | 4.8% | 11.9%(-7.03)#47 | 11.1%(-6.23)#3,035 |
| 48. | Columbiana | 4.9% | 11.9%(-6.96)#48 | 11.1%(-6.16)#3,097 |
| 49. | Clio | 4.9% | 11.9%(-6.95)#49 | 11.1%(-6.15)#3,110 |
| 50. | Berlin | 5.0% | 11.9%(-6.87)#50 | 11.1%(-6.07)#3,205 |
| 51. | Horn Hill | 5.0% | 11.9%(-6.87)#51 | 11.1%(-6.07)#3,222 |
| 52. | Waterloo | 5.0% | 11.9%(-6.87)#52 | 11.1%(-6.07)#3,230 |
| 53. | Mccalla | 5.0% | 11.9%(-6.85)#53 | 11.1%(-6.05)#3,236 |
| 54. | Union Springs | 5.2% | 11.9%(-6.71)#54 | 11.1%(-5.91)#3,362 |
| 55. | Millry | 5.2% | 11.9%(-6.67)#55 | 11.1%(-5.87)#3,399 |
| 56. | Trinity | 5.3% | 11.9%(-6.60)#56 | 11.1%(-5.80)#3,449 |
| 57. | Pinckard | 5.3% | 11.9%(-6.60)#57 | 11.1%(-5.80)#3,471 |
| 58. | Gordon | 5.3% | 11.9%(-6.60)#58 | 11.1%(-5.80)#3,491 |
| 59. | Helena | 5.3% | 11.9%(-6.54)#59 | 11.1%(-5.74)#3,548 |
| 60. | Dunnavant | 5.3% | 11.9%(-6.53)#60 | 11.1%(-5.73)#3,554 |
| 61. | Pell City | 5.5% | 11.9%(-6.39)#61 | 11.1%(-5.59)#3,667 |
| 62. | Holtville | 5.5% | 11.9%(-6.39)#62 | 11.1%(-5.59)#3,671 |
| 63. | Garden City | 5.5% | 11.9%(-6.39)#63 | 11.1%(-5.59)#3,675 |
| 64. | Choccolocco | 5.5% | 11.9%(-6.33)#64 | 11.1%(-5.53)#3,721 |
| 65. | Vina | 5.6% | 11.9%(-6.31)#65 | 11.1%(-5.51)#3,784 |
| 66. | Highland Lakes | 5.6% | 11.9%(-6.23)#66 | 11.1%(-5.43)#3,856 |
| 67. | Decatur | 5.6% | 11.9%(-6.22)#67 | 11.1%(-5.42)#3,870 |
| 68. | Millport | 5.7% | 11.9%(-6.21)#68 | 11.1%(-5.41)#3,885 |
| 69. | Shorter | 5.8% | 11.9%(-6.10)#69 | 11.1%(-5.30)#4,003 |
| 70. | Dodge City | 5.8% | 11.9%(-6.07)#70 | 11.1%(-5.27)#4,025 |
| 71. | Dozier | 5.9% | 11.9%(-5.98)#71 | 11.1%(-5.18)#4,125 |
| 72. | Centre | 5.9% | 11.9%(-5.97)#72 | 11.1%(-5.18)#4,154 |
| 73. | Hoover | 5.9% | 11.9%(-5.93)#73 | 11.1%(-5.13)#4,189 |
| 74. | Brook Highland | 6.0% | 11.9%(-5.91)#74 | 11.1%(-5.11)#4,208 |
| 75. | Muscle Shoals | 6.0% | 11.9%(-5.90)#75 | 11.1%(-5.10)#4,212 |
| 76. | Midway | 6.0% | 11.9%(-5.87)#76 | 11.1%(-5.07)#4,265 |
| 77. | Walnut Grove | 6.0% | 11.9%(-5.83)#77 | 11.1%(-5.03)#4,293 |
| 78. | Glenwood | 6.1% | 11.9%(-5.81)#78 | 11.1%(-5.01)#4,337 |
| 79. | Mountain Brook | 6.1% | 11.9%(-5.78)#79 | 11.1%(-4.98)#4,356 |
| 80. | Blue Ridge | 6.2% | 11.9%(-5.68)#80 | 11.1%(-4.88)#4,453 |
| 81. | Ashville | 6.2% | 11.9%(-5.62)#81 | 11.1%(-4.82)#4,508 |
| 82. | Chelsea | 6.4% | 11.9%(-5.51)#82 | 11.1%(-4.71)#4,665 |
| 83. | Summerdale | 6.4% | 11.9%(-5.50)#83 | 11.1%(-4.70)#4,667 |
| 84. | Vance | 6.4% | 11.9%(-5.46)#84 | 11.1%(-4.66)#4,712 |
| 85. | Pisgah | 6.4% | 11.9%(-5.43)#85 | 11.1%(-4.63)#4,737 |
| 86. | Fairhope | 6.5% | 11.9%(-5.41)#86 | 11.1%(-4.61)#4,780 |
| 87. | Pinson | 6.5% | 11.9%(-5.41)#87 | 11.1%(-4.61)#4,781 |
| 88. | New Brockton | 6.5% | 11.9%(-5.38)#88 | 11.1%(-4.59)#4,806 |
| 89. | Lake View | 6.5% | 11.9%(-5.34)#89 | 11.1%(-4.55)#4,834 |
| 90. | Susan Moore | 6.5% | 11.9%(-5.34)#90 | 11.1%(-4.55)#4,837 |
| 91. | West Jefferson | 6.5% | 11.9%(-5.34)#91 | 11.1%(-4.55)#4,845 |
| 92. | Kinston | 6.7% | 11.9%(-5.20)#92 | 11.1%(-4.40)#4,970 |
| 93. | Detroit | 6.7% | 11.9%(-5.20)#93 | 11.1%(-4.40)#5,002 |
| 94. | Semmes | 6.8% | 11.9%(-5.09)#94 | 11.1%(-4.29)#5,099 |
| 95. | Tillmans Corner | 6.9% | 11.9%(-4.97)#95 | 11.1%(-4.17)#5,198 |
| 96. | Glen Allen | 6.9% | 11.9%(-4.97)#96 | 11.1%(-4.17)#5,234 |
| 97. | Alexander City | 6.9% | 11.9%(-4.96)#97 | 11.1%(-4.16)#5,247 |
| 98. | Dauphin Island | 7.0% | 11.9%(-4.91)#98 | 11.1%(-4.11)#5,288 |
| 99. | Tallassee | 7.0% | 11.9%(-4.89)#99 | 11.1%(-4.09)#5,303 |
| 100. | Guin | 7.0% | 11.9%(-4.89)#100 | 11.1%(-4.09)#5,305 |
Common Questions
What are the Top 10 Cities with the Lowest Poverty Level Among Seniors Over the Age of 75 in Alabama?
Top 10 Cities with the Lowest Poverty Level Among Seniors Over the Age of 75 in Alabama are:
#1
1.1%
#2
1.4%
#3
1.5%
#4
1.5%
#5
1.5%
#6
1.6%
#7
1.7%
#8
1.7%
#9
1.9%
#10
2.0%
What city has the Lowest Poverty Level Among Seniors Over the Age of 75 in Alabama?
Fairview has the Lowest Poverty Level Among Seniors Over the Age of 75 in Alabama with 1.1%.
What is the Poverty Level Among Seniors Over the Age of 75 in the State of Alabama?
Poverty Level Among Seniors Over the Age of 75 in Alabama is 11.9%.
What is the Poverty Level Among Seniors Over the Age of 75 in the United States?
Poverty Level Among Seniors Over the Age of 75 in the United States is 11.1%.